Benthic oxygen fluxes in a coastal upwelling system (Ria de Vigo, NW Iberia) measured by aquatic eddy covariance
←
→
Page content transcription
If your browser does not render page correctly, please read the page content below
Vol. 670: 15–31, 2021                 MARINE ECOLOGY PROGRESS SERIES
                                                                                                     Published July 22
https://doi.org/10.3354/meps13770                  Mar Ecol Prog Ser

                                                                                                    OPEN
                                                                                                    ACCESS

             Benthic oxygen fluxes in a coastal
          upwelling system (Ria de Vigo, NW Iberia)
            measured by aquatic eddy covariance
    M. Amo-Seco1, 2,*, C. G. Castro1, N. Villacieros-Robineau1, F. Alonso-Pérez1, 5,
                             R. Graña3, G. Rosón4, P. Berg2
                           1
                            Instituto de Investigacións Mariñas (IIM), CSIC, Vigo 36208, Spain
            2
            Department of Environmental Sciences, University of Virginia, Charlottesville, Virginia 22904, USA
                                 3
                                  Centro Oceanográfico de Gijón, IEO, Gijón 33212, Spain
                     4
                      Departamento de Física Aplicada, Universidade de Vigo, Vigo 36310, Spain
                         5
                             Present address: Centro Oceanográfico de Vigo, IEO, Vigo 36390, Spain

      ABSTRACT: Organic carbon mineralization and nutrient cycling in benthic environments are
      critically important for their biogeochemical functioning, but are poorly understood in coastal up-
      welling systems. The main objective of this study was to determine benthic oxygen fluxes in a
      muddy sediment in the Ria de Vigo (NW Iberian coastal upwelling), by applying the aquatic eddy
      covariance (AEC) technique during 2 campaigns in different seasons (June and October 2017).
      The main drivers of benthic fluxes were studied and compared among days in each season and
      between seasons. The 2 campaigns were characterized by an upwelling-relaxation period
      followed by a downwelling event, the last of which was due to the extratropical cyclone Ophelia
      in October. The mean (± SD) seasonal benthic oxygen fluxes were not significantly different for
      the 2 campaigns despite differences in hydrodynamic and biogeochemical conditions (June: −20.9
      ± 7.1 mmol m−2 d−1 vs. October: −26.5 ± 3.1 mmol m−2 d−1). Benthic fluxes were controlled by dif-
      ferent drivers depending on the season. June was characterized by sinking labile organic mate-
      rial, which enhanced benthic fluxes in the downwelling event, whereas October had a signifi-
      cantly higher bottom velocity that stimulated the benthic fluxes. Finally, a comparison with a large
      benthic chamber (0.50 m2) was made during October. Despite methodological differences
      between AEC and chamber measurements, concurrent fluxes agreed within an acceptable mar-
      gin (AEC:benthic chamber ratio = 0.78 ± 0.13; mean ± SD). Bottle incubations of water sampled
      from the chamber interior indicated that mineralization could explain this difference. These
      results show the importance of using non-invasive techniques such as AEC to resolve benthic flux
      dynamics.

      KEY WORDS: Benthic fluxes · Aquatic eddy covariance · Benthic chamber · Dissolved oxygen ·
      Muddy sediments · Upwelling system · Rias

                 1. INTRODUCTION                                 areas (Wollast 1998), and they support approximately
                                                                 50% of the total benthic carbon mineralization (Mid-
  Coastal regions are active biogeochemical areas                delburg et al. 1997). Primary production generates a
which play an important role in the global carbon                large amount of labile organic matter in the coastal
cycle. Although coastal regions occupy only 7% of                margins, which, to a large extent, is deposited on the
the total oceanic surface, between 20 and 50% of the             sediment surface. This particulate matter can sub-
total oceanic primary production occurs in these                 sequently be subjected to resuspension, advection,
                                                                 © The authors 2021. Open Access under Creative Commons by
*Corresponding author: amoseco@iim.csic.es                       Attribution Licence. Use, distribution and reproduction are un-
                                                                 restricted. Authors and original publication must be credited.
                                                                 Publisher: Inter-Research · www.int-res.com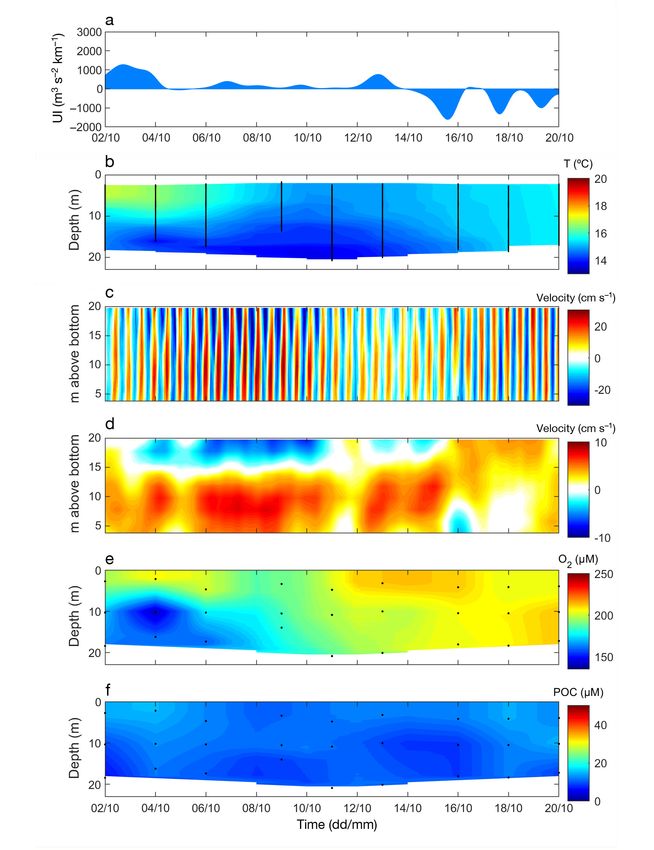
16                                       Mar Ecol Prog Ser 670: 15–31, 2021

or biogeochemical transformations, which promote            in permeable sediments, whereas traditional benthic
the benthic mineralization of organic carbon and            chambers cannot mimic the natural porewater ex-
benthic regeneration of nutrients (Wollast 1998).           change produced by horizontal pressure gradients
Conversely, these recycled nutrients support the            well (Cook et al. 2007, Berg & Huettel 2008). In fact,
large primary production of coastal areas (Grenz et         most of the previous coastal studies relying on the
al. 2010). Oxygen is the most energetically favour-         AEC technique have been carried out in permeable
able oxidant to react in the direct mineralization of       sediments (Huettel et al. 2014 and references there-
organic carbon and also to re-oxidize reduced prod-         in, Attard et al. 2015, Reimers et al. 2016). Only a
ucts of anaerobic mineralization. Thus, benthic oxy-        small number of AEC measurements have been car-
gen uptake is the most common proxy used to quan-           ried out in muddy coastal sediments (Berg et al. 2003,
tify the total mineralization rate of organic carbon on     Glud et al. 2010, 2016, Holtappels et al. 2013, Attard
the seafloor, because it is relatively easy to measure      et al. 2016).
compared to dissolved inorganic carbon fluxes (Froe-          Our study was conducted in the Ria de Vigo
lich et al. 1979, Glud 2008). Among coastal margins,        (Fig. 1), located in the NW Iberian coastal upwelling
coastal upwelling regions constitute the most biolog-       system. This area is characterized by high prima-
ically productive areas due to the upwelling of cold        ry production during the upwelling season when
and nutrient-rich subsurface waters. Additionally,          nutrient-rich subsurface waters reach the sea surface
these regions are highly dynamic and are character-         and trigger substantial phytoplankton blooms (up to
ized by the occurrence of upwelling/downwelling             5 mg chlorophyll a m−3, Figueiras et al. 2002). This
events, which potentially influence benthic reminer-        enables the Rias Baixas, including the Ria de Vigo
alization. Consequently, in these regions, it is partic-    (Fig. 1), to support the highest mussel production in
ularly important to measure benthic oxygen fluxes           Europe (Figueiras et al. 2002). In spite of the impor-
over different time scales to integrate the most im-        tance of benthic mineralization as a source of nutri-
portant biogeochemical processes (Berelson et al.           ents to sustain primary production in coastal systems,
2013, Reimers et al. 2016).                                 there are few previous investigations of benthic flux-
   In the context of global climate change, global          es in the Rias Baixas (Alonso-Pérez & Castro 2014,
warming and coastal eutrophication are altering ben-        Alonso-Pérez et al. 2015). These studies estimated
thic dynamics of coastal zones. The synergistic effect      that benthic mineralization is responsible for 40% of
of these stressors increases benthic organic matter         the total inorganic nitrogen that supports primary
mineralization, which intensifies benthic fluxes, and       production in the Ria de Vigo. These studies were
consequently, decreases oxygen concentrations. The          carried out in muddy sediments, which are abundant
number of hypoxic coastal areas have increased 10-          in the ria, playing a key role in organic carbon miner-
fold since the first half of the 20th century and have      alization and in benthic nutrient regeneration (Vilas
triggered a severe loss of biodiversity (Diaz & Rosen-      et al. 2005, Alonso-Pérez & Castro 2014).
berg 2008). This increase supports the idea that the          Based on this background, the main objectives of
distribution and exchange of oxygen between the             this study were to (1) determine the magnitude of
water column and the sediment are critical parame-          benthic mineralization in a muddy area of the Ria de
ters to determine the biological status of the coastal      Vigo by implementing the AEC technique and (2)
environment (Glud 2008).                                    establish the principal forcing factors that control the
   The non-invasive aquatic eddy covariance (AEC)           benthic oxygen flux dynamics during the study peri-
technique (Berg et al. 2003) to determine benthic           ods. In order to do this, AEC benthic fluxes were
oxygen fluxes has several advantages over traditio-         measured during 2 campaigns, June 2017 (upwelling
nal methods. This technique calculates fluxes from          season) and October 2017 (transition from upwelling
measured turbulent fluctuations of the vertical velo-       to downwelling season), with different hydrodyna-
city and oxygen concentration (Berg et al. 2003).           mic and biogeochemical conditions.
AEC has a greater temporal resolution than tradi-
tional techniques like benthic chambers and inte-
grates benthic fluxes over a larger area (10−100 m2)                  2. MATERIALS AND METHODS
(Berg et al. 2007, Rheuban & Berg 2013). It is a non-
intrusive technique, as the benthic fluxes can be de-                          2.1. Study area
termined without disturbing natural hydrodynamic
conditions and without resuspending the benthic               The Ria de Vigo is 1 of the 4 Rias Baixas (temperate
surface. Moreover, AEC can measure benthic fluxes           coastal embayments, Evans & Prego 2003) located in
Amo-Seco et al.: Benthic oxygen fluxes in NW Iberia                                      17

Fig. 1. (a) Bathymetry of the Ria de Vigo, showing the inner ria (IR) sampling site and the different locations of the measuring
instruments (inset): Nortek Aquadopp Profiler (42° 15.870’ N, 8° 42.132’ W, blue dot), CTD (42° 16.186’ N, 8° 41.985’ W, green
triangle), benthic chamber (42° 16.226’ N, 8° 41.860’ W, black open circle), and aquatic eddy covariance (42° 16.217’ N,
       8° 41.849’ W, red cross). (b) Aquatic eddy covariance frame. Photo credit: Manuel E. Garci (UMIMAG, IIM-CSIC)

the NW Iberian coastal upwelling system (Fig. 1). It is             Shelf winds are the main factor controlling the sub-
characterized by a V-shaped transversal profile with              tidal circulation of the ria, although other important
a NE−SW central channel. It has a length of 21 km                 factors can modify this circulation, such as river dis-
from Cíes Islands to the Rande Strait. The inner part             charge (Piedracoba et al. 2005). Our sampling site
and central axis of the ria consist of predominately              was located in the main channel in the inner part of
fine-grained sediment, compared to coarser-grained                the ria (Fig. 1). This area is characterized by unvege-
sediment that dominates the outer part of the ria                 tated muddy sediments and is mainly exposed to
(Vilas et al. 2005).                                              NE−SW currents (Villacieros-Robineau et al. 2013).
   Hydrography and residual circulation in the ria are            The presence of molluscs, ophiuroids, and penna-
largely modulated by the seasonal pattern of shelf                tulacean anthozoans has been documented in the
winds caused by the meridional migration of the                   main channel of the Ria de Vigo (Aneiros et al. 2015).
Azores High. Responding to shelf winds, the Ria de
Vigo presents a classical estuarine circulation. Nor-
therly winds (prevalent from March/April to Septem-                                  2.2. Water sampling
ber/October) produce an offshore Ekman transport
of surface waters and the upwelling of cold and                      Data collection occurred during 2 different sea-
nutrient-rich subsurface waters. Conversely, souther-             sons: summer (12−30 June) and autumn (2−20 Octo-
ly winds generate an onshore Ekman transport trig-                ber) of 2017. Our sampling site (Fig. 1) was located
gering the accumulation of oceanic water onto the                 in the inner ria (42° 16.186’ N, 8° 41.985’ W) with an
coast and the downwelling of surface waters (Fraga                average depth of 21.8 m. During each campaign, the
1981, Nogueira et al. 1997, Figueiras et al. 2002).               site was sampled 3 times a week over a 3 wk period.
However, this seasonal cycle only explains about                  Data collection was carried out during research cam-
10% of the variability in the wind regime off north-              paigns on board the RV ‘Mytilus’.
west Spain, whereas more than 70% of the variabil-                   Vertical profiles of temperature, salinity, oxygen,
ity arises from periods < 30 d (Álvarez-Salgado et al.            and fluorescence were obtained with a CTD SBE 911
2003). In fact, the upwelling/downwelling seasons in              plus (Sea-Bird) coupled to a bottle rosette system
the region are described as a succession of upwelling/            with 12 Niskin bottles of 10 l capacity to obtain sea-
downwelling events lasting between 3 and 10 d (No-                water samples for oxygen, chlorophyll a (chl a), and
gueira et al. 1997, Gilcoto et al. 2017).                         particulate organic carbon (POC). Three or 4 water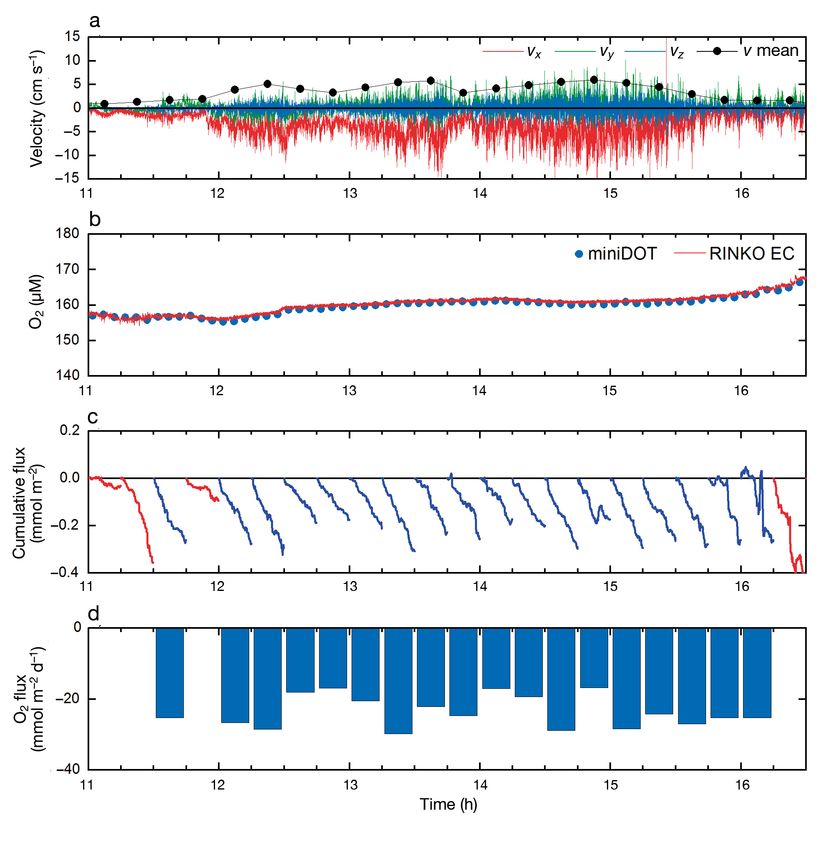
18                                         Mar Ecol Prog Ser 670: 15–31, 2021

column depths were sampled depending on the loca-             October campaigns (Table 1). The ADV measuring
tion of the subsurface chlorophyll maximum depth              volume was approximately 11 cm above the bottom. A
determined through CTD fluorescence. Dissolved                stable dual oxygen−temperature optode (miniDOT,
oxygen was determined by Winkler potentiometric               PME) was attached to the frame for independent oxy-
titration. The precision of the method was ± 0.32 μM.         gen concentration measurements every 5 min.
To measure chl a, 100 ml of seawater were filtered us-
ing GF/F filters with a pore size of 0.7 μm. After filtra-
tion, samples were frozen (−20°C) until pigment ex-                              2.5. Benthic chamber
traction in 90% acetone over 24 h in the dark at 4°C.
Chl a was analysed through fluorometric determina-               Benthic oxygen fluxes were also measured in a de-
tion using a Turner Designs fluorometer (Yentsch &            ployed benthic chamber to complement the AEC re-
Menzel 1963). The precision of the method was                 sults. Benthic chamber deployments were carried out
± 0.07 μg l−1. For POC analysis, 0.5 l seawater samples       at our field site (42° 16.226’ N, 8° 41.860’ W, Fig. 1) at
were filtered on pre-weighted and pre-combusted               an average depth of 21.1 m. The chamber was care-
(4 h, 450°C) GF/F filters of 0.7 μm pore size. Measure-       fully deployed for the same days as the AEC deploy-
ments of POC were determined with a Perkin Elmer              ments using a mooring line. The deployment opera-
2400 CNH analyser. The precision was ± 0.3 μM.                tion was checked by divers. Details of the benthic
                                                              chamber measurements are described by Ferrón et
                                                              al. (2008). In short, the benthic chamber has a large
           2.3. Residual and total current                    volume of 140 l and covers a large total sediment
                                                              area of 0.50 m2 (one of the largest benthic chambers
  Total current was obtained using an upward look-
ing 400 kHz Nortek Aquadopp Profiler moored at                Table 1. Aquatic eddy covariance (AEC) and benthic cham-
25.8 m depth at the study site (42° 15.870’ N, 8° 42.         ber (BC) deployment duration and oceanographic character-
132’ W, Fig. 1), between 8 June (20:00 h UTC) and             istics of each deployment. BC fluxes for the June campaign
13 July (09:45 h) 2017 for the June campaign and              were not considered due to technical difficulties during
                                                              the deployment. Temperature and salinity were obtained
between 25 September (20:00 h) and 30 October                 from the deepest depth recorder with a CTD profiler. Veloc-
(11:40 h) 2017 for the October campaign. Twelve               ity was measured with an acoustic Doppler velocimeter
cells (bin size 200 cm) were established through the                                 (mean ± SD)
water column. The residual current was extracted
using a low-pass symmetric digital filter (PL33) with           Date      Duration (h)     T (°C)   Salinity   Velocity
a cutoff period of 33 h (Flagg et al. 1976, Beardsley et                  AEC      BC                          (cm s−1)
al. 1985) to remove tidal frequencies. This analysis
                                                                June
was carried out in MATLAB.
                                                                12         8.3       −      14.1     35.69     3.1 ± 1.2
                                                                14         7.5       −      13.8     35.68     2.3 ± 1.2
                                                                16a         −        −      13.4     35.69         −
            2.4. Aquatic eddy covariance                        19         6.9       −      13.3     37.71     1.1 ± 0.5
                                                                21         7.5       −      13.5     35.66     1.5 ± 0.9
                                                                23         7.8       −      14.5     35.62     2.2 ± 0.7
   Benthic oxygen fluxes were measured with the AEC             26         7.0       −      14.8     35.61     3.5 ± 1.3
technique (Berg et al. 2003). Instrumentation for the           28         7.3       −      16.0     35.52     3.0 ± 1.5
AEC measurements was mounted on a light frame                   30         7.3       −      14.9     35.59     1.5 ± 0.7
(Berg & Huettel 2008) and consists of a Nortek Vector           October
acoustic Doppler velocimeter (ADV) and a dual sensor            02a         −       6.7     14.7     35.59         −
(RINKO EC, JFE Advantech), which allows high-fre-               04         7.3      6.2     13.9     35.62     3.4 ± 1.2
                                                                06         7.3      6.2     14.0     35.59     6.0 ± 2.9
quency (64 Hz) recording of temperature and oxygen              09         7.5      6.0     14.1     35.58     4.1 ± 1.4
concentrations at the same volume of water (Berg et al.         11b        9.6      8.5     13.7     35.60     0.7 ± 0.3
2016). The AEC system was deployed at our sampling              13b        8.0      6.7     14.0     35.59     1.0 ± 0.3
site (42°16.217’ N, 8°41.849’W, Fig. 1) at an average           16b        8.7      7.5     14.8     35.55     0.7 ± 0.5
                                                                18         7.0      6.1     15.4     35.48     3.0 ± 0.7
depth of 20.1 m. It was deployed by divers and care
                                                                20         6.9      6.0     15.6     35.44     5.0 ± 1.8
was taken to direct the ADV x-axis into the main cur-
                                                                a
rent direction. A total of 18 deployments, lasting be-          AEC instrument failure
                                                                b
                                                                Accurate fluxes could not be obtained because of the
tween 7 and 9 h to preferentially cover either tidal in-        low bottom velocity
flow or outflow, were carried out during the June and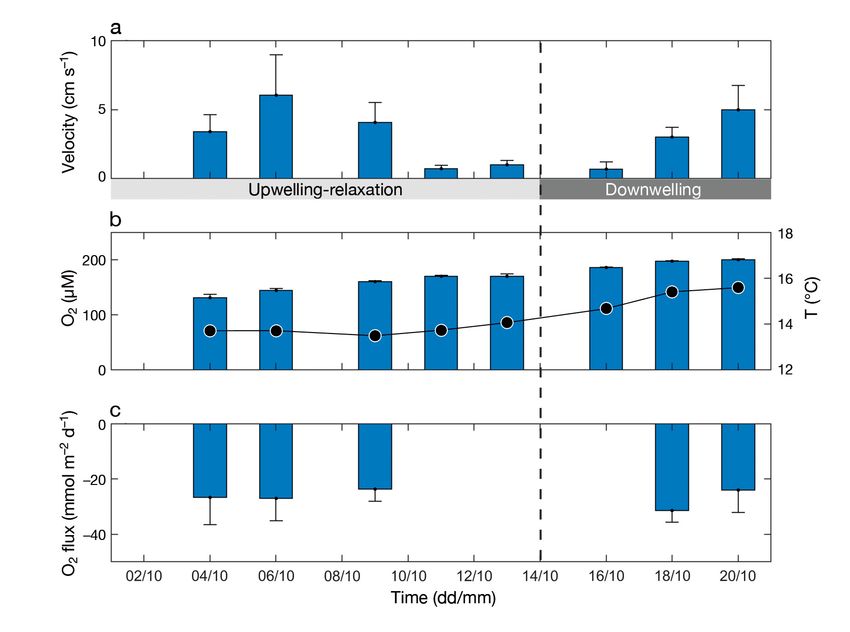
Amo-Seco et al.: Benthic oxygen fluxes in NW Iberia                                 19

available) (Ferrón et al. 2008). Water height inside           code 2248) anchored at a depth of 600 m. These
the chamber was 28 cm. A constant tangential veloc-            hourly data were provided by Puertos del Estado
ity of 2.5 cm s−1 was kept inside the chamber during           (www.puertos.es). Wind data measured by the Cape
the deployment. Inside the benthic chamber, there              Silleiro buoy at a 3 m height were converted to 10 m
are sensors to record continuous measurements of               height winds by applying a logarithmic profile with a
temperature (SBE 39, Sea-Bird), turbidity (Seapoint            roughness length of 0.002 m (Herrera et al. 2005).
Turbidity Meter), oxygen (SBE 43, Sea-Bird), and pH            Shelf wind data were filtered using a low-pass filter.
(SBE 18, Sea-Bird) with a sample interval of 30 s. The         The upwelling index (UI) was calculated from the
mean chamber incubation time in this study was                 shelf winds following Bakun (1973):
approximately 7 h (Table 1). Benthic chamber fluxes
                                                                                          ρair C D V Vy
were calculated from changes in oxygen concentra-                               UI = –                                 (1)
                                                                                               ρsw f
tions during the incubation period by an empirical
linear fitting. Uncertainties of fluxes were related to        where ρair is the average density of the air (1.22 kg
the fit of the data to a linear function and the propa-        m−3 at 15°C), CD is the empirical drag coefficient
gation of random errors (Ferrón et al. 2008).                  (1.3 × 10⁻³ according to Hidy 1972), f is the Coriolis
   On 2 occasions during the October campaign, 6 re-           factor at 42° latitude, and ρsw is the density of the sea
plicate samples of seawater from the benthic chamber           water (1025 kg m−3). |V | is the module and Vy is the
interior were manually collected in 125 ml Winkler             north component of the wind velocity at a height of
flasks by divers just before the beginning of the benthic      10 m. Positive values of UI correspond to upwelling
chamber incubation period. Three replicates were               conditions and negative values indicate downwelling.
fixed on board to measure oxygen concentration at the
starting point of the incubation, and the other 3
samples were incubated in situ during the benthic                               2.8. Data processing
chamber deployment time. Dissolved oxygen was
measured by a Winkler potentiometric titration as de-                     2.8.1. Aquatic eddy covariance
scribed in Section 2.2 for the water column. Oxygen
consumption in the water column inside the benthic               Fluxes of oxygen were extracted from the raw eddy
chamber was calculated as the oxygen concentration             covariance data following the multi-step AEC process
difference at the initial and final time of the incubation.    described below and shown in Fig. 2. First, oxygen
                                                               concentration was calibrated against the stable inde-
                                                               pendent dual oxygen−temperature sensor data
                2.6. Sediment samples                          (Fig. 2b). All 64 Hz data were then reduced to 8 Hz
                                                               data, which reduces noise while still providing suffi-
   Surface sediment samples were collected using a             cient resolution to contain the full frequency spectrum
Van Veen grab sampler on 3 different days (8 June,             carrying the flux signal (Berg et al. 2009). Benthic
13 July, and 30 November). A total of 3 replicate sam-         oxygen fluxes were then computed using the software
ples were obtained for each day. Granulometric                 package Eddy Flux version 3.2 (P. Berg unpubl.).
analysis was carried out using an LS 13 320 Beckman              Benthic oxygen fluxes were calculated using high-
Coulter system on non-homogenized sub-samples of               resolution data of vertical velocity (vz) and oxygen
                                                                                                                 –
roughly 1 g after removal of organic matter and car-           concentration. The mean benthic oxygen flux (F ) was
bonates by adding 10% H2O2 and 25% HCl, respec-                computed as the average over 15 min intervals of the
tively. Organic carbon content analysis was per-               vertical turbulent fluctuations in velocity (v ’z) times
formed on triplicates of 20 mg sub-samples after               the turbulent fluctuations in oxygen concentration
eliminating carbonates by repeatedly adding 10 μl of           (C ’) (Eq. 2; Berg et al. 2003). Turbulent fluctuating
25% HCl (Zúñiga et al. 2016). Organic carbon was               components, v ’z and C ’, were calculated as vz – v––z and
analysed using a Perkin Elmer 2400 CNH analyser as             C –C  ⁻⁻ applying a linear detrending where v––z and C   ⁻⁻
previously explained for POC water samples.                    are the least-square linear fits to the 8 Hz measured
                                                               data, vz and C, in each 15 min burst (Lee et al. 2004,
                                                               Berg et al. 2009):
                 2.7. Upwelling index
                                                                                         F = v ’z C ’                  (2)

 Shelf winds were obtained from the Seawatch                     Due to the response time of the fast-responding
buoy located in Cape Silleiro (42° 7.2’ N, 9° 25.8’ W,         oxygen sensor combined with its position down-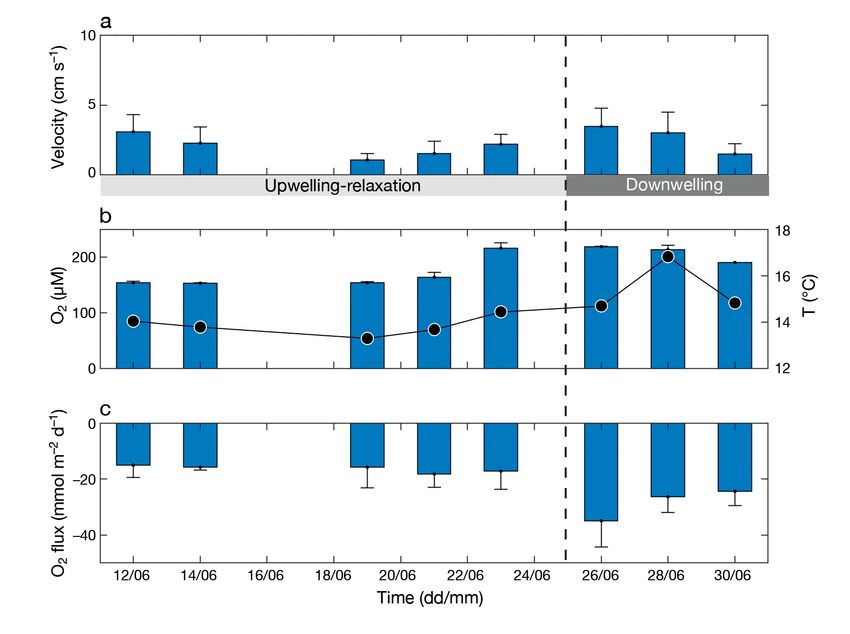
20                                           Mar Ecol Prog Ser 670: 15–31, 2021

Fig. 2. Examples of aquatic eddy covariance (AEC) measurements and processed time series for 9 October. (a) Bottom velocity
components: vx (red line), vy (green line), and vz (blue line) and mean current velocity (black line). (b) Bottom oxygen concen-
tration measured by miniDOT (blue dotted line) and RINKO EC (red line). (c) Cumulative fluxes. Red lines indicate fluxes
                             discarded in the data quality check. (d) Benthic oxygen 15 min fluxes

stream from the ADV’s measuring volume, a time                      A data quality check was performed to remove er-
shift correction was applied (Berg et al. 2016). Fol-             roneous measurements produced by collisions be-
lowing the standard practice for eddy covariance                  tween floating particles and the RINKO EC sensor.
data processing (Fan et al. 1990, Lorrai et al. 2010),            Cumulative fluxes (Fig. 2c) were calculated by a run-
this was done by repeating the outlined flux extrac-              ning sum of instantaneous vertical fluxes (v ’z C ’) over
tion procedure, while shifting the 8 Hz oxygen con-               time within each 15 min interval. In each burst, the
centration data back in time, 1/8 s at a time, until the          cumulative flux was verified for any anomalous fluc-
numerically largest flux was identified (Eddy Flux                tuation that was not due to natural turbulence
3.2, P. Berg unpubl.).                                            (Fig. 2c; Berg et al. 2013). Data recorded when the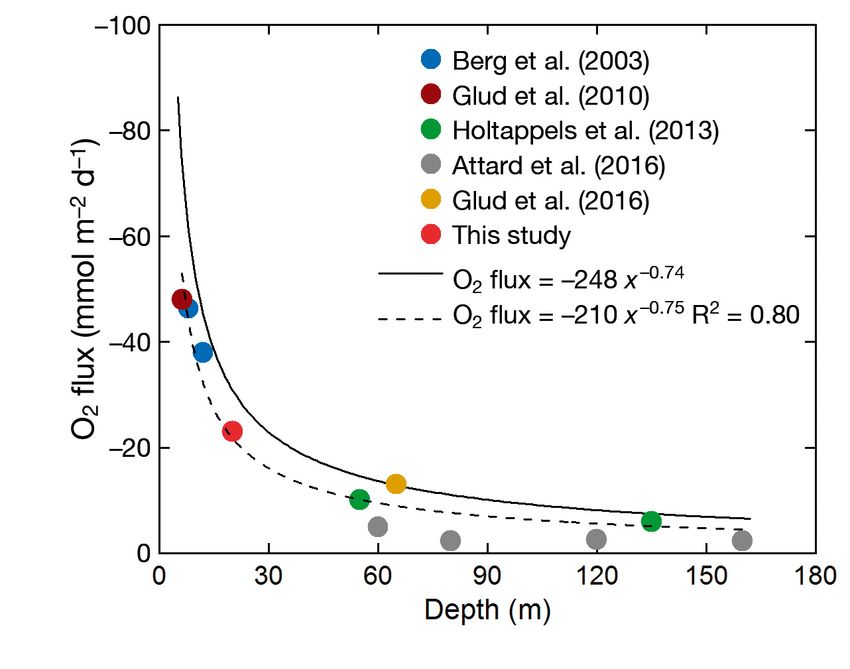
Amo-Seco et al.: Benthic oxygen fluxes in NW Iberia                           21

flow came from behind of the oxygen sensor were               ing the downwelling (26−29 June), residual current
excluded. Fluxes calculated for 15 min bursts with            changed to a negative circulation pattern with inflow
low mean velocity (
22 Mar Ecol Prog Ser 670: 15–31, 2021
Fig. 3. Hydrodynamic and biogeochemical conditions of the water column during the June campaign: (a) upwelling index (UI);
(b) temperature; (c) total and (d) residual current velocity (E−W component), where negative values (blue) represent outgoing
currents and positive values (red) represent incoming currents to Ria de Vigo; (e) oxygen concentration; (f) particulate organic
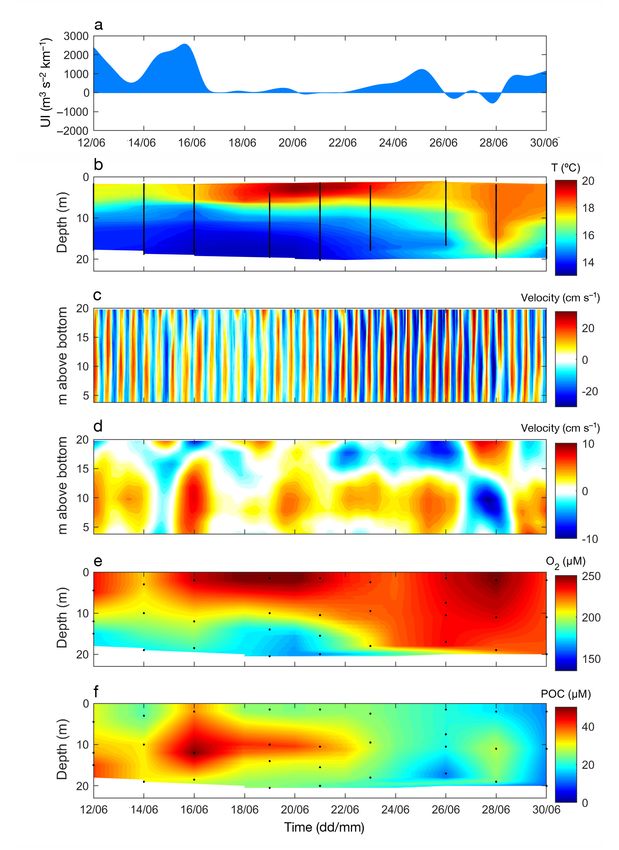
carbon (POC) concentration; black dots indicate water sample depthsAmo-Seco et al.: Benthic oxygen fluxes in NW Iberia 23 Fig. 4. As in Fig. 3, but for the October campaign
24                                          Mar Ecol Prog Ser 670: 15–31, 2021

  In the first period of the autumn campaign, there             to these sediment characteristics, this site is subject
was a maximum oxygen concentration at the sea sur-              to the formation of a fluff layer over the seabed. Daily
face and minima beginning at 10 m (Fig. 4e). POC                mean benthic fluxes were obtained from high resolu-
showed the same pattern with a sea surface maxi-                tion 15 min interval flux data (Fig. 2). All of the fluxes
mum (Fig. 4f). These conditions persisted until wind            determined in this study were negative, indicating
relaxation, when there was an intense mixing (6−                oxygen uptake by the sediment. During the summer
13 October) that disrupted the previous surface max-            campaign, bottom velocity ranged from 1.1 to 3.5 cm
ima of oxygen and POC. During the subsequent                    s−1 (Fig. 5a). In the first period of the campaign (12−
downwelling period (15−20 October), oxygen con-                 25 June), bottom velocity reached a minimum value
centrations increased, reaching values higher than              on 19 June and increased during the following down-
200 μM (Fig. 4e). There was also a slight increase in           welling event (26−30 June). Bottom oxygen concen-
POC in the last days of this period (18−20 October,             trations increased progressively during the summer
Fig. 4f), but these POC concentrations were consis-             campaign (Fig. 5b). Temperature showed a similar
tently lower than during the summer campaign.                   pattern with a minimum value on 19 June and maxi-
                                                                mum value on 28 June (Fig. 5b). Benthic fluxes were
                                                                low during the summer upwelling-relaxation period
         3.3. Aquatic eddy covariance fluxes                    with a minimum of −15.1 mmol m−2 d−1 on 12 June
                                                                (Fig. 5c). In the subsequent downwelling period, flux-
  The AEC system was deployed at a site above                   es were higher, reaching a maximum of −35.0 mmol
sandy mud sediment (clay 20%, silt 59%, sand 21%)               m−2 d−1 on 26 June. Mean benthic oxygen flux was
according to Folk’s classification (Folk 1954), with an         −16.4 ± 1.2 mmol m−2 d−1 during the first period and
organic carbon content of 3.1 ± 0.2% by weight. Due             −28.6 ± 5.7 mmol m−2 d−1 during the second period,

Fig. 5. Benthic conditions measured by aquatic eddy covariance (AEC) during the June campaign: (a) bottom velocity; (b) bot-
tom oxygen concentration and temperature (black line); (c) daily AEC benthic oxygen fluxes. Measurements were recorded
                               at 11 cm above the sediment surface. Error bars represent ± SD
Amo-Seco et al.: Benthic oxygen fluxes in NW Iberia 25
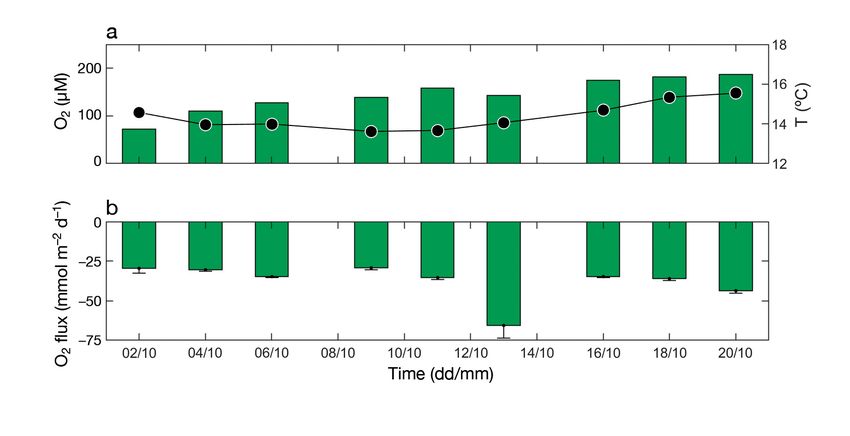
Fig. 6. As in Fig. 5, but for the October campaign
with a moderate monthly coefficient of variation of in October daily variability (13−37%) was much
34% for June. higher than monthly variability (12%). In fact, only
During the autumn campaign, bottom velocity on 18 October was daily variability of the same order
ranged from 0.7 to 6.0 cm s−1 with a maximum on 6 of magnitude as monthly variability.
October (Fig. 6a). Bottom oxygen concentrations in-
creased progressively during the campaign from val-
ues of 131 μM on 4 October to 200 μM on the last day 3.4. Benthic chamber fluxes
(20 October). Temperatures showed a similar pattern
to oxygen concentrations, with lower temperatures In situ benthic chamber fluxes showed similar pat-
during the upwelling-relaxation period and higher terns to those obtained by AEC for the October cam-
temperatures during the downwelling event. Benthic paign. The initial temperatures and oxygen concen-
fluxes were not computed for 11, 13, and 16 October, trations inside the benthic chamber (Fig. 7a) were
as bottom velocities were very low for these deploy- similar to daily mean values measured by the AEC
ments (26 Mar Ecol Prog Ser 670: 15–31, 2021
Fig. 7. Benthic conditions measured by benthic chamber during the October campaign: (a) initial oxygen concentrations and
temperature (black line) inside the benthic chamber; (b) daily benthic chamber oxygen fluxes (± SD)
coefficient of variation of 30%. The higher variabil- reported for fine-grained muddy sediments in the
ity was mainly due to the large fluxes found on 13 shallow bay of Aarhus (Berg et al. 2003) and the gla-
and 20 October. For comparison, mean benthic oxy- cial fjord Loch Etive (Holtappels et al. 2013). In fact,
gen fluxes using the same deployment days as AEC all of these values followed the simple power rela-
were −31.4 ± 3.0 mmol m−2 d−1 during the up- tionship between benthic oxygen uptake and water
welling-relaxation event and −39.8 ± 5.3 mmol m−2 depth described by Glud (2008) based on a global
d−1 during the downwelling event. Seawater col- database of benthic oxygen fluxes (Fig. 8).
lected from the benthic chamber interior and incu- A comparison between results from AEC and the
bated in situ in the Winkler flasks during the de- benthic chamber was carried out in October 2017
ployment time had an average oxygen uptake of using the same deployment days. The mean benthic
10.2 ± 1.8 mmol m−2 d−1. flux was −26.5 ± 3.1 mmol m−2 d−1 for AEC and
−34.8 ± 5.7 mmol m−2 d−1 for the benthic chamber
(Fig. 9). Although these fluxes are significantly dif-
4. DISCUSSION ferent (p = 0.04, Wilcoxon matched pair test), they
agree within an acceptable margin given the funda-
4.1. Benthic fluxes mental differences between the 2 approaches and
possible heterogeneity of the sediment surface at
The mean benthic oxygen flux of −23.1 ± 6.4 mmol our site. Specifically, the mean daily ratio between
m−2 d−1 obtained by AEC from 13 deployments over AEC and benthic chamber fluxes was 0.78 ± 0.13,
the muddy sediments of Ria de Vigo (Table 1) is com- which is comparable to other ratios ranging from 1.4
parable to those (−32.9 mmol m−2 d−1) derived from to 0.75 found in previous studies in muddy sedi-
global-scale sediment−water flux data for coastal ments (Holtappels et al. 2013 and references com-
regions (Boynton et al. 2018). In addition, the mean in piled by Attard et al. 2015). A likely explanation of
our study is close to the average oxygen demand the difference is that mineralization processes
(−34 ± 10 mmol m−2 d−1) obtained previously by occurred in the bottom water enclosed in the cham-
Alonso-Pérez & Castro (2014) using benthic cham- ber. Indeed, bottle incubations of water sampled
bers during 4-season campaigns in the Ria de Vigo. from the chamber interior after it was deployed in-
To our knowledge, the AEC technique has only been dicated an average oxygen consumption of 10.2 ±
applied in a handful of muddy coastal marine sedi- 1.8 mmol m−2 d−1. This result emphasizes the impor-
ments (Berg et al. 2003, Glud et al. 2010, 2016, tance of deploying the benthic chamber with the
Holtappels et al. 2013, Attard et al. 2016). Our mean utmost care, especially when the sediment is a fluffy
value for the Ria de Vigo is within the range of values muddy sediment as was the case at our study site.Amo-Seco et al.: Benthic oxygen fluxes in NW Iberia 27
when northerly winds predominate, causing the up-
lift of subsurface nutrient-rich waters and triggering
intense phytoplankton blooms inside the Rias Baixas.
In contrast, October usually corresponds to the tran-
sition period between the upwelling and down-
welling seasons (Nogueira et al. 1997, Figueiras et al.
2002). In June 2017, there was a strong upwelling
event that produced a proliferation of large diatoms
(M. Froján et al. unpubl. data). The stratified water
column of the following days favoured this phyto-
plankton growth, with chl a levels as high as 15 mg
m−3. During the subsequent downwelling, this labile
organic matter (senescent phytoplankton cells) be-
gan to sink, and conveyed by the water circulation it
was deposited on the sediment surface. In October
2017, there was an upwelling event with a slightly
Fig. 8. Comparison among (1) power function fit of benthic stratified water column followed by a wind relaxation
oxygen flux as a function of depth according to Glud (2008) during which there was a thermal homogenization.
(black line), (2) benthic oxygen fluxes obtained by aquatic Under these conditions, phytoplankton proliferation
eddy covariance (AEC) in coastal muddy zones (coloured
was much lower than during the phytoplankton
dots), and (3) mean AEC oxygen flux for the June and Octo-
ber campaigns obtained in this study (red dot). Power func- bloom of June 2017. Subsequently, the occurrence of
tion fit for AEC benthic fluxes in coastal muddy sediments is extratropical cyclone Ophelia triggered an intense
represented by a black dashed line downwelling, which caused the inflow of warm and
well-oxygenated oceanic surface waters into the en-
tire water column.
Changes in hydrodynamics and biogeochemical
conditions of the water column affect benthic oxygen
fluxes. Studies have shown the influence of oxygen,
temperature, and organic matter supply on the mag-
nitude of benthic oxygen fluxes (Cowan et al. 1996,
Lomas et al. 2002, Hopkinson & Smith 2005, Murrell
& Lehrter 2011, Alonso-Pérez & Castro 2014). Addi-
tionally, the way in which hydrodynamics control
benthic oxygen fluxes has been analysed in several
papers (Glud et al. 2007, Berg & Huettel 2008, Berg
et al. 2013).
Based on the distinct water column conditions
measured during the June and October 2017 sam-
pling periods, we expected different magnitudes of
benthic oxygen fluxes for these 2 periods. Daily ben-
Fig. 9. Mean ± SD benthic oxygen fluxes in October meas- thic oxygen fluxes in June were characterized by
ured by benthic chamber and by aquatic eddy covariance
high variability, distinguished by significantly
(AEC), and oxygen consumption measured from bottle in-
cubations; n: number of deployments smaller benthic oxygen fluxes for the upwelling-
relaxation period (average of −16.4 ± 1.2 mmol m−2
d−1; Fig. 10a) compared to the mean value of −28.6 ±
4.2. Main forcing factors of the benthic fluxes 5.7 mmol m−2 d−1 during the downwelling event at
the end of June (26−30 June, Mann-Whitney U-test,
The intensive hydrographic and biogeochemical p = 0.03, Fig. 10a). The large benthic fluxes at the
sampling during the June and October 2017 cam- end of June are associated with significantly higher
paigns allowed us to investigate the controls of temperatures (Mann-Whitney U-test, p = 0.03,
changes in benthic oxygen fluxes during 2 different Fig. 10b), and relatively higher, though not signifi-
seasonal periods for the NW Iberian upwelling sys- cant, oxygen concentrations (Mann-Whitney U-test,
tem. June is part of a substantial upwelling season, p = 0.1, Fig. 10c) and bottom velocity (Mann-Whitney28 Mar Ecol Prog Ser 670: 15–31, 2021
Fig. 10. Average values of (a) aquatic eddy covariance
(AEC) benthic oxygen flux, (b) bottom temperature (T), and
(c) bottom oxygen concentration from RINKO EC; (d) bottom
velocity from the acoustic Doppler velocimeter; and (e) par-
ticulate organic carbon (POC) integrated along the water
column for the 2 different hydrodynamic periods during the
June and October campaigns: upwelling-relaxation period
(blue bars), downwelling period (red bars). Averages for
each campaign (June or October) are represented by the
white bars. * indicates significant differences between the
2 hydrodynamic periods (p < 0.05)
U-test, p = 0.5, Fig. 10d). Interestingly, it was during Thus, we suggest that the sinking of highly labile orga-
this summer downwelling event that the largest ben- nic matter formed during the previous upwelling-
thic oxygen fluxes for the entire study were meas- stratification conditions (maximum amount of POC
ured, larger than the mean benthic oxygen flux for was 548 ± 69 mmol m−2, Figs. 3f & 10e) would en-
the autumn downwelling event due to extratropical hance the benthic oxygen fluxes at the end of the
cyclone Ophelia. Even though the stronger bottom June campaign. In fact, M. Froján et al. (unpubl.
velocity in the October campaign (4.3 ± 1.2 cm s−1) data) also observed the sinking of large diatoms due
intensified benthic oxygen exchange, the highest to the circulation reversal (surface inflow and bottom
mean flux during the summer downwelling had rela- outflow) associated with the wind relaxation and
tively lower bottom velocities (2.3 ± 0.9 cm s−1) and subsequent downwelling after 23 June at different
similar temperature and oxygen concentrations. sites in the Ria de Vigo. This large supply of labileAmo-Seco et al.: Benthic oxygen fluxes in NW Iberia 29
organic matter triggered the high benthic oxygen Acknowledgements. We thank the captain and the crew of
fluxes for the summer downwelling. Consequently, the RV ‘Mytilus’, as well as the Oceanography Group from
the Instituto de Investigacións Mariñas (IIM-CSIC) for their
during the summer campaign, the principal forcing collaboration during the campaigns. We are grateful to the
factor that modulated the benthic oxygen fluxes was divers, Manuel E. Garci, Alexandre Chamorro, Rubén
the supply of organic matter. Chamorro, and Iñaki Ferreiro, for their invaluable help dur-
In October, no significant differences occurred in ing the deployments. We also acknowledge Puertos del
Estado for providing meteorological data. M.A.S. and N.V.R.
benthic oxygen fluxes between the upwelling-relax-
were funded by the Spanish Government through a Forma-
ation period (−25.7 ± 1.2 mmol m−2 d−1) and the strong ción de Profesorado Universitario fellowship (FPU 18/05051)
downwelling after 14 October (−27.7 ± 5.2 mmol m−2 and a Juan de la Cierva-Formación fellowship (FJCI-
d−1, Mann-Whitney U-test, p = 0.6, Fig. 10a). Addi- 2017−34290), respectively. Financial support was provided
by the Spanish Ministry of Science and Innovation through
tionally, no significant differences were observed in
the i-SMALL project (CTM2014-56119-R) and by the Euro-
any of the studied variables (temperature, oxygen pean Union FEDER project MarRISK (0262_MarRISK_1_E).
concentration, bottom velocity, and POC) between This study was also supported by grants from the US
both periods. Comparison of the mean benthic fluxes National Science Foundation (OCE-1550822, OCE-1824144)
for the June (−20.9 ± 7.1 mmol m−2 d−1) and October and the University of Virginia. We thank Rachel E. Michaels
for editorial assistance with the manuscript. Finally, we
(−26.5 ± 3.1 mmol m−2 d−1) campaigns resulted in thank Dr. Kristensen, Dr. Attard and 2 anonymous reviewers
similar values, even though available POC concen- for their helpful comments.
trations were much higher in June (Fig. 10e), and
bottom temperature and oxygen concentrations were
LITERATURE CITED
similar (Fig. 10b,c). Thus, we suggest that the much
higher bottom velocity (Fig. 10d) during the October Almroth E, Tengberg A, Andersson JH, Pakhomova S, Hall
campaign is the key factor enhancing benthic oxy- POJ (2009) Effects of resuspension on benthic fluxes of
gen fluxes compared to the June campaign. Intensifi- oxygen, nutrients, dissolved inorganic carbon, iron and
cation of bottom shear stress produced by strong cur- manganese in the Gulf of Finland, Baltic Sea. Cont Shelf
Res 29:807−818
rents can resuspend surface sediments, mixing the Alonso-Pérez F, Castro CG (2014) Benthic oxygen and nutri-
organic matter and reduced compounds into the ent fluxes in a coastal upwelling system (Ria de Vigo,
overlying water and favouring their oxidation (Alm- NW Iberian Peninsula): seasonal trends and regulating
roth et al. 2009, Niemistö et al. 2018, Camillini et al. factors. Mar Ecol Prog Ser 511:17−32
Alonso-Pérez F, Zúñiga D, Arbones B, Figueiras FG, Castro
2021). In fact, intense resuspension events in the Ria CG (2015) Benthic fluxes, net ecosystem metabolism and
de Vigo are more likely to happen in autumn (Villa- seafood harvest: completing the organic carbon balance
cieros-Robineau et al. 2013). Additionally, an in the Ria de Vigo (NW Spain). Estuar Coast Shelf Sci
increase in bottom velocity reduces the thickness of 163:54−63
Álvarez-Salgado XA, Figueiras FG, Pérez FF, Groom S and
the diffusive boundary layer, producing an increase
others (2003) The Portugal coastal current off NW Spain:
in diffusive gradients and deeper oxygen penetration new insights on its biogeochemical variability. Prog
into the sediment (Glud et al. 2007). Oceanogr 56:281−321
Using a global sediment−water flux data set for Aneiros F, Rubal M, Troncoso JS, Bañón R (2015) Subtidal
coastal zones, in which only flux measurements ob- benthic megafauna in a productive and highly urbanised
semi-enclosed bay (Ria de Vigo, NW Iberian Peninsula).
tained through benthic chambers and sediment cores Cont Shelf Res 110:16−24
were considered, Boynton et al. (2018) concluded Attard KM, Stahl H, Kamenos NA, Turner G, Burdett HL,
that benthic oxygen fluxes were modulated by tem- Glud RN (2015) Benthic oxygen exchange in a live
perature, depth, and the organic matter supply. In coralline algal bed and an adjacent sandy habitat: an
eddy covariance study. Mar Ecol Prog Ser 535:99−115
contrast to other techniques, AEC is not an invasive
Attard KM, Hancke K, Sejr MK, Glud RN (2016) Benthic pri-
technique that interferes with the natural environ- mary production and mineralization in a High Arctic
mental conditions. Thus, through use of this tech- fjord: in situ assessments by aquatic eddy covariance.
nique, the important role hydrodynamic conditions Mar Ecol Prog Ser 554:35−50
Bakun A (1973) Coastal upwelling indices, west coast of
can play on benthic fluxes (Berg et al. 2013, Attard et
North America, 1946−71. US Department of Commerce,
al. 2015, Glud et al. 2016, Reimers et al. 2016) has National Oceanic and Atmospheric Administration, Na-
been documented. In this first study applying AEC in tional Marine Fisheries Service, Seattle, WA
the Ria de Vigo, we document that benthic fluxes are Beardsley RC, Limeburner R, Rosenfeld LK (1985) Introduc-
modulated by different key factors, most notably, tion to the CODE-2 moored array and large-scale data
report. Woods Hole Oceanographic Institution, Woods
hydrodynamics (October campaign) and the supply Hole, MA
of labile organic matter fueling benthic oxygen up- Berelson WM, McManus J, Severmann S, Reimers CE
take (June campaign). (2013) Benthic flux of oxygen and nutrients across Ore-30 Mar Ecol Prog Ser 670: 15–31, 2021 gon/California shelf sediments. Cont Shelf Res 55:66−75 Fraga F (1981) Upwelling off the Galician coast, northwest Berg P, Huettel M (2008) Monitoring the seafloor using the Spain. In: Richards FA (ed) Coastal upwelling. American noninvasive eddy correlation technique: integrated ben- Geophysical Union, Washington DC, p 176−182 thic exchange dynamics. Oceanography 21:164−167 Froelich PN, Klinkhammer GP, Bender ML, Luedtke NA Berg P, Røy H, Janssen F, Meyer V, Jørgensen BB, Huettel and others (1979) Early oxidation of organic matter in pe- M, de Beer D (2003) Oxygen uptake by aquatic sedi- lagic sediments of the eastern equatorial Atlantic: sub- ments measured with a novel non-invasive eddy-correla- oxic diagenesis. Geochim Cosmochim Acta 43:1075− tion technique. Mar Ecol Prog Ser 261:75−83 1090 Berg P, Røy H, Wiberg PL (2007) Eddy correlation flux meas- Gilcoto M, Largier JL, Barton ED, Piedracoba S and others urements: the sediment surface area that contributes to (2017) Rapid response to coastal upwelling in a semien- the flux. Limnol Oceanogr 52:1672−1684 closed bay. Geophys Res Lett 44:2388−2397 Berg P, Glud RN, Hume A, Stahl H, Oguri K, Meyer V, Kita- Glud RN (2008) Oxygen dynamics of marine sediments. Mar zato H (2009) Eddy correlation measurements of oxygen Biol Res 4:243−289 uptake in deep ocean sediments. Limnol Oceanogr Glud RN, Berg P, Fossing H, Jørgensen BB (2007) Effects of Methods 7:576−584 the diffusive boundary layer on benthic mineralization Berg P, Long MH, Huettel M, Rheuban JE and others (2013) and O2 distribution: a theoretical model analysis. Limnol Eddy correlation measurements of oxygen fluxes in per- Oceanogr 52:547−557 meable sediments exposed to varying current flow and Glud RN, Berg P, Hume A, Batty P, Blicher ME, Lennert K, light. Limnol Oceanogr 58:1329−1343 Rysgaard S (2010) Benthic O2 exchange across hard- Berg P, Koopmans DJ, Huettel M, Li H, Mori K, Wüest A bottom substrates quantified by eddy correlation in a (2016) A new robust oxygen-temperature sensor for aqua- sub-Arctic fjord. Mar Ecol Prog Ser 417:1−12 tic eddy covariance measurements. Limnol Oceanogr Glud RN, Berg P, Stahl H, Hume A, Larsen M, Eyre BD, Methods 14:151−167 Cook PL (2016) Benthic carbon mineralization and nutri- Boynton WR, Ceballos MAC, Bailey EM, Hodgkins CLS, ent turnover in a Scottish sea loch: an integrative study. Humphrey JL, Testa JM (2018) Oxygen and nutrient Aquat Geochem 22:443−467 exchanges at the sediment−water interface: a global syn- Grenz C, Denis L, Pringault O, Fichez R (2010) Spatial and thesis and critique of estuarine and coastal data. Estuar- seasonal variability of sediment oxygen consumption ies Coasts 41:301−333 and nutrient fluxes at the sediment water interface in a Camillini N, Attard KM, Eyre BD, Glud RN (2021) Resolving sub-tropical lagoon (New Caledonia). Mar Pollut Bull community metabolism of eelgrass Zostera marina mea- 61:399−412 dows by benthic flume-chambers and eddy covariance in Herrera JL, Piedracoba S, Varela RA, Rosón G (2005) Spatial dynamic coastal environments. Mar Ecol Prog Ser 661: analysis of the wind field on the western coast of Galicia 97−114 (NW Spain) from in situ measurements. Cont Shelf Res Cook PLM, Wenzhöfer F, Glud RN, Janssen F, Huettel M 25:1728−1748 (2007) Benthic solute exchange and carbon mineraliza- Hidy GM (1972) A view of recent air−sea interaction re- tion in two shallow subtidal sandy sediments: effect of search. Bull Am Meteorol Soc 53:1083−1102 advective pore-water exchange. Limnol Oceanogr 52: Holtappels M, Glud RN, Donis D, Liu B, Hume A, Wenzhöfer 1943−1963 F, Kuypers MMM (2013) Effects of transient bottom Cowan JLW, Pennock JR, Boynton WR (1996) Seasonal and water currents and oxygen concentrations on benthic interannual patterns of sediment−water nutrient and exchange rates as assessed by eddy correlation measure- oxygen fluxes in Mobile Bay, Alabama (USA): regulating ments. J Geophys Res Oceans 118:1157−1169 factors and ecological significance. Mar Ecol Prog Ser Hopkinson CS Jr, Smith EM (2005) Estuarine respiration: an 141:229−245 overview of benthic, pelagic, and whole system respira- Diaz RJ, Rosenberg R (2008) Spreading dead zones and con- tion. In: Williams PJL (ed) Respiration in aquatic ecosys- sequences for marine ecosystems. Science 321:926−929 tems. Oxford University Press, Oxford, p 122−146 Evans G, Prego R (2003) Rias, estuaries and incised valleys: Huettel M, Berg P, Kostka JE (2014) Benthic exchange and Is a ria an estuary? Mar Geol 196:171−175 biogeochemical cycling in permeable sediments. Annu Fan SM, Wofsy SC, Bakwin PS, Jacob DJ, Fitzjarrald DR Rev Mar Sci 6:23−51 (1990) Atmosphere−biosphere exchange of CO2 and O3 Lee X, Massman W, Law B (2004) Handbook of micrometeo- in the central Amazon forest. J Geophys Res Atmos 95: rology: a guide for surface flux measurement and analy- 16851−16864 sis. Kluwer Academic Publishers, Dordrecht Ferrón S, Alonso-Pérez F, Castro CG, Ortega T and others Lomas MW, Glibert PM, Shiah FK, Smith EM (2002) Micro- (2008) Hydrodynamic characterization and performance bial processes and temperature in Chesapeake Bay: cur- of an autonomous benthic chamber for use in coastal sys- rent relationships and potential impacts of regional tems. Limnol Oceanogr Methods 6:558−571 warming. Glob Change Biol 8:51−70 Figueiras FG, Labarta U, Reiriz MFF (2002) Coastal Lorrai C, McGinnis DF, Berg P, Brand A, Wüest A (2010) upwelling, primary production and mussel growth in the Application of oxygen eddy correlation in aquatic sys- Rias Baixas of Galicia. Hydrobiologia 484:121−131 tems. J Atmos Ocean Technol 27:1533−1546 Flagg CN, Vennersch JA, Beardsley RC (1976) 1974 M. I. T. Middelburg JJ, Soetaert K, Herman PMJ (1997) Empirical New England Shelf dynamics experiment (March, 1974) relationships for use in global diagenetic models. Deep- Data Report Part II: The moored array: M. I. T. Rep 76-1. Sea Res I 44:327−344 Massachusetts Institute of Technology, Cambridge, MA Murrell MC, Lehrter JC (2011) Sediment and lower water Folk RL (1954) The distinction between grain size and min- column oxygen consumption in the seasonally hypoxic eral composition in sedimentary-rock nomenclature. region of the Louisiana continental shelf. Estuaries J Geol 62:344−359 Coasts 34:912−924
Amo-Seco et al.: Benthic oxygen fluxes in NW Iberia                                  31

Niemistö J, Kononets M, Ekeroth N, Tallberg P, Tengberg             correlation flux measurements. Limnol Oceanogr Meth-
   A, Hall POJ (2018) Benthic fluxes of oxygen and inor-            ods 11:351−359
   ganic nutrients in the archipelago of Gulf of Finland,       Vilas F, Bernabeu AM, Méndez G (2005) Sediment distribu-
   Baltic Sea — effects of sediment resuspension measured           tion pattern in the Rias Baixas (NW Spain): main facies
   in situ. J Sea Res 135:95−106                                    and hydrodynamic dependence. J Mar Syst 54:261−276
Nogueira E, Pérez FF, Ríos AF (1997) Seasonal patterns and      Villacieros-Robineau N, Herrera JL, Castro CG, Piedracoba
   long-term trends in an estuarine upwelling ecosystem             S, Rosón G (2013) Hydrodynamic characterization of the
   (Ría de Vigo, NW Spain). Estuar Coast Shelf Sci 44:              bottom boundary layer in a coastal upwelling system (Ria
   285−300                                                          de Vigo, NW Spain). Cont Shelf Res 68:67−79
Piedracoba S, Álvarez-Salgado XA, Rosón G, Herrera JL           Wollast R (1998) Evaluation and comparison of the global
   (2005) Short-timescale thermohaline variability and re-          carbon cycle in the coastal zone and in the open ocean.
   sidual circulation in the central segment of the coastal         In: Brink KH, Robinson AR (eds) The sea. John Wiley &
   upwelling system of the Ría de Vigo (northwest Spain)            Sons, New York, NY, p 213−252
   during four contrasting periods. J Geophys Res Oceans        Yentsch CS, Menzel DW (1963) A method for the determina-
   110:C03018                                                       tion of phytoplankton chlorophyll and phaeophytin by
Reimers CE, Özkan-Haller HT, Sanders RD, McCann-                    fluorescence. Deep-Sea Res Oceanogr Abstr 10:221−231
   Grosvenor K, Chace PJ, Crowe SA (2016) The dynamics          Zúñiga D, Villacieros-Robineau N, Salgueiro E, Alonso-
   of benthic respiration at a mid-shelf station off Oregon.        Pérez F, Rosón G, Abrantes F, Castro CG (2016) Particle
   Aquat Geochem 22:505−527                                         fluxes in the NW Iberian coastal upwelling system:
Rheuban JE, Berg P (2013) The effects of spatial and tempo-         hydrodynamical and biological control. Cont Shelf Res
   ral variability at the sediment surface on aquatic eddy          123:89−98

Editorial responsibility: Erik Kristensen                       Submitted: June 1, 2020
 Odense, Denmark                                                Accepted: May 25, 2021
Reviewed by: K. Michael Attard and 2 anonymous referees         Proofs received from author(s): July 19, 2021
You can also read