Characterization of the G protein coupled receptor family SREB across fish evolution
←
→
Page content transcription
If your browser does not render page correctly, please read the page content below
www.nature.com/scientificreports
OPEN Characterization of the G
protein‑coupled receptor family
SREB across fish evolution
Timothy S. Breton1*, William G. B. Sampson1, Benjamin Clifford2, Anyssa M. Phaneuf1,
Ilze Smidt3, Tamera True1, Andrew R. Wilcox1, Taylor Lipscomb4,5, Casey Murray4 &
Matthew A. DiMaggio4
The SREB (Super-conserved Receptors Expressed in Brain) family of G protein-coupled receptors is
highly conserved across vertebrates and consists of three members: SREB1 (orphan receptor GPR27),
SREB2 (GPR85), and SREB3 (GPR173). Ligands for these receptors are largely unknown or only
recently identified, and functions for all three are still beginning to be understood, including roles
in glucose homeostasis, neurogenesis, and hypothalamic control of reproduction. In addition to the
brain, all three are expressed in gonads, but relatively few studies have focused on this, especially in
non-mammalian models or in an integrated approach across the entire receptor family. The purpose of
this study was to more fully characterize sreb genes in fish, using comparative genomics and gonadal
expression analyses in five diverse ray-finned (Actinopterygii) species across evolution. Several unique
characteristics were identified in fish, including: (1) a novel, fourth euteleost-specific gene (sreb3b
or gpr173b) that likely emerged from a copy of sreb3 in a separate event after the teleost whole
genome duplication, (2) sreb3a gene loss in Order Cyprinodontiformes, and (3) expression differences
between a gar species and teleosts. Overall, gonadal patterns suggested an important role for all sreb
genes in teleost testicular development, while gar were characterized by greater ovarian expression
that may reflect similar roles to mammals. The novel sreb3b gene was also characterized by several
unique features, including divergent but highly conserved amino acid positions, and elevated brain
expression in puffer (Dichotomyctere nigroviridis) that more closely matched sreb2, not sreb3a. These
results demonstrate that SREBs may differ among vertebrates in genomic structure and function, and
more research is needed to better understand these roles in fish.
G protein-coupled receptors (GPCRs) are cell surface proteins characterized by seven transmembrane domains
and the ability to activate G proteins that induce intracellular responses1. GPCRs are well-represented across taxa
and are highly diverse, with a variety of possible ligands, multiple G proteins, and numerous ways to modulate
signaling2,3. The importance of GPCRs in physiology, coupled with their accessibility at the cell surface, has
attracted considerable research attention in medicine, where they represent some of the most heavily studied drug
targets4. Despite this attention, functions for some receptors remain poorly understood, and endogenous ligands
are unknown (orphan receptors), including many in the Class A Rhodopsin g roup5. One such orphan receptor
family is the Super-conserved Receptors Expressed in Brain (SREB)6–8. SREBs are found across vertebrates, but
not in other chordates or invertebrates, and are characterized by extremely high sequence conservation8. These
genes have mostly been studied in mammals, where there are three family members: sreb1 (orphan receptor
gpr27), sreb2 (gpr85), and sreb3 (gpr173).
The sreb1 gene exhibits the broadest tissue distribution in m ammals8,9, and this receptor has been studied in
pancreatic β-cells for insulin r egulation10,11. In mice, sreb1 knockdown results in decreased insulin mRNA and
secretion, as well as glucose tolerance impairment12,13. Overall though, SREB1 functions remain largely unknown,
as endogenous ligands are still not identified and G protein signals are u nclear13–16.
1
Division of Natural Sciences, University of Maine at Farmington, Farmington, ME, USA. 2Science Department,
Southern Maine Community College, South Portland, ME, USA. 3Department of Biology, Bates College, Lewiston,
ME, USA. 4Tropical Aquaculture Laboratory, Program in Fisheries and Aquatic Sciences, School of Forest Resources
and Conservation, Institute of Food and Agricultural Sciences, University of Florida, Ruskin, FL, USA. 5Livingston
Stone National Fish Hatchery, US Fish and Wildlife Service, Shasta Lake, CA, USA. *email: timothy.breton@
maine.edu
Scientific Reports | (2021) 11:12066 | https://doi.org/10.1038/s41598-021-91590-9 1
Vol.:(0123456789)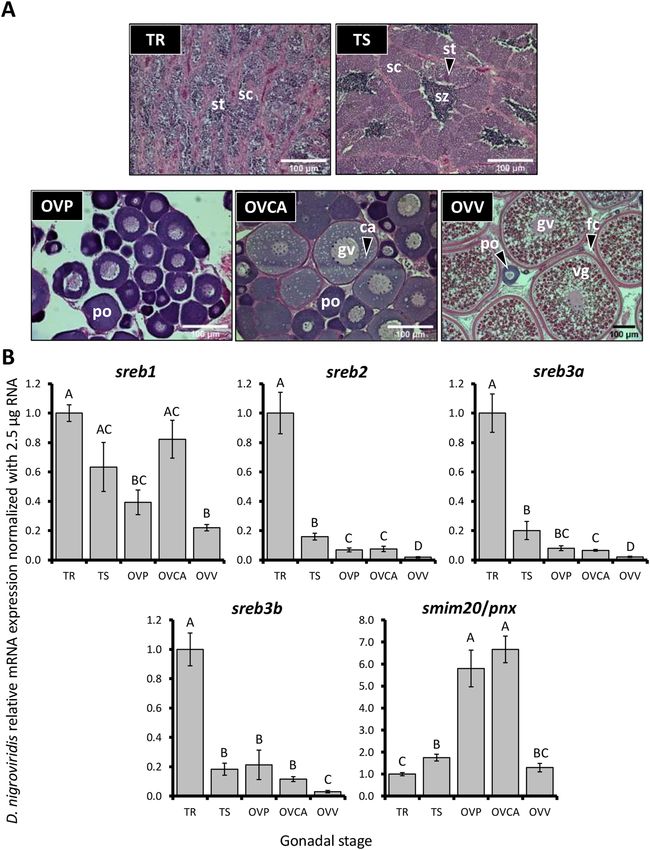
www.nature.com/scientificreports/
The sreb2 gene is the most conserved member, and also one of the most highly conserved GPCRs throughout
vertebrate evolution, exhibiting an identical amino acid sequence between humans and mice9,17. Ligands remain
unknown for this receptor, but past research has characterized high neuronal expression in the brain that sup-
eurogenesis7–9,18, 19. Changes in sreb2 expression impact memory and behaviors in m
ports a role in n ice17,20, while
variant alleles in humans have been associated with several psychiatric disorders, including schizophrenia and
autism spectrum d isorder20–22.
The sreb3 gene exhibits elevated expression in the mammalian brain and ovary 8, and our understanding of
this receptor has greatly expanded with the identification of two possible endogenous ligands: (1) GnRH-(1–5),
a cleavage product of the hypothalamic reproductive hormone gonadotropin-releasing hormone (GnRH), and
(2) phoenixin (PNX), a cleavage product from small integral membrane protein 20 (SMIM20)23–25. GnRH-(1–5)-
associated signaling is likely important during brain development for GnRH neuron migration, but the system
is complex, as some effects are age-dependent and may use an additional receptor26–28. PNX likely acts through
SREB3 to regulate diverse processes, including ovarian development and hypothalamic control of reproduction,
in addition to other effects in the brain, peripheral nervous system, and h eart29–36.
Our understanding of SREBs in non-mammalian vertebrates remains limited. However, some conserved roles
in fish were recently identified, including SREB1 effects on glucose homeostasis in zebrafish (Danio rerio)37, and
PNX/SREB3 functions in appetite regulation and reproduction in both spotted scat (Scatophagus argus) and
zebrafish38–41. In addition, this system may be critical in regulating zebrafish reproduction in the absence of a
functioning hypothalamic G nRH42,43. Overall though, many knowledge gaps remain, especially for the sreb1 and
sreb2 genes, which also exhibit elevated expression in g onads8,44 but have rarely been studied in this context. More
foundational information on gonadal sreb genes in non-mammalian vertebrates is needed to better character-
ize their reproductive effects. Further, few studies have used an integrative approach across multiple species to
broadly study this entire receptor family. To this end, the purpose of the present study was to characterize these
genes across fish evolution, using gonadal expression assays and comparative genomics. During these analyses,
a novel fourth, fish-specific family member (sreb3b) was also identified and characterized. All sreb transcripts
(sreb1, sreb2, sreb3a, sreb3b), as well as a potential ligand (smim20/pnx), were assessed in five diverse ray-finned
species (Actinopterygii) across evolution.
Methods
Study species and animal use approval. Five representative fishes were chosen for gene expression
analyses: (1) a holostean fish that diverged before the teleost-specific whole genome duplication event (WGD),
the Florida gar (Order Lepisosteiformes, Lepisosteus platyrhincus), (2) an ostariophysian teleost, the zebrafish
(Order Cypriniformes, D. rerio), (3) a teleost with an ovoviviparous (live-bearing) reproductive strategy, the sail-
fin molly (Order Cyprinodontiformes, Poecilia latipinna), (4) a member of the same order but with an oviparous
strategy, the African turquoise killifish (Nothobranchius furzeri), and (5) a highly-derived perciform, the green-
spotted puffer (Order Tetraodontiformes, Dichotomyctere nigroviridis). Florida gar, zebrafish, sailfin molly, and
green-spotted puffer were maintained and sampled under approved guidelines of the University of Florida (UF)
Institutional Animal Care and Use Committee (IACUC #: 202011293). Wild gar were sampled under Florida
Fish and Wildlife Conservation Commission permit # FNC-20-002. Zebrafish, sailfin molly, and puffer were
maintained at the UF Tropical Aquaculture Laboratory (TAL) (Ruskin, FL, USA). African turquoise killifish
samples were provided by the MDI Biological Laboratory (Bar Harbor, ME, USA) under IACUC #: AUP 20-07.
All experiments were performed in accordance with the University of Florida and MDI Biological Laboratory
IACUC ethical guidelines and regulations for vertebrate animal use. All experiments were conducted in compli-
ance with ARRIVE guidelines. Experimental protocols were approved by University of Maine at Farmington
(UMF) Grant Coordination Committee, as well as the University of Florida and MDI Biological Laboratory
IACUCs.
Comparative genomics and puffer sreb sequence confirmation. To characterize sreb sequences
across fish evolution, a comparative genomics dataset was generated using all publicly available fish genomes in
Ensembl genome browser version 99 (European Bioinformatics Institute, Hinxton, Cambridge, UK). Briefly, a
total of 78 genomes were used, including two agnathans (hagfish Eptatretus burgeri, and sea lamprey Petromyzon
marinus), a member of Class Chondrichthyes (Callorhinchus milii), and a lobe-finned fish (Sarcopterygii, coe-
lacanth Latimeria chalumnae). The remaining species were all ray-finned fishes (Actinopterygii). For each spe-
cies, the D. rerio sreb1 (GenBank Acc. No. NM_001114434.1), sreb2 (NM_131499.2), and sreb3 (NM_131498.1)
sequences were used to manually BLAST against the genome assembly, and all significant hits (e-value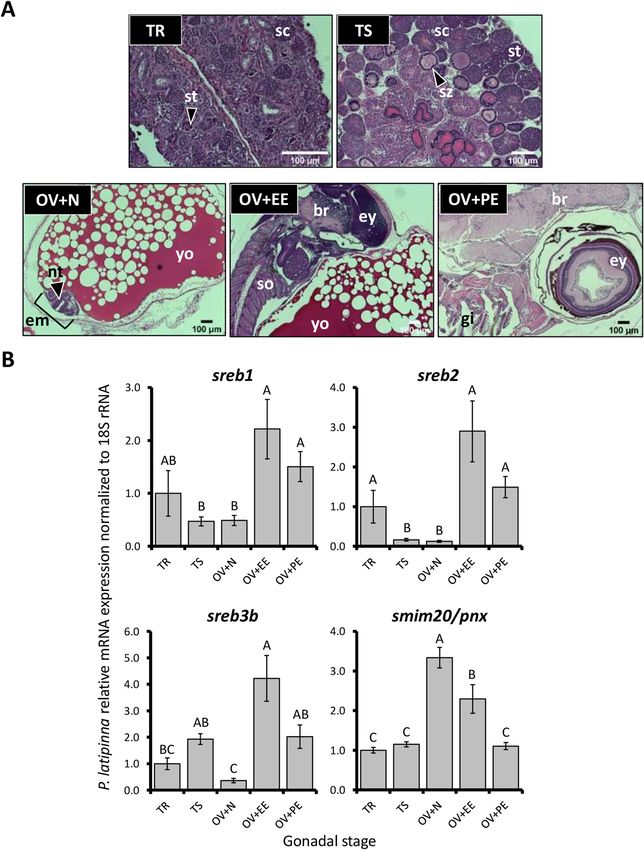
www.nature.com/scientificreports/
flank the protein-coding sequence (Supplementary Table S1) and were used in polymerase chain reactions (PCR)
with the Promega GoTaq Flexi PCR kit (Promega, Madison, Wisconsin USA) using standard p rotocols46. PCR
products were treated with ExoSAP-IT PCR Product Cleanup Reagent (Affymetrix, Inc., Santa Clara, CA, USA)
and transported to the MDI Biological Laboratory for sequencing using the dideoxy chain termination method
on an Applied Biosystems 3130xl Genetic Analyzer (Foster City, CA, USA). All PCR products were sequenced in
both directions using forward and reverse primers, and sequence chromatograms were trimmed for quality prior
to manual assembly. These sequences met full-length verification criteria (ORFfinder and TMHMM). As a result,
the D. nigroviridis sreb1 and sreb3a full protein-coding sequences were submitted to GenBank (Supplementary
Table S1) and included in the dataset, instead of the original genomic sequences. The complete dataset from
the 78 genomes is available as Supplementary Dataset 1. To assess sreb sequence conservation, a phylogenetic
analysis was conducted. Briefly, a multiple sequence alignment was performed using ClustalW and standard
parameters in MEGA X 47, followed by a maximum likelihood approach in IQ-TREE48 with M odelFinder49 and
50
1000 bootstraps using U FBoot2 .
Microsynteny analyses. As the comparative genomics dataset was generated, it became evident that the
sreb3a gene was consistently absent in any genome from Order Cyprinodontiformes. To distinguish between
sreb3a gene loss in these species, or a lack of high quality genomic sequencing in these regions, we identified
highly conserved flanking genes surrounding the sreb3a and sreb3b gene locations and performed microsynteny
analyses. The sreb3a gene locations in nine species that represent a diversity of ray-finned fishes (L. oculatus,
D. rerio, Ictalurus punctatus, Pycocentrus nattereri, Esox lucius, Amphiprion percula, Oreochromis niloticus, D.
nigroviridis, and Gasterosteus oculeatus) were used to identify the nearest neighboring upstream (foxp3b) and
downstream (suv39h1) genes. Both of these genes in all species were confirmed as significant matches to the D.
rerio foxp3b and suv39h1a genes, respectively, using NCBI-BLAST. The D. rerio flanking gene sequences were
then compared to all 10 genomes for Order Cyprinodontiformes (Cyprinodon variegatus, Fundulus heterocli-
tus, Gambusia affinis, P. formosa, P. latipinna, P. mexicana, P. reticulata, Xiphophorus maculatus, X. couchianus,
and Kryptolebias marmoratus) to identify their presence or absence. A similar procedure was used for analyses
involving a novel sreb gene cluster (sreb3b), except the initial species list across evolution was limited to only
those with sreb3b (E. lucius, A. percula, O. niloticus, D. nigroviridis, and G. oculeatus). From this, we identified
several highly conserved flanking upstream (tspy and ppp1r3f.) and downstream (wdr13) genes and compared
these to the same Cyprinodontiformes genomes. To visualize this, SimpleSynteny 51 was used with a selection of
the above species, including L. oculatus, D. rerio, E. lucius (an early species to exhibit sreb3b), three representa-
tive members of Order Cyprinodontiformes (P. latipinna, P. reticulata, and K. marmoratus), and D. nigroviridis.
Amino acid sequence comparisons. To characterize possible functional differences among four puta-
tive sreb clusters, each gene in the dataset was translated using ORFfinder to obtain likely full-length amino acid
sequences (Supplementary Dataset 2). Hagfish (E. burgeri), sea lamprey (P. marinus), and shark (C. milii) genes
were not included in these analyses since none of their sreb gene sequences clustered in the four major groups.
In addition, only SREB sequences with seven transmembrane domains as identified by TMHMM were included.
As a result, seven sequences present in Dataset 1 were removed from Dataset 2 before analyses, which included
the Paramormyrops kingsleyae SREB2A (5 transmembrane domains, TMs), Denticeps clupeoides SREB1 (6 TMs),
Salmo salar SREB3A2 (8 TMs), Salmo trutta SREB3A2 (8 TMs), Hucho hucho SREB3A1 (8 TMs), Monopterus
albus SREB2 (6 TMs), and Lates calcarifer SREB3B (5 TMs). The final dataset consisted of 75 SREB1, 80 SREB2,
69 SREB3A, and 54 SREB3B sequences across fishes. All sequences were aligned using ClustalW in MUSCLE52,
and results were visualized using JalView 253. Aligned sequences were parsed manually to identify conservation
of canonical functional motifs associated with ligand binding and activation (DRY in TM3, CWxP in TM6, and
NPxxY in TM7)54,55. Analyses did not include N-terminal regions before TM1, as these were highly variable and
some species exhibited multiple potential start sites. Amino acid positions were considered highly conserved if
they exhibited three or fewer divergent residues across all species (≥ 96.0%, 96.3%, 95.7%, and 94.4% conserva-
tion in SREB1, 2, 3A, and 3B, respectively). In addition, to identify unique characteristics of SREB3B, amino
acid positions conserved across SREB1, 2, and 3A but divergent in SREB3B were quantified. To assess if these
differences possibly impacted protein structure, I-TASSER56–58 was used to predict three dimensional protein
models for all SREBs within a selected species that did exhibit SREB3B (D. nigroviridis) and one that did not (D.
rerio). For each prediction, the greatest quality model was assessed based on highest confidence score (C-score
≥ −0.76) and TM-score > 0.5.
Fish sampling. To characterize gonadal sreb gene expression patterns, four species were used that best rep-
resented a diversity of ray-finned fishes: gar, zebrafish, sailfin molly, and puffer. Wild adult Florida gar were
collected from Orange Lake in Alachua County, FL, USA using standard electrofishing methods and held in
live wells until sampling occurred on shore. Gar were then euthanized with an overdose of neutral buffered
MS-222 (200 mg/L), and gonads immediately dissected from 12 fish/sex. One gonadal fragment from each
fish was preserved in 10% neutral buffered formalin for routine hematoxylin and eosin staining, performed by
Histology Tech Services, Inc. (Gainsville, FL, USA), to assess reproductive staging. A second gonadal fragment
was immediately preserved in RNALater (Ambion, Inc., Austin, TX, USA), snap frozen in dry ice, and stored at
−80 °C until later RNA extractions.
Wild-type adult zebrafish were purchased from a local commercial producer (Segrest Farms, Inc., Gibsonton,
FL, USA) and held in a freshwater flow through system at the UF TAL. Zebrafish (n = 12/sex) were euthanized
with an overdose of neutral buffered MS-222, and gonads were sampled using similar methods described above,
including histological assessments and RNALater preservation.
Scientific Reports | (2021) 11:12066 | https://doi.org/10.1038/s41598-021-91590-9 3
Vol.:(0123456789)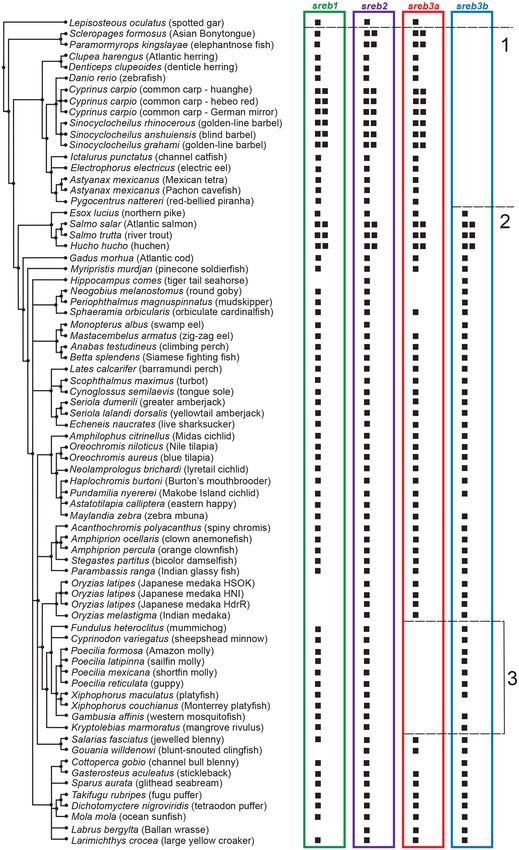
www.nature.com/scientificreports/
Adult sailfin mollies were collected from feral populations in outdoor ponds at the UF TAL. Fish (~ 50 indi-
viduals) were periodically caught over a two month period using hand nets and baited traps, and euthanized
following similar procedures to above. Sampling occurred over a more prolonged time period than the previously
discussed species, due to: (1) the ovoviviparious reproductive strategy, and (2) our intent to sample regressed
testicular stages. Regarding ovovivipary, female mollies with late stage embryos present within ovaries were
common, and a more rigorous sampling scheme was needed to obtain earlier stages. Regarding testicular stages,
regressed males were also less common in ponds than those with more developed (spermiating) testes. These
additional testicular samples were needed to more fully assess gene expression changes during development, as
such stages could not be sampled in either gar or zebrafish, due to difficulties in collecting individuals outside
of the spawning season, and small testicular sizes, respectively.
Adult green-spotted puffer were imported through a local wholesaler (Segrest Farms, Inc.) and held in a
freshwater flow through system at the UF TAL. Puffers were initially sampled (~ 20 individuals) following above
procedures to obtain testicular stages and early ovarian development for histology and RNA extractions. Since
this species spawns in s altwater59, the remaining puffers were then slowly acclimated to 15 g/L salinity (brackish
water conditions) over three months to promote gonadal development. Approximately 20 additional puffers were
then sampled to obtain vitellogenic oocytes and more developed testes, which provided a better comparison
with previously discussed species that were largely collected in spawning conditions. In addition, to more fully
characterize expression of the novel sreb3b across other organs, six random puffers (n = 3 individuals/sex) were
also sampled for whole brain, eye, gill, heart, liver, and distal intestine.
To compare organ sreb3b patterns across multiple fishes, the fifth species, African turquoise killifish (N.
furzeri), was also included in expression analyses. This species was chosen to compare to puffer patterns because it
is a member of Order Cyprinodontiformes and likely lost sreb genes in its genome, unlike puffer. In addition, this
killifish species is oviparous, which provided a better comparison to puffer than the ovovivparious sailfin molly.
Briefly, six adult killifish (n = 3/sex) from the MDI Biological Laboratory Animal Resources Core were removed
from a recirculating freshwater system and euthanized with immersion in 1:500 2-phenoxy-ethanol. Killifish
were dissected and gonadal stages were identified visually, with all males having developed testes and females in
vitellogenic growth. Whole brain, eye, gill, heart, liver, distal intestine, and gonad samples were removed from
each fish, preserved in RNALater, and stored at -80 °C until RNA extractions were performed. In addition, to
conduct a preliminary study on spatial sreb3b expression patterns, a second ovary sample from each female was
immediately removed for in situ hybridizations. Ovaries were chosen to enable comparisons between the novel
sreb3b and prior work on ovarian sreb3a in both fish and mammals35,40.
Killifish ovary in situ hybridization. In situ hybridizations were performed following a previously devel-
oped protocol60,61. Briefly, fresh killifish ovary fragments (n = 3) were frozen on dry ice, sectioned (8 μm) on a
cryostat at the MDI Biological Laboratory, and transported to UMF for immediate processing. Custom locked
nucleic acid (LNA) probes with 3’ and 5’ DIG labels were purchased from Qiagen (Hilden, Germany) for kil-
lifish sreb3b, a scramble sequence (negative control), and beta actin (actb1, positive control) (Supplementary
Table S2). The killifish probe was designed from GenBank Acc. No. XM_015967273 and verified as a member of
the fourth sreb cluster using NCBI-BLAST. The scramble and actb1 sequences were designed by Qiagen and veri-
fied to not significantly match to any location in the recently published killifish genome or did match to killifish
actb1, respectively. Probes were diluted according to the miRCURY LNA miRNA Detection Handbook (Qiagen)
and hybridized to tissues for 16 h at different temperatures. Anti-DIG antibodies with alkaline phosphatase
(Roche Diagnostics, Basel, Switzerland) were incubated for 14 h at room temperature, followed by colorimetric
detection for 2.5 h. Slides were mounted using Prolong Gold (Invitrogen, Carlsbad, CA, USA).
RNA extractions and cDNA synthesis. Preserved gonads from gar, zebrafish, sailfin molly, and puffer
were used in RNA extractions, with a subset of individuals in discrete reproductive stages chosen using gonadal
histology (n = 4–10 fish/stage, depending on availability). For gar, testis samples were selected with abundant,
mature spermatozoa (spermiating, TS, n = 10), along with ovaries with mid-late vitellogenic oocytes (OVV,
n = 9). For zebrafish, similar stages and numbers were used (TS and OVV, n = 8 fish/stage). For sailfin molly,
more stages were identified, including regressed testes (TR, n = 4), spermiating testes (TS, n = 9), ovaries with
neurulation stage embryos (OV + N, n = 8), ovaries with eyed embryos (OV + EE, n = 7), and ovaries with late-
stage pigmented embryos (OV + PE, n = 7). For puffer gonads, five stages were also included: regressed testes
(TR, n = 5), spermiating testes (TS, n = 9), ovaries with mostly primary growth oocytes (OVP, n = 6), ovaries with
early secondary growth (cortical alveoli) oocytes (OVCA, n = 9), and ovaries with mid-late vitellogenic oocytes
(OVV, n = 6). For the broad organ surveys in killifish and puffer, all collected samples were used (n = 6 fish/
stage, except gonads where n = 3 fish/stage). RNA extractions were performed on all preserved tissues using Tri
Reagent (Sigma-Aldrich, St. Louis, MO, USA) and standard phenol/chloroform procedures. In addition, some
vitellogenic ovary and liver samples required a third precipitation step using a polyvinylpyrolidone (PVP) solu-
tion (2% PVP, 1.4 M NaCl) and 5 M LiCl to remove polysaccharide contamination62. Total RNA quantity and
quality were assessed using a spectrophotometer and 1.0% agarose gel electrophoresis. Total RNA (2.5 μg for
most samples) was treated with ezDNase and a 5 min incubation at 37 °C to remove genomic DNA contamina-
tion, following by cDNA synthesis using the Superscript IV VILO kit (Invitrogen).
Quantitative PCR (qPCR) analyses. To quantify sreb-related gene expression patterns, cDNAs were used
in species-specific qPCR assays with a StepOne Plus Real Time PCR System and FAST SYBR™ Green Master
Mix (Applied Biosystems). Primers were designed using NCBI Primer-BLAST, either from publicly available
GenBank sequences or through searching Ensembl genomes for genes with significant similarity to D. rerio
Scientific Reports | (2021) 11:12066 | https://doi.org/10.1038/s41598-021-91590-9 4
Vol:.(1234567890)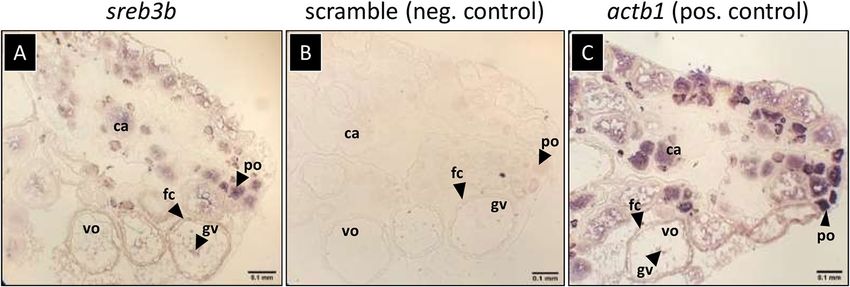
www.nature.com/scientificreports/
sequences. Florida gar was an exception, as a genome for this species was not available. Instead, L. oculatus
sequences were used to search an L. platyrhincus Sequence Read Archive (SRA) (SRX3153291) for protein cod-
ing fragments, which were confirmed through PCR and sequencing46 and submitted to GenBank (Supplemen-
tary Table S1). Primers for Florida gar sreb2 were designed from a previously published sequence (JN853506),
and smim20/pnx primers were designed from an intact sequence in another SRA (SRX1134593). Regarding
killifish assays, no sequences with similarity to sreb1 were found in the genome or available SRAs (SRP261140),
and this gene could not be included. In addition to sreb-related genes, three commonly used reference genes
(gapdh, eef1a, and 18S rRNA) were also evaluated in each species (Supplementary Table S3). Primers for D.
rerio eef1a and gapdh were previously designed63. Primer sets were verified for intended product amplification
using standard PCR and 2.0% agarose gel electrophoresis. All qPCR assays consisted of 10 μl reaction volumes,
1.33 μl diluted template, 0.02–1.0 μM primers (depending on assay), and standard cycling conditions (95 °C for
10 min, 40 cycles of 95 °C for 15 s and 60 °C for 1 min). All samples were assayed in duplicate, and triplicate rela-
tive standard curves were made from pooled cDNA. Optimized linear standard curves consisted of four to six
points, with approximately 90–100% PCR efficiency and single peak amplification in dissociation curve analysis.
Standard qPCR negative controls (no template and no reverse transcriptase) were also used and exhibited no
contamination.
For gar, zebrafish, and sailfin molly qPCR assays, results were analyzed using relative quantification64 and
normalized to 18S rRNA. Other possible reference genes (gapdh and eef1a) exhibited significant differences
among stages (p < 0.05) and were not used (Supplementary Fig. S1). In addition, 18S exhibited significant dif-
ferences among puffer gonad stages (p < 0.0001), and these qPCR assays were instead standardized based on an
equal quantity of input RNA (2.5 μg/sample) and quantified using the standard curve, similar to previous fish
gonadal assays without a reference gene65,66. Lastly, organ qPCR surveys in both killifish and puffer also did not
exhibit a suitable reference gene (Supplementary Fig. S2). However, these assays could not use a standard input
RNA quantity due to small organ sizes (0.6–2.5 μg/sample), and instead assays were normalized based on a
modified method67, where cell number (cCC) was replaced with input RNA (μg). Other requirements outlined
by this method, including similar reagents, volumes, and protocols across samples were f ollowed67. To validate
this approach, puffer organ assays were also normalized using the Campbell and colleagues method65, since
most samples (all except heart) consisted of 2.5 μg total input RNA. Similar results in puffer were obtained using
both methods. For all assays, results were expressed relative to a testis stage (set to 1.0). Data were expressed as
mean ± standard error, and log-transformed relative expression levels were analyzed using two sample t-tests
or one-way ANOVAs in SYSTAT12 (Systat Software Inc., San Jose, CA, USA). Tukey’s post hoc tests were used
to identify significant differences in organ surveys and gonadal stages in sailfin mollies and puffers (p < 0.05).
Results
Comparative genomics of sreb genes. Using a phylogenetic analysis, most sreb sequences clustered into
four groups, except hagfish, lamprey, and shark, which were identified as sreb-like genes (Fig. 1). In particular,
the hagfish and lamprey genes diverged from each other into two separate groups that could not be clustered
(Fig. 1A–E), while the shark sreb-like1 gene did exhibit somewhat weak clustering to sreb1 (Fig. 1F). The fourth
cluster, putatively named sreb3b, contained sequences from many species labeled in the genome assemblies as
sreb3 but clustered separately from the group that contained the D. rerio sreb3 sequence (sreb3a). The novel
cluster exhibited high bootstrap support (100%, Supplementary Fig. S3), although the sreb3a cluster was slightly
divergent in five species (L. chalumnae, L. oculatus, Gadus morhua, Salarias fasciatus, and D. nigroviridis). The
sreb3b gene was not evident in both spotted gar (L. oculatus) and early teleost orders (Osteoglossiformes, Sclerop-
ages formosus; Cypriniformes, D. rerio; Siluriformes, I. punctatus; and Characiformes, P. nattereri), which only
exhibited genes that clustered in the first three groups (Fig. 2 line 1). Instead, sreb3b was only evident later in
euteleosts, with Protacanthopterygii fishes (E. lucius, S. salar, S. trutta, and Hucho hucho) being the first evolu-
tionarily to exhibit these genes (Fig. 2 line 2). Sreb3b was largely retained in other, more-derived teleosts, even
in Order Cyprinodontiformes, where all members may have lost sreb3a (Fig. 2 line 3). This was confirmed using
synteny, where both the upstream and downstream genes flanking sreb3a were present in Order Cyprinodon-
tiformes but no similarity to sreb3a itself was detected (Fig. 3A, box 1). However, the sreb3b genomic region in
most of these species was intact and highly similar to other fishes that exhibited all four genes (Fig. 3B, box 2).
The only exception in Order Cyprinodontiformes was the X. couchianus genome, which contained sequences
with similarity to flanking genes but no identifiable sreb3b (data not shown). Later analyses (after Ensembl
99), however, did identify a homologous sequence (XM_028023752) in the appropriate genomic location, and
sreb3b is likely not lost in this species. In addition, the E. lucius sreb3b gene (XM_010890692) was flanked by a
suv39h1-like gene (Fig. 3B, yellow) with significant similarity and the same orientation to the D. rerio suv39h1a
gene flanking sreb3a (Fig. 3A).
To characterize possible functional differences between sreb3b and other clusters, amino acid sequences were
compared. Overall, SREB protein structure was highly conserved among the four groupings, and all D. rerio and
D. nigroviridis sequences in I-TASSER exhibited canonical G protein-coupled receptor characteristics, including
an N-terminal extracellular region, seven α-helical TM domains, an elongated third intracellular loop, and a
C-terminal intracellular region with an eighth α-helix (Fig. 4A). However, all SREBs were also characterized by
highly conserved differences in three functional motifs associated with G protein-coupled receptor activation
(Fig. 4B, red boxes). For instance, the aspartic acid (D) in the TM3 DRY motif was replaced with threonine (T)
in most SREB sequences (99.6% conserved across dataset). In addition, the cysteine (C) in the TM6 CWxP motif
was replaced with leucine (L) in SREB2-3B (100% conserved) but was more variable in SREB1. The tyrosine (Y) in
the TM7 NPxxY motif was replaced with C in SREB2-3B (100% conserved), except in SREB1, where C was found
in less-derived fishes but replaced with serine (S) in Neoteleosti. SREB3B was overall similar to other SREBs,
Scientific Reports | (2021) 11:12066 | https://doi.org/10.1038/s41598-021-91590-9 5
Vol.:(0123456789)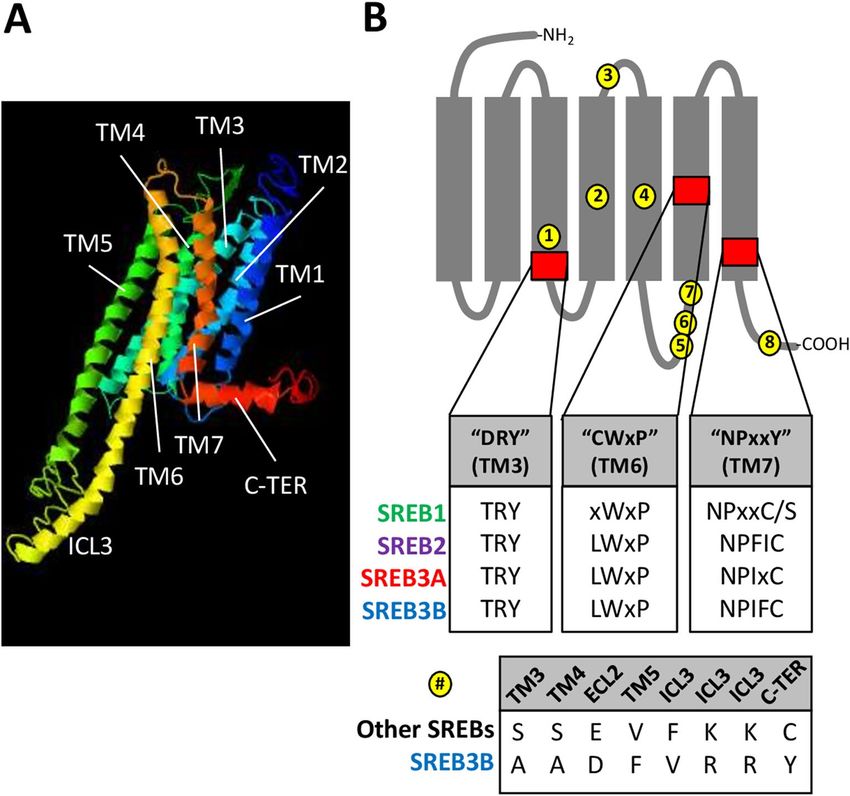
www.nature.com/scientificreports/
Figure 1. Phylogenetic analysis of all verified fish sreb gene sequences available in Ensembl genome browser 99.
The tree was generated using a maximum likelihood approach with 1000 bootstraps and rooted to the hagfish
sreb-like1 gene. See Supplementary Fig. S3 for bootstrap values and species names. Sequences for hagfish (sreb-
like1 and 2), lamprey (sreb-like1, 2, 3) and shark (sreb-like1) did not group in four major clusters (labeled A–F,
respectively), while all other genes were identified as sreb1 (green), sreb2 (purple), sreb3a (red), and a novel
sreb3b (blue).
except at eight highly conserved amino acid positions that were both unique to this cluster and divergent from
SREB1-3A (Fig. 4B, yellow circles). Most of these positions clustered in TM3-5 or intracellular regions. Some of
the most likely functional changes included: 1) a shift in TM5 from a smaller valine (V) in SREB1-3A to a residue
with a larger hydrophobic side chain (phenylalanine, F) (#4 in Fig, 4B), 2) the opposite shift at a position in the
third intracellular loop (#5), and 3) a change in the C-terminal domain from C to a larger, hydrophobic residue
(Y) (#8). In order, all eight residues referred to positions 132, 165, 184, 217, 292, 293, 296, and 372, respectively,
in the D. rerio SREB3A sequence.
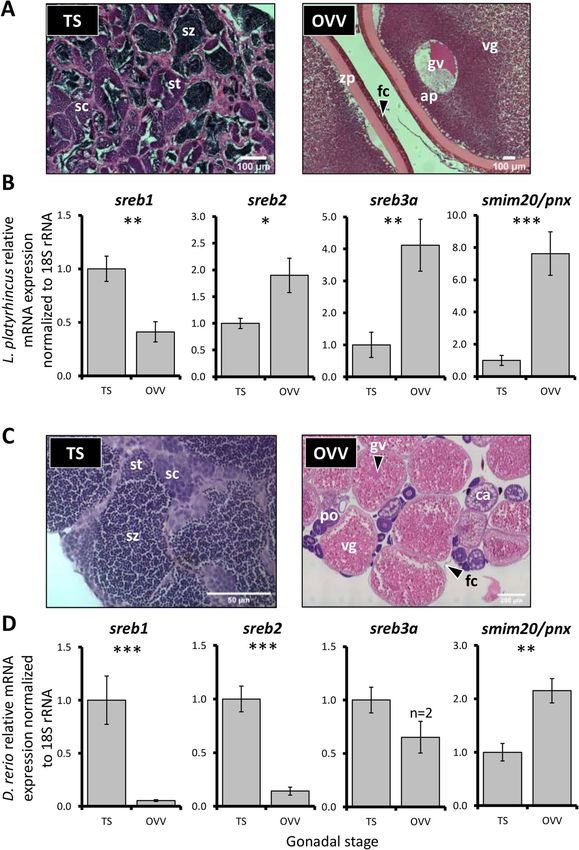
Sreb and smim20/pnx gonadal expression. Gar exhibited significant differences in sreb-related expres-
sion between mature testes and vitellogenic ovaries (Fig. 5A,B). Testes exhibited approximately two fold more
sreb1 (p = 0.004), while other genes (sreb2, sreb3a, and smim20/pnx) were elevated in ovarian tissues by approxi-
mately two (p = 0.04), four (p = 0.001), and eight fold (p < 0.0001), respectively. Zebrafish at similar stages,
however, exhibited largely opposite patterns, with approximately seven fold more sreb2 in testes than ovaries
(p < 0.0001), and sreb3a was not detected in most ovarian samples (n = 2, Fig. 5C,D). Zebrafish sreb1 and smim20/
pnx were somewhat more similar to gar, with elevated levels in testes (20 fold, p < 0.0001) and ovaries (two fold,
p = 0.002), respectively.
Sailfin molly expression patterns were largely dominated by embryonic signals within ovarian tissues, as all
sreb genes were significantly elevated at the eyed embryo (OV + EE) stage (p < 0.0001 for all genes, Fig. 6A,B).
Among stages that were more representative of gonadal signals (TR, TS, and OV + N), sreb2 and sreb3b were
significantly elevated in testicular tissues, while sreb1 was largely stable. Smim20/pnx, in contrast, was three fold
higher at an ovary-dominated stage (OV + N) compared to testes, and expression decreased in later embryonic
stages (p < 0.0001).
Puffer gonads were overall similar to zebrafish and mollies, with elevated sreb levels in testes and greater
smim20/pnx in ovaries (Fig. 7A,B). Sreb1 exhibited the most stable expression, with only slightly greater levels
in regressed testes compared to primary or vitellogenic stage ovaries (p < 0.0001). However, sreb2, sreb3a, and
sreb3b patterns were divergent from sreb1 and highly similar to each other, with approximately ten fold greater
expression in regressed testes compared to most ovarian stages (p < 0.0001 for all three genes). Smim20/pnx
Scientific Reports | (2021) 11:12066 | https://doi.org/10.1038/s41598-021-91590-9 6
Vol:.(1234567890)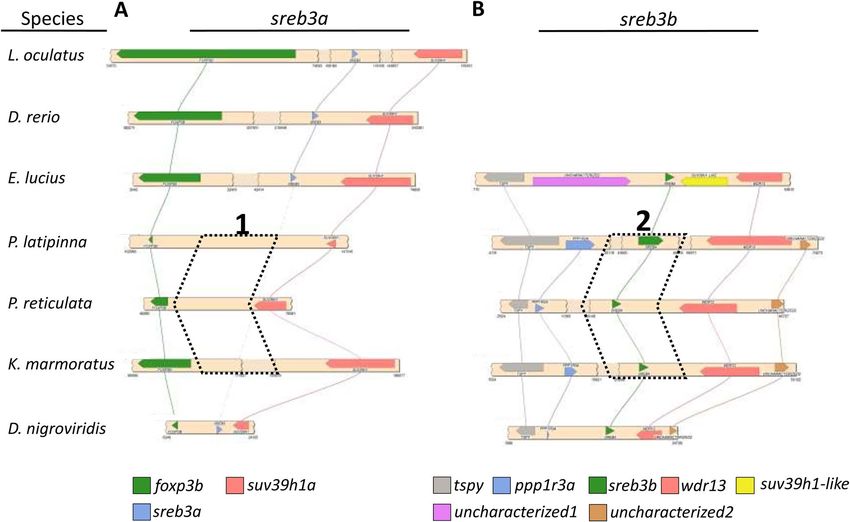
www.nature.com/scientificreports/

                                  Figure 2.  List of all ray-finned fish species (by Ensembl 99 species tree) with presence (black box) or absence
                                  (open space) of any unique genomic location with significant similarity to Danio rerio sreb1, sreb2, or sreb3a
                                  genes (green, purple, and red, respectively). Sequences with greatest similarity to the novel sreb3b were also
                                  sorted (blue, see Fig. 1). Dotted lines correspond to: (1) the teleost-specific whole genome duplication event, (2)
                                  the first detection of sreb3b across fish evolution, and (3) the absence of sreb3a in Order Cyprinodontiformes
                                  (bracketed region).

Scientific Reports |   (2021) 11:12066 |               https://doi.org/10.1038/s41598-021-91590-9                                                   7

                                                                                                                                               Vol.:(0123456789)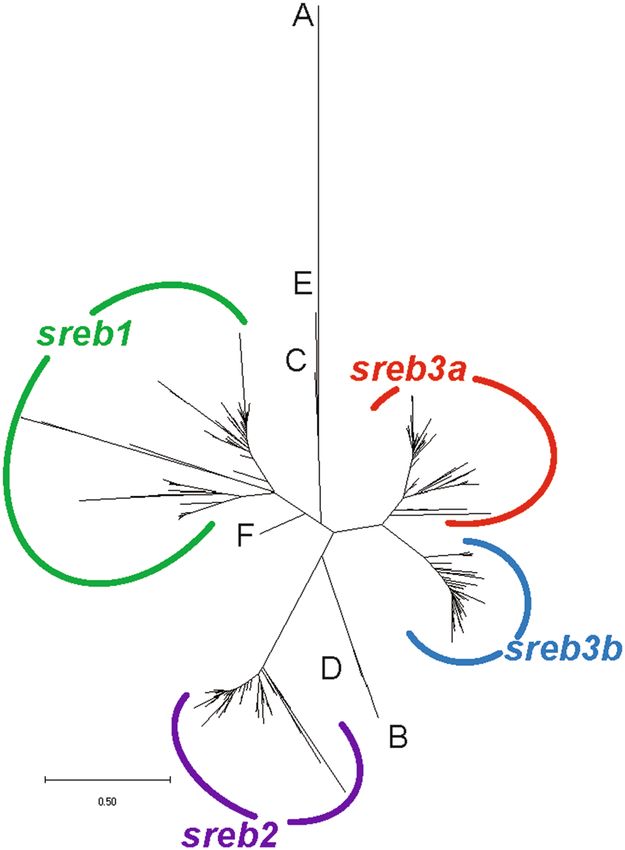
www.nature.com/scientificreports/
Figure 3. Microsynteny analyses conducted in SimpleSynteny51 for seven representative fish species
(Lepisosteus oculatus, Danio rerio, Esox lucius, Poecilia latipinna, Poecilia reticulata, Kryptolebias marmoratus,
and Dichotomyctere nigroviridis) and genomic locations corresponding to (A) sreb3a and (B) sreb3b. The dotted
blocks labeled 1 and 2 refer to the absence or presence of these sreb genes, respectively, in three representative
members of Order Cyprinodontiformes. Each bar refers to the species’ genomic sequence, while colored blocks
and lines refer to individual genes labeled at the bottom.
exhibited peak expression in early secondary growth and was six fold greater than in testicular stages (p < 0.0001),
before decreasing during vitellogenesis.
Characterizing sreb3b across organs. To better characterize the novel sreb3b gene, expression patterns
were assessed spatially within the killifish ovary, as well as broadly quantified with all sreb-related genes across
both killifish and puffer organs. Killifish ovary sreb3b mRNA was detected in all samples both within oocytes
and the throughout the somatic follicle cell wall (Fig. 8A). The strongest signals were detected within both pri-
mary growth oocytes and follicle cells surrounding vitellogenic oocytes. The negative control scramble probe did
not detect any non-specific signal (Fig. 8B), while the positive control actb1 probe produced abundant signals
throughout the ovary (Fig. 8C). Across killifish organs, sreb2 and sreb3b exhibited similar patterns, with elevated
expression in brain and eye (p < 0.0001 for both genes, Fig. 9A). However, sreb2 exhibited greater relative expres-
sion in the brain than sreb3b, compared to testis (67 fold and 11 fold greater, respectively). In contrast, smim20/
pnx expression in killifish exhibited an opposite pattern, with 20 fold higher expression in gonads than brain.
All other organs (gill, heart, liver, and intestine) exhibited largely similar, low overall expression of sreb-related
genes (Fig. 9A).
Across puffer organs, expression patterns were largely similar to killifish, with some exceptions (p < 0.0001
for all genes, Fig. 9B). First, eye signals were overall much lower in puffer and more similar to other organs, as
opposed to the brain. Second, smim20/pnx patterns were more ovary-dominated and significantly greater than
testis. In addition, some gonadal signals in puffer (sreb1 and sreb3a) were highly variable but overall equal to
brain levels, which was not detected in killifish. In contrast, sreb2 and sreb3b patterns in puffer were similar and
greatly upregulated in the brain (34 and 147 fold higher, respectively, compared to testis), which mirrored pat-
terns in killifish. Overall, these sreb3b patterns were more similar to sreb2 than either sreb1 or sreb3a (Fig. 9B).
Discussion
The sreb genes exhibited high sequence conservation across fishes. Only agnathans and a cartilaginous fish
exhibited receptors that could not be easily placed into established groups, which also occurs in other GPCRs68.
Preliminary synteny analyses in both hagfish and lamprey also confirmed some divergence from more derived-
fishes, including one hagfish genomic region that weakly matched flanking genes in both teleost sreb1 and sreb2
locations. Based on these patterns and the phylogenetic analysis, sreb1 and sreb2 likely emerged before sreb3 in
Scientific Reports | (2021) 11:12066 | https://doi.org/10.1038/s41598-021-91590-9 8
Vol:.(1234567890)www.nature.com/scientificreports/
Figure 4. SREB amino acid sequence comparisons. (A) Three dimensional model of Dichotomyctere nigroviridis
SREB1 was made using I-TASSER (C-score = −0.76), to show highly conserved seven transmembrane domains
(TM), elongated third intracellular loop (ICL3), and C-terminal region with the eighth α-helix (C-TER).
Other models for D. nigroviridis SREB2-3B and Danio rerio SREB1-3A also exhibited similar characteristics
(not shown). (B) Identification of highly conserved amino acid positions unique to SREB3B (yellow circles)
and SREB deviations from canonical GPCR functional motifs (red squares with first inset). The gray diagram
indicates GPCR structure with transmembrane α-helical domains (rectangles, TM1-TM7) and extracellular (top
gray lines, ECL) and intracellular (bottom gray lines, ICL) domains. The DRY, CWxP, and NPxxY canonical
motifs refer to Nygaard and colleagues55. Each amino acid position identified with a letter refers to > 94%
conservation across that SREB isoform in the dataset (positions labeled “x” are not highly conserved). The
position labeled “C/S” in SREB1 refers to a highly conserved cysteine (C) in many less-derived species but is
replaced with serine (S) in more-derived fishes (Neoteleosti). The bottom inset shows the eight residues (yellow)
that characterize SREB3B (bottom row) and are divergent but highly conserved across all other isoforms (top
row).
vertebrate evolution, but the origins of an ancestral vertebrate sreb remain unclear. In contrast, other genomic
patterns in more-derived fishes were evident, including the teleost-specific W GD69. Basal teleosts that diverged
early following the event, such as S. formosus and Paramormyrops kingleyae (Order Osteoglossiformes), exhibited
some duplicated sreb2 and sreb3a genes. Additional WGD events in other fishes were also apparent, including
carp (Order Cyprinidae), as well as salmonids, but not pike, within the P rotacanthopterygii69,70. Protacanthop-
terygii fishes were also the first lineage to exhibit evidence of a novel fourth member, putatively named sreb3b
or gpr173b, which was found as a single gene in northern pike (E. lucius). This evolutionary placement indicates
that sreb3b likely did not emerge from the teleost-specific WGD, but instead arose later in the Euteleosti lineage
as a separate gene duplication event from sreb3. The exact origin of sreb3b within the euteleosts is difficult to
identify without greater resolution though, as no genome was available for the closely related Order Lepidogalaxi-
iformes or other groups within the Protacanthopterygii71. The sreb3 duplication event hypothesis, however, is also
supported by the presence of flanking suv39h1 genes in both E. lucius genomic regions. Following duplication,
this suv39h1-like gene was likely lost in more-derived teleosts, while the sreb3b gene diverged and was retained.
The sreb3b gene is overall characterized by high similarity to other family members. For instance, all fish
SREBs exhibited similar protein structures and GPCR functional motifs, which are also shared in the three
mammalian receptors but differed from canonical s equences8,55. Although functional implications for these
Scientific Reports | (2021) 11:12066 | https://doi.org/10.1038/s41598-021-91590-9 9
Vol.:(0123456789)www.nature.com/scientificreports/
Figure 5. Florida gar (Lepisosteus platyrhincus) (A) representative gonadal histology and (B) relative mRNA
expression of sreb genes and smim20/pnx, normalized to 18S rRNA. Similar zebrafish (Danio rerio) stages
and relative mRNA expression are shown in C and D, respectively. The TS stage refers to testes with visible
spermiation and abundant mature spermatozoa, while OVV refers to ovaries with mid-late stage vitellogenic
oocytes. Each bar represents the mean ± standard error, and significant differences are indicated by *(p < 0.05),
**(p < 0.01) or ***(p < 0.0001). ap = animal pole, ca = cortical alveoli (secondary) oocyte, fc = follicle cell
wall, gv = germinal vesicle, po = primary oocyte, sc = spermatocytes, st = spermatids, sz = spermatozoa, and
vg = vitellogenin.
Scientific Reports | (2021) 11:12066 | https://doi.org/10.1038/s41598-021-91590-9 10
Vol:.(1234567890)www.nature.com/scientificreports/
Figure 6. Sailfin molly (Poecilia latipinna) (A) representative gonadal histology and (B) relative mRNA
expression of sreb genes and smim20/pnx, normalized to 18S rRNA. The TR and TS stages refer to regressed
testes without spermatozoa and testes with visible spermiation and abundant mature spermatozoa, respectively.
The OV + N, OV + EE, and OV + PE stages refer to ovarian tissues with either embryonic neurulation present,
eyed embryos, or late-stage pigmented embryos, respectively. Each bar represents the mean ± standard error,
and different letters indicate significant differences (p < 0.05). br = brain, em = embryo, ey = eye, nt = neural tube,
sc = spermatocytes, so = somite, st = spermatids, sz = spermatozoa, and yo = yolk.
Scientific Reports | (2021) 11:12066 | https://doi.org/10.1038/s41598-021-91590-9 11
Vol.:(0123456789)www.nature.com/scientificreports/
Figure 7. Green-spotted puffer (Dichotomyctere nigroviridis) (A) representative gonadal histology and (B)
relative mRNA expression of sreb genes and smim20/pnx, normalized using stable RNA input across samples
(2.5 μg). The TR and TS stages refer to regressed testes without spermatozoa and testes with visible spermiation
and abundant mature spermatozoa, respectively. The OVP, OVCA, and OVV stages refer to ovaries with
primary oocytes, cortical alveoli (early secondary growth) oocytes, or mid-late stage vitellogenic oocytes
respectively. Each bar represents the mean ± standard error, and different letters indicate significant differences
(p < 0.05). ca = cortical alveoli (secondary) oocyte, fc = follicle cell wall, gv = germinal vesicle, po = primary
oocyte, sc = spermatocytes, st = spermatids, sz = spermatozoa, and vg = vitellogenin.
Scientific Reports | (2021) 11:12066 | https://doi.org/10.1038/s41598-021-91590-9 12
Vol:.(1234567890)www.nature.com/scientificreports/
Figure 8. In situ hybridizations of (A) sreb3b, (B) scramble probe (negative control), and (C) actb1 (positive
control) in the African turquoise killifish (Nothobranchius furzeri) ovary (n = 3). ca = cortical alveoli (secondary)
oocyte, fc = follicle cell wall, gv = germinal vesicle, po = primary oocyte, and vo = vitellogenic oocyte.
changes are unknown in SREBs, the interaction between arginine (R) and asparagine (D) in the DRY motif is
generally important in keeping an inactive conformation55, and interactions with NPxxY in TM7 are important
for receptor activation and G protein signaling72. The highly conserved amino acid changes in both motifs may
therefore limit the inactive state and contribute to constitutive activity previously identified for some SREBs14.
Roles for other conserved amino acid changes, including the first position of the CWxP motif and the specific
Neoteleosti SREB1 change to S in NPxxY, are unknown and require more investigation. However, none of these
motifs were divergent in SREB3B. Instead, the novel receptor was characterized by eight unique and highly
conserved amino acid changes in other regions. These changes were clustered around TM3-5 and the third
intracellular loop, which are known to be important in ligand binding and G protein signaling, r espectively55.
SREB3B may differ from SREB3A in its ability to bind the PNX or GnRH-(1–5) ligands, or the receptor may use
alternative intracellular pathways.
Sreb3b expression patterns were also similar to other family members. Spatial patterns within the ovary sug-
gest both oocyte-derived and follicle cell expression, which largely mirrored sreb1 and sreb3a in zebrafish, Atlantic
cod, and human o vary35,40,44,66. Sreb3b expression within follicle cells may function similarly to sreb3a, which
regulates cell proliferation and follicular progression through vitellogenesis and m aturation35,40. In contrast, sreb-
related oocyte expression may be important as stored maternal transcripts for early embryonic development. In
the organ surveys, some differences were detected between sreb3b and other receptors. Here, sreb3b exhibited
the highest expression profile in the puffer brain. Puffer sreb3b patterns most closely matched sreb2, not sreb3a,
and these characteristics were similar in killifish. As such, retention and divergence of sreb3b following its gene
duplication event may be associated with brain-related functions. This high similarity between sreb2 and sreb3b
is also evident across genomes, where both were identified in nearly all possible genome assemblies, while the
other receptors (sreb1 and sreb3a) have likely been lost in some lineages.
The functional significance of sreb3a gene loss in Order Cyprinodontiformes is unknown, but it does highlight
that sreb sequence conservation across vertebrates does not indicate identical functions in all species. Indeed,
sreb3a loss may not even be unique to fish, as preliminary data by our group also suggest that this gene may
be absent across birds. Although sreb3 loss has been confirmed in chicken73, this is difficult to verify in other
species due to a lack of conservation in these genomic regions. Similarly, sreb1 loss in both killifish and medaka
(genus Oryzias, Fig. 2) is not certain, but searches in transcriptomic databases and across genome assemblies in
multiple species have not yet identified an orthologous sequence. In the future, these differences may be useful
to further our understanding of sreb-related gene functions, such as investigations of hypothalamic PNX across
diverse fishes.
Using a comparative approach, it was also evident that gonadal sreb patterns are not similar across fish evolu-
tion, while smim20/pnx is likely highly conserved. For instance, gar receptors were ovary-dominated for sreb3a
and more stable for sreb1, which may reflect involvement in similar processes to mammals. Teleosts, however,
were instead characterized by elevated testicular expression for most receptors, regardless of reproductive strat-
egy. SREB roles in testes are poorly understood, but testicular sreb3a was detected in zebrafish somatic support
cells, and PNX induces upregulation of steroidogenesis-related expression and dmrt1, which is critical in male
development40,74. As such, elevated sreb during early testicular stages in both sailfin molly and puffer likely reflect
effects in promoting testicular development. In contrast, smim20/pnx patterns were highly conserved across
fishes, with elevated patterns in ovaries that were particularly high in early stages. This pattern is characteristic
of an oocyte-derived message that may be stored for embryonic d evelopment44. Indeed, both sreb and smim20/
pnx patterns were elevated in sailfin molly embryos, which likely suggests their importance in nervous system
development across v ertebrates20. However, since PNX is a post-translational cleavage product, the pnx mRNA
signal is linked to mitochondrial smim20, and expression patterns here may better reflect broader SMIM20
roles in respiratory chain a ssembly25 as opposed to PNX-specific functions. As such, caution is necessary when
Scientific Reports | (2021) 11:12066 | https://doi.org/10.1038/s41598-021-91590-9 13
Vol.:(0123456789)www.nature.com/scientificreports/
Figure 9. Relative mRNA expression patterns for sreb genes and smim20/pnx in selected organs of (A) African
turquoise killifish (Nothobranchius furzeri), and (B) green-spotted puffer (Dichotomyctere nigroviridis). Relative
expression levels were normalized to RNA input quantity (0.6–2.5 μg). D. nigroviridis sreb3a was not detected in
most liver and intestine samples (n = 1 each). Each bar represents the mean ± standard error and different letters
indicate significant differences (p < 0.05).
interpreting smim20/pnx patterns. Overall though, these patterns suggest that SREBs may play an important role
in teleost early testicular development, and more work is needed to better understand these functions.
Conclusion
Although the SREB family is highly conserved across vertebrates, some fish exhibit characteristics that diverge
from mammals, including sreb3a gene loss and the acquisition of a novel sreb3b gene. Sreb3b did not arise dur-
ing the teleost WGD, but instead likely originated later as a gene duplication event of sreb3 in euteleosts. This
Scientific Reports | (2021) 11:12066 | https://doi.org/10.1038/s41598-021-91590-9 14
Vol:.(1234567890)www.nature.com/scientificreports/
novel receptor exhibits expression patterns similar to other family members but most closely matches patterns
for sreb2, not sreb3a. Gonad-specific patterns across teleosts were largely similar for all sreb-related genes and
suggests important roles in testicular development, while gar exhibited patterns somewhat closer to mammals.
Further research is needed to identify unique roles for sreb3b in specific brain regions, and gonadal functions for
all sreb genes should be evaluated. To this end, future SREB research could benefit from an integrated approach
across multiple family members, and recent work in the fish PNX/SREB3 system will be invaluable as functions
become better understood.
Data availability
All data generated or analyzed during this study are included in this published article and its Supplementary
Information files.
Received: 1 March 2021; Accepted: 28 May 2021
References
1. Fredriksson, R. & Schiöth, H. B. The repertoire of G-protein coupled receptors in fully sequenced genomes. Mol. Pharmacol. 67,
1414–1425 (2005).
2. Kroese, W. K., Sheffler, D. J. & Roth, B. L. G-protein-coupled receptors at a glance. J. Cell Sci. 116, 4867–4869 (2003).
3. Strotmann, R. et al. Evolution of GPCR: change and continuity. Mol. Cell. Endocrinol. 331, 170–178 (2011).
4. Hauser, A. S., Attwood, M. M., Rask-Andersen, M., Schiöth, H. B. & Gloriam, D. E. Trends in GPCR drug discovery: new agents,
targets and indications. Nat. Rev. Drug Discov. 16, 829–842 (2017).
5. Khan, M. Z. & He, L. Neuro-psychopharmacological perspective of orphan receptors of Rhodopsin (class A) family of G protein-
coupled receptors. Psychopharmacol. 234, 1181–1207 (2017).
6. O’Dowd, B. F. et al. Discovery of three novel G-protein-coupled receptor genes. Genomics 47, 310–313 (1998).
7. Hellebrand, S., Schaller, H. C. & Wittenberger, T. The brain-specific G-protein coupled receptor GPR85 with identical protein
sequence in man and mouse maps to human chromosome 7q31. Biochim. Biophys. Acta 1493, 269–272 (2000).
8. Matsumoto, M. et al. An evolutionarily conserved G-protein coupled receptor family, SREB, expressed in the central nervous
system. Biochem. Biophys. Res. Commun. 272, 576–582 (2000).
9. Matsumoto, M. et al. A conserved mRNA expression profile of SREB2 (GPR85) in adult monkey, human, and rat forebrain. Mol.
Brain Res. 138, 58–69 (2005).
10. Regard, J. B. et al. Probing cell type-specific functions of Gi in vivo identifies GPCR regulators of insulin secretion. J. Clin. Invest.
117, 4034–4043 (2007).
11. Ku, G. M. et al. Research resource: RNA-seq reveals unique features of the pancreatic β-cell transcriptome. Mol. Endocrinol. 26,
1783–1792 (2012).
12. Ku, G.M., Pappalardo, Z., Luo, C.C., German, M.S., McManus, M.T. An siRNA screen in pancreatic beta cells reveals a role for
gpr27 in insulin production. PLoS Genetics 8, e1002449 (2012).
13. Chopra, D. G., Yiv, N., Hennings, T. G., Zhang, Y. & Ku, G. M. Deletion of Gpr27 in vivo reduces insulin mRNA but does not result
in diabetes. Sci. Rep. 10, 5629 (2020).
14. Martin, A.L., Steurer, M.A., Aronstam, R.S. Constitutive activity among orphan class-A G protein coupled receptors. PLoS One
10, e0138463 (2015).
15. Yanai, T. et al. Identification and molecular docking studies for novel inverse agonists of SREB, super conserved receptor expressed
in brain. Genes Cells 21, 717–727 (2016).
16. Dupuis, N. et al. Activation of the orphan G protein-coupled receptor GPR27 by surrogate ligands promotes β-arrestin 2 recruit-
ment. Mol. Pharmacol. 91, 595–608 (2017).
17. Chen, Q. et al. SREB2/GPR85, a schizophrenia risk factor, negatively regulates hippocampal adult neurogenesis and neurogenesis
dependent learning and memory. Eur. J. Neurosci. 36, 2597–2608 (2012).
18. Hellebrand, S., Wittenberger, T., Schaller, H. C. & Hermans-Borgmeyer, I. Gpr85, a novel member of the G-protein coupled recep-
tor family, prominently expressed in the developing mouse cerebral cortex. Gene Expr. Patterns 1, 13–16 (2001).
19. Jeon, J. et al. Cloning and localization of rgpr85 encoding rat G-protein-coupled receptor. Biochem. Biophys. Res. Commun. 298,
613–618 (2002).
20. Matsumoto, M. et al. The evolutionarily conserved G protein-coupled receptor SREB2/GPR85 influences brain size, behavior, and
vulnerability to schizophrenia. Proc. Natl. Acad. Sci. 105, 6133–6138 (2008).
21. Radulescu, E. et al. Effect of schizophrenia risk-associated alleles in SREB2 (GPR85) on functional MRI phenotypes in healthy
volunteers. Neuropsychopharmacol. 38, 341–349 (2013).
22. Fujita-Jimbo, E. et al. The association of GPR85 with PSD-95-neuroligin complex and autism spectrum disorder: a molecular
analysis. Mol. Autism 6, 17 (2015).
23. Yosten, G. L. et al. A novel reproductive peptide, phoenixin. J. Neuroendocrinol. 25, 206–215 (2013).
24. Larco, D. O., Semsarzadeh, N. N., Cho-Clark, M., Mani, S. K. & Wu, T. J. The novel actions of the metabolite GnRH-(1–5) are
mediated by a G protein-coupled receptor. Front. Endocrinol. 4, 83 (2013).
25. Mcilwraith, E. K. & Belsham, D. D. Phoenixin: uncovering its receptor, signaling and functions. Acta Pharm. Sinic. 39, 774–778
(2018).
26. Larco, D. O., Cho-Clark, M., Mani, S. K. & Wu, T. J. The metabolite GnRH-(1–5) inhibits the migration of immortalized GnRH
neurons. Neuroendocrinol. 154, 783–795 (2013).
27. Bauman, B. M., Yin, W., Gore, A. C. & Wu, T. J. Regulation of gonadotropin-releasing hormone-(1–5) signaling genes by estradiol
is age-dependent. Front. Endocrinol. 8, 282 (2017).
28. Cho-Clark, M. et al. GnRH-(1–5) transactivates EGFR in Ishikawa human endometrial cells via an orphan G protein-coupled
receptor. Mol. Endocrinol. 28, 80–98 (2014).
29. Rocca, C. et al. Pheonixin-14: detection and novel physiological implications in cardiac modulation and cardioprotection. Cell.
Mol. Life Sci. 75, 743–756 (2018).
30. Lyu, R.-M. et al. Phoenixin: a novel peptide in rodent sensory ganglia. Neurosci. 250, 622–631 (2013).
31. Jiang, J. H. et al. Effects of pheonixin-14 on anxiolytic-like behavior in mice. Behavior Brain Res. 286, 39–48 (2015).
32. Jiang, J. H. et al. Phoenixin-14 enhances memory and mitigates memory impairment induced by Abeta1-42 and scopolamine in
mice. Brain Res. 1629, 298–308 (2015).
33. Treen, A. K., Luo, V. & Belsham, D. D. Phoenixin activates immortalized GnRH and kisspeptin neurons through the novel receptor
GPR173. Mol. Endocrinol. 30, 872–888 (2016).
34. Schalla, M. et al. Phoenixin-14 injected intracerebroventricularly but not intraperitoneally stimulates food intake in rats. Peptides
96, 53–60 (2017).
Scientific Reports | (2021) 11:12066 | https://doi.org/10.1038/s41598-021-91590-9 15
Vol.:(0123456789)You can also read