Composite development and stratigraphy of the Onepoto maar lake sediment sequence (Auckland Volcanic Field, New Zealand)
←
→
Page content transcription
If your browser does not render page correctly, please read the page content below
Progress Reports
Sci. Dril., 29, 19–37, 2021
https://doi.org/10.5194/sd-29-19-2021
© Author(s) 2021. This work is distributed under
the Creative Commons Attribution 4.0 License.

       Composite development and stratigraphy of the Onepoto
                   maar lake sediment sequence
              (Auckland Volcanic Field, New Zealand)
               Benjamin Läuchli1 , Paul Christian Augustinus1 , Leonie Peti1 , and Jenni Louise Hopkins2
          1 School   of Environment, The University of Auckland, Private Bag 920129, Auckland 1142, New Zealand
          2 School   of Geography, Environment and Earth Sciences, Victoria University of Wellington, P.O. Box 600,
                                               Wellington 6140, New Zealand
                              Correspondence: Benjamin Läuchli (bluc030@aucklanduni.ac.nz)

           Received: 28 October 2020 – Revised: 2 February 2021 – Accepted: 25 February 2021 – Published: 26 April 2021

       Abstract. The accurate and precise reconstruction of Quaternary climate as well as the events that punctuate it
       is an important driver of the study of lake sediment archives. However, until recently lake sediment-based palaeo-
       climate reconstructions have largely concentrated on Northern Hemisphere lake sequences due to a scarcity of
       continuous and high-resolution lake sediment sequences from the Southern Hemisphere, especially from the
       southern mid-latitudes. In this context, the deep maar lakes of the Auckland Volcanic Field of northern New
       Zealand are significant as several contain continuous and well-laminated sediment sequences. Onepoto Basin
       potentially contains the longest temporal lake sediment record from the Auckland Volcanic Field (AVF), span-
       ning from Marine Isotope Stage 6e (MIS 6e) to the early Holocene when lacustrine sedimentation was terminated
       by marine breach of the south-western crater tuff ring associated with post-glacial sea-level rise. The Onepoto
       record consists of two new, overlapping cores spanning ca. 73 m combined with archive material in a complete
       composite stratigraphy. Tephrochronology and 14 C dating provide the fundamental chronological framework for
       the core, with magnetic relative palaeo-intensity variability downcore, and meteoric 10 Be influx into the palae-
       olake to refine the chronology. The µ-XRF (micro X-ray fluorescence) downcore variability for the entirety of
       the lake sediment sequence has been established with measurement of a range of proxies for climate currently
       underway. This work will produce the first continuous record of the last 200 kyr of palaeoclimate from northern
       New Zealand to date.

1   Introduction                                                   et al., 2003; Zolitschka et al., 2013). In contrast to the North-
                                                                   ern Hemisphere where long, high-resolution late Quaternary
Deep-lake sediment archives allow for the development of           terrestrial palaeoclimate archives are common and are well
a more comprehensive interpretation of past climatic and           studied (e.g., the Eifel maar lakes in Germany; Sirocko et
environmental evolution during the Quaternary than other           al., 2016), their New Zealand lake counterparts are few, of-
continental climate archives, such as tree rings, peat bogs,       ten show poor resolution, and suffer from age controversies
and speleothems, and are often less prone to hiatuses than         (e.g., Molloy et al., 2009; Hopkins et al., 2017). The Auck-
loess and fluvial deposits (Zolitschka and Enters, 2009). Sed-     land maar lakes are crucial in the context of the Southern
iments deposited in maar lakes often record regional climate       Hemisphere mid-latitudes as they contain archives represen-
signals due to the typically funnel-shaped crater structure        tative of past south-western Pacific climate variability (Al-
of the maars and absence of major inlets and outlets (e.g.,        loway et al., 2007). Furthermore, the location of Auckland is
Marchetto et al., 2015), thereby minimising the flux of al-        ideal for palaeoclimate studies, since it is located at the eco-
lochthonous sediment and other material into the lake basin        logical boundary between the subtropical northern tip of New
(e.g., Brauer et al., 1999; Augustinus et al., 2011; Sandiford

Published by Copernicus Publications on behalf of the IODP and the ICDP.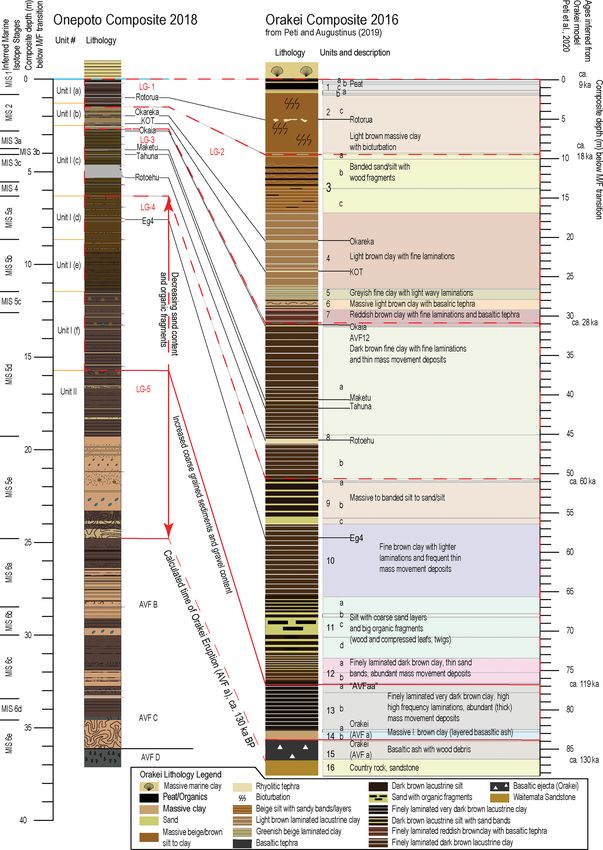
20                B. Läuchli et al.: Composite development and stratigraphy of the Onepoto maar lake sediment sequence

Zealand’s North Island and the cooler central North Island as     the formative phreatomagmatic eruption, a freshwater lake
well as regions further south (Augustinus et al., 2012).          developed in the maar fed by groundwater seepage and pre-
   The maar lakes of the Auckland Volcanic Field (AVF)            cipitation runoff from the crater rim. The maar lake persisted
provide long, continuous, high-resolution (decadal to sub-        until an early Holocene sea-level rise breached the south-
decadal), high-quality, laminated sediment records suitable       western crater tuff ring, transforming the basin into an estu-
for detailed examination of south-west Pacific palaeoclimate      arine lagoon ca. 9.0 ka cal BP (Hägg and Augustinus, 2003;
over the last 200 kyr (Hopkins et al., 2017). Lacustrine se-      Hayward et al., 2008; Augustinus et al., 2011). The present-
quences of comparable continuity and resolution are rarely        day Onepoto Basin (Fig. 1a) is occupied by a mixture of
encountered in the terrestrial mid-latitudes of the Southern      recreational parklands and wetlands whilst the surrounding
Hemisphere and tend to cover shorter timescales. Further-         tuff ring is densely covered with residential housing. The drill
more, many distinct tephra layers from local basaltic ac-         core presented in this study was recovered in 2018 from a
tivity (e.g., AVF) or rhyolitic and andesitic volcanic cen-       central section of the crater in an area of profundal sedimen-
tres (VCs) further afield (e.g., Taupo Volcanic Zone (TVZ),       tation based on previous exploratory drilling (Fig. 1a; Hägg
Egmont/Taranaki Volcanic Centre (TaVC)) are preserved in          and Augustinus, 2003; Augustinus et al., 2012).
these lacustrine archives (e.g., Shane and Hoverd, 2002; Mol-
loy et al., 2009; Hopkins et al., 2015) and form isochronous
                                                                  3     Methods
markers for stratigraphic correlation to other maar lake sed-
iment sequences (Molloy et al., 2009). In particular, a num-      3.1    Coring
ber of independently dated rhyolitic tephra allow for well-
established age control for the past ca. 45 kyr (Danišík et       A first scientific drilling campaign at Onepoto Basin in the
al., 2012). Pre-45 ka ages, of the rhyolitic, andesitic, and      years 2001/2002 produced a continuous lake sediment se-
basaltic tephra, are often not well constrained, with their age   quence to a depth of ∼ 60 m below the surface. This initial
estimates in many cases relying on interpolation from sed-        work produced a scientific drilling report (Hägg and Augusti-
imentation rates between known-age TVZ-sourced rhyolitic          nus, 2003) and further publications (e.g., Shane and Hoverd,
tephra and correlation with the source volcanoes (Molloy et       2002; Shane and Sandiford, 2003; Augustinus et al., 2011,
al., 2009; Lindsay et al., 2011; Peti and Augustinus, 2019).      2012). In 2011, another attempt to extract a complete se-
Furthermore, a range of proximal basaltic tephra (correlated      quence of lake sediment infill from the Onepoto maar crater
to their source centres in the AVF) also provide additional       was undertaken to refine the incomplete tephra record con-
age markers within the cores (Hopkins et al., 2017, 2020;         tained in Shane and Hoverd (2002) and Molloy et al. (2009).
Leonard et al., 2017).                                            However, core disturbance and loss during extraction did not
   Here we present a palaeolake sediment record from              allow for the development of a complete sediment sequence.
Onepoto maar that provides one of the few known oppor-            Consequently, a new drilling campaign occurred in Octo-
tunities for the identification of climatically forced environ-   ber/November 2018 and recovered a minimally disturbed and
mental changes from the Southern Hemisphere mid-latitudes         overlapping sedimentary sequence via two adjacent cores
spanning much of the last ca. 200 kyr (Hopkins et al., 2017).     that spanned the complete lacustrine sequence. The locations
This report (1) details the approach used to construct a new      of all coring sites are given in Fig. 1a.
robust composite stratigraphy for the Onepoto Basin lacus-           The drilling was undertaken using a Fraste XL 170 Duo
trine sequence and (2) highlights the potential of the Onepoto    mobile-drilling rig (rotary and sonic capable). Due to the soft
sediment sequence for investigation of how Southern Hemi-         nature of the sediments, the sonic function of the drilling
sphere and inter-hemispheric climate dynamics are linked at       rig was initially used to ensure the recovery of undisturbed
high-precision over the last two glacial cycles.                  lake sediment core segments. However, issues were encoun-
                                                                  tered when drilling through the wet expansive muds/clays
                                                                  while operating the drill rig in the sonic mode. Better drilling
2    Study site                                                   progress was made (and a higher recovery rate of undisturbed
                                                                  core samples achieved) by simply operating the rig with its
The maar studied here is located on modern-day Auckland’s         standard rotary function. The rig was set up near the cen-
North Shore (Fig. 1d) and is the product of an explosive          tre of the Onepoto domain (Fig. 1a; degree–minute–second
phreatomagmatic eruption that is proposed to have occurred        (DMS) coordinates: 36◦ 480 3000 S, 174◦ 450 100 E), correspond-
not long after the formation of adjoining Lake Pupuke maar        ing to the depocentre of the maar crater defined from gravity
(mean age 193.2 ± 2.8 ka by 40 Ar / 39 Ar dating; Leonard         and magnetic surveys (Nunns and Hochstein, 2019). A set of
et al., 2017) based on morphostratigraphy (Hopkins et al.,        two overlapping cores (A and B cores) with 50 cm vertical
2017). However, 39 Ar–40 Ar dating of basaltic lapilli at-        and 4 m lateral offset between them was collected in 1.5 and
tributed to the formative eruption of Onepoto maar indicates      2 m long barrels, both with an internal diameter of 80 mm.
that the age of maar formation may be as old as 245 ± 40 ka       The filled core barrels were brought to the surface, and the
(Sandiford et al., 2003; Shane and Sandiford, 2003). After        sediments extruded into split PVC tubes. The upper 40 m

Sci. Dril., 29, 19–37, 2021                                                            https://doi.org/10.5194/sd-29-19-2021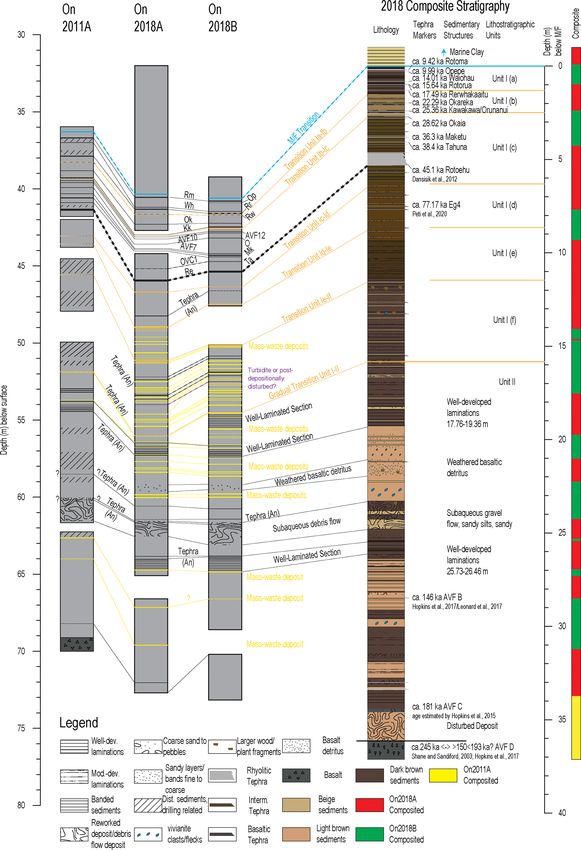
B. Läuchli et al.: Composite development and stratigraphy of the Onepoto maar lake sediment sequence                                    21

Figure 1. (a) Aerial photograph of the Onepoto domain study site with location of recent (2018; DMS coordinates: 36◦ 480 3000 S,
174◦ 450 100 E; source from the LINZ Data Service and licensed for reuse under Creative Commons Attribution 4.0 New Zealand licence)
and previous (2001–2002/2011) coring episodes (aerial footage sourced from the LINZ Data Service and licensed for reuse under the Cre-
ative Commons Attribute 4.0 New Zealand licence). (b) Overview of the North Island and South Island of New Zealand. (c) The North Island
of New Zealand with its major volcanic centres. (d) The Auckland region with the location of significant maars that formed freshwater lakes
in the AVF highlighted in blue.

of the overall sedimentary sequence consisted of estuarine              tures. Most lithostratigraphic units were identified follow-
mud of which ∼ 39 m was washed out before retrieving the                ing conventional methods and often exhibit distinct contacts
underlying target laminated lake sediments ∼ 1 m above the              between units. Individual units contain sediments of similar
marine–freshwater transition. Before the laminated lake sed-            colour and character as well as the presence of laminations in
iment extraction was initiated, the boreholes were cased to             some cases. Identified sub-units differentiate between inter-
prevent borehole closure during the deeper drilling. A max-             vals of smaller differences in colour, composition as well as
imum drilling depth of 73.2 m was achieved. However, the                the presence, quality, and thickness of laminations and bands.
basalt lava encountered at the base of the core during the
2011 coring was not reached due to high water pressures at
depth which prevented further drilling progress.                        3.3   µ-XRF core scanning and low-field volumetric
                                                                              magnetic susceptibility

3.2   Core description and visual facies identification                 The sediment cores were scanned with an Itrax µ-XRF core
                                                                        scanner (Cox Analytical Systems, Sweden) at the School of
The core sections were logged immediately after core split-             Environment, The University of Auckland, New Zealand.
ting during preparation of the individual half core segments            The approach of µ-XRF core scanning involves very little
for X-ray-density and µ-XRF (micro X-ray fluorescence)                  sample preparation and is nondestructive (Croudace et al.,
core scanning. All core surfaces were logged in a field-moist           2006; Croudace and Rothwell, 2015). To establish a down-
state (examples of representative core sections are given in            core record of elemental variability, measurements were
Fig. 5) and described visually with regards to thickness and            taken at 1 mm increments with 10 s exposure time per mea-
shape of laminations and sedimentary banding, sediment                  surement point. Both Mo (at 30 kV, 55 mA) and Cr tubes
colour (Munsell Soil Color Chart 1992), approximated grain              (at 60 kV, 30 mA) were used as X-ray sources to achieve an
size (clay, silt, fine to coarse sand), bioturbation, macroscopic       excitation of the full range of detectable elements (Mg (by
plant fragments, charcoal content, vivianite, volcanic ash lay-         Cr tube) and Al–U) with both increased detection precision
ers (tephra), and visible disturbance of sedimentary struc-             for heavier (Mo tube = Z ≥ 26) as well as lighter elements

https://doi.org/10.5194/sd-29-19-2021                                                                       Sci. Dril., 29, 19–37, 2021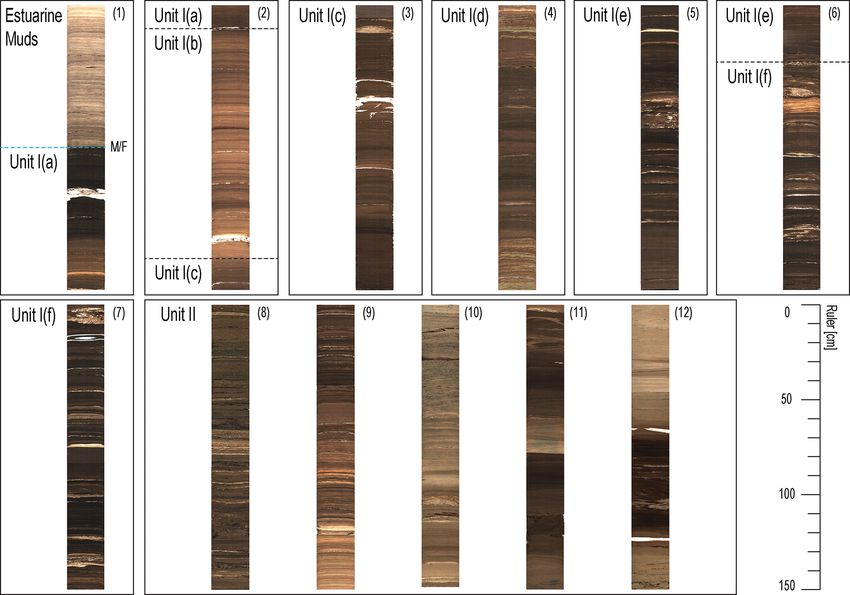
22               B. Läuchli et al.: Composite development and stratigraphy of the Onepoto maar lake sediment sequence

(Cr tube = Z ≤ 26; Jarvis et al., 2015; St.-Onge et al., 2007).   (accelerator mass spectrometry) facility at ANSTO following
Additionally, high-resolution optical images (47 µm) and ra-      the procedure outlined in Fink et al. (2004). Rbacon (version
diographic images (at 60 kV, 50 mA; at 1 mm) were also            2.4.3; Blaauw and Christen, 2011) in R (version 1.3.1073; R
produced during the scanning process. Supplementary high-         Core Team, 2020) was used to calibrate AMS 14 C ages us-
resolution radiographic images (0.2 mm resolution) were ob-       ing the latest SHCal20 calibration (Hogg et al., 2020) and for
tained with the aim to reveal sedimentary layers and grains,      construction of the preliminary age model.
fine tephra beds and to identify pieces of wood/bark or seeds
for 14 C dating (Croudace et al., 2006; Francus et al., 2009;     3.6   Composite stratigraphy development and core
Croudace and Rothwell, 2015). Low-field volumetric mag-                 chronology
netic susceptibility was recorded for all cores with a hand-
held Bartington MS2 with a MS2e surface scanning sensor           The 2018 A and B core segments were correlated using
system at 5 mm increments and the range scale set to 0.1.         guidelines outlined in Peti and Augustinus (2019). Initial
Core sections from the 2011 campaign were also scanned            core section matching was guided by the vertical offset (here
with the Itrax µ-XRF elemental core scanner using a Mo tube       0.5 m) between cores A and B, with the marine–freshwater
(at 30 kV, 55 mA) to facilitate correlation with the new 2018     transition (M/F) used as a top-of-core reference horizon to
sequence. XRF data were acquired by following the same            enable comparison to previous work at Onepoto Basin (e.g.,
method as for the 2018 cores.                                     Augustinus et al., 2011, 2012). Core matching was mainly
                                                                  achieved using the following:
3.4   Tephra identification based on geochemical                   1. Geochemical fingerprinting and correlation of tephra
      fingerprinting                                                  layers,

Eighty five out of the identified 89 tephra horizons were sam-     2. Comparison of high-resolution optical and X-ray den-
pled for geochemical fingerprinting from the newly obtained           sity images,
sediment cores and sieved (mesh size = 36 µm) under dis-
                                                                   3. Correlation of magnetic susceptibility and µ-XRF data
tilled water at The University of Auckland (New Zealand).
                                                                      (Ti normalised against inc+coh; with a Mo tube as X-
Further sample preparation and the analysis itself on an elec-
                                                                      ray source).
tron micro-probe analyser (EMPA) were conducted at Vic-
toria University of Wellington (New Zealand). Each sample            Figure 2 provides a depiction of core section alignment
was poured into a hole of a mount and then filled with epoxy      using high-resolution optical images, Itrax µ-XRF and low-
resin. Afterwards, the pugs were thoroughly shaken to re-         field volumetric magnetic susceptibility data.
move air bubbles before being left to cure. Once fully solidi-       Due to the proximity of the A and B core drill sites
fied, the bottom side of the samples was polished stepwise to     (∼ 4 m), marker layers, such as tephra layers, mass move-
expose fresh glass shard surfaces. The quality of the polished    ment deposits, distinct segments with well-laminated sedi-
surface and its cleanliness were checked under the micro-         ments, and features representative for individual lithostrati-
scope. In a final step the individual pugs were carbon coated.    graphic units, were generally encountered in the overlap-
The geochemical analyses were run using a JEOL JXA 8230           ping core sections. However, a tendency for an increased
Superprobe using the following instrument settings: 15 kV         variability in thickness of sedimentary features between the
acceleration voltage and ∼ 8 nA beam current for glass anal-      A and B cores was noted at depths >46 m. This is in ac-
ysis. Matrix-matched standard A99 basaltic glass was used         cordance with previous studies which have found that even
as a bracketing standard, while for rhyolitic and intermediate    in close-proximity cores from deep maar lake basin envi-
glass samples VG-568 was used. To avoid instrument drift,         ronments, corresponding sedimentary features can differ in
standards were run every 20 samples.                              thickness between adjacent cores (e.g., Peti and Augustinus,
                                                                  2019; Poth and Negendank, 1993; Williams et al., 1993).
3.5   Radiocarbon dating
                                                                  Core segments expanded significantly after extraction and re-
                                                                  moval of the sediment overburden, especially where the seg-
The 14 C age determinations were carried out on seven             ments were dominated by soft, organic-rich mud. To correct
bulk sediment samples. Preparation for the analysis in-           for this, the specific core segments were compressed by a
volved physical pre-treatment (sample drying, gentle break        factor equivalent to the amount of expansion (range of ex-
up, transferred to a centrifuge tube and weighed on a balance)    pansion in certain cases up to 30–50 cm), with the drill rod
at The University of Auckland (New Zealand) and several           length (1.5 or 2 m) being the measure. Table S1 in the Supple-
steps of standard chemical pre-treatment of organic samples       ment provides an overview on the amount of expansion and
from sediments (first HCl acid washing, NaOH alkali treat-        adjusted depths for the composite record build. The relative
ment and final HCl acid treatment) at ANSTO (Australian           positions of related data points (e.g., loss-on-ignition, sedi-
Nuclear Science and Technology Organisation, Sydney, Aus-         ment carbon/nitrogen and stable isotope content, biomarker,
tralia). The analyses were undertaken at the ANTARES AMS          and pollen sampling) have been recalculated accordingly.

Sci. Dril., 29, 19–37, 2021                                                            https://doi.org/10.5194/sd-29-19-2021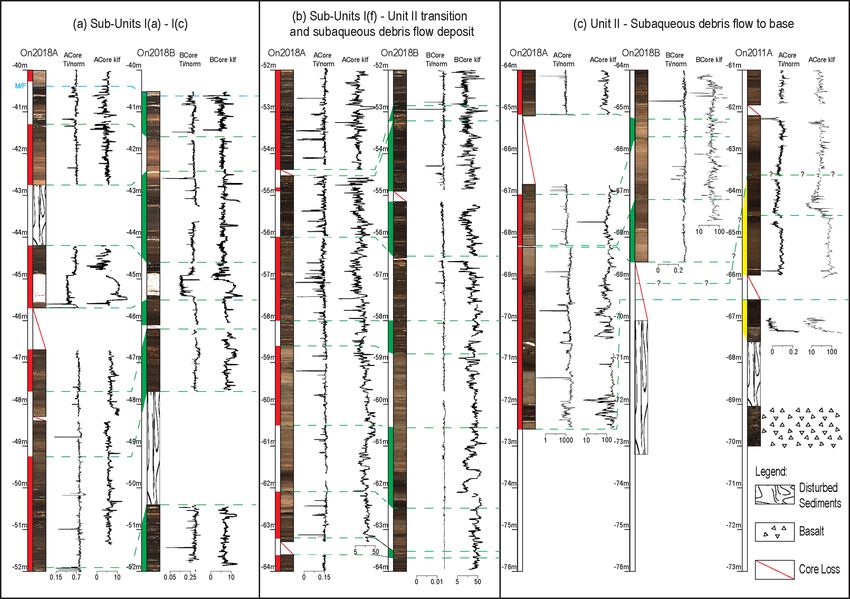
B. Läuchli et al.: Composite development and stratigraphy of the Onepoto maar lake sediment sequence 23
Figure 2. Schematic depiction of core section alignment using high-resolution optical images, Itrax µ-XRF Ti/norm., and low-field volumet-
ric magnetic susceptibility (klf) data (dimensionless Si units × 10−5 ). Red highlights the 2018 core A (ACore) sample chosen for composite;
green highlights the 2018 core B (BCore) sample chosen for composite; and yellow highlights the 2011 core A archive material chosen for
composite. Symbol * represents normalisation with inc+coh to correct for variability in water and organic matter content, grain size, and
ageing of the X-ray tube (Löwemark et al., 2011; Kylander et al., 2012).
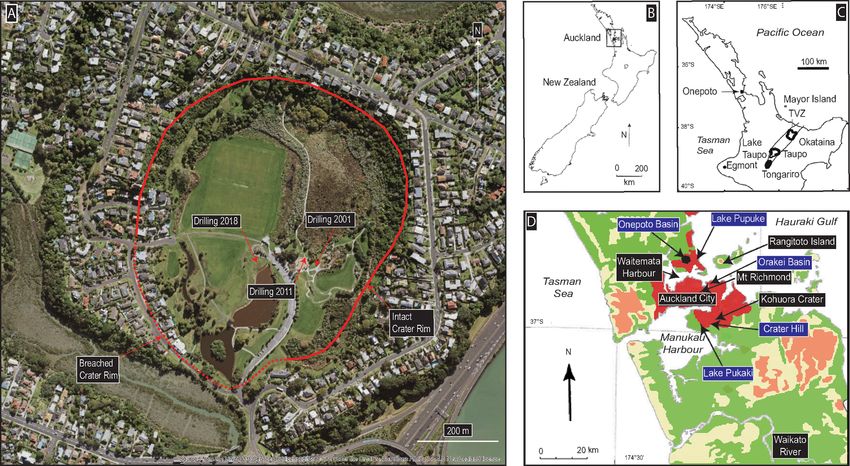
A complete composite record that spans the entire la- model for the laminated lacustrine sequence was produced by
custrine sequence was established by linking the A and B Hägg and Augustinus (2003) from a single and incomplete
cores from the 2018 drilling with archive core material from core retrieved ca. 200 m east of the crater centre (Fig. 1). In
the 2011 coring campaign. An event-corrected depth scale general, the existing lithostratigraphic model could be trans-
(ECD) was established by removal of all identified instanta- ferred to the 2018 sequence, with individual unit boundaries
neous event deposits (89 primary tephra and 211 mass move- usually encountered at similar depths. Detailed descriptions
ment deposits: total thickness of tephra and mass movement of the individual units are provided in Table 1 and are de-
layers of ∼ 6.90 m). Mass influx material could usually be picted in Fig. 3. The sequence was divided into two main
identified visually or using the radiographic images. If not al- units and six individual sub-units for Unit I. However, the
ready visually distinct, tephra layers were identified through underlying Unit II could not easily be subdivided into indi-
a combination of magnetic susceptibility measurements (e.g., vidual sub-units during logging due to the lack of clear tran-
increased Fe content (magnetite) in basaltic tephra), µ-XRF sitions from one facies type to the next and frequent disrup-
core scanning (Si and Sr were found to be the most reliable tion of the sequence by mass-wasting deposits. Furthermore,
elements for rhyolitic tephra layer identification) and X-ray Unit II differs from Unit I in containing many mass move-
density images. ment deposits (centimetre- to metre-scale thickness) and in-
washed organic detritus that was only found sporadically in
sub-units I(e) and I(f). A sharp contact that would mark the
4 Results and discussion transition from Unit I to Unit II could not be identified. In
our model an approximated boundary was defined based on
4.1 Lithostratigraphic units the onset of increased presence of coarse sand to gravel-rich
layers. The main difference between the 2001/02 and 2018
The laminated lake sediments are overlain by ∼ 40 m of es-
records lies in facies Unit II being 10.45 m thicker in the
tuarine muds (see Figs. 3 and 4). A general lithostratigraphic
https://doi.org/10.5194/sd-29-19-2021 Sci. Dril., 29, 19–37, 2021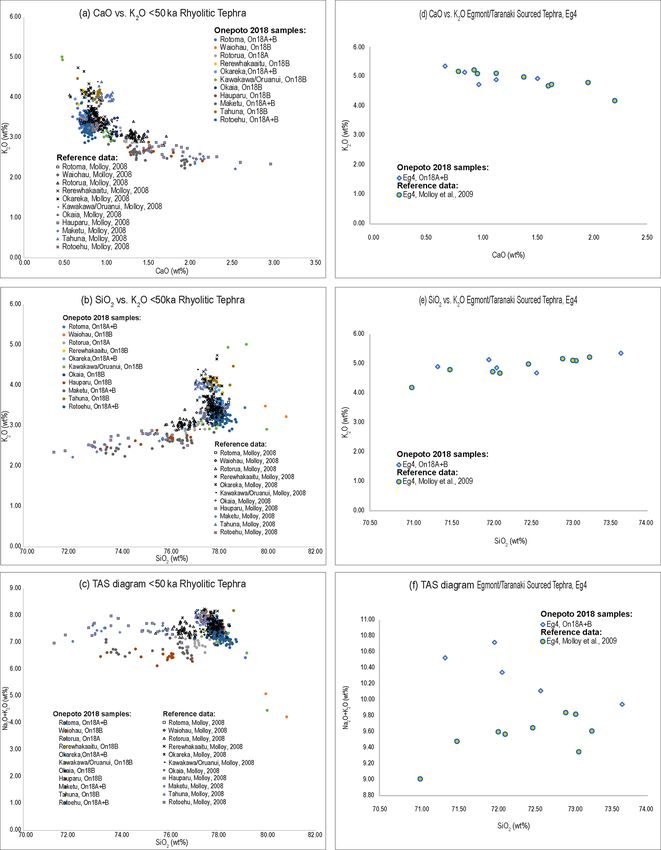
24               B. Läuchli et al.: Composite development and stratigraphy of the Onepoto maar lake sediment sequence

2018 core collected at the centre of the maar lake. This in-       a non-conclusive overlap and a less robust stratigraphic
dicates that the bulk of mass movement material transported        cross-correlation. Additionally, three AVF-sourced basaltic
into the basin accumulated in the depocentre of the basin.         deposits (AVF B, AVF C and AVF D) have been assigned
A cross-section of the crater established based on the results     based on stratigraphic position relative to the established
of all three coring campaigns confirms a nearly bowl-shaped        AVF tephrochronology (Hopkins et al., 2015; Molloy et
geometry (Fig. 4) for the crater as proposed by Nunns and          al., 2009), whereas the vertical position of AVF 1 recently
Hochstein (2019). However, a reported primary estimate of          calculated to 90.435 ± 1.555 ka cal BP (Peti et al., 2021) to
63 m for the depth of crater infill (Nunns and Hochstein,          date could not be reliably identified. The latter, however, is
2019) is not supported by the coring results produced from         subject of further investigation by applying klf and µ-XRF
the recent 2011 and 2018 drill holes from which we deduce          downcore variability data trends matching from relevant
an overall thickness of 73.2 m. For the newly established          sections of the Onepoto and the Orakei record. All assigned
composite record presented here, we rule out doubling up           eruptive events with ages are summarised in Table 2.
of core segments as a reason for the significant difference
in length between the two cores while building the new com-        4.3   Radiocarbon dating
posite sedimentary sequence since the preserved sedimentary
features, when combined with the µ-XRF and magnetic sus-           All seven radiocarbon ages obtained from the Onepoto core
ceptibility data, allow for straightforward core correlation.      on bulk organic matter are summarised in Table 3. Terrestrial
Furthermore, a comparison of the overall thickness of the la-      macro-organic remains, which are commonly more prefer-
custrine sequence as recorded in the 2011 and the new 2018         able for 14 C dating, were not available from the 50 ka part of the record, the andesitic “Eg4” tephra
presented here are depicted in Fig. 6. This has allowed for        (77.165 ± 1.5 ka; Peti et al., 2021) allows for correlation
a direct transfer of published ages onto the Onepoto lake          with the newly refined Orakei maar crater lake sediment
sediment sequence. The corresponding glass analysis data           record (Peti and Augustinus, 2019; Peti et al., 2020). Basaltic
are provided in Table S2 of the Supplement. Figure 7a to           ejecta dating back to the early stages of Onepoto maar lake
c depict how well the EMPA geochemistry for the probed             formation (AVF D) are used as age tie points (AVF B,
rhyolitic tephra overlap with the glass-based reference            146.9 ± 2.8 ka; Hopkins et al., 2017; Leonard et al., 2017;
data available from Molloy (2008) and reflect the expected         AVF C, estimated age 181 ± 0.6 ka; Hopkins et al., 2017).
geochemistry of the eruptive centres from which the indi-          The age of maar formation is currently proposed to have oc-
vidual tephra beds originate, analogues to the descriptions        curred >150 ka and
B. Läuchli et al.: Composite development and stratigraphy of the Onepoto maar lake sediment sequence                                     25

Figure 3. Onepoto maar palaeolake composite stratigraphy, lithological descriptions, and tephra marker layers. Tephra abbreviations:
Rm = Rotoma; Wh = Waiohau; Rr = Rotorua; Rw = Rerewhakaaitu; Ok = Okareka; Kk = Kawkawa/Oruanui; Op = Opepe; AVF 12, AVF
10, AVF 7 = basaltic tephra, AVF sourced (Molloy et al., 2009); O = Okaia; Mk = Maketu; Ta = Tahuna; OVC1 = rhyolitic tephra, Okataina
Volcanic Centre sourced (Molloy et al., 2009); Re = Rotoehu; An = andesitic tephra. Detailed lithostratigraphic descriptions are provided in
Table S1 of the Supplement.

https://doi.org/10.5194/sd-29-19-2021                                                                        Sci. Dril., 29, 19–37, 2021
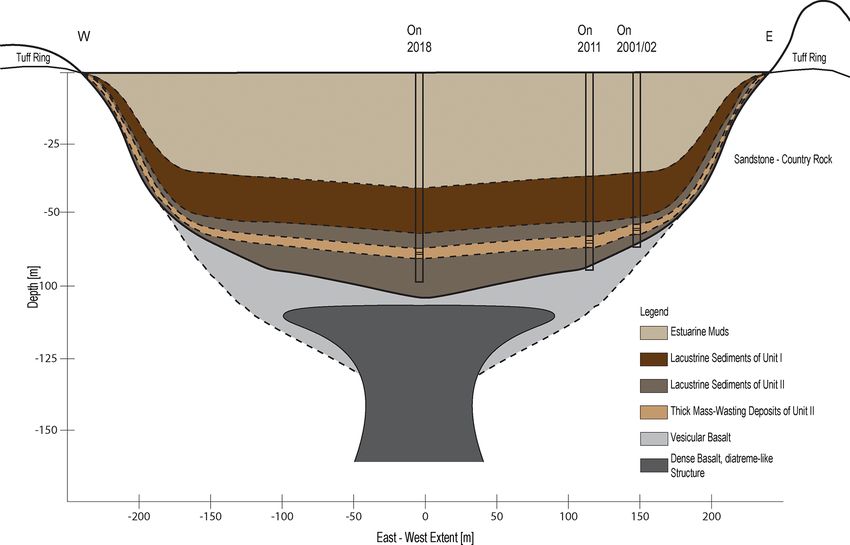
26                 B. Läuchli et al.: Composite development and stratigraphy of the Onepoto maar lake sediment sequence

Figure 4. Cross-section of the crater and its infill. Extent and position of diatreme-like structure under the crater and vesicular basalt at depth
guided by descriptions in Nunns and Hochstein (2019) as well as drill core findings (On2011, On2001/02) for the latter. Thickness and lateral
extent of major lithostratigraphic units taken or estimate based on drill core findings (On2018, On2011, and On2001/02).

Figure 5. High-resolution core section images representative of the main facies units (Unit I and Unit II) as well as the six sub-units of Unit I
(I(a) to I(e)). The depicted core images are ca. 1.5 m long. An = andesitic tephra, B = basaltic tephra, Rh = rhyolitic tephra. (1) Transition
from estuarine muds to Unit I(a); (2) transition from Unit I(a) over Unit I(b) to Unit I(c); (3) sediments of Unit I(c); (4) sediments of Unit
I(d); (5) sediments of Unit I(e) with moderately developed laminations, occasional lighter and darker coloured bands; (6) transition from
Unit I(e) to Unit (f) with coarser grained mass-waste deposits and their finer, orange-coloured gritty bands. (7) Sediments of Unit I(f) with
coarse-grained (centimetre-scale) mass-waste deposits, fine, orange-coloured gritty bands, and centimetre-scale vivianite nodule bracketed
by andesitic tephra (see top of core section); (8) well-developed laminations of Unit II; (9) well-developed laminations with decreasing
quality downcore; (10) weathered basaltic detritus in Unit II; (11) subaqueous debris flow deposit Unit II; and (12) rhyolitic tephra ca. 2 m
above the core base.

Sci. Dril., 29, 19–37, 2021                                                                         https://doi.org/10.5194/sd-29-19-2021
B. Läuchli et al.: Composite development and stratigraphy of the Onepoto maar lake sediment sequence                             27

Figure 6. Glass shard major-element oxide bivariate plots of reference glass tephra data (taken from Molloy, 2008) and Onepoto (2018
drilling) samples.

https://doi.org/10.5194/sd-29-19-2021                                                                  Sci. Dril., 29, 19–37, 2021
28                B. Läuchli et al.: Composite development and stratigraphy of the Onepoto maar lake sediment sequence

Table 1. Description of the lithostratigraphic units for the 2018 Onepoto composite record based on the naming convention defined by Hägg
and Augustinus, 2003. ECD represents event-corrected depth.

     Lithostratigraphic unit    Depths below              ECD [m]                     Description
                                marine–freshwater
                                transition (M/F) [m]
     Unit I – Sub-Unit I(a)     0.0–1.5                   0.0–ca. 1.2                 Silts deposited prior to marine breach. Mainly
                                                                                      dark brown to black, with well-developed lam-
                                                                                      inations (sub-millimetre) and lighter-coloured
                                                                                      centimetre-scale bands. A lighter-brown to
                                                                                      greyish-brown section is present from 0.42–
                                                                                      0.69 m M/F.
     Unit I – Sub-Unit I(b)     1.5–2.7                   ca. 1.2–2.5                 Silts of dark grey to grey, brown colour
                                                                                      with moderately developed laminations (sub-
                                                                                      millimetre thickness) and bands (1–5 mm thick-
                                                                                      ness).
     Unit I – Sub-Unit I(c)     2.70–6.24                 ca. 2.5–5.4                 Silty clays, dark brown faint bands (1–5 mm
                                                                                      thickness), well-developed laminations present
                                                                                      (sub-millimetre thickness).
     Unit I – Sub-Unit I(d)     6.24–9.34                 ca. 5.4–8.16                Silty clays of light brown to light greyish-brown
                                                                                      colour with little to no laminations present but
                                                                                      gritty fine sand and lighter and darker bands
                                                                                      (centimetre scale).
     Unit I – Sub-Unit I(e)     9.34–11.38                ca. 8.39–10.18              Clays, dark brown to black, with moderately de-
                                                                                      veloped laminations (sub-millimetre thickness)
                                                                                      to increasingly well-developed downcore and
                                                                                      lighter and darker bands (10–20 mm thick) and
                                                                                      occasional ≤ 10 mm thick light brown fine sand
                                                                                      bands.
     Unit I – Sub-Unit I(f)     11.38–15.72               ca. 10.18–13.38             Very dark brown to black, also abundant light
                                                                                      brown to olive coloured and greyish-brown
                                                                                      (10–20 mm thick) bands. Fine to medium sand
                                                                                      layers are common and well-developed lami-
                                                                                      nations are present (sub-millimetre thickness).
                                                                                      Increased plant fragment content and vivianite
                                                                                      flecks.
     Unit II                    15.72–36.12               ca. 13.38–29.47             Silty clays and silts with colours ranging from
                                                                                      dark greyish-brown to olive grey and lam-
                                                                                      inations generally poorly to medium well-
                                                                                      developed as well as a high content of coarse
                                                                                      sand to gravel-rich layers. However, also sec-
                                                                                      tions with well-developed laminations present
                                                                                      (17.76–19.36 m, 25.73–26.46 m M/F).

maar (193 ± 2.8 ka; Leonard et al., 2017) as minimum age of              by Rbacon. Prior accumulation shape, memory strength and
the suggested >150 ka and
B. Läuchli et al.: Composite development and stratigraphy of the Onepoto maar lake sediment sequence 29
Table 2. Rhyolitic and andesitic tephra marker beds and basaltic deposits preserved in the Onepoto lake sediment record with assigned ages.
ECD represents event-corrected depth.
Tephra ID Material Thickness Age Error Depth below ECD Age taken from
[mm] [cal BP] (±2σ ) marine–freshwater depth [m]
transition (M/F) [m]
Rotoma Rhyolite 50 9423 120 0.23 0.23 Lowe et al. (2013)
Opepe Rhyolite 5 9991 160 0.32 0.27 Lowe et al. (2013)
Waiohau Rhyolite 1 14 009 155 0.83 0.78 Lowe et al. (2013)
Rotorua Rhyolite 35 15 635 412 0.98 0.89 Lowe et al. (2013)
Rerewhakaaitu Rhyolite 2 17 496 462 1.32 1.23 Lowe et al. (2013)
Okareka Rhyolite 3 23 525 1390a –210 1.96 1.89 Original age from Mol-
loy et al. (2009); calibrated
with SHCal20 (Hogg et al.,
2020); Peti et al., 2020,
2021)
Kawakawa/Oruanui Rhyolite 30 25 360 160 2.43 2.3 Vandergoes et al. (2013)
Okaia Rhyolite 5 28 621 1428 2.81 2.66 Lowe et al. (2013)
Maketu Rhyolite 20 36 100 900 3.83 3.61 Danišík et al. (2020)
Tahuna Rhyolite 1 38 400 1700 4.1 3.88 Danišík et al. (2020)
Rotoehu Rhyolite 720 45 100 3300 5.34 4.51 Danišík et al. (2012)
Eg4 Andesite 5 77 165 1400–1455b 7.63 6.76 Peti et al. (2021)
AVF B Basalt 20 146 900 2800 28.07 22.26 Leonard et al. (2017)
AVF C Basalt 360 181 000 600 34.82 27.91 Inferred age in Hopkins et
al. (2017)
AVF D Basalt Bedrock >150 00030 B. Läuchli et al.: Composite development and stratigraphy of the Onepoto maar lake sediment sequence
and depositional conditions. Units from the two lake records
have been grouped by us to “lithostratigraphic groups” (fur-
ther referred to as LG) and evaluated as to whether the onset
and termination of these units coincide. The correlation of
the transitions from one unit to the next relies on a recently
established robust age model for Orakei Basin (Peti et al.,
2020) and for Onepoto Basin on the age model presented in
this study. Correlation of the lithostratigraphic units between
the cores is given in Fig. 8.
For LG-1, the lithostratigraphic units at the very top, Unit
I(a) (Onepoto) and Unit 1 to Unit 2 (Orakei) show dis-
tinct differences with respect to sediment colour, texture,
and composition. In both cases their termination is marked
by a transition from lacustrine to marine conditions at ca.
9 ka. Unit I(a) is mainly dominated by dark brown to black
silts with well-developed laminations (sub-millimetre) and
lighter-coloured bands (centimetre scale). Unit 1 and Unit 2
in the Orakei record, on the other hand, are characterised by
a transition from light brown massive clay with bioturbation
(Unit 2) to peat (Unit 1). This suggests locally varying en-
Figure 7. Onepoto lake sediment sequence age model spanning the
entire sediment sequence using an event-corrected depth scale es-
vironmental conditions for the two sites. Onepoto maar lake
tablished using Rbacon (version 2.5.1; Blaauw and Christen, 2011) remained a deep, stratified lake with conditions favouring the
in R (version 1.3.1103; R Core Team, 2020). (a) Post-50 ka record development of laminations due to bottom-water/sediment
based on AMS 14 C ages and known-age rhyolitic tephra ages (mean anoxia but with an increased input of fine organic matter until
95 % confidence ranges 2.03 ka, min 0.31 ka at 0.59 m, max 6.11 ka the conclusion of lacustrine conditions (dark colour). On the
at 50 m). (b) Full lake sediment sequence including andesitic tephra other hand, Orakei maar lake gradually shallowed over time
and basaltic ejecta as age markers in the pre-50 ka part of the record due to sediment influx, and input of fine organic detritus was
(mean 95 % confidence ranges 13.23 ka, min 0.11 ka at 0.18 m, max reduced. Direct correlation between these units is supported
20.85 ka at 10.81 m. The accumulation rate is estimated by Rba- by the presence of Rotorua tephra at ca. 15.64 ka cal BP.
con by millions of Markov Chain Monte Carlo (MCMC) iterations. For LG-2, the closest similarities between units of the
The memory defines how much the accumulation rate of a particular
records are found between Unit I(b) (Onepoto) and units 3 to
depth in a core depends on the depth above it (Blaauw and Christen,
2011).
7 (Orakei). Both groups share close estimated times of onset
(ca. 28 ka) and termination (ca. 18 ka) and are similar in sed-
iment colour and composition. The units in both records are
dominated by lighter-coloured sediments with moderately
lacustrine sediment sequence has been studied in great de- well-developed laminations in both. However, the laminae
tail for the last 50 kyr (e.g., Nilsson et al., 2011; Stephens in the Orakei lacustrine sequence are better defined. These
et al., 2012a, b), a comparison with the palaeolake sed- sedimentary characteristics suggest a more stratified water
iment sequence extracted from nearby Orakei maar (Peti column for Orakei maar lake with bottom-water/sediment
and Augustinus, 2019), however, allows for a correlation of anoxia before transitioning into banded sands/silts with
lithostratigraphic units from Onepoto Basin with the high- wood fragments. The latter indicates a gradual shallowing
resolution (averaged SAR (sediment accumulation rate) of at this site. Input of fine organic matter is somewhat re-
0.04 mm/yr; Peti et al., 2020) terrestrial record from Orakei duced at Onepoto palaeolake and significantly reduced at
Basin which spans the last 130 kyr. For the period from 50– Orakei palaeolake. Okareka and Kawakawa/Oruanui (KOT)
9 ka, the correlation of the two records is guided by the tephra provide reliable age markers at ca. 22.21 and ca.
presence of well-visible and geochemically distinct rhyolitic 25.36 ka cal BP, respectively, that can be correlated across
tephra beds (Rotorua, Okareka, Kawakawa/Oruanui, Okaia, the two records. In addition, in both records an increase in
Maketu, Tahuna, and Rotoehu) and one basaltic tephra de- basaltic tephra deposits is noticeable such as AVF 10 and
posit (AVF 12). In contrast, for the period from 130–50 ka AVF 12. Not only does this reflect heightened volcanic ac-
our correlation is based upon the presence of the andesitic tivity within in the AVF at the time but also indicates that
Eg4 tephra in both records and sedimentary characteristics both basins were located downwind from the eruptive cones
(colour, texture, evidence of influx organic macro material that produced these tephra.
content, and coarse-grained material). For LG-3, Unit I(c) (Onepoto) and Unit 8 (Orakei) are
Both maar lakes were subject to the same regional envi- both constrained by estimated times of onset of ca. 58 ka
ronmental and climatic drivers determining sediment influx and termination of ca. 28 ka, respectively. Both lithostrati-
Sci. Dril., 29, 19–37, 2021 https://doi.org/10.5194/sd-29-19-2021B. Läuchli et al.: Composite development and stratigraphy of the Onepoto maar lake sediment sequence 31 Figure 8. Comparison of lithostratigraphic units identified in the Onepoto and Orakei maar lake records as well as inferred correlations to the MIS 6e–MIS 1 (where MIS represents marine isotope stage). Orakei Basin lake sediment facies model modified from Peti and Augustinus (2019). Lithology legend for Onepoto follows that in Fig. 3. Red dashed lines show corresponding facies transitions; black dashed lines show possibly correlatable tephra beds; red solid lines show transition from sediments with less sandy/coarse content to sediments with increased coarse-grained content; black solid lines show correlatable tephra beds; and the dashed blue line represents the marine–freshwater transition. graphic units show dark brown, fine-grained sediments with mostly comparable environmental conditions for both lakes well-developed laminations. While thin, mass-movement de- with water column stratification and bottom-water/sediment posits are reported for Unit 8, similar features are not found anoxia, which allows for the development of well-developed in Unit I(c), with minor traces of macroscopic plant frag- laminations. The dark colouration of the sediments in- ments present in the latter. The observed features indicate dicates a steady input of fine organic matter into both https://doi.org/10.5194/sd-29-19-2021 Sci. Dril., 29, 19–37, 2021
32               B. Läuchli et al.: Composite development and stratigraphy of the Onepoto maar lake sediment sequence

lakes. In this case Okaia (ca. 28.62 ka cal BP), Maketu (ca.        increasingly apparent prior to the onset of estuarine depo-
35.61 ka cal BP), Tahuna (ca. 37.85 ka cal BP), and Rotoehu         sition at ca. 9 ka (later stage of LG-2 and LG-1), displayed
(ca. 45.1 ka) tephra offer age dates and are reliable marker        by a shallowing upwards trend recorded in the Orakei maar
layers for a direct correlation between these units.                palaeolake. Onepoto maar, on the other hand, remains a deep
   For LG-4 (between ca. 60 to 119 ka), Onepoto Basin’s             lake basin until the breach of the crater rim and subsequent
units I(d) to I(f) share similar characteristics to units 9 to 12   onset of estuarine sedimentation. Furthermore, in both maar
(Orakei). Drawing from the more robust Orakei age model,            lake sequences a general trend to increased presence of mass-
the onset and termination times can be inferred (ca. 58 and         movement deposits (sand to gravel) and organic fragments
ca. 110 ka). The sedimentary characteristics of the individ-        (e.g., wood) is recorded downcore, especially from the on-
ual units from both records share a general trend of a down-        set of LG-4 onwards (>60 ka) to LG-5. Overall, laminations
core transition from banded (at the top) to increasingly well-      (< millimetre scale) are more well developed and continuous
laminated sediments. It is important to note though that the        in the Orakei lake sequence in contrast to the Onepoto lake
distinctness of the preserved laminations in the Orakei record      sediment record (Figs. 3 and 8).
are superior to those of the Onepoto lake sediment record.
Similarly, there is a gradual downcore increase in organic          4.6   Preliminary reconstruction of Onepoto maar lake
detritus and mass-wasting deposits observable in both se-                 sediment sequence evolution
quences. Mass-wasting inducing events (e.g., storms and/or
earthquakes) and a less fully developed stratification of the       Formation of the crater (> 150–193 ka; AVF D) to AVF C
water column are at both sites towards the top of this group,       (ca. 181 ka). This early phase of lake sedimentation can be
indicated by transition from laminations to banding towards         allocated to MIS 6e based on the available age constraints.
the top in Unit I(d) and Unit 9. For this group, Eg4 tephra         However, the disturbed condition of the sediments, likely
currently provides the most reliable age marker.                    caused when the drill core penetrated the comparably thick
   For LG-5 (ca. 130–119 ka), time constraints for this phase       and dense basaltic lapilli of deposit AVF C, does not allow
are provided by a good agreement between the age model              for reliable interpretation of environmental conditions.
present in this study with the dated age of eruption that              AVF C (ca. 181 ka) to AVF B (ca. 146 ka). The ca. 35 kyr
formed Orakei Basin (ca. 130 ka) and the basaltic “AVF aa”          phase represented in this part of the record can be roughly
tephra recorded in the Orakei lake sediment sequence (ca.           correlated to MIS 6d, MIS 6c, and MIS 6b (Railsback et al.,
119 ka). The transition from Unit I to Unit II (Onepoto) and        2015) based on the given age constraints provided by the
from Unit 12 to Unit 13 (Orakei) is marked by a signifi-            age–depth model presented in this study. Overall, the sedi-
cant increase in coarse sand and gravel-rich layers with of-        ments of this section consist of light brown to dark brown
ten angular-shaped grains (mass-wasting deposits) in both           silts and clays with mainly poorly to moderately developed
records. However, the Orakei lake sediment sequence depicts         laminations and occasional thicker (decimetre-scale) mass-
well-developed laminations at high frequency that have no           wasting deposits. We calculate an averaged accumulation of
corresponding equivalent in the Onepoto lake sequence. In           ∼ 1.92 m clastic and tephra material in this ∼ 6.24 m part of
the latter, laminations are rather poorly to, at best, moder-       the record. The transitions from one stage to the next are of-
ately developed. This suggests better developed water col-          ten marked by changes in colour and facies. While the ca.
umn stratification at Orakei maar lake at this time. Both sites     1 m thick dark brown silts with moderately to well-developed
reflect reoccurring strong (coarse grained material) mass-          laminations above AVF C align with MIS 6d, the following
wasting inducing events (e.g., storms and/or earthquakes).          2 m of sediments above can be correlated to MIS 6c. The
After Orakei maar’s formative eruption, the initial shallow         preservation of laminated sediments during MIS 6d infer the
lake (massive sediments in Unit 14) transitioned into a deep        presence of a stratified water column with bottom-water con-
lake basin with conditions favourable for lamination forma-         ditions or sediment anoxia that prevented sediment bioturba-
tion in the profundal zone (high-frequency laminations in           tion. In contrast, the sediments of MIS 6d contain a thicker
Unit 13). Onepoto maar lake, on the other hand, depicts             dark brown mass-wasting deposit and light brown silts with
a fully developed lake system with at times not optimal             poor to moderately developed laminations. The latter depicts
bottom-water conditions that allowed for the development of         less favourable bottom-water conditions for the development
laminations.                                                        of laminated sediments. MIS 6b is represented by ∼ 2 m of
   Generally, both lake sediment sequences recorded in-             massive light brown clayey silts with vivianite flecks and
creased activity of tephra source volcanic centres with fel-        dark brown silts with moderately developed laminations that
sic magma composition (e.g., TVZ) over the last ca. 45 kyr          suggest another phase of suboptimal bottom-water condition
whilst older lake sediments are largely devoid of rhyolitic         for lamination development.
tephra. For most of the later stages of infill of both lakes           AVF B (ca. 146 ka) to Eg4 (77.17 ka). Between the Eg4 (ca.
(
B. Läuchli et al.: Composite development and stratigraphy of the Onepoto maar lake sediment sequence                              33

scale subaqueous debris flow deposits. Altogether, we docu-             Eg4 tephra to M/F (ca. 77–9 ka; upper ∼ 7.56 m of the
ment an averaged accumulation of ∼ 4.94 m of clastic and             record). The lithostratigraphic sub-units I(a) to I(d) span the
tephra material for this ∼ 7.56 m part of the record. Here           phase after the deposition of the Eg4 tephra until the tran-
changes in colour and facies or transitions from one lithologi-      sition to estuarine conditions. Overall, an average thickness
cal unit to the other do not always strictly trace shifts between    of ∼ 0.87 m of clastic material and tephra was deposited
marine isotope stages. This either implies local environmen-         in the basin during this phase (Fig. 3) and may infer rel-
tal drivers partially overriding broader climatic trends or that     atively stable environmental conditions with few sediment
climatic changes occurring recorded elsewhere have not set           influx events. For this late phase of the Onepoto develop-
in the same time in the area around at the study site. While the     ment, robust age constraints are provided by rhyolitic tephra
∼ 2 m of sediments following AVF B consists of mainly light          ages and radiocarbon ages (Fig. 7). Well-laminated sedi-
brown clayey silts with gritty bands, a noticeable transition        ments are mainly found in Sub-Unit I(c), which we can cor-
occurs at 26.46 m with the onset of ∼ 0.75 m dark brown silts        relate with MIS 3a. The available age constraints demon-
with well-developed laminations and comparably reduced in-           strate that the largest part of this unit relates to the phase
flux of crater-rim-sourced material reflecting a brief phase of      prior to the Last Glacial Maximum (LGM). However, the
stable environmental conditions and bottom-water/sediment            presence of Okaia tephra ca. 28.62 ka cal BP also highlights
anoxia due to a stratified water column. From our age model,         that the uppermost section could contain signals that sup-
an estimated age of ca. 130 ka is inferred. The phase from           port the eLGM (extended LGM; Newnham et al., 2007) of
the AVF B event to the deposition of the thick mass-wasting          New Zealand (Rother et al., 2014). Further, Sub-Unit I(a)
deposit can therefore be allocated to MIS 6a, placing it in          that follows above can be assigned to the late MIS 2 to
the Penultimate Glacial Maximum (PGM). We interpret the              MIS 1 transition. The preservation of these laminations in-
cause of the subaqueous debris flow deposit to be possibly           dicates renewed phases of water column stratification with
related to a significant seismic shock that was perhaps trig-        bottom-water/sediment anoxia preventing sediment biotur-
gered by the formative eruption of Orakei Basin calculated to        bation. Sub-Unit I(b) can therefore confidently be correlated
ca. 130 ka (Peti et al., 2021; see correlation Fig. 8). A slightly   to the LGM. A detailed description and interpretations on the
younger deposit of light brown clayey silts rich in abundant         regional environmental evolution recorded in the ca. 30–9 ka
basaltic detritus (at 21–22 m; estimated age 126–127 ka) may         section of the lake sediment sequence are outlined in Au-
be the product of an increased local volcanic activity such as       gustinus et al. (2011, 2012) based on the analysis of pollen
the Orakei crater in a very early stage of its existence. Addi-      and diatom assemblages as well as geochemical proxies.
tionally, during this time (MIS 5e) the Onepoto maar ring is a
substantial feature well protected from high MIS 5e sea lev-
els by the tuff ring. A renewed shift in sediment colour and         5   Possible project outcomes
facies occurs at 19.36 m with the onset of dark brown ∼ 1.6 m
thick silts with well-developed laminations exhibiting a re-         A multi-method, high-resolution chronology (centennial to
newed phase of stable environmental conditions with a strat-         decadal timescale) is currently being established for the
ified water column and anoxic bottom waters or sediments.            Onepoto palaeolake sediment sequence. This process uses
We can assign an estimated age range from 124–122 ka for             radiocarbon dating, and U/Th dating on a large (4 × 1 cm)
this stage of Onepoto maar lake’s evolution and correlate this       vivianite nodule (sub-unit I(f), ca. 13.35 m below M/F tran-
phase with the onset of MIS 5d. Furthermore, the transition          sition), relative palaeo-intensity variation of the Earth’s mag-
from lithostratigraphic Unit II to (Sub-)Unit I(f) at 15.8 m         netic field for targeted areas of the sediment record and
can be inferred to have occurred during MIS 5d at ca. 119 ka.        magnetic-field-strength-controlled influx of meteoric 10 Be
The latter is supported by the existence of AVF aa (age in the       cosmogenic radionuclides into the basin. This approach mir-
Orakei maar lake record (Fig. 8)). Moreover, the current age         rors aspects of the approach used for the Orakei palaeolake
constraints suggest the transition from MIS 5d to 5c to be           age model development (Peti et al., 2020) and will assist with
recorded at 12.6 m as well as the transition from MIS 5c to          development of robust high-resolution correlations between
5b at 11.46 m, which coincides with the transition from Sub-         the lengths of the two sequences in common. The approach
Unit I(f) to Sub-Unit I(e). Additionally, the MIS 5b to MIS          of combined palaeo-intensity variation and meteoric 10 Be
5a boundary can be placed at the contact of Sub-Unit I(e) to         has also been recently applied to the Lake Selina (Tasma-
Sub-Unit I(d) at 8.65 m. Unlike Orakei Basin where the indi-         nia, Australia) sediment sequence and aided the chronology
vidual substages of MIS 5 thus far could not be reliably de-         development (Lisé-Pronovost et al., 2021), which supports
tected by the recently executed study for this site (Peti, 2020),    our expectations of this technique. Alongside this work, a
the >130 ka part of the Onepoto lake sediment record seems           comparison and correlation of the Orakei basin record and
to reflect changes in lithological composition in response to        its recently established robust age model (Peti et al., 2020)
broader climatic shifts. Yet, a further strengthening of the age     with the newly established maar lake record presented here
model will be required for a robust interpretation.                  shows the potential of transferring key aspects of the Orakei
                                                                     age model to the Onepoto lake sediment sequence age model.

https://doi.org/10.5194/sd-29-19-2021                                                                   Sci. Dril., 29, 19–37, 2021
34 B. Läuchli et al.: Composite development and stratigraphy of the Onepoto maar lake sediment sequence
We expect the available multi-element µ-XRF core scan- processes and features that drive the observed variabil-
ning time series to be crucial in linking the two records ity.
more robustly together. Furthermore, we are combining these
µ-XRF downcore variability trends with measurements of 6 Conclusions
loss-on-ignition, carbon and nitrogen content, and carbon
isotopes to start the process of reconstructing climatically The ongoing study of the lake sediment sequence contained
forced environmental change from northern New Zealand in Onepoto maar outlined here has produced a composite fa-
over much of the last two glacial cycles (ca. 200 ka). Rep- cies log derived from overlapping core sections guided by
resentative thin-sections are also being examined from parts prominent tephra layers and sedimentary features such as
of the record with well-developed laminations (< millimetre mass movement deposits, distinct well-laminated segments
scale) for micro-facies analysis to detect abrupt climate shifts and features representative of distinctive facies types. More
and short- to long-term changes in seasonality. Extending challenging core section alignments were achieved using
pollen and diatom analyses prior to MIS 3 (Augustinus et high-resolution radiographic images, tephrochronology, µ-
al., 2011, 2012) will also provide important palaeoecological XRF and magnetic susceptibility time series data.
information necessary for development of detailed insights The preliminary Onepoto age model presented here re-
into drivers of changes in Onepoto palaeolimnology as well flects the issue of poor age control for large sections of the
as catchment palaeoecology and associated palaeoclimate. pre-50 ka sequence. Nevertheless, promising improvements
Multi-proxy analysis of the Onepoto maar lake sediments have been made by correlating the Onepoto sequence to that
is expected to produce the following insights: of Orakei Basin, thereby extending age control to the base
of that sequence using a range of known-age tie points. Age
1. Further development of improved constraints for the
markers for the early stage of the lake and its eruptive forma-
frequency and magnitude of regional basaltic volcanic
tion are provided through AVF-sourced basaltic ejecta (AVF
activity within the Auckland Volcanic Field by deliver-
B/ AVF C) and the lava at the base (AVF D). Significant age
ing better age estimates, especially prior to the deposi-
uncertainties, especially for AVF D, or independently sup-
tion of the known-age Rotoehu tephra by combining the
ported ages as in the case of AVF C and the lack of further
recently refined ages presented in Peti et al. (2021) with
reliable marker layers (e.g., AVF A) between Eg4 to AVF
new results produced from the new Onepoto record.
B (spanning ca. 69 ka) as well as AVF B to AVF C (span-
2. A refined tephrochronology for Onepoto from all vol- ning ca. 34 ka) require more robust age constraints. This is
canic sources will also allow for an improved volcanic currently underway using 10 Be cosmogenic nuclide flux sup-
hazard assessment for Auckland City. As well as AVF ported by measurement of relative magnetic palaeo-intensity
basaltic volcanism, ash falls from distal sources (mostly variation in sections of the core (e.g., Laschamp Event) using
andesitic but also rhyolitic) are a frequently reoccurring an approach analogous to that used for the Orakei maar lake
volcanic hazard for the Auckland region. chronology development.
The pre-77 ka phase of lake sediment deposition at
3. The dating of tephra age markers older than 50 ka using Onepoto is marked by a dominance of debris flows and depo-
meteoric cosmogenic nuclide (10 Be) variability in the sition of many thin andesitic tephra (mainly sub-millimetre-
Onepoto sediments driven by well-known changes in scale thickness) originating from distal volcanic centres (e.g.,
Earth’s magnetic field intensity (see references in Peti et Egmont/Taranaki and Tongariro VCs). However, discontin-
al., 2020) will enable more accurate and precise dating uous sections of well-developed laminations (< millimetre
of the sequence. Our study aims to achieve an overlap scale) are also present. These findings are indicative of
with the Orakei maar record below the Rotoehu tephra phases of varying clastic input/chemical conditions driven
(45 ka and the Laschamp excursion (ca. 41 ka, Nilsson by climatic signals while the preservation was affected by
et al., 2011) to complement the Orakei age model. This bottom-water/sediment anoxia driven by water column strat-
approach will likely establish trends of meteoric cosmo- ification preventing sediment bioturbation.
genic nuclide (10 Be) variability spanning nearly two full AVF maar lake sediments exhibit enormous potential for
glacial cycles. We expect that the Onepoto age model the identification and interpretation of short-duration climate
will be robust enough to be able to observe environmen- events and long-term climate trends as well as intra- and
tal oscillations and events identified in the sequence to inter-hemispheric climate. In tandem with ongoing work on
regional and possibly intra- and inter-hemispheric cli- Orakei maar, the study of Onepoto maar lake sediments will
matic events. extend this record by providing high-resolution palaeocli-
mate and palaeoenvironmental reconstructions spanning the
4. Principal component analysis (PCA) of the µ-XRF core last two glacial cycles.
scanning time series will provide additionally aid for
our palaeoenvironmental interpretation. Application of
this approach to high-resolution XRF data identifies the
Sci. Dril., 29, 19–37, 2021 https://doi.org/10.5194/sd-29-19-2021You can also read