Differentiating lightning in winter and summer with characteristics of the wind field and mass field - WCD
←
→
Page content transcription
If your browser does not render page correctly, please read the page content below
Weather Clim. Dynam., 3, 361–375, 2022
https://doi.org/10.5194/wcd-3-361-2022
© Author(s) 2022. This work is distributed under
the Creative Commons Attribution 4.0 License.

Differentiating lightning in winter and summer with characteristics
of the wind field and mass field
Deborah Morgenstern1,2 , Isabell Stucke1,2 , Thorsten Simon2 , Georg J. Mayr1 , and Achim Zeileis2
1 Department   of Atmospheric and Cryospheric Sciences (ACINN), University of Innsbruck, Innsbruck, Austria
2 Department   of Statistics, University of Innsbruck, Innsbruck, Austria

Correspondence: Deborah Morgenstern (deborah.morgenstern@uibk.ac.at)

Received: 14 October 2021 – Discussion started: 15 October 2021
Revised: 14 January 2022 – Accepted: 14 February 2022 – Published: 31 March 2022

Abstract. Lightning in winter (December–January–                 1   Introduction
February, DJF) is rare compared to lightning in summer
(June–July–August, JJA) in central Europe north of the           Mid-latitude thunderstorms are much rarer in winter than in
Alps. The conventional explanation attributes the scarcity of    summer and produce less than 3 % of the total lightning ac-
lightning in winter to seasonally low values of variables that   tivity in Europe (Wapler, 2013; Poelman et al., 2016). Yet the
create favorable conditions in summer. Here we systemat-         transported electrical charges are often higher in winter, and
ically examine whether different meteorological processes        thus the damage potential is also higher. The conventional
are at play in winter. We use cluster analysis and principal     explanation for the paucity of winter lightning is the paucity
component analysis and find physically meaningful groups         of favorable conditions for strong convection, which lead to
in ERA5 atmospheric reanalysis data and lightning data           thunderstorms in summer. The required large values of con-
for northern Germany. Two thunderstorm types emerged:            vective available potential energy (CAPE), copious amounts
wind-field thunderstorms and CAPE (convective available          of near-surface water vapor, and the presence of a vertical
potential energy) thunderstorms. Wind-field thunderstorms        instability (Doswell, 1987) are normally absent in winter.
are characterized by increased wind speeds, high cloud              The electrical characteristics of lightning in winter differ
shear, large dissipation of kinetic energy in the boundary       from summer, e.g., in flash duration, direction, and sign of
layer, and moderate temperatures. Clouds are close to the        charge transfer; strength of the electric current; and the light-
ground, and a relatively large fraction of the clouds are        ning electric field waveform (e.g., Brook et al., 1982; Goto
warmer than −10 ◦ C. CAPE thunderstorms are charac-              and Narita, 1995; Rakov and Uman, 2003; Rakov, 2003; Di-
terized by increased convective available potential energy       endorfer et al., 2009; Ishii and Saito, 2009; Wang and Takagi,
(CAPE), the presence of convective inhibition (CIN), high        2012; Yoshida et al., 2018; Wu et al., 2021). Larger trans-
temperatures, and accompanying large amounts of water            ported charges and more frequent initiation of lightning from
vapor. Large amounts of cloud-physics variables related          tall (human-made) structures in winter elevate the damage
to charge separation such as ice particles or cloud base         potential. This has become a major concern as a consequence
height further differentiate both wind-field thunderstorms       of the proliferation of the installation of tall wind turbines
and CAPE thunderstorms. Lightning in winter originates           in the push towards renewable energy sources. For example,
in wind-field thunderstorms, whereas lightning in summer         Matsui et al. (2020) show that wind turbine lightning acci-
originates mostly in CAPE thunderstorms and only a small         dents in Japan in winter are 47 times more frequent and also
fraction in wind-field thunderstorms. Consequently, typical      more severe than in summer.
weather situations of wind-field thunderstorms in the study         The difference between the seasons in electrical charac-
area in northern Germany are strong westerlies with embed-       teristics warrants a challenge to conventional wisdom for the
ded cyclones. For CAPE thunderstorms, the area is typically      paucity of winter thunderstorms and motivates an investiga-
on the anticyclonic side of a southwesterly jet.                 tion into whether it is not meteorological settings different
                                                                 from summertime ones that lead to these differences. One

Published by Copernicus Publications on behalf of the European Geosciences Union.
362                                                D. Morgenstern et al.: Differentiating lightning in winter and in summer

therefore will need to look first at the processes that cre-
ate lightning. While no unified theory exists that explains
the buildup of the charge separation that lightning eventually
neutralizes, the non-inductive mechanism is the most widely
accepted one (Saunders, 2008; Williams, 2018). It states that
charge is transferred during the collision of different cloud
particles often present in the vicinity of the −10 ◦ C isotherm.
The differently charged particles get separated based on their
size through differential terminal velocities (Cotton et al.,
2011) and form various charge regions within the cloud.
Lightning is initiated in the strong electric field between two
charge regions (e.g., Salvador et al., 2021). In summertime,
the release of CAPE leads to strong updrafts that are needed
                                                                   Figure 1. Study region in northern Germany (black rectangle). Co-
to produce graupel – relatively large and heavy hydrome-
                                                                   ordinates: 52.00◦ N, 7.25◦ E (southwestern corner) and 53.50◦ N,
teors – and to move ice crystals far aloft which have ac-          12.00◦ E (northeastern corner). Area: 53 295 km2 . Dots show the
quired opposite polarity through their collision with graupel      centers of the ERA5 0.25◦ latitude–longitude grid. Elevation is
(Williams, 2018). In wintertime, it is rather the collision be-    mostly below 100 m a.m.s.l. Data: TanDEM-X (Rizzoli et al., 2017;
tween snowflakes and ice crystals and their subsequent sep-        Wessel et al., 2018). DE: Germany, DK: Denmark, NL: the Nether-
aration along a slanted path that is thought to be responsible     lands.
for the charge separation (Williams, 2018). Differential ter-
minal velocities with strong vertical shear of the horizontal
wind cause the particle paths to become slanted and sepa-          logical reanalysis (ERA5) and lightning observations (both
ration distances to be large despite relatively weak vertical      described in Sect. 2). The statistical methods establishing
motions and charging rates. Lightning in winter occurs with        links between meteorological data and lightning are de-
clouds that are shallow but wide; a charge region that is close    scribed in Sect. 3. Section 4 presents the results; Sect. 5 dis-
to the ground; and lightning discharges that propagate long        cusses, and Sect. 6 summarizes the findings.
distances within the cloud, resulting in large charge transfers
(Yoshida et al., 2018).
   The goal of this paper is to take a step back from the ob-      2   Data
vious seasonality of lightning frequency (Vogel et al., 2016;
Matsui et al., 2020) and apply a data-driven approach to elu-      The study area was chosen to be in the mid-latitudes, to be
cidate whether the occurrence of lightning can be tied to dif-     covered by a lightning location system with high detection
ferent dominant meteorological processes. It is important to       efficiency, and to be topographically fairly uniform. A region
remember that lightning is not necessarily synonymous to           in northern Germany shown in Fig. 1 fulfills these criteria. It
“strong convection”, since processes other than strong ver-        includes some small hills, but the elevation is mostly a few
tical motions might lead to charge separation and the elec-        decameters above mean sea level.
trification of clouds. If thunderstorm types are differenti-          The study period is 2010–2019, a period for which light-
ated by processes instead of seasons, more insights can be         ning detection efficiency in the study region is mostly un-
gained, and a contradiction arising from a seasonal classifi-      affected by changes to the hardware and software of sev-
cation can be resolved, for example, that of the annual light-     eral lightning locations systems (LLS) collaborating as EU-
ning maximum in fall in the northern Mediterranean com-            CLID (European Cooperation for Lightning Detection). We
pared to central Europe, where lightning peaks in summer           use only cloud-to-ground lightning flashes, since these are re-
(Taszarek et al., 2019). To clearly make the distinction be-       sponsible for most damages. An additional amplitude filter is
tween processes and a mere seasonality of favorable thun-          applied to exclude flashes with weak peak currents between
derstorm conditions, we focus on winter and summer seasons         −5 and 15 kA, resulting in a detection efficiency of more than
only at a fairly small and flat study region to avoid having to-   96 % (Schulz et al., 2016; Poelman et al., 2016). From 2010–
pography as an additional forcing mechanism and to have ho-        2019 EUCLID recorded 203 124 such flashes in the study
mogeneous lightning conditions with a uniform annual light-        region in summer (June–July–August, JJA) but only 2830
ning cycle over the entire domain. Results for the transition      in winter (December–January–February, DJF; 1.4 % of the
seasons are given at https://doi.org/10.5281/zenodo.5851700        flashes in summer).
(Morgenstern et al., 2022).                                           Consistent atmospheric data come from ERA5, the fifth-
   Our data-driven approach uses many atmospheric vari-            generation global reanalysis of the European Centre for
ables of possible relevance for thunderstorms associated with      Medium-Range Weather Forecasts (ECMWF; Hersbach
the wind field, mass (temperature) field, moisture field, sur-     et al., 2020). We use assimilated data at the surface level
face exchange, and cloud (micro-)physics from a meteoro-           and data on the lowest 74 (of 137) vertical levels (cover-

Weather Clim. Dynam., 3, 361–375, 2022                                                 https://doi.org/10.5194/wcd-3-361-2022
D. Morgenstern et al.: Differentiating lightning in winter and in summer                                                       363

ing the troposphere) and many additional variables derived         three scenarios. This sampling is done conditional on the
from these data (see Sect. 3). Horizontally, the data are avail-   diurnal cycle for lightning in the respective season, known
able on a 0.25◦ latitude–longitude grid and temporally every       as “stratified sampling” in statistical literature. All sampling
hour, yielding a “cell-hour” as the smallest space–time unit.      is performed without replacement and on the basis of cell-
Only 0.883 % of those cell-hours in JJA have at least one          hours.
flash (27 305), and this fraction is reduced to 0.052 % in DJF        Since the least frequent scenario (lightning in winter) con-
(17 times less, 1576 cell-hours).                                  sists of 1576 cell-hours, the whole data set with four sce-
                                                                   narios contains 6304 cell-hours. Finally, to ensure that the
                                                                   results obtained are not driven by spurious artifacts from the
3     Methods                                                      sampling, we have considered 50 replications of the sampling
                                                                   procedure. As all of these lead to qualitatively identical re-
To clearly isolate the effects of seasonality, only the two        sults, we only report the results from one representative set
extreme seasons of winter and summer are chosen, and a             of samples. Each sample is drawn from the whole 10 years
methodological approach is selected that can properly han-         of data so that single anomalous seasons do not have a large
dle the vastly different lightning frequencies in these two        influence. The similarity of the 50 samples gives further con-
seasons. The same methods have been applied to the tran-           fidence in the robustness of our results. The representative
sitional seasons, for which results are given in Morgenstern       data set is provided in Morgenstern et al. (2022).
et al. (2022).
   To understand the atmospheric conditions under which            3.2   Preprocessing and selection of ERA5 variables
lightning occurs (or does not), we process the available EU-
CLID lightning observations and ERA5 atmospheric vari-             To enhance the set of ERA5 single-level variables, we add
ables in the following way. First, equally sized samples from      information from the vertical profiles available in the model
four scenarios of lightning observations are formed: light-        level data by deriving additional single-level variables from
ning in winter, no lightning in winter, lightning in summer,       them. These derived variables aim at portraying physical
and no lightning in summer, each following the diurnal cy-         lightning processes and covering isotherm heights, cloud
cle of lightning in the respective season (Sect. 3.1). To cap-     size, wind shear within and below the cloud, and maximum
ture the atmospheric conditions at the time and place of these     vertical velocity. Further, we compute sums of cloud parti-
EUCLID observations, we select and derive 35 ERA5 vari-            cles between specific isotherms, for instance, cloud ice wa-
ables at the respective grid cells (Sect. 3.2). Using only these   ter content between the −20 and −40 ◦ C isotherms. Table 1
35 ERA5 variables, a k-means cluster analysis with k = 5           presents all variables used in this study; the derived variables
clusters is carried out to determine groups of “typical” at-       are marked by an asterisk. An extended version of this table
mospheric conditions. To facilitate the interpretation of the      is provided in Morgenstern et al. (2022).
35 variables in the five clusters, the variables are visual-          The 35 variables presented in Table 1 are selected sub-
ized by the first two components of a principal component          jectively from the extended ERA5 data set based on our
analysis (Sect. 3.3). Matching the membership for the five         own meteorological expertise, results in the literature, and
atmospheric condition clusters with the corresponding four         an explorative analysis of the data. This explorative analy-
lightning scenarios reveals how the atmospheric conditions         sis worked out variables that show a distinct distribution for
vary between winter and summer with and without light-             the four scenarios, and we kept only variables that are not
ning. Finally, clusterwise weather maps are produced to get        strongly correlated to other selected variables. The chosen
an overview of the governing weather patterns in each clus-        atmospheric variables contribute to the formation and ulti-
ter and hence a good description of the differences between        mately to the separation of electric charges needed for light-
lightning in winter and in summer.                                 ning to occur. Each variable is associated with a physical-
                                                                   based category (Table 1).
3.1    Composition and stratification of data
                                                                     – Mass field. This includes variables related to tempera-
The EUCLID observations are aggregated to the spatiotem-               ture and pressure such as CAPE and the altitude of spe-
poral grid of ERA5. A cell-hour is considered a lightning cell         cific isotherms.
if at least one flash occurred within the cell in the hour after
the ERA5 valid time. Otherwise the cell-hour is considered           – Wind field. This includes wind- and shear-related vari-
non-lightning.                                                         ables such as wind speed and wind direction or the dis-
   For the best results of the clustering and principal compo-         sipation of kinetic energy in the boundary layer.
nent analysis, each of the four lightning scenarios considered
should be represented equally in the data. Therefore, we use         – Cloud physics. This includes everything directly related
all cell-hours from the least frequent scenario (lightning in          to clouds such as the mass of various cloud particles,
winter) along with samples of the same size from the other             precipitation measures, or the cloud size.

https://doi.org/10.5194/wcd-3-361-2022                                               Weather Clim. Dynam., 3, 361–375, 2022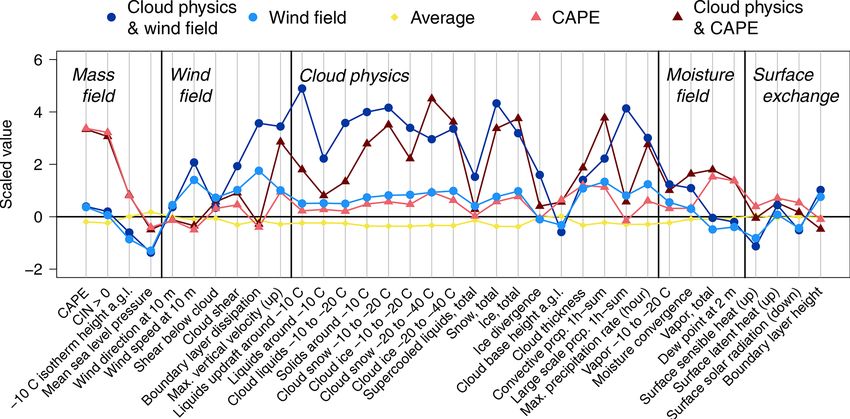
364                                                                   D. Morgenstern et al.: Differentiating lightning in winter and in summer

Table 1. ERA5 variables used in this study. Variables derived from                       where x denotes the original value of the ERA5 variable and
other ERA5 variables are marked by an asterisk (∗ ).                                     xt is its transformation.
                                                                                            Moreover, to make deviations from “normal” levels com-
 Name                                        Unit              Category                  parable across variables, all variables in the full data set are
 Boundary layer dissipation                  J m−2             Wind field                scaled using the mean and standard deviation obtained only
 Boundary layer height                       m                 Surface exchange          from the scenarios without lightning.
 CAPE                                        J kg−1            Mass field
 CIN > 0                                     Binary            Mass field
 Cloud base height                           m a.g.l.          Cloud physics                    (xt − µ)
                                                                                         xs =            ,                                             (2)
 Cloud ice −10 to −20 ◦ C ∗                  kg m−2            Cloud physics                        σ
 Cloud ice −20 to −40 ◦ C ∗                  kg m−2            Cloud physics
                                                                                         where xs denotes the scaled value. µ and σ are the empirical
 Cloud liquids −10 to −20 ◦ C ∗              kg m−2            Cloud physics
 Cloud shear ∗                               m s−1             Wind field                mean and standard deviation based on all cell-hours in winter
 Cloud thickness ∗                           m                 Cloud physics             and in summer without lightning. The applied algorithm is
 Cloud snow −10 to −20 ◦ C ∗                 kg m−2            Cloud physics             supplied in Morgenstern et al. (2022).
 Cloud snow −20 to −40 ◦ C ∗                 kg m−2            Cloud physics
 Convective prcp. 1 h sum                    m                 Cloud physics             3.3    Statistical methods
 Dew point at 2 m                            K                 Moisture field
 Ice divergence                              kg m−2 s−1        Cloud physics             To group the 6304 cell-hours consisting each of 35 ERA5
 Ice, total                                  kg m−2            Cloud physics             variables into similar groups, k-means clustering (Mac-
 Large-scale prcp. 1 h sum                   m                 Cloud physics             Queen, 1967; Hartigan and Wong, 1979) is employed. Given
 Liquids around −10 ◦ C ∗                    kg m−2            Cloud physics
                                                                                         the desired number of clusters k, the k clusters are chosen
 Liquids updraft around −10 ◦ C ∗            kg Pa s−1         Cloud physics
 Max prcp. rate (h)                          kg m−2 s−1        Cloud physics
                                                                                         so that the sum of squared Euclidean distances of each cell-
 Max vertical velocity (up) ∗                Pa s−1            Wind field                hour to the nearest cluster mean is minimized. This mini-
 Mean sea level pressure                     Pa                Mass field                mization problem is solved iteratively using the algorithm of
 Moisture convergence                        kg m−2 s−1        Moisture field            MacQueen (1967) with 150 different sets of starting values
 Shear below cloud ∗                         m s−1             Wind field                in order to avoid getting stuck in local minima. k is set to
 Snow, total                                 kg m−2            Cloud physics             five clusters because the sum of squared distances clearly de-
 Solids around −10 ◦ C ∗                     kg m−2            Cloud physics             creases for every additional cluster until k = 5 but levels out
 Surface latent heat (up)                    J m−2             Surface exchange
                                                                                         for more than five clusters. Analyzing dendrograms from hi-
 Surface sensible heat (up)                  J m−2             Surface exchange
 Surface solar radiation (down)              J m−2             Surface exchange
                                                                                         erarchical clustering further supports this decision.
 Supercooled liquids, total                  kg m−2            Cloud physics                Principal component analysis (Mardia et al., 1995) is a
 Vapor −10 to −20 ◦ C ∗                      kg m−2            Moisture field            statistical method for dimension reduction that tries to find
 Vapor, total                                kg m−2            Moisture field            maximal variability within projections of the data. Each prin-
 Wind direction at 10 m ∗                    ◦                 Wind field                cipal component (PC) is a linear combination of projected
 Wind speed at 10 m ∗                        m s−1             Wind field                input data and is oriented perpendicular to the previous prin-
 −10 ◦ C isotherm height                     m a.g.l. ∗        Mass field                cipal components. The principal components are ranked by
CAPE: convective available potential energy, CIN: convective inhibition, a.g.l.: above   the variance they explain so that the most variance within
ground level, prcp.: precipitation.
                                                                                         the data is captured by the first few principal components.
                                                                                         Independent of the cluster analysis, the PCA is applied to
                                                                                         the 6304 cell-hours of 35 ERA5 variables. The resulting first
   – Moisture field. This includes humidity-related variables,
                                                                                         two principal components are used for visualizing the 35-
     such as dew point temperature, moisture divergence, or
                                                                                         dimensional data in a 2-dimensional so-called biplot to facil-
     total humidity.
                                                                                         itate interpretation. PC 1 and PC 2 are sufficient for a reason-
                                                                                         able interpretation because they together explain about 50 %
   – Surface exchange. This includes boundary layer height
                                                                                         of the variance within the data, whereas the explained vari-
     and fluxes between the surface and the atmosphere such
                                                                                         ance of PC 3 is already down to 7.6 %. The R code repli-
     as latent and sensible heat.
                                                                                         cating the clustering and principal component analysis of the
                                                                                         presented sample is provided in Morgenstern et al. (2022).
   For multivariate data analyses such as k-means cluster
analysis and principal component analysis (PCA), it is im-
portant that the underlying variables (here: ERA5) are on the                            4     Results
same scale and follow distributions as similarly as possible.
To mitigate the pronounced skewness of most of the ERA5                                  In this section, we first present the results of the cluster anal-
variables, all of them are transformed by taking square roots:                           ysis and the PCA, which reveals that most lightning in win-
              p                                                                          ter is explained by wind-field variables, while most lightning
xt = sign(x) abs(x),                                       (1)                           in summer is explained by mass-field variables (Sect. 4.1).

Weather Clim. Dynam., 3, 361–375, 2022                                                                       https://doi.org/10.5194/wcd-3-361-2022
D. Morgenstern et al.: Differentiating lightning in winter and in summer 365
Then we interpret the clusters meteorologically in more de- Analogously, the light-blue cluster is dominated by the wind-
tail. Wind-field thunderstorms are associated with shallow, field category and termed “wind-field thunderstorm” cluster,
rather warm clouds and high horizontal wind speed and and the dark-blue one is the “cloud-physics and wind-field
shear. CAPE thunderstorms are associated with increased thunderstorm” cluster.
values in the mass field with large CAPE values; high −10 ◦ C Reducing the number of clusters in the cluster analysis
isotherm heights; and deep, cold clouds (Sect. 4.2). Finally, leads to a combined “cloud-physics” cluster (k = 4) and a
we look at synoptic-scale processes related to the clusters large cluster uniting wind-field thunderstorms with CAPE
and find that wind-field thunderstorms occur in the region of thunderstorms (k = 3). This stresses how well the cluster
cyclogenesis and are characterized by strong westerly flow, analysis differentiates between lightning and no lightning in
while CAPE thunderstorms occur on the anticyclonic side of general and points to the importance of the cloud-physics
the jet with southwesterly flow (Sect. 4.3). variables to distinguish between thunderstorm types.
After having discovered that the five clusters correspond to
4.1 Cluster and principal component analysis different atmospheric processes and variables, Fig. 3 shows
that they also neatly fit into the four seasonal scenarios (win-
The statistical procedure of clustering ERA5 variables and ter vs. summer with and without lightning). The scenario of
applying a principal component analysis gives a physically lightning in winter is dominated by the clusters termed wind-
interpretable result. Figure 2 shows the 6304 cell-hours of field thunderstorms (light blue) and cloud physics and wind-
the dimension-reduced ERA5 variables, projected onto the field thunderstorms (dark blue); only a tiny fraction of the
2-dimensional space of the first two principal components cloud-physics and CAPE thunderstorm cluster contributes to
(PC 1 and PC 2; axes). Each cell-hour is represented by a it. The situation is reversed in the summer lightning scenario
color-coded symbol that indicates to which of the five clus- where the CAPE thunderstorm cluster and the cloud-physics
ters it belongs. The five clusters are located in different parts and CAPE thunderstorm cluster dominate (reds). However,
of the span of the first two principal components. The cell- some events from the wind-field thunderstorm cluster also
hours in the clusters symbolized by dark-red triangles and occur. The two no-lightning scenarios are dominated by the
dark-blue circles occupy the outer reaches of the upper- and average cluster (yellow) with some contributions of the wind-
lower-right quadrants, respectively, each covering approxi- field cluster in winter and of CAPE thunderstorms in sum-
mately 7 % of all cell-hours. Closer to the origin in the upper mer. Unsurprisingly, the separation between lightning and
two quadrants, the cluster symbolized by light-red triangles no-lightning scenarios with reanalysis variables is not com-
covers approximately 17 % of the cell-hours, and the cluster pletely sharp. But what is surprisingly clearly is that the sit-
in the lower two quadrants with the light-blue circles covers uations where wind-field variables dominate with large devi-
approximately 27 %. The largest cluster (41 %) depicted by ations from their average values correspond to the lightning
yellow diamonds is closest to the origin; i.e., the values of cases in winter. In summer, on the other hand, large devia-
the ERA5 variables in these cell-hours are close to average. tions from average in the mass field dominate the lightning
Accordingly, we label this cluster “average”. To find a possi- cases, and only a few wind-field-dominated cases occur.
ble physical meaning of the other four clusters, the so-called Extending our analysis to the full year (Morgenstern et al.,
“loadings” from the PCA are examined. 2022) reveals that spring and fall both consist of around 36 %
The loadings are shown as labeled arrows in Fig. 2. Their CAPE thunderstorms, 25 % wind-field thunderstorms, 20 %
length and direction depict how each variable contributes to cloud physics and CAPE thunderstorms, and 10 % cloud
creating the first two principal components. The loadings of physics and wind-field thunderstorms.
most variables from the cloud-physics category have a large
component parallel to the axis of the first principal compo- 4.2 Meteorological characterization of the clusters
nent (PC 1). Accordingly, the upper axis in the figure is la-
beled as “cloud physics” (increased vs. decreased). The load- Next, we zoom into the clusters and interpret the variables
ings of the variables from the other four physical categories, aggregated to them from a meteorological perspective.
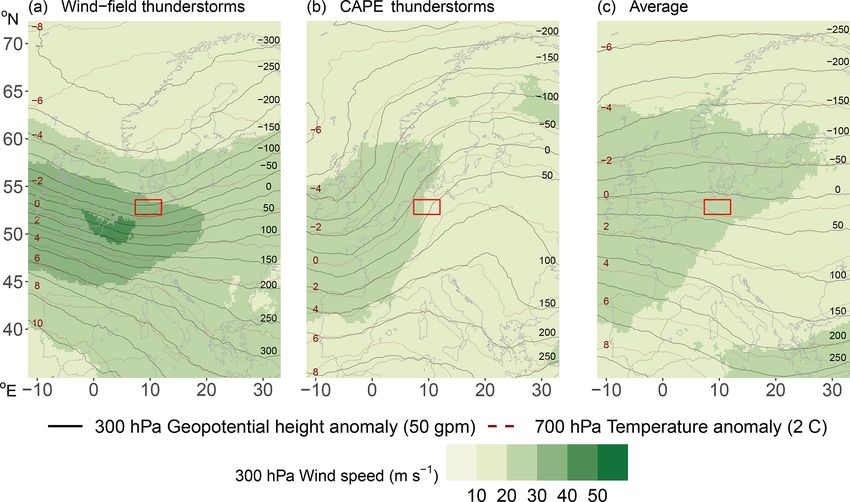
on the other hand, have a larger component parallel to the Figure 4 shows the cluster means of all 35 ERA5 vari-
second principal component (PC 2). The right axis in the fig- ables; the corresponding unscaled cluster medians are pre-
ure is labeled accordingly, yielding the physical meaning of sented in Table 2. The variables are grouped by their respec-
the remaining four clusters. tive physical category (mass field, wind field, cloud physics,
The light-red cluster extends largely along the positive part moisture field, and surface exchange). Values in the average
of the second principal component that is dominated by vari- cluster (Fig. 4, yellow) are close to zero, i.e., their mean.
ables of the mass-field and moisture-field categories, espe- Since the average cluster contains the no-lightning situa-
cially CAPE. It is accordingly named the “CAPE thunder- tions (cf. Fig. 3), which make up the predominant state of
storm” cluster. The dark-red cluster in the upper-right quad- the atmosphere, variables are expected to be in their typical
rant with a large component along both PCs can thus be range. This corroborates again that clustering reflects phys-
termed the “cloud-physics and CAPE thunderstorm” cluster. ical meaning. Figure 4 (cluster analysis) confirms what the
https://doi.org/10.5194/wcd-3-361-2022 Weather Clim. Dynam., 3, 361–375, 2022
366                                                     D. Morgenstern et al.: Differentiating lightning in winter and in summer

Figure 2. Plot of the 6304 cell-hours separated into five clusters by k-means clustering (colored symbols) and then projected onto their first
two principal components (PC 1 and PC 2). Labeled arrows (biplot) show the loading of each variable (35 in total), i.e., how it contributes to
creating the first two principal components. The top and right axes are labeled (in italics) to indicate the dominant physical categories defined
in Sect. 3.2. Note that the orientation of the arrows in the surface-exchange category depends largely on how the flux direction is defined.

                                                                           sents both mass-field and moisture-field variables and is high
                                                                           only in the CAPE thunderstorm clusters with median val-
                                                                           ues of 420 J kg−1 . When large values of CAPE are released,
                                                                           tall (cumulonimbus) clouds can form, and convective pre-
                                                                           cipitation ensues. Accordingly, events in the CAPE thunder-
                                                                           storm clusters also have high values in some variables of the
                                                                           other physical categories. From the cloud-physics category,
                                                                           the cloud size, convective precipitation, and maximum pre-
                                                                           cipitation rate are increased. From the wind-field category,
                                                                           shear and vertical velocity are increased. Tall clouds are more
                                                                           likely to have higher shear across their depth, and the release
                                                                           of CAPE leads to larger vertical velocities. Overall, CAPE
Figure 3. Stacked bar plot of the clusters (colors, y axis) found in       thunderstorms are responsible for most flashes in our study
the different scenarios (bars, x axis).                                    region because 84 % of the lightning cell-hours in summer
                                                                           (JJA) are clustered as CAPE thunderstorms. As summer is
                                                                           the main lightning season in our study region, we expect
loadings in Fig. 2 (PCA) already indicated: variables with                 CAPE thunderstorm processes to be the predominant light-
larger arrows towards a given cluster in Fig. 2 correspond to              ning mechanism there.
higher values for that cluster in Fig. 4.

4.2.1   CAPE thunderstorm clusters                                         4.2.2    Wind-field thunderstorm clusters

Figure 4 shows that indeed most mass-field variables have                  Figure 4 and Table 2 confirm that the values of the wind-field
large deviations from their average for the events separated               variables of the cell-hours grouped into the wind-field thun-
into the CAPE thunderstorm clusters (reds). The layer crucial              derstorm clusters (blue lines) are indeed unusually large. The
for the occurrence of charge separation – represented by the               wind speeds, shear, and dissipation of kinetic energy in the
−10 ◦ C isotherm – is high above the ground (median above                  boundary layer are all large. High shear also contributes to
5 km, see Table 2), which is typical for summer, for which                 a larger and downward-oriented sensible heat flux (from the
the CAPE thunderstorm clusters prevail. Also total column                  physical category of surface fluxes). Increased mechanical
water vapor (humidity) and the 2 m dew point temperature                   mixing, in turn, leads to deep (mixed) boundary layer heights
from the moisture-field category is increased. CAPE repre-                 of median more than 1 km, even with low solar-energy in-

Weather Clim. Dynam., 3, 361–375, 2022                                                           https://doi.org/10.5194/wcd-3-361-2022
D. Morgenstern et al.: Differentiating lightning in winter and in summer 367
Figure 4. Cluster means (color-coded) of scaled ERA5 variables arranged by physical categories (italics). Variables are transformed by the
square root and standardized to a mean of 0 and a standard deviation of 1 based on the scenarios without lightning.
put. As Fig. 3 shows, events in the wind-field clusters occur crease only by about 10 m s−1 in the lower half of the tropo-
mostly during winter. Accordingly, the −10 ◦ C isotherm is sphere up to 5 km. Strong summertime convection is driven
closer to the ground (median around 2,5 km), and the surface by the release of CAPE with wind shear playing a secondary
dew point and total column water vapor (from the moisture- role in organizing this convection. Our observed values of
field category) are lower. Surface temperatures in the study 10 m s−1 difference in horizontal wind speeds between the
region are mostly low but above freezing and in a rather nar- lower and upper troposphere for CAPE thunderstorms (reds,
row range (not shown) for events in the wind-field clusters. Fig. 5) point to the well-known fact that most summertime
Likely, strong shear and mechanical mixing, possibly aided thunderstorms are single cells or multicells (Markowski and
by the presence of clouds will prevent the buildup of noctur- Richardson, 2010). The large values of CAPE allow for verti-
nal cold pools. CAPE is around 22 J kg−1 and therefore close cal velocities of 10–20 m s−1 and more within thunderstorms,
to its normal value of zero. Unusually low mean sea level exceeding the horizontal wind speeds resulting in a mainly
pressure (from the mass-field category) hints at the reason for vertical separation path of the particles. For the wind-field
high wind speeds and shear: mid-latitude low-pressure sys- thunderstorms, the horizontal wind speeds in the lower tro-
tems and their associated strong baroclinicity, which leads to posphere are comparable or higher to the updrafts and might
larger values of vertical shear via the thermal wind relation- thus separate differently charged and differently sized cloud
ship. particles also in the horizontal direction. This supports the
Figure 5 presents clusterwise vertical profiles for wind hypothesis of shallow but tilted charge regions for lightning
speed. Events in the wind-field thunderstorm cluster (light in winter (Takeuti et al., 1978; Brook et al., 1982; Williams,
blue) have wind speeds about twice as high as events in the 2018).
CAPE thunderstorm (light and dark red) and average (yel-
low) clusters, respectively. Median wind speeds for those 4.2.3 The role of cloud physics within the lightning
events, where cloud-physics variables are particularly large involving clusters
(dark blue; discussed in more detail in the next section),
are even 3 times as large. Within the lowest kilometer, wind Cloud physical details are crucial for lightning to occur in
speeds in the wind-field cluster (light blue) increase by more general. Figure 3 shows that the average cluster contains
than 20 m s−1 . Since median speeds further up to almost 4 km most of the non-lightning events, and accordingly the cloud-
above sea level remain constant, horizontal temperature gra- physics variables are close to their scaled mean of zero
dients in this layer must be small. Overall, this shape of the (Fig. 4). In contrast, events in the wind-field thunderstorm
wind profile is typical of strong wintertime cyclones and (blues) and CAPE thunderstorm (reds) clusters come with
their associated cold fronts. For events in the CAPE thun- lightning (Fig. 3), and the scaled values of most of their
derstorm clusters (reds), which occur in the warm season (cf. cloud-physics variables are elevated above zero. Yet the clus-
Fig. 3), wind shear is much lower. There, the wind speeds in- tering algorithm detected two groups of events with vastly
elevated values of the cloud-physics variables (dark blue and
https://doi.org/10.5194/wcd-3-361-2022 Weather Clim. Dynam., 3, 361–375, 2022368 D. Morgenstern et al.: Differentiating lightning in winter and in summer
Table 2. Cluster medians.
Variable Unit Cloud physics Wind field Average CAPE Cloud physics
and wind field and CAPE
CAPE J kg−1 22 22 1 415 425
CIN > 0 Binary 0 0 0 1 1
−10 ◦ C isotherm height m a.g.l. 2629 2234 4160 5171 5244
Mean sea level pressure hPa 1003.9 1003.4 1016.8 1011.4 1010.4
Wind direction at 10 m ◦ 249 250 227 214 216
Wind speed at 10 m m s−1 8.8 6.6 3.4 2.7 2.9
Shear below cloud m s−1 8.3 10.0 4.9 6.0 8.2
Cloud shear m s−1 29.7 17.6 3.8 10.3 15.2
Boundary layer dissipation W m−2 34.4 14.5 1.9 1.4 1.7
Max vertical velocity (up) Pa s−1 1.33 0.41 0.14 0.36 1.00
Liquids updraft around −10 ◦ C g Pa s−1 22.77 0.26 0 0.01 2.83
Liquids around −10 ◦ C g m−2 24.56 2.68 0 1.63 5.12
Cloud liquids −10 to −20 ◦ C g m−2 51.2 1.42 0 0.73 6.67
Solids around −10 ◦ C g m−2 128.99 8.32 0 5.81 66.7
Cloud snow −10 to −20 ◦ C g m−2 216.66 13.30 0 9.30 145.21
Cloud ice −10 to −20 ◦ C g m−2 67.15 5.75 0 3.15 27.37
Cloud snow −20 to −40 ◦ C g m−2 82.61 14.35 0.01 11.63 158.57
Cloud ice −20 to −40 ◦ C g m−2 143.48 20.05 0.04 9.59 147.19
Supercooled liquids, total g m−2 103.30 31.86 6.23 17.14 27.54
Snow, total g m−2 851.8 55.2 0.8 43.7 512.3
Ice, total g m−2 245.2 46.4 2.5 36.6 285.8
Ice divergence g m−2 h−1 72.8 −3.0 −0.2 −1.2 16.4
Cloud base height m a.g.l. 282 450 672 1283 1362
Cloud thickness m 7125 6440 1234 8410 10 645
Convective prcp. 1 h sum mm 0.32 0.09 0 0.03 0.47
Large-scale prcp. 1 h sum mm 0.69 0.04 0 0 0.02
Max prcp. rate (h) mm h−1 1.59 0.30 0 0.03 1.02
Vapor −10 to −20 ◦ C kg m−2 2.13 1.51 0.96 1.38 2.00
Moisture convergence kg m−2 h−1 0.88 0.19 −0.04 0.22 1.92
Vapor, total kg m−2 13.9 10.4 15.5 33.7 38.1
Dew point at 2 m K 276.8 275.7 280.4 289.8 289.9
Surface sensible heat (up) W m−2 −63 −44 −4 15 −8
Surface latent heat (up) W m−2 83 40 18 107 69
Surface solar radiation (down) W m−2 18 1 41 207 84
Boundary layer height m 1433 1143 595 556 429
CAPE: convective available potential energy, CIN: convective inhibition, a.g.l.: above ground level, prcp.: precipitation.
dark red). Together these two groups cover 24 % of the data nied by some vastly elevated values of wind-field variables,
in the lightning involving clusters and would merge when whereas the summertime cloud-physics and CAPE thunder-
reducing the number of clusters to k = 4. They have much storm cluster differs from the CAPE thunderstorm cluster
higher cloud particle concentrations compared to the other only by elevated values of cloud physics, not in mass-field
lightning involving clusters. Consequently, these are events values. The type of precipitation that occurs for events in
when thick clouds with large amounts of particles needed these cloud-physics clusters indicates again the accompany-
for charge separation are present in the ERA5 reanalysis. Of ing weather types. Wintertime events in the cloud-physics
secondary importance are then either wind-field variables, and wind-field cluster come with unusually large values of
putting these events into the cloud-physics and wind-field large-scale precipitation indicative of large-scale slanted as-
thunderstorm cluster, which occurs in winter (cf. Fig. 3), or cent in mid-latitude cyclones, whereas precipitation from
mass-field variables, putting them into the cloud-physics and convection plays a minor role. The opposite is the case for
CAPE thunderstorm cluster, which occurs in summer. The events in the summertime cloud-physics and CAPE thunder-
wintertime cloud-physics and wind-field cluster is accompa-
Weather Clim. Dynam., 3, 361–375, 2022 https://doi.org/10.5194/wcd-3-361-2022D. Morgenstern et al.: Differentiating lightning in winter and in summer 369
(factor of 1 without and factor of 2.9 with cloud physics) in
regions that are colder than −10 ◦ C, resulting in rather cold
clouds. Hence, during lightning in winter, clouds are – inte-
grated over their depth – overall warmer than summer clouds.
The shape of the vertical cloud particle distribution is con-
sistent with the possibility of charge separation to have oc-
curred (panels for ice, snow, droplets, and rain). Both the for-
mation of a graupel dipole and a snow dipole, respectively,
require a spatial separation of light ice crystals and heav-
ier solid hydrometeors after their charge transferring colli-
sions1 in the presence of supercooled liquid water. And in-
deed, for events in the wind-field thunderstorm and CAPE
thunderstorm clusters, ice crystal maxima (ice panel) are sev-
eral kilometers above the solid hydrometeor maxima (snow
panel), and the zone of cloud liquids (droplets panel) in-
clude the −10 ◦ C isotherm. Events in the no-lightning av-
erage cluster (yellow) have either no or only shallow clouds,
which consist mostly of suspended droplets so that no charge
separation is possible.
Figure 5. Clusterwise medians along with upper and lower quartiles
of wind speed at each model level in ERA5 plotted at the mean 4.3 Weather patterns
model level height of the respective clusters.
The clusters found by the cluster analysis are associated not
only with typical variables and seasons but also with typical
storm cluster. There, precipitation is mostly from convection weather patterns. Figure 7 shows median weather patterns for
(i.e., vertical ascent). the three largest clusters. The clusters with enhanced cloud
Some cloud-physics variables, such as the cloud size, the physics are not shown, since weather patterns are similar
distribution of cloud particles relevant for charge separation, to those of their moderate counterparts. Wind speed (color)
and the temperature, are better understood when looking at and anomalies of geopotential height (black lines) at 300 hPa
their vertical profiles. Figure 6 shows such profiles for sus- are plotted along with anomalies of temperature (red dotted
pended particles (ice crystals and droplets), hydrometeors lines) at 700 hPa.
(snow and rain), and their sums along with the mean −10 ◦ C Events grouped into the wind-field thunderstorm cluster
isotherm height for each cluster. The large difference be- (Fig. 7a) have a strong inflow from west-northwest towards
tween the clusters with enhanced cloud physics (dark blue the study region in northern Germany, as the tightly packed
and dark red) and their moderate counterparts (light blue and isohypses (black lines) show. The study region is located
light red) is directly visible because their quartiles do not in- in the left exit region and at the cold and cyclonic side of
tersect over large areas. the jet, where cyclogenesis and ascent take place as can be
Regarding the cloud size, Fig. 6 shows that the cloud base shown using ageostrophic-circulation reasoning (e.g., Mar-
during events in the wind-field clusters (blues) is approxi- tin, 2006). At 700 hPa, a substantial horizontal northeast–
mately 1 km lower than for events in the CAPE thunderstorm southwest temperature gradient becomes apparent (approx-
clusters (reds; lowest level in the sum or droplets panel or imately 8 ◦ C per 1000 km). Lightning events in the CAPE
Table 2). Cloud tops in the wind-field clusters are approxi- thunderstorm clusters (Fig. 7b) predominantly originate in
mately 5 km shallower, having cloud top heights at around 7 southwestern weather patterns. The study region is situated
vs. 12 km in CAPE thunderstorm clusters (highest levels in at the warm and anticyclonic side of the jet, prevalently in the
the sum or ice panel). Put differently, considering that wind- warm sector of the frontal systems. Ageostrophic circulations
field thunderstorm events occur in winter and that CAPE favor large-scale descent. However, advection of warm and
thunderstorm events occur in summer, thunderstorm clouds moist air from the Mediterranean Sea potentially increases
in winter are lower-based and considerably shallower than in CAPE with convection ensuing when it is triggered and re-
summer. This has a somewhat surprising consequence on the leased. Events in the average cluster (Fig. 7c) mostly lack
temperatures of these clouds. Looking at the cloud mass (sum lightning. While they are a composite of various weather pat-
of all cloud particles) below and above the −10 ◦ C isotherm terns, the zonal pattern of the isohypses reflects the predomi-
(dashed lines) of wind-field thunderstorm clouds (blues), the
larger part (factor of 1.7 without and factor of 2.3 with cloud
physics) is warmer than −10 ◦ C. CAPE thunderstorm clouds 1 Graupel and snow are not distinguished in the ERA5 reanalysis,
(reds) have similar or larger cloud particle concentrations which has only one summarizing variable of solid hydrometeors.
https://doi.org/10.5194/wcd-3-361-2022 Weather Clim. Dynam., 3, 361–375, 2022370 D. Morgenstern et al.: Differentiating lightning in winter and in summer
Figure 6. Clusterwise medians along with upper and lower quartiles of suspended particles (ice crystals and droplets) and hydrometeors
(snow and rain) at each model level in ERA5 plotted at the mean model level height of the respective clusters. For each cluster the mean
height of the −10 ◦ C isotherm is included as a dotted line. The last panel displays the sum of the other four and uses a different scale.
Figure 7. Median weather charts for the clusters in the observational region (red rectangle) showing wind speed (colors) and anomalies of
geopotential height relative to the mean (solid black lines) at 300 hPa and temperature anomalies at 700 hPa (dotted red lines). Number of
charts composed for each cluster: 1729 for the wind-field thunderstorms (a), 1096 for the CAPE thunderstorms (b), and 2591 for the average
cluster (c).
nance of westerly flow as a result of the north–south-oriented ables that are potentially important for the formation of light-
temperature gradient typical of a mid-latitude region. ning (e.g., Vogel et al., 2016; Kolendowicz et al., 2017) and
putting them through a clustering and principal component
analysis yielded four physically meaningful clusters that dis-
5 Discussion tinguish different types of thunderstorms. In the first type (cf.
Fig. 4), variables in the mass-field category such as CAPE,
Rather than taking the common approach of looking at differ- CIN (convective inhibition), or the height of the −10 ◦ C
ences between thunderstorms in winter and summer, we have isotherm deviate strongly from their average values (CAPE
taken a data-driven approach. Starting with a large set of vari-
Weather Clim. Dynam., 3, 361–375, 2022 https://doi.org/10.5194/wcd-3-361-2022D. Morgenstern et al.: Differentiating lightning in winter and in summer 371
thunderstorms). In the second type, variables in the wind- time studies of thunderstorm days in central-eastern Europe
field category such as shear within the cloud, 10 m wind (Kolendowicz et al., 2017) and derechos (high-impact con-
speed, or boundary layer dissipation deviate strongly (wind- vective wind events) in winter in Germany (Gatzen et al.,
field thunderstorms). The other two types are variants of the 2020). Due to the stronger horizontal temperature gradients
previous two but have additionally pronounced deviations in mid-latitudinal winter, higher wind speeds and thus wind-
in variables within the cloud-physics category such as the field thunderstorms also occur elsewhere, e.g., USA and
mass of solid cloud particles or precipitation amounts (cloud Japan. For the USA, Bentley et al. (2019) have evidence that
physics and wind-field thunderstorms and cloud physics and lightning in winter is often associated with the development
CAPE thunderstorms). and progression of mid-latitude cyclones and that the synop-
The clear distinction between thunderstorm types char- tic weather systems are more important than insolation. Our
acterized by high values in either the wind field or the results in Fig. 7a also locate wind-field thunderstorms into
mass field highlights that thunderstorms should not be con- the left exit region of the jet, where cyclogenesis typically
flated with strong convection. Strong moist convection de- occurs (e.g., Martin, 2006). Sometimes lightning in winter is
pends upon high vertical velocity and deep clouds, which re- referred to as high-shear low-CAPE (HSLC) storms (Johns
quires the presence of CAPE and a trigger to release it. Only et al., 1993; Sherburn and Parker, 2014). However, thresholds
CAPE thunderstorms fulfill these requirements, while CAPE of 500 J kg−1 to define “low CAPE” constitute high CAPE in
in wind-field thunderstorms is basically zero. However, the our target region where wind-field thunderstorms have me-
defining characteristic of a thunderstorm is thunder caused dian values of 22 J kg−1 for CAPE and could thus analo-
by lightning (WMO, 1992), and lightning occurs when dif- gously be named “high-shear no-CAPE” events.
ferently charged regions in a cloud equalize. Those charged Large-scale weather patterns leading to CAPE thunder-
regions are thought to form when different cloud particles storms, characterized by large CAPE values (median of
collide and are subsequently spatially separated by differen- 415 J kg−1 ) and increased heights of the −10 ◦ C isotherm
tial terminal velocities (e.g., Williams, 2018). In CAPE thun- (median of 5170 m) dominate in the warm season in our
derstorms, vertical velocities are usually large (10–50 m s−1 ) study region. The preferred weather pattern of southwesterly
when CAPE is released, but in wind-field thunderstorms, flow (Fig. 7b) was also found to be important for summertime
CAPE is too small (∼ 22 J kg−1 ) to explain the necessary lightning in the larger area of central Europe (Kaltenböck
vertical motions. Instead, it seems that high horizontal wind et al., 2009; Westermayer et al., 2016; Kolendowicz et al.,
speeds and large vertical shear of the horizontal wind cause 2017) and accounts for the majority of lightning activity in
the charge separation (cf. Fig. 5 and Table 2). Separation of Europe. CAPE thunderstorms are well described in the litera-
the charge regions is then no longer predominantly in the ture and often taken to be synonymous with thunderstorms in
vertical but strongly tilted – known as the “tilted charge hy- general (e.g., Williams et al., 2005; Kaltenböck et al., 2009;
pothesis” (Takeuti et al., 1978; Brook et al., 1982; Engholm Mora et al., 2015; Stolz et al., 2017; Kolendowicz et al.,
et al., 1990; Williams, 2018; Takahashi et al., 2019; Wang 2017; Dewan et al., 2018; Etten-Bohm et al., 2021).
et al., 2021). These tilted charge regions were first observed The statistical approach of clustering and principal com-
in Japan during winter with high, strongly sheared horizon- ponent analysis found two more clusters that are variants of
tal wind speeds (Takeuti et al., 1978; Brook et al., 1982) and the wind-field thunderstorm type and CAPE thunderstorm
have since been observed in (mesoscale convective) storms type and vary seasonally in the same way. For them, cloud-
in winter and summer (Brook et al., 1982; Engholm et al., physics variables strongly deviate from average conditions.
1990; Levin et al., 1996; Dotzek et al., 2005; Liu et al., 2011; They point to the need for including cloud physics for the
Takahashi et al., 2019). The discussion is often accompanied indirect diagnosis of thunderstorms from atmospheric proxy
by an analysis of increased positive lightning discharges in variables, since cloud physics is essential for electrification.
winter (Takeuti et al., 1978; Brook et al., 1982; Takagi et al., The study area was deliberately limited to a topograph-
1986; Takahashi et al., 2019; Wang et al., 2021). Observa- ically uniform region (northern Germany) to reduce the
tions of longer lightning channels in high-wind conditions complexity of the problem. The data-driven approach used
(López et al., 2017; Yoshida et al., 2018) further support the here should easily transfer to other regions. When larger,
tilted charge hypothesis. non-homogeneous regions are studied, the data-scaling tech-
Whether a wind-field thunderstorm or CAPE thunder- niques will have to be extended to be able to deal with spa-
storm occurs depends on the larger-scale synoptic environ- tially varying means and anomalies.
ment. In the northern Germany study region, the prevalence Using a lightning location system (LLS) to detect light-
of these environments strongly varies seasonally. Weather ning misses a particular type of upward lightning, which con-
patterns with unusually large values in wind-field-related sists of a continuous current only. Lightning such as that can
variables (cf. Fig. 7a) dominate in winter. Accordingly, the currently only be detected at very few specially instrumented
wind-field thunderstorms occur mostly in the cold season. towers. While it is rare in absolute numbers and affects only
Similar weather patterns as in Fig. 7a with strong, mostly tall structures above 100 m, it might contribute up to half of
zonal flow and high wind speeds are found in winter- the lightning activity in winter at such locations (Diendorfer
https://doi.org/10.5194/wcd-3-361-2022 Weather Clim. Dynam., 3, 361–375, 2022372 D. Morgenstern et al.: Differentiating lightning in winter and in summer
et al., 2015). Preliminary results indicate that these lightning shear so that the charge separation happens along a slanted
events occur in wind-field thunderstorms, corroborating the path.
findings of this study (Stucke et al., 2022). Wind-field thunderstorms are characterized by horizontal
Our results show that in order to distinguish physically dif- wind speeds that approximately triple in the lowest kilome-
ferent thunderstorm types, atmospheric variables describing ter (Fig. 5) to reach median values of more than 20 m s−1
wind field, mass field, and cloud physics must be included and even more than 27 m s−1 for the variant with pronounced
(cf. Figs. 2–4). Identifying thunderstorms and lightning from cloud-physics variables. Consequently, the dissipation of ki-
single or just a few atmospheric proxy variables is inaccurate. netic energy in the boundary layer and boundary layer height
Using only CAPE (or related) variables will even completely is also increased. Synoptically, wind-field thunderstorms oc-
miss the wind-field thunderstorm class where different phys- cur in the left exit region at the cold and cyclonic side of the
ical processes are at work. jet with inflow from the west-northwest. It is the region of
cyclogenesis, strong updrafts, and large-scale precipitation.
These larger-scale patterns occur mostly in winter. Clouds
6 Conclusions are shallow and close to the ground. Especially in the thun-
derstorm types with enhanced cloud physics, most parts of
In most mid-latitude regions, lightning in winter contributes the clouds are warmer than −10 ◦ C, and, integrated over
only a few percent to the annual number of flashes. In our their depth, wind-field thunderstorm clouds are warmer than
study region in northern Germany, there is approximately CAPE thunderstorm clouds. This results in a larger fraction
70 times more lightning in summer than in winter. We inves- of cloud droplets, warmer snow, and shallow regions consist-
tigated whether the same atmospheric conditions as for sum- ing only of hydrometeors. The wind-field thunderstorm type
mertime thunderstorms were at play in winter but only oc- with increased cloud-physics variables stands out by even
curred much less frequently and less pronounced or whether larger deviations in the previously mentioned variables and
winter thunderstorms were physically different. occurs in similar weather patterns.
Following a data-driven approach, we used 35 atmospheric CAPE thunderstorms have large CAPE values and convec-
variables from the ERA5 reanalysis belonging to five mete- tive inhibition (CIN) present and are further characterized by
orological categories (mass field, wind field, cloud physics, deep, cold clouds with a dominating region consisting of sus-
moisture field, and surface exchange) and fed them indepen- pended ice particles and solid hydrometeors. They take place
dent of each other into a clustering and a principal component in summer. Synoptically, CAPE thunderstorms in northern
algorithm. These hourly data are linked to observations with Germany occur in southwesterly flow at the anticyclonic side
and without lightning in winter (DJF) and summer (JJA), and of the jet. Usually, warm and moist air is advected from the
the variables have shown to be potentially relevant for light- Mediterranean Sea. The variant of CAPE thunderstorms with
ning. much higher values in the cloud-physics variables occurs in
The statistical analysis returned four clusters (thunder- similar weather patterns and with mass-field values similar to
storm types) that have the same physical interpretation with the CAPE thunderstorm type. However, the clouds are deeper
respect to their cluster means. The two main lightning and have larger amounts of cloud particles accompanied by
types consist of events for which ERA5 variables in ei- strong updrafts and large precipitation amounts.
ther the wind-field (wind-field thunderstorms) or the mass- In summary, the data-driven approach yielded physically
field (CAPE thunderstorms) category strongly deviate from different types of thunderstorms, for which the defining
their means. The other two types are variants of the wind- larger-scale flow situations also vary seasonally. Winter light-
field thunderstorm and CAPE thunderstorm, respectively, for ning is therefore not just a weaker and rarer sibling of sum-
which additionally the cloud-physics variables strongly de- mer lightning but driven by wind-field variables instead of
viate from their mean values. Our study region is struck mass-field variables.
by lightning from wind-field thunderstorms predominantly
(88 %) in the cold season, whereas CAPE thunderstorm light-
ning occurs only in the warm season (98 %). Code and data availability. A precise variable description, the data
Differently charged layers in the atmosphere are thought of the representative sample presented here, an R script that repro-
to come about by the collision of different types of cloud duces the core analysis and Figs. 2–4, and the results from an analog
particles and hydrometeors such as ice crystals and graupel analysis also covering the intermediate seasons spring and fall are
available at https://doi.org/10.5281/zenodo.5851700 (Morgenstern
during which charge is transferred, followed by a subsequent
et al., 2022).
size-dependent separation. The required terminal velocities
ERA5 data are freely available from the Copernicus Climate
in CAPE thunderstorms originate from strong vertical veloc- Change Service (C3S) Climate Data Store (Hersbach et al., 2020;
ities when substantial amounts of CAPE are released. The https://cds.climate.copernicus.eu, last access: 19 April 2021). We
median value of CAPE in CAPE thunderstorms in our study use ERA5 hourly data from 1979 to present on single level, pres-
region is 415 J kg−1 . For wind-field thunderstorms, the strong sure level, and model level (https://doi.org/10.24381/cds.adbb2d47,
velocities occur mostly horizontally but with a strong vertical Hersbach et al., 2018a; https://doi.org/10.24381/cds.bd0915c6,
Weather Clim. Dynam., 3, 361–375, 2022 https://doi.org/10.5194/wcd-3-361-2022You can also read