Future glacial lake outburst flood (GLOF) hazard of the South Lhonak Lake, Sikkim Himalaya
←
→
Page content transcription
If your browser does not render page correctly, please read the page content below
Zurich Open Repository and
                                                                        Archive
                                                                        University of Zurich
                                                                        Main Library
                                                                        Strickhofstrasse 39
                                                                        CH-8057 Zurich
                                                                        www.zora.uzh.ch

 Year: 2021

Future glacial lake outburst flood (GLOF) hazard of the South Lhonak Lake,
                               Sikkim Himalaya

 Sattar, Ashim ; Goswami, Ajanta ; Kulkarni, Anil V ; Emmer, Adam ; Haritashya, Umesh K ; Allen,
                             Simon ; Frey, Holger ; Huggel, Christian

Abstract: The Teesta basin in Sikkim Himalaya hosts numerous glacial lakes in the high altitude glacier-
ized region, including one of the largest and the fastest-growing South Lhonak Lake. While these lakes
are mainly located in remote and unsettled mountain valleys, far-reaching glacial lake outburst floods
(GLOFs) may claim lives and damage assets up to tens of kilometers downstream. Therefore, evaluating
GLOF hazard associated with current and potential future glacier-retreat-driven changes is of high impor-
tance. In this work, we assess the future GLOF hazard of the South Lhonak Lake by integrating glacier
and hydrodynamic modeling to calculate the lake’s future volume and hydraulic GLOF characteristics
and impacts along the valley. We identify the increased susceptibility of the lake to potential avalanche
impacts as the lake grows in the future. Here we model six avalanche scenarios of varying magnitudes
to evaluate the impact-wave generated in the lake and overtopping flow at the dam. Avalanche simula-
tions indicate that the frontal moraine is susceptible to overtopping. The overtopping flow hydraulics is
evaluated along the channel assuming no erosion of the moraine. Further, we consider three lake-breach
scenarios to model GLOFs originating from the lake, flow propagation, and its downstream impacts.
The uncertainty in the breach parameters including breach width and time of failure are calculated to
estimate the upper and the lower hydraulic limits of potential future GLOF events. Further, the uncer-
tainty in the flow hydraulics was evaluated using dynamic flood routing of six GLOFs that originate from
the lake. Hydrodynamic GLOF modeling resulted in a predicted peak discharge of 4311 m3s−1, 8000
m3s−1, and 12,487 m3s−1 for breach depths of 20 m, 30 m, and 40 m respectively. The large-potential
scenario suggests that maximum flow depth and flow velocity at Chungthang, a town proximally located
to a major hydropower station built-in 2015, could reach up to 25–30 m and 6–9 m s−1, respectively.
Mapping infrastructure exposed to GLOFs in the Teesta valley shows that many settlements and assets
located along the river channel at Chungthang are potentially exposed to future GLOFs, indicating the
need to conduct a full environmental impact assessment and potentially undertake GLOF risk mitigation
measures.

DOI: https://doi.org/10.1016/j.geomorph.2021.107783

Posted at the Zurich Open Repository and Archive, University of Zurich
ZORA URL: https://doi.org/10.5167/uzh-206072
Journal Article
Published Version

The following work is licensed under a Creative Commons: Attribution-NonCommercial-NoDerivatives
4.0 International (CC BY-NC-ND 4.0) License.
Originally published at:
Sattar, Ashim; Goswami, Ajanta; Kulkarni, Anil V; Emmer, Adam; Haritashya, Umesh K; Allen, Simon;
Frey, Holger; Huggel, Christian (2021). Future glacial lake outburst flood (GLOF) hazard of the South
Lhonak Lake, Sikkim Himalaya. Geomorphology, 388:107783.
DOI: https://doi.org/10.1016/j.geomorph.2021.107783

                                                 2
Geomorphology 388 (2021) 107783

                                                                     Contents lists available at ScienceDirect

                                                                            Geomorphology

                                                 journal homepage: www.elsevier.com/locate/geomorph

Future Glacial Lake Outburst Flood (GLOF) hazard of the South Lhonak
Lake, Sikkim Himalaya
Ashim Sattar a,e,⁎, Ajanta Goswami b, Anil.V. Kulkarni c, Adam Emmer d, Umesh K. Haritashya a, Simon Allen e,f,
Holger Frey e, Christian Huggel e
a
  Department of Geology and Environmental Geosciences, University of Dayton, Dayton, OH, USA
b
  Department of Earth Sciences, Indian Institute of Technology, Roorkee, India
c
  Divecha Centre for Climate Change, Indian Institute of Science, Bangalore, India
d
  Cascade – Mountain Processes and Mountain Hazards Group, Institute of Geography and Regional Science, University of Graz, Austria
e
  Environment and Climate: Impacts, Risks and Adaptation (EClim), Department of Geography, University of Zurich, Switzerland
f
  Climatic Change Impacts and Risks in the Anthropocene (C-CIA), Institute for Environmental Sciences, University of Geneva, Geneva, Switzerland

a r t i c l e          i n f o                              a b s t r a c t

Article history:                                            The Teesta basin in Sikkim Himalaya hosts numerous glacial lakes in the high altitude glacierized region, includ-
Received 12 September 2020                                  ing one of the largest and the fastest-growing South Lhonak Lake. While these lakes are mainly located in remote
Received in revised form 2 March 2021                       and unsettled mountain valleys, far-reaching glacial lake outburst floods (GLOFs) may claim lives and damage as-
Accepted 13 May 2021
                                                            sets up to tens of kilometers downstream. Therefore, evaluating GLOF hazard associated with current and poten-
Available online 17 May 2021
                                                            tial future glacier-retreat-driven changes is of high importance. In this work, we assess the future GLOF hazard of
Keywords:
                                                            the South Lhonak Lake by integrating glacier and hydrodynamic modeling to calculate the lake's future volume
Glacial lake outburst flood                                  and hydraulic GLOF characteristics and impacts along the valley. We identify the increased susceptibility of the
South Lhonak                                                lake to potential avalanche impacts as the lake grows in the future. Here we model six avalanche scenarios of
Himalaya                                                    varying magnitudes to evaluate the impact-wave generated in the lake and overtopping flow at the dam. Ava-
Hazard                                                      lanche simulations indicate that the frontal moraine is susceptible to overtopping. The overtopping flow hydrau-
Risk                                                        lics is evaluated along the channel assuming no erosion of the moraine. Further, we consider three lake-breach
Uncertainty                                                 scenarios to model GLOFs originating from the lake, flow propagation, and its downstream impacts. The uncer-
                                                            tainty in the breach parameters including breach width and time of failure are calculated to estimate the upper
                                                            and the lower hydraulic limits of potential future GLOF events. Further, the uncertainty in the flow hydraulics
                                                            was evaluated using dynamic flood routing of six GLOFs that originate from the lake. Hydrodynamic GLOF model-
                                                            ing resulted in a predicted peak discharge of 4311 m3s−1, 8000 m3s−1, and 12,487 m3s−1 for breach depths of 20
                                                            m, 30 m, and 40 m respectively. The large-potential scenario suggests that maximum flow depth and flow veloc-
                                                            ity at Chungthang, a town proximally located to a major hydropower station built-in 2015, could reach up to 25–
                                                            30 m and 6–9 m s−1, respectively. Mapping infrastructure exposed to GLOFs in the Teesta valley shows that many
                                                            settlements and assets located along the river channel at Chungthang are potentially exposed to future GLOFs,
                                                            indicating the need to conduct a full environmental impact assessment and potentially undertake GLOF risk
                                                            mitigation measures.
                                                                 © 2021 The Author(s). Published by Elsevier B.V. This is an open access article under the CC BY-NC-ND license
                                                                                                                          (http://creativecommons.org/licenses/by-nc-nd/4.0/).

1. Introduction                                                                                   et al., 2019; Farinotti et al., 2020). With increased glacier retreat, there
                                                                                                  has been an accelerated lake growth over the past few decades in high
    The formation of glacial lakes can be seen as a direct indication of                          mountains of the world (Hoelzle et al., 2003; Paul et al., 2004;
glacier changes, as most of these lakes form when glaciers retreat                                Gardelle et al., 2011; Bolch et al., 2012; Haritashya et al., 2018; Shugar
(Gardelle et al., 2011; Zhang et al., 2015). In the High Mountain Asia, gla-                      et al., 2020). This growth of the proglacial lakes depends on the exposed
cier mass loss and recession is observed in most parts except for regions                         bed topography as glaciers retreat (Linsbauer et al., 2016; Allen et al.,
in the Karakoram and Kunlun (Bolch et al., 2012; Azam et al., 2018; King                          2016; Sattar et al., 2019b; Emmer et al., 2021). As the lake grows, so
                                                                                                  does its potential to cause catastrophic Glacial Lake Outburst Floods
  ⁎ Corresponding author at: Environment and Climate: Impacts, Risks and Adaptation
                                                                                                  (GLOF) depending on factors including the total drainable volume,
(EClim), Department of Geography, University of Zurich, Switzerland.                              exposure to potential mass-movement impacts, and structural integrity
    E-mail addresses: ashim.sattar@gmail.com, ashim.sattar@geo.uzh.ch (A. Sattar).                of the frontal moraine (in the case of moraine-dammed lakes). In

https://doi.org/10.1016/j.geomorph.2021.107783
0169-555X/© 2021 The Author(s). Published by Elsevier B.V. This is an open access article under the CC BY-NC-ND license (http://creativecommons.org/licenses/by-nc-nd/4.0/).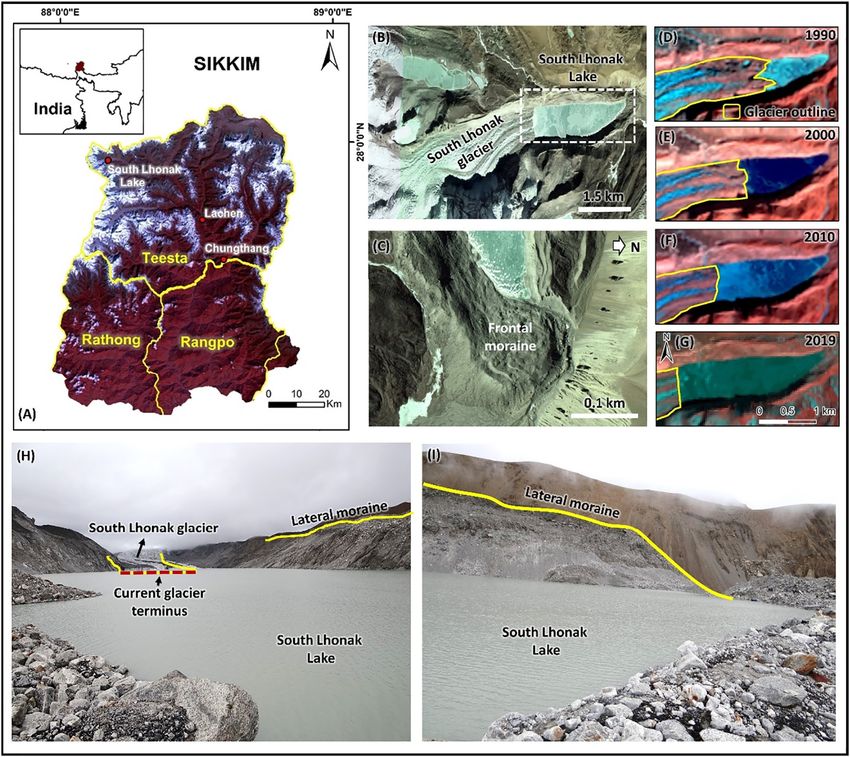
A. Sattar, A. Goswami, A.V. Kulkarni et al.                                                                                     Geomorphology 388 (2021) 107783

Himalaya, expansion of the existing lakes and the formation of numer-            mapped (Raj et al., 2013). Later, Aggarwal et al. (2017) presented an in-
ous new glacial lakes are occurring rapidly (Komori, 2008; Watanabe              ventory using Resourcesat-2 and LISS IV imageries, reporting a total of
et al., 2009; Gardelle et al., 2011; Raj and Kumar, 2016; Shukla et al.,         472 lakes (> 0.01 km2), of which 21 lakes were identified as potentially
2018; Haritashya et al., 2018; Shugar et al., 2020). Many of these lakes         critical. Strikingly, in all these studies, South Lhonak Lake has been iden-
are dammed by unconsolidated glacial deposits forming unstable mo-               tified as potentially dangerous with a high outburst probability.
raines, failure of which can be triggered by various mechanisms, but                 In Sikkim, the lake-terminating glaciers have shown accelerated
commonly from mass movements that enter into the lake, for example,              growth compared to the glaciers with no lakes (Aggarwal et al., 2017).
avalanches, rockfalls, landslides, and calving processes (Richardson and         South Lhonak glacier is no different; it is one of the fastest retreating gla-
Reynolds, 2000; Liu et al., 2013). GLOFs can also be triggered by extreme        ciers and the associated proglacial lake has become the largest and
meteorological conditions, especially heavy rainfall events that cause           fastest-growing in the state (Aggarwal et al., 2017). The glacier receded
degradation of the damming moraine and leads to overfilling of the                ~2 km in 46 years from 1962 to 2008 (Raj et al., 2013). It further
lake (Worni et al., 2012). The Kedarnath disaster in the central Himalaya        retreated by ~400 m from 2008 to 2019 (Fig. 1). It has been a growing
is one of the most devastating examples (Allen et al., 2016). Owing to           concern now about the hazard potential of this lake, as the downstream
the recent developments in terms of infrastructure and human settle-             valley is heavily populated with numerous settlements and infrastruc-
ments within the mountainous regions of the Himalaya, the existence              ture. The Central Water Commission, Government of India, initiated an
of glacial lakes in the high altitude of the Himalaya has become a               advisory to evaluate the South Lhonak glacier and its lake system. The
major concern to the downstream communities (Richardson and                      initial hazard assessment of the South Lhonak Lake based on the current
Reynolds, 2000; Bajracharya et al., 2008; Worni et al., 2013; Sattar et          condition suggests that the lake has great potential to significantly im-
al., 2019a; Sattar et al., 2019c).                                               pact the downstream region (Sattar et al., 2019a). However, as the
     Catastrophic GLOFs have been reported from the Hindu Kush–                  lake grows, it becomes important to evaluate both current and future
Karakoram–Himalaya (HKKH) region, Cordillera Blanca, Andes,                      hazards and the risk it imposes on the downstream region.
Rocky Mountains, Swiss Alps, and many other glacierized mountain                     This study focuses on evaluating the future GLOF hazard of the South
ranges, causing severe damage to humankind and infrastructure                    Lhonak Lake considering a series of potential GLOF scenarios. Our spe-
(e.g., Anacona et al., 2015; Somos-Valenzuela et al., 2016; Allen                cific objectives include (i) mapping the maximum extent and calculat-
et al., 2016; Ray et al., 2016; Emmer, 2018; Veh et al., 2019). For ex-          ing the future lake volume; (ii) identification of potential avalanche
ample, Dig Tsho glacial lake in the Mt. Everest region of Nepal                  source zones and modeling impact of avalanches on the lake; (iii) char-
Himalaya produced a GLOF in 1985 that killed five people and                      acterization of the avalanche-triggered impulse-wave and overtopping;
destroyed a hydropower station (Vuichard and Zimmermann,                         (iv) future GLOF-hazard assessment using moraine-breach modeling
1987). The 2013 Kedarnath disaster (central Himalaya), which was                 and flood routing; (v) uncertainty assessment of GLOF hydraulics
a GLOF from Chorabari Lake associated with flash-flooding and land-                using hydrodynamic modeling; and (vi) mapping infrastructure at
slides triggered by intense precipitation in the region, led to over             GLOF risk along the valley.
6000 fatalities and washed away the major part of a settlement lo-
cated just over 1 km downstream of the lake (Allen et al., 2016). Sim-           2. Study area and its importance
ilarly, a GLOF from Lake Palcacocha in Peruvian Cordillera Blanca
claimed at least 1600 lives and wiped out one-third of Huaraz city                   The lake-terminating South Lhonak glacier and its proglacial lake
in 1941 (Carey et al., 2012; Huggel et al., 2020). The risk that a poten-        (27°54′20“N and 88°10’20”E) is located at an elevation of 5200 m a.s.l.
tially dangerous lake may present to the low-lying areas can be un-              in the Teesta Basin, Sikkim, Himalaya (Fig. 1A & B). The glacier has a
recognized unless a detailed hazard assessment is undertaken.                    total area of 12.5 km2, as mapped in 2019. During the past 29 years,
Therefore, evaluating the characteristics of a glacial lake, its sur-            the length of the glacier reduced from 6.4 km to 5.1 km, while the over-
roundings, and local hydrodynamical flood modeling allow us to un-                all glacier shrank by ~0.96 km2 (Fig. 1 D-G). In line with the glacier re-
derstand how a valley will behave in case of a potential GLOF event.             treat, the lake has been exhibiting significant growth over the years as
Therefore, a detailed hazard assessment of the existing dangerous                it grew from 0.42 km2 in 1990 to 1.35 km2 in 2019 (Fig. 1D-G). The fron-
lakes is necessary for disaster preparedness and mitigation.                     tal moraine damming the lake has a width of approximately 500 m and
     GLOFs in Himalaya have attracted the attention of scientists as well        it gets narrow towards the north, where a surface outflow from the lake
as practitioners over the years. Recent studies on hazard assessment of          is located. The surficial outflow channel cuts the moraine dam in the
the glacial lakes in the Indian Himalayan region revealed numerous               north-northeast direction while the main valley is oriented towards
lakes that can produce future GLOFs and cause downstream damage                  the east (see Fig. 1). The crest height of the frontal part of the damming
(Worni et al., 2013; Dubey and Goyal, 2020). Worni et al. (2013) pre-            moraine (south from the outflow channel) is 7 m above lake level, as
sented a glacial lake inventory covering most of the Indian Himalaya.            measured in the field by Sharma et al. (2018). This part of the moraine
The lakes were mapped using Landsat ETM+ of 2000 to 2002 and                     is characterized by a hummocky surface indicating the presence of ice
Google Earth imageries. A total of 251 glacial lakes with an area > 0.01         within the dam with several small lakes on the moraine surface
km2 were identified, of which 12 lakes were identified as critical and             (thermokarst of precipitation-filled), and the absence of vegetational
93 as potentially critical based on a lake outburst probability analysis         cover.
and considering potential downstream exposure. A recent study evalu-                 So far, there has not been any reported GLOF; however, Kumar
ated the potential downstream impact of 329 lakes across the Indian              and Murugesh Prabhu (2012) presented a report to the Government
Himalaya, showing that 36 lakes are exposed to potential avalanche               of Sikkim, where the lake outlet is stated to show evidence of a pre-
impact-zones (Dubey and Goyal, 2020). However, detailed case studies             vious GLOF (Fig. 1C). Bathymetric measurements indicate a current
focusing on the future GLOF hazard potential of the critical glacial lakes       lake volume of 65.8 × 10⁶ m 3 , with a maximum depth of 131 m
in the Himalaya are still quite limited.                                         (Sharma et al., 2018). The lakes' narrow outlet drains into the
     For Sikkim Himalaya, numerous glacial lake inventories and state-           Goma channel, which joins the Zemu River 36 km downstream of
wide hazard assessments are available (Mool et al., 2003; Raj et al.,            the lake. It further joins the Lachen River at Hema located 40 km
2013; Worni et al., 2013; Aggarwal et al., 2017; Sattar et al., 2019a).          downstream. The valley downstream of the lake is moderately pop-
Mool et al. (2003) presented the first glacial lake inventory, where              ulated, with a major town being Chungthang located 62 km down-
266 lakes were mapped with a total area of 20.2 km2, of which 14                 stream of the lake where the Teesta Stage III hydropower dam is
lakes were identified to be potentially critical. Another glacial lake in-        located. According to the 2011 census report (censusindia.gov.in),
ventory reported 14 potentially dangerous lakes out of 320 total lakes           Chungthang had more than 10,000 inhabitants, living in more than

                                                                             2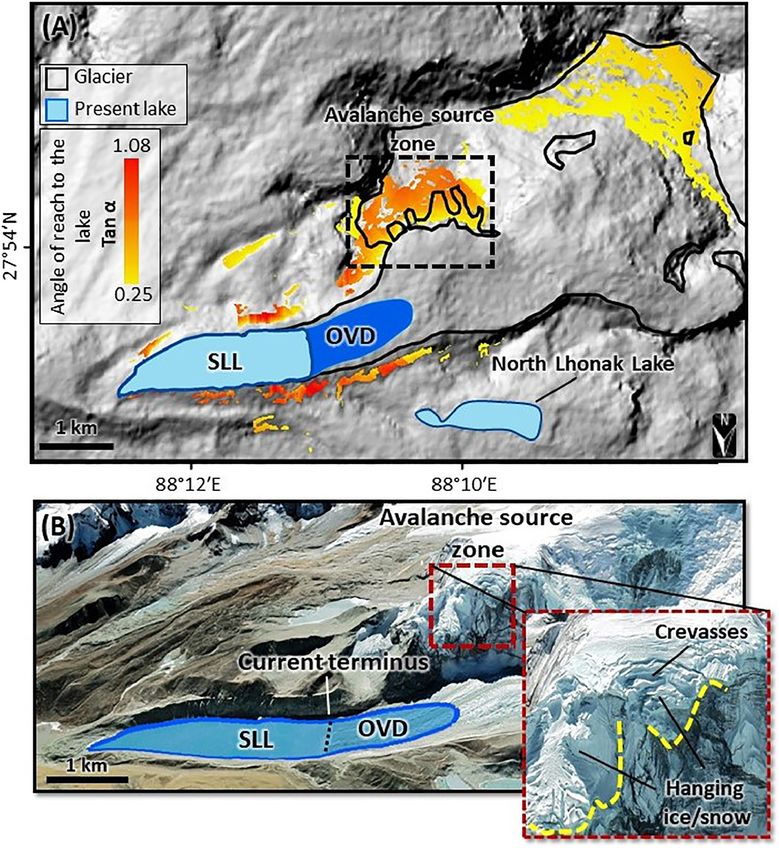
A. Sattar, A. Goswami, A.V. Kulkarni et al.                                                                                                           Geomorphology 388 (2021) 107783

Fig. 1. (A) Map of the Indian state of Sikkim showing the location of the South Lhonak Lake and the two major settlements along the valley; Google Earth image showing the bird-eye view
of (B) the tongue of the South Lhonak glacier and its associated proglacial lake; and (C) frontal moraine damming the South Lhonak Lake; (D-G) Landsat image showing the evolution of the
lake as the glacier retreated from 1990 to 2019; (H\ \I) Field photograph of the South Lhonak Lake showing the current glacier terminus, lateral moraines, and frontal part of the moraine
(photo courtesy: Department of Science and Technology, Government of Sikkim).

1900 households. The town has evolved over the years and has espe-                              compared it with ensemble ice-thickness from Farinotti et al. (2019),
cially seen rapid growth after the construction of a hydropower sta-                            which is available for the 2000 glacier extent. We also compare the vari-
tion in 2015. Other small townships like Lachen, Latong, and Yuigang                            ous ice-thickness outputs (GlabTop and ensemble) by comparing it to
exist along the flow channel.                                                                    the field bathymetry (measured in the year 2014–16) for the portion
                                                                                                where the glacier retreated thereby exposing the bedrock and leading to
3. Data used and methods                                                                        the growth of the lake (see Fig. 5). This enabled validating the ice-
                                                                                                thickness that we use to calculate the future volume of the lake. We
3.1. Data used                                                                                  used field-based lake bathymetry (Sharma et al., 2018) and the modeled
                                                                                                overdeepening to derive the lake's future volume. To extract terrain eleva-
    The present study utilizes glacier outlines available in the Randolph                       tion for hydrodynamic GLOF modeling, we used the Advanced Land Ob-
Glacier Inventory (RGI), an open-source database for the existing glaciers                      serving Satellite (ALOS) - Phased Array type L-band Synthetic Aperture
in the globe (http://www.glims.org/RGI). The latest available version of                        Radar (PALSAR) DEM with a spatial resolution of 12.5 m (Source DEM
the glacier boundary for the year 2000 (RGI 6.0) is used as a base to                           30m SRTM resampled to 12.5m). It is a radiometrically terrain-corrected
map the South Lhonak glacier. Cloud-free (
A. Sattar, A. Goswami, A.V. Kulkarni et al.                                                                                                              Geomorphology 388 (2021) 107783

3.2. Lake growth and its future extent/volume                                                    overdeepened site (Vovd) and the present-lake bathymetric volume
                                                                                                 (Vlake). The schematic of a proglacial lake system and its future growth
    RGI outlines were slightly modified to map the glacier, and to derive                         is shown in Fig. 2. The flowchart (Fig. 3) summarizes the entire method-
ice-thickness and glacier terminus changes. The lake boundary for each                           ology adopted in the study.
year (1990, 2000, 2010, and 2019) is manually digitized. The future vol-
ume is derived by combining the current bathymetry-based volume and                              3.3. Identification of potential future GLOF triggers, avalanche modeling,
the volume of the frontal overdeepening. For that, the glacier bed of the                        and overtopping
South Lhonak glacier is mapped using spatially distributed glacier ice-
thickness approaches.                                                                                Here, we overlay the South Lhonak Lake's future extent (as mapped
    We used a shear-stress based method to reconstruct glacier ice-                              in Section 3.2) to identify mass movement zones from where an ava-
thickness, which is dependent on the relationship between basal stress                           lanche can enter the lake and potentially trigger a future GLOF event.
and the slope of the glacier (GlabTop, c.f., Linsbauer et al., 2012). In a                       Preliminarily, we consider a slope threshold of >30° to identify the sur-
comprehensive assessment of modeled glacier-ice thickness outputs                                rounding avalanche-prone slopes, and we calculate the topographic po-
derived using different numerical approaches, Farinotti et al. (2017)                            tential of the surrounding slopes for mass movements into the lake. The
concluded that the most reliable ice-thickness estimates could be de-                            concept of topographic potential assumes an impact into a lake is possi-
rived by averaging the ice-thickness outputs from multiple models.                               ble from any slope > 30°, from which the overall slope trajectory to the
Therefore, in the present study, we compare the South Lhonak glacier-                            lake is >14° (tanα = 0.25) (see Allen et al., 2019). These conservative
bed derived using GlabTop for different values of f (Linsbauer et al.,                           values are based on typical ice and/or rock avalanches reported globally,
2012) and the ensemble ice-thickness (Farinotti et al., 2019) with the                           although mass movements from more gentle slopes and obtaining
field-measured lake bathymetry. The ensemble ice-thickness is a dis-                              larger runout distances are possible in exceptional cases.
tributed ice-thickness product derived by averaging the spatially dis-                               We further model avalanches using the debris flow module within
tributed ice-thickness solution from four different models (i.e., Huss                           Rapid Mass Movement Simulation (RAMMS) software. RAMMS is based
and Farinotti, 2012; Frey et al., 2014; Fürst et al., 2017; and Maussion                         on the Voellmy-Salm method that solves the shallow water equation in
et al., 2018). The glacier bed is obtained by GIS-based spatial arithmetic                       two-dimension (Christen et al., 2010). We used ALOS PALSAR DEM as ter-
operation considering glacier surface elevation and ice-thickness distri-                        rain input for simulation. We define an avalanche release area for the
bution, given as BE = SE– H, where BE is the spatially distributed glacier-                      mass-movement susceptible slopes, calculated based on the topographic
bed elevation (m a.s.l.), SE is the glacier-surface elevation (m a.s.l.), and                    potential. Other input parameters for the model include debris density,
H is the ice-thickness (m). The different modeled glacier bed outputs                            Coulomb friction (μ), and turbulent friction (ξ) (Bartelt et al., 1999). We
were compared to field-collected bathymetry (Sharma et al., 2018)                                 consider values of 0.12 and 1000 m s−2 for μ and ξ, respectively. We
across two cross-sectional profiles (e.g., Fig. 4I and J). The output with                        note that constraining the friction parameters needs further calibration
the lowest Root Mean Square Error (RMSE) was further considered to                               and validation. However, the sensitivity analysis of these values indicates
calculate the extent and volume of the future lake (e.g., Fig. 5). The fu-                       that they are conservative and the accepted standard values produce the
ture lake volume is calculated by combining the volume of the                                    fastest, farthest traveling, and densest avalanches (Bartelt et al., 2013; Lala

Fig. 2. Schematic diagram showing (A) a proglacial lake system at present; (B) lake grows as the overdeepened glacier bed is exposed in the future by glacier retreat, further exposing it to
potential mass movements that can enter the lake.

                                                                                             4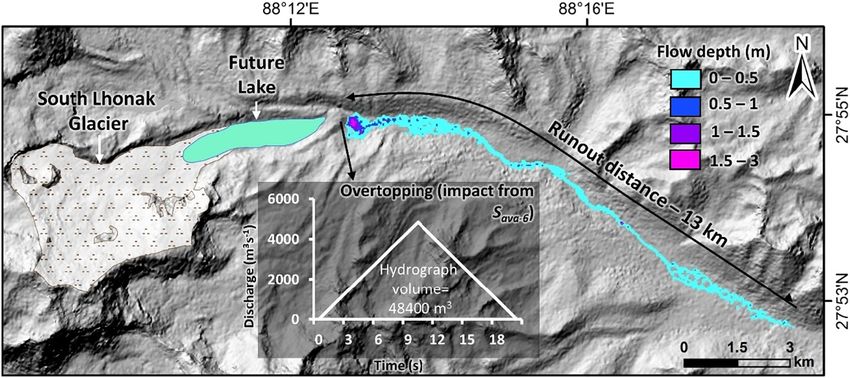
A. Sattar, A. Goswami, A.V. Kulkarni et al.       Geomorphology 388 (2021) 107783

                                                                              Fig. 3. Flowchart of the entire methodology.

                                              5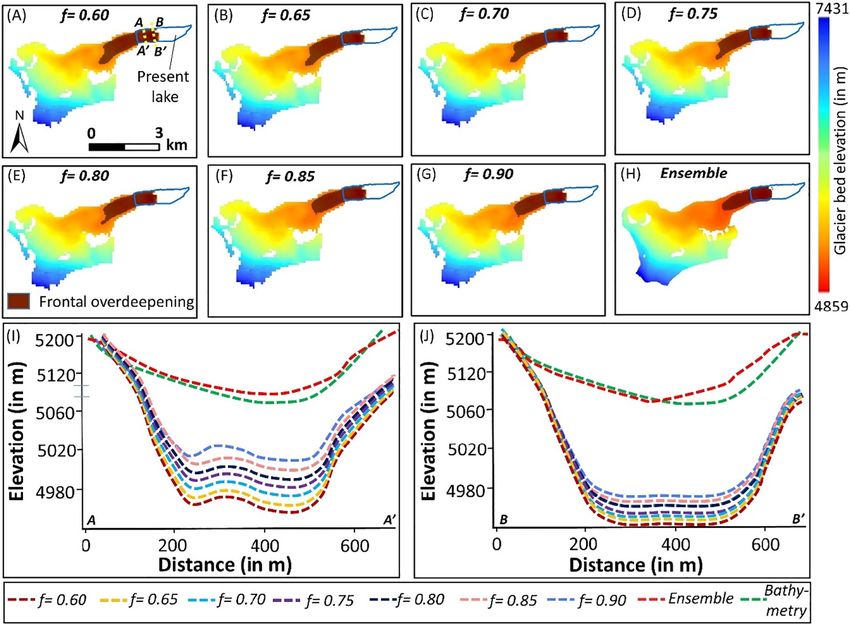
A. Sattar, A. Goswami, A.V. Kulkarni et al.                                                                                         Geomorphology 388 (2021) 107783

et al., 2018). We assume these values for modeling potential avalanches in             evaluate the lake-breach hazard considering a series of breach events orig-
the South Lhonak glacier valley as these values were previously used to                inating from the lake. We assume different scenarios with varied breach
model avalanches in glacier-covered terrains in the Himalaya (Somos-                   dimensions of the frontal moraine and evaluate its GLOF hydraulics. We
Valenzuela et al., 2016; Lala et al., 2018). The input parameters also                 use the HEC-RAS hydrodynamic model to simulate potential moraine-
agree with other studies globally where similar values were used to                    breach events of the lake. This hydrodynamic tool has been previously
model ice and/or rock avalanches (Sosio et al., 2008; Schneider et al.,                used to model outbursts from other glacial lakes (Klimeš et al., 2016;
2010; Schneider et al., 2014; Frey et al., 2018). In the present study, we             Kougkoulos et al., 2018; Sattar et al., 2019a, 2019c; Sattar et al., 2020).
model six avalanche scenarios, keeping the release area constant but                   The initial dam geometry (dam-crest, side slopes, width, and freeboard)
with varying thicknesses of the detaching mass. We consider two low-                   of the lake is extracted using DEM, high-resolution Google Earth imagery,
magnitude scenarios (Sava-1 and Sava-2), where we assume an ice and/or                 and published values of the moraine characteristics (Sharma et al., 2018).
rock thickness of 5 m and 10 m at the source for Sava-1 and Sava-2 respec-                 Based on the future lake bathymetry and potential release volume,
tively. For moderate-magnitude avalanches, we increase the thickness to                here we evaluate three dam-breach scenarios- (i) Scenario-1 (SC-1P; sub-
20 m (Sava-3) and 30 m (Sava-4). Further, we model two high-                           script “P” stands for “predicted”), low-potential GLOF with a breach depth
magnitude avalanches with ice and/or rock thickness of 40 m (Sava-5)                   (hb1) of 20 m, (ii) Scenario-2 (SC-2P), moderate-potential GLOF with
and 50 m (Sava-6). These assumed scenarios are similar to previously                   breach depth (hb2) of 30 m, and (iii) Scenario-3 (SC-3P), large-potential
modeled avalanches in the Himalaya (Rounce et al., 2016; Lala et al.,                  GLOF with breach depth of 40 m (hb3) (Fig. 5B). Most documented past-
2018), and generally align to the range of thicknesses typically considered            GLOF events in the Himalaya did not lead to the lake's complete drainage
for such steep cliff situations (Huggel et al., 2004). The corresponding re-           (Zheng et al., 2021), so for South Lhonak Lake, we assume similar scenar-
lease volume was calculated based on the ice and/or rock thickness and                 ios where potential breach ceases at a maximum depth of 40 m in the mo-
area of the release zone.                                                              raine, i.e., full removal of the downstream slope of the dam up to 40 m
    Further, we model the impulse wave generated by each of the above                  (Fujita et al., 2013). This is based on the potential flood volume (PFV),
avalanche impacts on the lake using the Evers et al. (2019) model, a re-               which is a function of the total breach depth (hb). Considering a large-
vised version of the earlier model (Heller et al., 2009), with incorporated            potential scenario is important for hazard mitigation and preparedness.
up-to-date studies. We calculate the run-up and overtopping at the dam                 The corresponding flood release-volume in each case is calculated based
if an initial impulse-wave is caused by any of the avalanche scenarios                 on future bathymetry (as calculated in Section 3.2).
(Sava-1 to Sava-6). This empirical approach has been widely used for                       Dam-break simulation requires information on the breach parameters
avalanche-induced impulse-wave characterization in glacial lakes in the                including breach width (Bw) and time of breach formation (Tf) as inputs.
Himalaya (Lala et al., 2018; Byers et al., 2019; Byers et al., 2020). The latest       Several empirical approaches are available to calculate these parameters.
Evers et al. (2019) model computes the characteristics of an avalanche-                Wahl (2004) presented a comprehensive assessment of the different em-
induced impulse-wave originating from the site of the impact that propa-               pirical methods and reported that Froehlich (1995a, 1995b) has the low-
gates towards the damming moraine and eventually overtops. It further                  est prediction-uncertainty and is globally used to model glacial lake
computes the characteristics of wave run-up and overtopping at the dam-                outbursts (for e.g. Osti and Egashira, 2009; Wang et al., 2012; Anacona
ming site. The model requires avalanche characteristics and morphological              et al., 2015; Wang et al., 2018; Majeed et al., 2021). Therefore it is used
dimensions of the lake, as inputs. We compute avalanche characteristics                here to calculate the predicted breach width (Bw-P) and time of breach for-
like impact volume (in m3), impact velocity (Vs, in m s−1), slide width                mation (Tf-P) for each scenario (Eqs. (1) and (2)) (Table 2). Considering
(Sw, in m), impact ice and/or rock-thickness (in m), run-up angle (β),                 the preconditions of the South Lhonak Lake including the surrounding
and impact angle (α) of the main flow direction of the avalanche com-                   avalanche-prone slopes, future lake extent, and the anticipated most
pared to the longitudinal axis of the lake. Here the total impact volume               likely future GLOF triggers (avalanches that enter into the lake), we
is calculated for the ice and/or rock that enters the lake during a potential          model overtopping failure of the frontal moraine in each of the
avalanche (Fig. 7H). The bulk density of the avalanche material is consid-             moraine-breach scenarios (SC-1P, SC-2P, and SC-3P). The output is ob-
ered as 1000 kg m−3 assuming it to be a mixture of ice and/or rock, similar            tained in the form of a discharge/outflow hydrograph (discharge vs.
to other Himalayan studies (Somos-Valenzuela et al., 2016; Lala et al.,                time) that varies based on the total volume released and the breach pa-
2018). Morphological characteristics like freeboard, dam-crest height                  rameters. The predicted outflow peak-discharge (Q-P) is compared to
above the lake level, dam-crest width, distance of the impact from the                 the empirically calculated discharge (Eq. (3), Froehlich, 1995b).
frontal moraine, and still-water depth at the impact site were calculated
                                                                                                                           0:19
based on modeled bathymetry, field information (Sharma et al., 2018),                   Bw−P ¼ 0:1803K o ðV w Þ0:32 ðhb Þ                                       ð1Þ
and high resolution Google earth imagery. We empirically model the im-
pulse wave to evaluate its characteristics like overtopping wave-height,               T f −P ¼ 0:00254 ðV w Þ0:53 ðhb Þ
                                                                                                                         −0:9
                                                                                                                                                               ð2Þ
overtopping-velocity, and volume at the dam site. Further, we calculate
the overflow hydrographs in case of overtopping, which are used for                                                1:24
two-dimensional downstream flood routing using HEC-RAS (version                         Q −P ¼ 0:607V w 0:295 hw                                                ð3Þ
5.0.7; https://www.hec.usace.army.mil/software-/hec-ras/). Here we do
not consider any erosion dynamics of the frontal moraine. The down-                        The outflow hydrographs obtained for each scenario are dynamically
stream flow hydraulics, including flow depth (Df), flow velocity (Vf), and                routed as unsteady flow to evaluate the flow hydraulics downstream of
inundation (If) of the waves with different overtopping volumes are eval-              the lake using HEC-RAS (2D). We assess the GLOF hydraulics including
uated along the flow channel. For flood-routing simulations, the terrain                 Df, Vf, and If along the flow channel from the lake to the Chungthang
conditions are kept constant as that of the dam-breach simulations de-                 town. The upstream and downstream boundary conditions were set
scribed below (see Section 3.4.1).                                                     as the modeled GLOF-outflow hydrograph and normal depth, respec-
                                                                                       tively. A distributed Manning's N along the main flow-channel is consid-
3.4. GLOF modeling and routing                                                         ered for hydraulic GLOF-routing. The LULC (GlobeCover v2.3) is
                                                                                       extracted for a buffer of 500 m along the main flow channel, from the
3.4.1. GLOF scenarios                                                                  lake to “Chungthang”. The LULC is dominated by vegetation in the
    We note that overtopping or overfill of a lake can exert shear stress               lower part of the flow area from 40 km downstream of the lake
that can exceed the strength of the moraine (Korup and Tweed, 2007;                    (Sattar et al., 2019a). This can have a significant impact on the down-
Westoby et al., 2014). Therefore, evaluating dam-breach hazards becomes                stream flow hydraulics. Therefore, we considered a distributed channel
important. Here, apart from the overtopping hazard of the lake, we also                roughness to evaluate the effect of LULC on the potential GLOF flow. The

                                                                                   6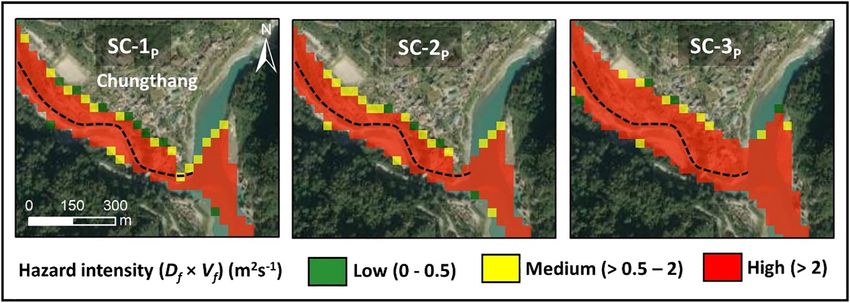
A. Sattar, A. Goswami, A.V. Kulkarni et al.                                                                                                                 Geomorphology 388 (2021) 107783

roughness value along the flow channel ranged between 0.034 and 0.11,                               1995a vs. observed) of 70–80 documented dam-break cases. Similarly, e
with higher values representing vegetation.                                                        and 2Se has a value of −0.22 and ± 0.64 for Tf based on the regression
                                                                                                   (Froehlich, 1995a vs. observed) of 30–40 dam-break cases. For Q, 30–40
3.4.2. Uncertainty analysis (lower and upper GLOF limits)                                          test cases were considered for regression (Froehlich, 1995b vs. observed),
    In hydrodynamic GLOF routing, the boundary conditions control the                              where e and 2Se have calculated values of −0.04 and ± 0.32, respectively.
flow hydraulics along a given channel (Westoby et al., 2014). In GLOF pre-                          To evaluate the uncertainty in the GLOF hydraulics in a given flow, we ini-
diction, the outflow breach-hydrograph, which is a function of the breach                           tially calculate the lower and the upper limit of the breach parameters
parameters (Bw-P and Tf-P), is considered the upstream boundary. Here, we                          (Bw-LL/UL and Tf-LL/UL) and the discharge range (Qrange) for each potential
note that predicted breach parameters can be associated with some                                  GLOF scenario (SC-1P, SC-2P, and SC-3P) (Table 2). This is followed by
degree of uncertainty. Therefore, we empirically calculate the uncertainty                         dam-breach modeling to calculate the outflow discharge hydrograph.
bounds (lower and upper) of each breach parameter (Bw-P and Tf-P) for                              Here, we obtain six outflow hydrographs (i.e., two for each scenario)
each scenario (SC-3P, SC-3P, and SC-3P) (Wahl, 2004). Since no model is                            based on the calculated LL and UL of the breach parameters (Bw-LL/UL and
currently available to our knowledge that determines the breach uncer-                             Tf-LL/UL) with their peak discharge (Q-LL/UL). The outflow hydrographs
tainty of glacial-lake dams, we employ Wahl (2004), which applies to em-                           modeled for each scenario (SC-1LL/UL, SC-2LL/UL, and SC-3LL/UL) are hydrody-
bankment dams composed of earth materials (Wan and Fell, 2004). This                               namically routed to evaluate the uncertainty in downstream hydraulics.
model has been previously used to assess the uncertainty in the breach                             The downstream boundary conditions and terrain in the model setup
parameters of glacial lake in the Himalaya (Somos-Valenzuela et al.,                               are kept constant as that in Section 3.4.1. The overall methodology is
2015). Further, we determine the lower and the upper uncertainty in the                            summarized in Fig. 3.
flow hydraulics along the given channel as described below. Here, the
terms Lower Limit (LL) and Upper Limit (UL) define the lower-bound un-
certainty and the upper-bound uncertainty to the predicted GLOF hydrau-                            3.5. Mapping GLOF hazard intensity and infrastructures at risk of GLOF
lics which are calculated using Eqs. (4) and (5) (Wahl, 2004).
                                                                                                     We used the flow parameters like Vf and Df to define the hazard inten-
LL ¼ P 10−e−2Se                                                        ð4Þ                         sity downstream of the lake for different predicted GLOF scenarios (SC-1P,
                                                                                                   SC-2P, and SC-3P). The hazard zones were defined based on combined
                                                                                                 thresholds of Vf and Df (Fig. 13). The thresholds are based on the recent in-
UL ¼ P 10−eþ2Se                                                                          ð5Þ       ternational guidelines on glacier and permafrost hazard assessment
                                                                                                   (GAPHAZ, 2017). Further, we used shapefiles of flood inundation extent
where P is the predicted breach parameters (Bw-P, Tf-P), and predicted dis-                        for each predicted GLOF scenario and high-resolution satellite images
charge (Q-P), e and 2Se are mean prediction error and width of uncertainty                         from Google Earth (taken in 2019) to manually map at-risk downstream
band, respectively, that are derived using regression in a log-log space of                        infrastructures between South Lhonak Lake and Chungthang town. We
documented dam-break cases (Wahl, 1998; Wahl, 2004). Here, e and 2Se                               mapped three categories of infrastructures: (i) bridges, (ii) buildings
has a value of 0.01 and ± 0.39 for Bw, based on the regression (Froehlich,                         (mainly houses), and (iii) industry and mining areas.

Fig. 4. Spatially distributed modeled glacier bed for different values of ‘f’ using GlabTop (A-G); Ensemble (H) (Farinotti et al., 2019); (I-J) cross-sectional profiles of glacier beds along AA’
and BB’.

                                                                                               7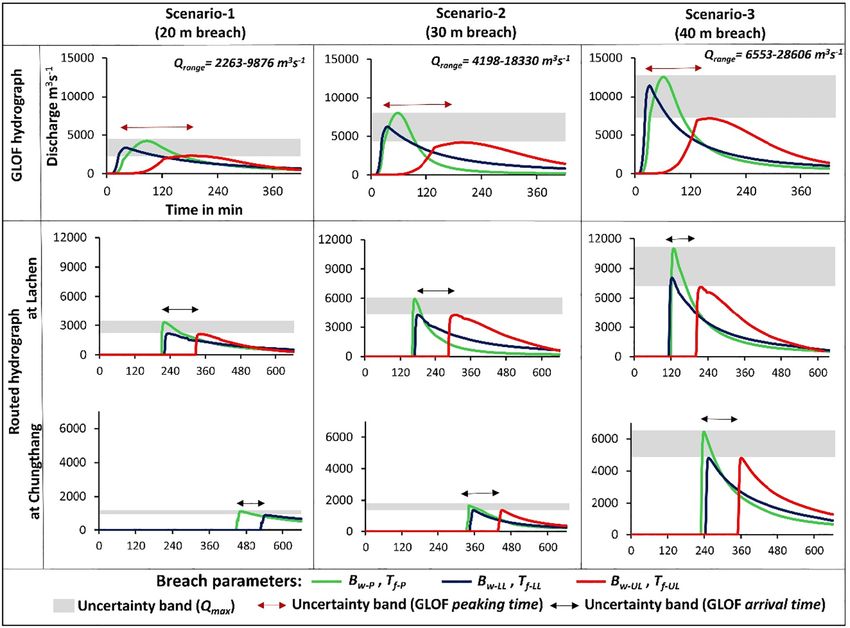
A. Sattar, A. Goswami, A.V. Kulkarni et al.                                                                                                      Geomorphology 388 (2021) 107783

4. Results                                                                                   (Fig. 6B) and appears to be the most immediate threat to the lake at
                                                                                             this point.
4.1. Future lake extent and volume                                                               Avalanche modeling shows that the low-magnitude avalanches
                                                                                             (Sava-1and Sava-2) terminate before reaching the future lake, and are
    The glacier bed calculated using GlabTop (Fig. 4A-G) and ensemble                        hence, no threat (Fig. 7A-B). The released volumes were 5.2 × 10⁵ m3
ice-thickness (Fig. 4H) were compared along two cross-sections of the                        and 9.1 × 10⁵ for Sava-1 and Sava-2, respectively. The moderate-
South Lhonak Lake bathymetry. We note that the performance of ice-                           magnitude scenarios (Sava-3 and Sava-4) with a release volume of 2.0 ×
thickness models may vary from glacier to glacier (Farinotti et al.,                         106 m3 and 3.2 × 10⁶ m3 reaches the lake. Similarly, for the high-
2017). Also, for shear stress-based models like GlabTop, it becomes dif-                     magnitude avalanches (Sava-5 and Sava-6), the release volumes were cal-
ficult to determine the value of f as it is dependent on the general form                     culated as 4.1 × 10⁶ m3 and 5.2 × 10⁶ m3, respectively. These avalanches
of the glacier cross-sections, and longitudinal and transverse stresses,                     have a high potential impact on the lake, with higher runout distances
which may vary within a glacier (Linsbauer et al., 2012). The GlabTop-                       than moderate-magnitude avalanches. We calculated the volume of av-
derived bathymetry showed an overestimation of the lake depths                               alanche mass that entered the lake in the cases of scenarios Sava-2 to
with a calculated RMSE of 51 m (f = 0.9) (Fig. 4). The calculated                            Sava-6. The total avalanche volume that enters the lake at its posterior
RMSE for lower values of f (0.85–0.6) resulted in comparatively higher                       end (Fig. 7C-F) ranged from 4.0 × 10⁵ m3 to 2.1 m3 × 106 m3. The impact
RMSE ranging between 65 m to 80 m (Fig. 4A-F). The spatial extent of                         velocity (Vs) at the site of impact ranged from 24.8 m s−1 to 37.2 m s−1
the overdeepening reduces with an increase of f, and so does the                             (Fig. 7G). The slide width (Sw) is the width of the avalanche during im-
depth. All the GlabTop estimates resulted in overestimating the depth                        pact and is considered to be the width of the lake, i.e., 450 m in this of
values (Fig. 4I-J). However, based on the sensitivity of ice thickness to                    South Lhonak Lake. The impact angle (α) along the direction of ava-
f (Fig. 4), the RMSE will further reduce with higher values of f, which                      lanche flow is calculated from the DEM and is equal to the trajectory
we do not consider for this study rather we focus on the range from                          slope, which is 25°. The still water depth of the lake at the impact site
0.6 to 0.9 (Paterson 1994). The future lake depths were very well repre-                     is derived from the modeled future-bathymetry and is estimated as 45
sented in the glacier bed with an RMSE of 5 m, when derived using the                        m. The above parameters were used as input to the Evers et al. (2019)
‘Ensemble’ ice-thickness which is based on the law of averages                               impulse-wave model to calculate the wave-crest amplitude (a) and
(Farinotti et al., 2019). This was further considered to calculate the vol-                  wave height (H) at the source (impact site). Further, we use these
ume of the frontal overdeepening, which has a maximum depth of 92 m                          values to model the run-up and characterize the overtopping wave.
and a total area of 0.6 km2. The total future volume of the South Lhonak                     For that, the run-up angle (β) is calculated, as the slope of the moraine
Lake was calculated by combining the present lake volume (Sharma                             facing the lake. The crest height of 7 m above lake level was considered
et al., 2018) and the modeled volume of the overdeepening (Fig. 5).                          based on the field measured value of the frontal moraine (Sharma et al.,
The total volume of the future lake was calculated to be 114.8 × 10⁶                         2018). The overtopping depth (Dovr) and velocity (Vovr) for the lake-
m3, with a total area of 1.86 km2, representing an overall increase in                       impacting avalanches (Sava-2 to Sava-6) ranged from 2.5 m to 6.7 m
lake volume of 74.4% relative to today. The future lake extends up-                          and 10.6 m s−1 to 20.7 m s−1 respectively (Fig. 7I). The total
stream up to 1.2 km from the current terminus.                                               overtopping volume ranged between 1.8 × 10⁴ m3 (for Sava-2) to 4.8 ×
                                                                                             105 m3 (for Sava-6). The characteristics of individual avalanches and
4.2. Impact wave characterization and overtopping                                            the resulting overtopping are given in Table 1.
                                                                                                 The overtopping hydrographs calculated for each impact scenario
   The identified avalanche-prone cliffs based on the mass movement                           (Sava-2 to Sava-6) based on the overtopping volume and duration re-
potential (Fig. 6A) exhibit lateral crevasses as evidence of downslope                       sulted in peaks ranging from 1825 m3s−1 to 4850 m3s−1 (see Supple-
movement. At a distance of ~930 m upstream of the current terminus,                          mentary Fig. S1). The hydraulic routing of the overtopping hydrograph
one such heavily crevassed surface over a steep cliff can be identified                       with the highest peak (Sava-6) resulted in Df and Vf reaching up to 3 m

Fig. 5. (A) Evolution of the South Lhonak Lake from 1990 to 2019 and the modeled future (maximum) extent of the lake; (B) Cross-sectional profile of the lake along the central axis,
showing the current lake bathymetry (Sharma et al., 2018) and the overdeepening; marked are the breach depths of the three potential GLOF events modeled in this study (hb1, hb2,
and hb3).

                                                                                         8
A. Sattar, A. Goswami, A.V. Kulkarni et al. Geomorphology 388 (2021) 107783
Fig. 6. (A) South Lhonak glacier-lake system showing the extent of the present lake (SLL) and overdeepening (OVD); the topographic potential for mass movements is shown for the
surrounding slopes; (B) avalanche source zone showing highly crevassed and hanging ice and/or rock (located ~930 m upstream of the current terminus).
and 21 ms−1, respectively (Fig. 8). Due to relatively flat terrain just in upstream, or temporary blockage of the outlet, for instance by snow or
front of the lake, there is a significant loss in the momentum of the ice, that could result in a rise of lake level.
flow and it terminates at a distance of 13 km downstream of the lake, We relied on scenario-based modeling to appropriately analyze
i.e., 33 km upstream of Lachen. The Df, Vf, and runout distances for the the dam breach and downstream propagation, considering three
other overtopping scenarios (Sava-2 to Sava-5) are less than Sava-6. breaching scenarios of the frontal moraine with a maximum breach
of 40 m (Table 2). In Scenario-1, the predicted low-potential GLOF
4.3. Outburst flood hydraulics (SC-1 P ) produced a GLOF peak of ~4300 m 3s −1 . We evaluated flow
hydraulics at two cross-sections located downstream of the lake at 46
Modeling results for the avalanche-induced impact wave indicates km (Lachen) and 62 km (Chungthang). At Lachen, SC-1P arrives at 210
that the frontal moraine of the South Lhonak Lake is susceptible to min after the initiation of the breach producing a peak discharge of
overtopping, with a possibility of initiating moraine breaching pro- ~3320 m3s−1. Further downstream at Chungthang, the GLOF arrives at
cesses. From a physical process point of view, overtopping waves 448 min after the breach event with a peak of 1134 m3s−1. Here, pre-
could trigger a dam breach process, but observational evidence indi- dicted Df and Vf reaches up to 10–13 m and 3–5 m s−1, respectively
cates that this occurs rarely. Moraine dam breach processes are more (Fig. 10 and Fig. 11). In Scenario-2, the predicted moderate-potential
commonly related to a slow or sudden rise of the lake level and the as- GLOF (SC-2P) produced a GLOF peak of 8000 m3s−1. At Chungthang,
sociated increase in discharge at the outflow where shear stresses in- GLOF arrives 114 min earlier than SC-1P, where Df and Vf increase by
crease to a level where erosion is initiated and progressively increases ~2 m and ~ 2 m s−1, respectively, compared to the low-potential
to dam failure (Worni et al., 2012). In this case, it is a large influx of av- GLOF. The large-potential Scenario-3 (SC-3P) reaches Chungthang 218
alanche material that impacts the lake (Section 4.2). However, other min and 104 min earlier than SC-1P and SC-2P, respectively. It produces
causes can be because of failure of the North Lhonak Lake located a GLOF peak of 6420 m3s−1 with Df reaching up to 23–30 m and Vf up to
9A. Sattar, A. Goswami, A.V. Kulkarni et al. Geomorphology 388 (2021) 107783
Fig. 7. (A-F) Modeled avalanche scenarios for different released volumes; the present extent of the South Lhonak Lake is shown as SLL and the overdeepening as OVD; (G) Avalanche
velocity profile along aa’ (see panel F for profile location); (H) Avalanche parameters for impact-wave modeling (Evers et al., 2019); (I) 3D view showing the avalanche source zone,
trajectory, and overtopping wave heights of the impulse-wave.
10A. Sattar, A. Goswami, A.V. Kulkarni et al. Geomorphology 388 (2021) 107783
Table 1
Avalanche and impact wave characteristics.
Avalanche characteristics Overtopping wave characteristics
Avalanche Release volume Maximum Maximum impact Volume entering Overtopping Overtopping Overtopping Overtopping GLOF
(x 106 m3) impact velocity thickness (m) the lake height (m) volume duration (s) peak discharge termination
(m s−1) (x 105 m3) (x 104 m3) (m3s−1) (km)
Sava-1 0.05 Avalanches does not impact lake
Sava-2 0.9
Sava-3 2.0 24.8 7.8 4.0 2.5 1.8 19.5 1825 6.5
Sava-4 3.2 30.0 13.6 4.2 3.7 2.6 20.1 2625 8
Sava-5 4.1 34.4 14.5 15.6 5.4 3.9 20.5 3925 11
Sava-6 5.2 37.2 17.3 21.1 6.7 4.8 21.0 4850 13
10–15 m s−1. Fig. 10 shows the inundation boundaries and spatially dis- calculated to be in the range of 21 to 24 m and 2.8 to 4 m s−1
. Note
tributed plots of flow depth and flow velocity at Chungthang, for each that the uncertainty in Df and Vf is measured for a single point at
predicted GLOF scenario. Chungthang (see Fig. 10 for location and Fig. 11 for plots).
4.4. Uncertainty in GLOF hydraulics 4.5. Infrastructures at risk of flooding
The uncertainty in the breach parameters calculated for LL and UL for The number of infrastructure objects at risk of flooding differs
each scenario (Section 3.4.2) is reflected in the GLOF peaks (Qmax) among modeled GLOF scenarios. It ranges from 183 for scenario SC-1P
(Table 2) and flow hydraulics (Fig. 9 and Fig. 11). The time to reach (includes 5 bridges, 176 houses, and 2 industrial facilities) to 266 for
the peak discharge (Tpeak) and the arrival time downstream (Tarr) was SC-3P (includes 13 bridges, 248 houses, and 5 industrial facilities)
greatly influenced by the LL and UL of the GLOF parameters (Bw and (Fig. 12). Most of these are located in Chungthang, the town that expe-
Tf) (Fig. 9). In dam-break simulations, the outflow hydrograph is more rienced rapid urbanization during the past few years due to new con-
sensitive to Tf compared to Bw (Singh and Snorrason, 1982; Basheer struction and operation of the hydropower station. Additional sites
et al., 2017; Sattar et al., 2020). In the lower limit, where the Bw and Tf that could be flooded are located a few km upstream of Chungthang
are lower than the predicted values, the Qmax is reached earlier and (Fig. 12). Hazard intensity mapping based on thresholds of GLOF hydrau-
vice versa. lics (Fig. 13) shows that most of the settlements situated along the flow
In Scenario-1, the uncertainty in the GLOF Qmax ranges between channel at Chungthang are within moderate to high GLOF intensity
2321 and 4311 m3s−1. The maximum uncertainty in the time taken to zones in a low-potential (SC1-P) and moderate-potential (SC3-P) GLOF sce-
reach the peak (Tmax) is 94 min (Fig. 9). Routed hydrographs at narios. In the large-potential GLOF scenario (SC3-P), these settlements fall
Chungthang show uncertainty in the GLOF arrival time (Tarr) of 82 under high-intensity zones (Fig. 13). We note that in Chungthang where
min and uncertainty in Qmax ranges between 907 and 1134 m3s−1. the hydropower dam is located, the water surface is reflected in the DEM
Here, the uncertainty in Df and Vf is calculated to be in the range of 16 used for the study. Therefore, we calculate the flow parameters like flow
to 18 m and 2 to 3 m s−1 respectively (Fig. 11). In Scenario-2, an uncer- depth and flow velocity considering the water surface as the base for the
tainty in GLOF Qmax ranges between 4202 and 8000 m3s−1. The uncer- flow. For hazard mapping at Chungthang (settlement), which is located
tainty in Tmax is 142 min. At Chungthang, an uncertainty of Tarr is along the shoreline of the flowchannel we assume that any changes in
calculated to be 104 min, and uncertainty in Qmax ranges between the base flow would be negligible in comparison with the flow hydraulics
1370 and 1670 m3s−1. The uncertainty in Df and Vf is calculated to be generated by the outburst flood. However, we note that a detailed inves-
in the range of 16 to 17.5 m and 1.9 to 3.4 m s−1, respectively. Similarly, tigation of GLOF impacts on the hydropower dam, and possible backwash
in Scenario-3, the uncertainty in the GLOF Qmax ranges between 7140 affecting Chungthang, would require more information about the depth
and 12,487 m3s−1. The uncertainty in routed Qmax at Chungthang ranges and volume of the reservoir, including seasonal variations, which is be-
between 4776 and 6422 m3s−1. Here, the uncertainty in Df and Vf is yond the scope of the study.
Fig. 8. Overtopping flow depth long the channel resulting from avalanche impact (Sava-6); the subset shows the overtopping hydrograph calculated based on impact wave from Sava-6; note
that due to relatively flat terrain just in front of the lake, there is a significant loss in the momentum of the flow and the flow tends to slow down and terminates at 13 km downstream of
the lake i.e. 33 km upstream of Lachen.
11A. Sattar, A. Goswami, A.V. Kulkarni et al. Geomorphology 388 (2021) 107783
Table 2
Calculated breach parameters for each scenario - Predicted (P), Lower Limit (LL), and Upper Limit (UL). Note that the predicted discharge is higher than the upper limits due to the higher
breach formation time (Tf).
Breach scenarios Breach width Breach formation time Peak discharge Peak discharge range
(Bw) (in m) (Tf) (in h) (Q) (in m3s−1) (Qrange) (in m3s−1)
P LL UL P LL UL P LL UL
SC-1 20 m 119.4 47.5 286.4 1.8 0.7 12.9 4311 3367 2321 2263–9876
(hb1)
SC-2 30 m 146.8 58.4 352.1 1.5 0.6 11.1 8000 6230 4202 4198–18,330
(hb2)
SC-3 40 m 169.5 67.6 407.5 1.4 0.5 10.0 12,487 11,437 7140 6553–28,606
(hb3)
5. Discussion GLOF potential and its possible impact. Specifically, our study includes
future modeling of lake breach and understanding potential GLOF's im-
5.1. Drivers of GLOF risk pact on the rapidly increasing downstream infrastructures because of
the new hydropower site at Chungthang (Fig. 14).
One of the critical questions in glacier lake investigations worldwide
is to understand how GLOF risk has evolved and how it will impact
downstream in the future. Studies have shown that GLOF risk will likely 5.1.1. Physical drivers of GLOF hazard
increase in the future, considering the increase in number of new lakes, The width of the terminal moraine that dams the South Lhonak Lake
and increased triggering potential (Allen et al., 2016; Haeberli et al., is not uniform (Fig. 1C & I) and is thinning towards the ends. Hummocky
2016; Drenkhan et al., 2019). Also, the changing patterns of exposure surface of the dam indicates that it likely contains buried ice and be sub-
are an equally important driver of GLOF risk (Hock et al., 2019). Al- ject to future degradation. We note that the moraine's stability can
though the number of GLOF studies has increased over recent years, change with time due to changes in the structural integrity (Clague
only a few studies address more than one GLOF risk component, and and Evans, 2000; Richardson and Reynolds, 2000) due to melting of bur-
consider past and/or future changes in these drivers (Emmer, 2018; ied ice, impact waves that lead to overtopping flows, extreme meteoro-
Huggel et al., 2020). Therefore, our study took a holistic look at South logical conditions, such as, cloud burst quickly overfilling the lake and
Lhonak Lake and established multiple scenarios to understand the triggering progressive erosion of the dam, etc. Additionally, continuing
Fig. 9. GLOF hydrographs and routed hydrographs calculated from the Predicted, Lower Limit, and Upper Limit GLOF parameters; the grey boxes (shaded) and red arrows (two-sided)
represent the uncertainty in peak discharge (Qmax) and GLOF peak timing (Tpeak), respectively; the black arrows (two-sided) represent the uncertainty in GLOF arrival timing (Tarr).
Routed hydrographs are along a cross-section at Lachen and Chungthang (see Fig. 1 for locations).
12A. Sattar, A. Goswami, A.V. Kulkarni et al. Geomorphology 388 (2021) 107783
Fig. 10. (A) Inundation boundaries and (B) spatially distributed flow depth (Df) and flow velocity (Vf) at Chungthang of each predicted GLOF scenario.
glacier retreat will bring the lake closer to steep and potentially of South Lhonak glacier (USGS-earthquake.usgs.gov/earthquakes/
degrading slopes (moraine, bedrock, and ice) (Haeberli et al., 2017). eventpage/usp000j88b/ executive). Although field evidence suggests
Seismic activity can in principle also lead to degradation of the mo- that South Lhonak Lake is currently devoid of proximal slopes that can
raines' structural integrity, although not necessarily leading to an out- act as a primary source of an avalanche (Sharma et al., 2018), further
burst (Kargel et al., 2016), and is an obvious trigger of large consideration should be given to far-reaching rock/ice avalanches, par-
catastrophic ice/rock avalanches (Mergili et al., 2018a, 2018b). This is ticularly co-seismic events. Likewise, attention should be given to any
particularly concerning, as South Lhonak Lake is located in a highly ac- tension cracks that may develop in proximal slopes as a result of lake ex-
tive seismic zone and several earthquakes in the past had their epicen- pansion. In the current study, we have focused on a section of steep icy
ter in the vicinity of the lake. For example, the epicenter of 4.9 cliffs located 500 m upstream from the current terminus that can poten-
magnitude earthquake on Sept 19, 1991, and 6.9 magnitude on Sept tially be one of the zones that can fail and impact the lake (Fig. 6). Larger
18, 2011, were located immediately behind Zemu glacier, 70 km south avalanche scenarios modeled here have proven sufficient to displace
13A. Sattar, A. Goswami, A.V. Kulkarni et al. Geomorphology 388 (2021) 107783
Fig. 11. Time series of flow depth and flow velocity at Chungthang for each predicted GLOF scenario; the time series is evaluated at a single point at Chungthang, the location of which is
marked in Fig. 10A.
stagnant lake water, thereby creating an impulse wave (Worni et al., upstream from the current terminus (Fig. 5 and Fig. 6). For example,
2014; Byers et al., 2019). However, such impacts on the lake would be based on the runout of Sava-6, it can cause an impact even when the
potentially dwarfed by any catastrophic ice/rock avalanches originating lake grows up to 0.57 km from the current terminus (Fig. 7F). Similarly,
from the headwall behind the lake. To reach the current lake extent, scenarios Sava-5, Sava-4, and Sava-3 can impact the lake when it grows to
such avalanches would need to obtain overall slope trajectory angles 0.60 km, 0.66 km, and 0.85 km upstream from the current terminus
as low as 14°, making this a potentially feasible (see Schneider et al., (Fig. 7C, D and E). However, it is to be noted that the severity/magnitude
2011) low likelihood/ high impact scenario. Nonetheless, for the design of any prior avalanche impact and overtopping event will be relatively
of early warning systems and other risk reduction strategies, a full range lower than an impact on a fully-grown lake because (a) the total volume
of possible scenarios should be considered, including worst-case events. of the lake will be less than the fully-grown lake; and (b) the avalanche
For example, the potential land area affected by such a worst-case event mass entering the lake will be comparably less as compared to the fully-
could be marked as an area of residual danger in a final hazard map, de- grown lake, where the lake boundary is near to the avalanche source.
pending on local regulations and norms (NDMA, 2020). Apart from the potential slope movements, a lake (North Lhonak
The eventual magnitude of the impulse wave is dependent on the Lake) located upstream of the South Lhonak Lake may trigger cascading
avalanche characteristics and morphology of the lake, which in turn de- events in case of an outburst or overtopping (Fig. 1B). We note that
termines the wave run-up height and overtopping (Schaub et al., 2016). there is a continuous discharge to the South Lhonak Lake along a narrow
In the case of South Lhonak Lake, the lake has a tapering downstream channel that originates from the North Lhonak Lake. In the case of rapid
end and a 7 m high crest height above lake level in the front. Due to inflow, this could lead to overfilling of South Lhonak lake resulting in in-
the spindle shape of the lake, the impulse-wave amplitudes can rise creased hydrostatic pressure on the damming moraine. Such process
higher as it approaches the shore, potentially causing higher chains involving several lakes reveal that downstream lakes may have
overtopping than calculated. a mitigation or amplification role in the process chain propagation
Based on the avalanche modeling and runout distances, it is seen (e.g., Emmer, 2017; Mergili et al., 2018a, 2018b; or Kirschbaum et al.,
that the avalanches reaching the future lake (Sava-3, Sava-4, Sava-5, and 2019).
Sava-6) can cause an impact before it is fully grown (see Fig. 7). In the fu- The prediction of breach depth for potential GLOFs is uncertain.
ture lake modeling, we see that the overdeepening extends up to 1.2 km Therefore, we consider three potential GLOF originating from the lake
14You can also read