In search of the spectral composition of an effective light trap for the mushroom pest Lycoriella ingenua (Diptera: Sciaridae) - Nature
←
→
Page content transcription
If your browser does not render page correctly, please read the page content below
www.nature.com/scientificreports
OPEN In search of the spectral
composition of an effective
light trap for the mushroom
pest Lycoriella ingenua (Diptera:
Sciaridae)
Sándor Kecskeméti1,2,3, András Geösel2, József Fail3 & Ádám Egri4*
Certain fungus gnats, like Lycoriella ingenua are notorious pests in agriculture, especially in mushroom
production. While larvae cause mainly direct crop damage, adults are vectors of several dangerous
fungal pathogens. To promote the development of pesticide-free management methods, such as light
trapping, we measured the spectral sensitivity of L. ingenua compound eyes with electroretinography
and performed two different behavioural experiments to reveal the wavelength dependence of
phototaxis in this species. The spectral sensitivity of the compound eyes is bimodal with peaks at 370
nm (UV) and 526 nm (green). Behavioural experiments showed that attraction to light as a function
of wavelength depends on light intensity. In our first experiment, where the minimal photon flux
(105–109 photons/cm2/s) needed for eliciting a phototactic response was determined wavelength by
wavelength, phototaxis was strongest in the green spectral range (~526 nm). In the other behavioural
experiment, where wavelength preference was tested under a higher but constant light intensity
(~1013 photons/cm2/s), the highest attraction was elicited by UV wavelengths (398 nm). Our results
suggest that both UV and green are important spectral regions for L. ingenua thus we recommend to
use both UV (~370-398 nm) and green (~526 nm) for trapping these insects.
Members of the fungus gnat family Sciaridae (Diptera) are widespread around the globe, even at the most extreme
places, such as subantarctic islands, tundras, and mountainous regions above 4000 m altitude1,2. Some species live
eserts3, but the most common habitat of sciarids are forests, swampy
exclusively in caves and others inhabit arid d
4
regions and moist meadows . They live under tree barks of deadwood, decaying leaves, manure piles, and most
commonly, in the soil1. They feed on soil-dwelling fungi and on the root hairs of plants, but they also consume
decaying plant material and other organic matter as w ell5. Sciarids are small (size = 1–6 mm) dark-coloured
winged insects having well developed compound eyes. On their ovoid head the compound eyes meet above the
base of the antennae, forming a dorsal bridge. The antennae are fairly long, consisting of 14 flagellomeres and
the scapus and pedicellus are rounded. Three ocelli are also present on the head. The palpus have usually three
segments6. The available information regarding fungus gnat eye morphology is scarce, what we know is that the
compound eye has relatively low, only a few hundred facets and the facet size is species dependent7. In general,
most sciarids are not considered to be pests, but some species may be deemed to be harmful for agriculture4.
However, the presence of sciarids in mushroom production is far more serious, as they are considered to be
the most important pests in this specialized crop p roduction8–10. The most common species in mushroom are
Lycoriella castanescens, Lycoriella ingenua and Bradysia ocellaris9. The economical threshold for fungus gnats is
low, one larva in 125 g casing material may result in 0.5% crop loss11,12. Direct damage is caused by the larvae,
which feed on the substrate (compost) of edible m ushrooms2 by taking away nutrients and water from the crop
itself . The sphorophore primordias and fruiting bodies may also be damaged by larval tunnelling13, in addition,
12
1
Department of Zoology, Plant Protection Institute, Centre for Agricultural Research, Eötvös Loránd
Research Network, Budapest, Hungary. 2Department of Vegetable and Mushroom Growing, Institute of
Horticultural Science, Hungarian University of Agriculture and Life Sciences, Villányi út 29‑43, Budapest 1118,
Hungary. 3Department of Entomology, Institute of Plant Protection, Hungarian University of Agriculture and Life
Sciences, Villányi út 29‑43, Budapest 1118, Hungary. 4Institute of Aquatic Ecology, Centre for Ecological Research,
Karolina út 29, Budapest 1113, Hungary. *email: egri.adam@ecolres.hu
Scientific Reports | (2021) 11:12770 | https://doi.org/10.1038/s41598-021-92230-y 1
Vol.:(0123456789)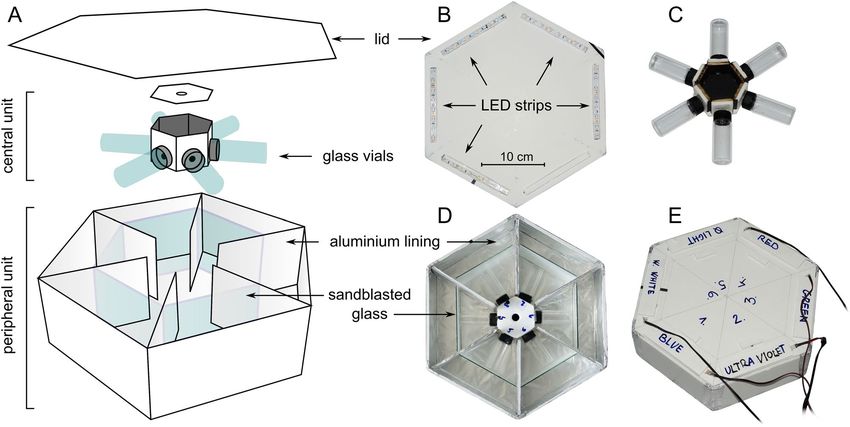
www.nature.com/scientificreports/
the vegetative hyphae are also threatened. Furthermore, the excrement of the larvae may shift the pH levels of
the compost to a critical level, when it will no longer be suitable for the mycelial growth of the m ushroom14. The
most commonly damaged crop is white button mushroom, which derives from the volume of production of
this fungus species. Apart from button mushroom, oyster, king oyster, shiitake, shimeji and to an extent almost
every cultivation can be hindered by sciarid infestation15,16. The adults do not damage the mushroom directly,
but can cause serious losses to farmers by transmitting fungal pathogens to the c rop2. It has been stated, that
individuals of the fungus gnat species L. ingenua are attracted by the volatilome of Trichoderma sp., which is
one of the most severe fungal disease of button mushroom production, and the adult may serve as an important
vector17. The adult can also carry the spores of Lecanicillium fungicola on its body, and contribute to the spread
of bacterial blotch d iseases13.
Crop protection of edible mushrooms against fungus gnats is difficult as the number of approved pesticides is
low, or for some cultures, such as Pleurotus sp., there are no approved p esticides18. The application of entomopath-
ogenic nematodes like Steinernema feltiae offers a reasonable control agent against gnats in button mushroom
production9,19,20, but in the case of species like Lentinula sp., Pleurotus sp., Cyclocybe sp., where the compost is
entirely covered in plastic foil before fruiting body formation, the reapplication of nematodes is problematic.
Since the European Commission wishes to reduce the use of pesticides by 50% by 2 03021, it is not plausible to
expect a new insecticide to appear for farmers in mushroom production, at least in Europe.
Development of alternative pest management methods are key to the production of safer crops for consump-
tion and to the reduction of the environmental load of pesticides. An important source of information for insects
is the visual environment. For example, colour, polarization, and contrast are important visual cues available for
the majority of animals22. The most common method against insect pests is the attraction of individuals with
light traps, however, trap efficiency strongly depends on the spectrum of the light23. The effectiveness of UV and
green wavelengths in insect pest management has been demonstrated by several studies, and the application of
LED light sources is becoming more and more frequent23. Besides trapping, there are further options, for exam-
ple, presentation of light of a properly chosen intensity and wavelength can inhibit certain pests from entering
a growing f acility24. Another method is light adaptation, where the activity of nocturnal insects (e.g. mating,
foraging etc.) are disrupted by the application of light sources during the night23.
One of the first studies about the spectral specific responses of sciarids to light was performed by Stringer and
Meyer-Rochow25. Their results indicated that certain cave-dweller sciarids were mostly attracted by blue-green
wavelengths, although the studied species was not identified. Later Jess and B ingham26 examined the responses
of adult L. ingenua to different light source types. They stated that L. ingenua were positively phototactic even
at low light levels, and the 300–650 nm spectral range attracted greater number of individuals than wavelengths
above 700 nm. The positive phototaxis of fungus gnats was also verified by Cloyd et al.27, who found that speci-
mens of Bradysia sp. nr. coprophila responded to light stimuli having intensity lower than 0.08374 µmol/m2/s
(= 5.04·1012 photons/cm2/s). The first attempt for revealing the wavelength dependence of phototaxis of fungus
gnats was made by Kim et al.28. By using a blue, green, orange and a red quasi monochromatic LED light trap
they found that the green LED (528 nm) was the most attractive to L. ingenua. The potency of LEDs against
Bradysia difformis fungus gnats were further explored by Stukenberg et al.29 who used 13 LEDs ranging from
UV (371 nm) to amber (619 nm). Their results showed that the highest number of sciarids were attracted by UV
(382 nm) and green-yellow wavelengths (532–592 nm) and their combination. They also used different back-
grounds to verify the effect of contrast, and stated that a black surface was the most effective. The importance
of contrast produced by a dark background for the chive gnat Bradysia odoriphaga has also been confirmed30.
The very recent molecular identification of two UV sensitive and one long-wavelength sensitive opsin genes in
B. odoriphaga (NCBI GenBank records at https://www.ncbi.nlm.nih.gov/genbank: MH491829.1; MK766510.1;
MK766508.1) seems to be supporting the previously mentioned high attractiveness of UV and green wavelengths.
In this study we revealed the wavelength dependence of phototaxis of L. ingenua in two different behavioural
experiments. Furthermore, we measured the spectral sensitivity of L. ingenua compound eyes with electrore-
tinography because no electroretinogram of any sciarids has been published as far as we know. Studying the
visual ecology of such pest insects may lead to the enhancement of light traps, and efficient light traps may help
mushroom growers to reduce sciarid infestations on farms without the intense use of insecticides but rather
through the mass trapping of the target organism.
Materials and methods
Fungus gnats. For laboratory experiments, we used L. ingenua adults, originating from pure insect cultures
that were maintained as described by Kühne and Heller31. The colonies were initiated by collecting mating pairs
of fungus gnats from a mushroom farm in Ócsa (47° 19′ 29″ N, 19° 18′ 27″ E). After mating, inseminated females
were isolated and males were identified by examining their h ypopygium3,32. Mated females of L. ingenua were
placed in plastic breeding pots (870 ml) containing peat-moss (Kekillä DSM 3 W, Kekillä Professional, Vantaa,
Finland) with approx. 95% water content and oat flakes with dried baker’s yeast granulate were provided as sus-
tenance for the larvae. The pots were covered with plastic-fiber veil and were stored in an environmental control
chamber in 16:8 L:D cycle, at 23 °C and 85% relative humidity.
Electroretinography measurements. L. ingenua were placed with protruding head and thorax into a
properly cut plastic pipette tip. Thorax, antennae and mouthparts were fixed to the pipette tip with melted paraf-
fin wax and finally a wax droplet was placed between the thorax and head to make the head totally immobilized.
For recording, tungsten microelectrodes (diameter = 0.08 mm) etched in saturated K NO2 solution were used.
The recording electrode was inserted into the left eye to which the light stimulus was primarily delivered. The
reference electrode was inserted to the other eye with its tip reaching the centre of the head.
Scientific Reports | (2021) 11:12770 | https://doi.org/10.1038/s41598-021-92230-y 2
Vol:.(1234567890)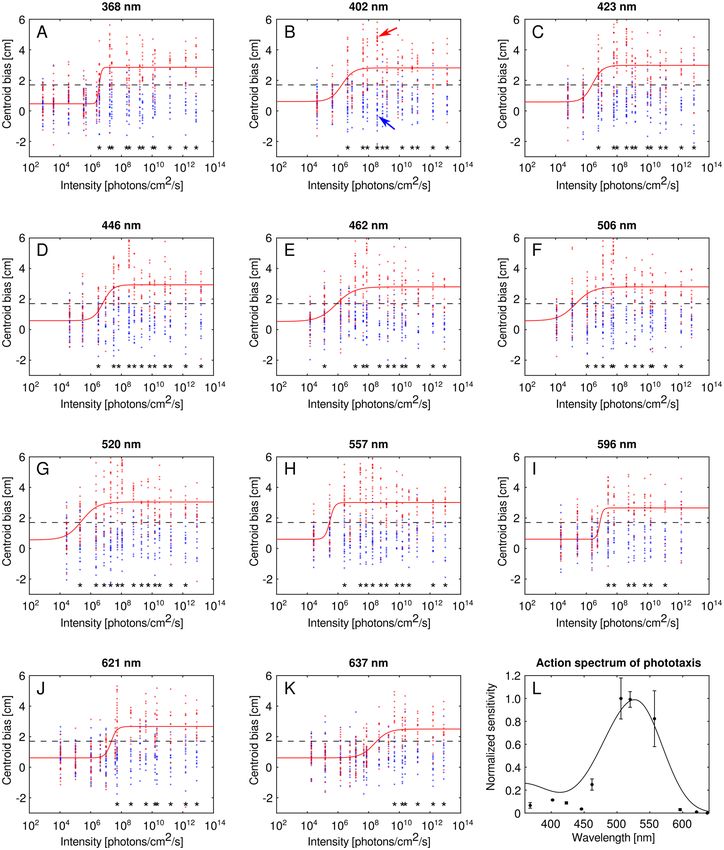
www.nature.com/scientificreports/
A custom-built, calibrated light source containing 14 quasi monochromatic LEDs was used for stimulation of
the eye preparations. Peak wavelengths (± half bandwidth) of the available LEDs were 346 nm (± 5.0 nm), 376 nm
(± 4.8 nm), 402 nm (± 5.5 nm), 421 nm (± 6.4 nm), 442 nm (± 8.5 nm), 467 nm (± 10.4 nm), 496 nm (± 13.5 nm),
516 nm (± 14.5 nm), 552 nm (± 17.7 nm), 598 nm (± 6.9 nm), 623 nm (± 7.7 nm), 641 nm (± 8.6 nm), 660 nm
(± 8.2 nm) and 744 nm (± 10.3 nm). The light intensity of the stimuli was variable through multiple log intensity
units depending on the wavelength. Detailed description of the light source is described e lsewhere33, where it
was used in a behavioural experiment with a four-branch quartz light guide (Moritex SOHC4S3.5-1500S). For
delivering light stimuli to the eye preparations, only one terminal of the light guide was used. The light beam
reaching the eye preparation was 5 mm wide being approximately 16 times wider than the compound eye itself.
Receptor responses were amplified with a custom-built amplifier (see electronic circuit diagram in Supple-
mentary Figure S1) inspired by Land et al.34. Data acquisition was done with a stereo USB sound card based on
the C-Media CM6206 USB Audio I/O Controller chip (C-Media Electronics Inc., Taipei, Taiwan) using Audac-
ity 2.2.1 audio recording software. The sound card was modified for low frequency and DC measurements as
described on the homepage of Data AcQuisition And Real-Time Analysis (http://www.daqarta.com). Left and
right channels of the sound card were used for recording the photoreceptor cell responses and a 450 mV reference
signal, respectively, to a 16-bit WAV audio file with 8000 Hz sampling frequency. The reference signal facilitated
data evaluation by indicating the presence of light stimulus and was also used for calibrating the voltage level of
the measured signal on the left channel. In preliminary tests the linearity of the sound card inputs was verified
in the ± 1 V range, hence the amplification was set to keep the measured signal within this region.
After 40 min of dark adaptation, electrodes were inserted under 660 nm light and a preprogrammed stimu-
lus sequence was presented to the eye preparation after an additional 10 min of darkness. For each of the 14
available wavelengths, in increasing order, 6–8 500-ms-long light stimuli were applied with increasing light
intensity with 3-s-long inter-stimulus intervals. Inter-stimulus interval of 12 s was used when wavelength was
switched to the next one. This whole stimulus sequence was repeated N = 6–8 times with 1-min-long separating
intervals. Recordings were made under 23–26 °C temperature, 50–55% relative humidity during the day when
the behavioural experiments were typically performed. Photon flux of the applied light stimuli varied between
2.4·1011 and 2.4·1015 photons/cm2/s.
For a given preparation, based on the reference signal and the preprogrammed stimulus sequence, the
responses were cropped from the recorded WAV file. Response amplitudes were considered as the magnitude of
negative jumps in the potential in the first 100 ms of the 500-ms-long light stimulus (Fig. 4A). In other words,
the lowest potential value in the first 100 ms of the stimulus relative to the potential measured at the beginning
of the stimulus was registered as the response amplitude. For a given stimulus sequence, sigmoid exposure-
response curves were fitted to the measured response amplitudes as a function of log photon flux for all available
wavelengths. Spectral sensitivity was calculated by obtaining the reciprocals of photon flux required for inducing
a standard response criterion for all w avelengths35. Finally, all spectral sensitivity curves corresponding to each
repetition (N = 6–8) of the stimulus sequence were averaged and normalized with the maximal value. A total
number of 12 female and 4 male L. ingenua eye preparations were measured.
Behavioural experiment 1. Wavelength dependence of L. ingenua phototaxis was studied in two different
experimental setups. In behavioural experiment 1, action spectrum of phototaxis was determined by measuring
the critical light intensity eliciting a standard phototactic response criterion as a function of wavelength in the
368-637 nm spectral range.
The experimental setup was placed in a darkened container (Fig. 1A–C). The light source was a custom-built,
LED-based device being able to produce preprogrammed quasi-monochromatic light stimuli of 11 different
wavelengths and the light intensity of these stimuli was variable over 3.9–4.7 log intensity units, depending on the
applied wavelength. Light intensity was variable with the combination of dimming with pulse width modulation
(PWM) and applying a neutral density filter (Fig. 1B, C). A circular, homogeneously illuminating area (diam-
eter = 6 cm) provided light stimuli and available peak wavelengths (± half bandwidth) were 368 nm (± 8.2 nm),
402 nm (± 6.1 nm), 423 nm (± 5.8 nm), 446 nm (± 8.5 nm), 462 nm (± 10.8 nm), 506 nm (± 12.5 nm), 520 nm
(± 13.5 nm), 557 nm (± 16.0 nm), 596 nm (± 7.2 nm), 621 nm (± 6.9 nm) and 637 nm (± 8.1 nm). The detailed
description of the light source has been given elsewhere36.
The arena was a horizontally laid, rectangular (length = 150 mm, width = 22 mm), 3 mm deep depression in
a fiberboard piece lined with black cardboard and covered by two microscope slides. The illuminating surface of
the light source faced downward to the arena centre from a distance of 19 cm with its optical axis enclosing 14°
with the horizontal (Fig. 1C). The arena was illuminated by 6 pieces of elemental sections of a 940 nm SMD5050
infrared LED strip and a Genius WideCam F100 webcam modified for infrared vision was aimed to the arena
from above (Fig. 1A–C). The infrared background illumination enabled the observation of insects while they
sensed no light.
The method for measuring the action spectrum of phototaxis of L. ingenua was similar as described in a
recent study36. Different light stimuli were presented to the test insects randomly moving in darkness, and
their attraction to light was quantified. At the beginning of each trial, 30–44 fungus gnats were placed in the
arena and the microscope-slide-covering was quickly applied. After 30 minutes of dark adaptation, a series of
30-s-long light stimuli separated by 180-s-long dark periods were presented to the insects. Stimuli of 4–5 dif-
ferent light intensities were applied at all 11 wavelengths. First, at the lowest light intensity, stimuli of different
wavelengths were randomly applied. Then, all available wavelengths were tested again with 1 log unit higher
light intensity, and so forth. Thus, light intensity of stimuli was increasing with time (intensity step = 1 log unit),
but before increasing the stimulus intensity, all wavelengths were applied randomly. From the beginning of a
given stimulus, 10 photos (8-bit grayscale JPG) were taken by the camera every 6 s, thus the 1st and 6th photo
Scientific Reports | (2021) 11:12770 | https://doi.org/10.1038/s41598-021-92230-y 3
Vol.:(0123456789)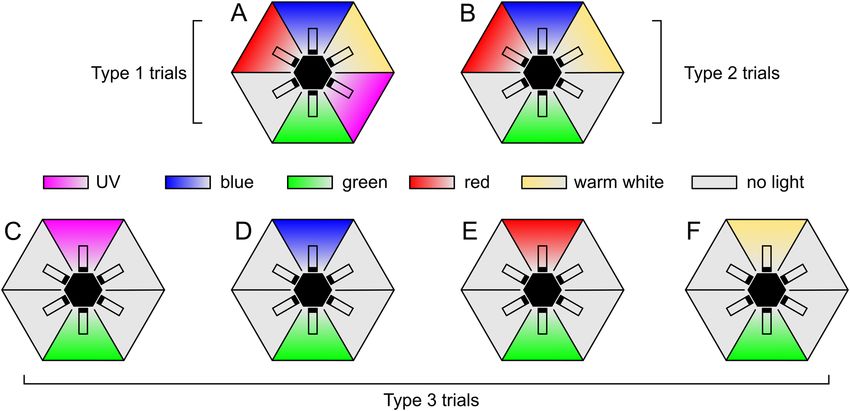
www.nature.com/scientificreports/
Figure 1. Experimental setup of behavioural experiment 1 and the evaluation process of the images. (A)
Schematic diagram of the experimental setup. (B,C) Photograph of the setup. (D) Median image of the 10
photos corresponding to a stimulus (λ = 402 nm, photon flux = 3.61·108 photons/cm2/s). (E) First image of the
arena taken by the camera (beginning of the same light stimulus). (F) Sixth image taken by the camera (end of
the same light stimulus) with L. ingenua individuals congregating on the bright (right) side of the arena. (G,H)
Thresholded image of (E) and (F) with yellow dashed and solid lines representing the arena midperpendicular
and the horizontal component of the centroid of the white pixels, respectively. Centroid bias Δx is shown by
horizontal yellow arrows (G: Δx = − 0.295 cm; H: Δx = 4.824 cm).
corresponded to the beginning and to the end of the stimulus. The camera recorded images with 15 frames per
second, thus the shutter speed for the obtained images was approximately 67 ms. As we experienced very high
photosensitivity in L. ingenua, to extend the previously mentioned 3.9–4.7 log intensity units wide dynamic
range of the light source, trials were also performed with additional, permanently attached 2 or 4 pieces of Lee
299 neutral density filters (LEE Filters, Andover, UK) [for transmission spectrum see Egri36]. Before each trial
the live view of the fixed webcam in a custom-written software facilitated to return the arena to a standardized
place. Two horizontal and two vertical guidelines were displayed on the live webcam image to which the arena
edges were aligned each time. Altogether 50 trials were performed and a total number of 1834 L. ingenua were
tested. To obtain the photon flux sensed by the test insects, wavelength dependent transmission spectrum of
the microscope-slide-covering of the arena was taken into account, as well as the Fresnel’s equations applying
to the air to glass and glass to air interface. Photon flux of stimuli (at the arena centre) for the test insects varied
Scientific Reports | (2021) 11:12770 | https://doi.org/10.1038/s41598-021-92230-y 4
Vol:.(1234567890)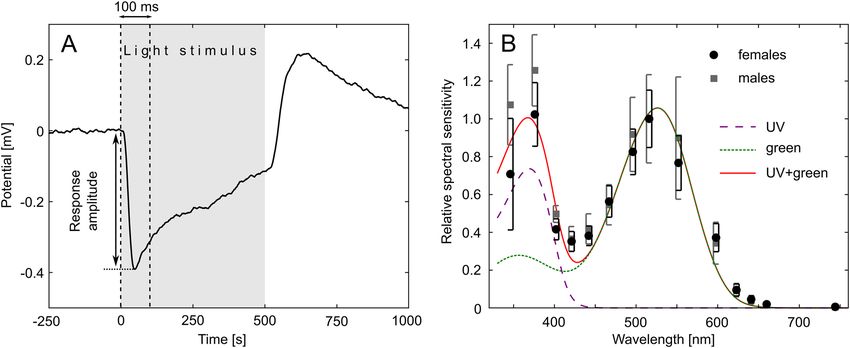
www.nature.com/scientificreports/
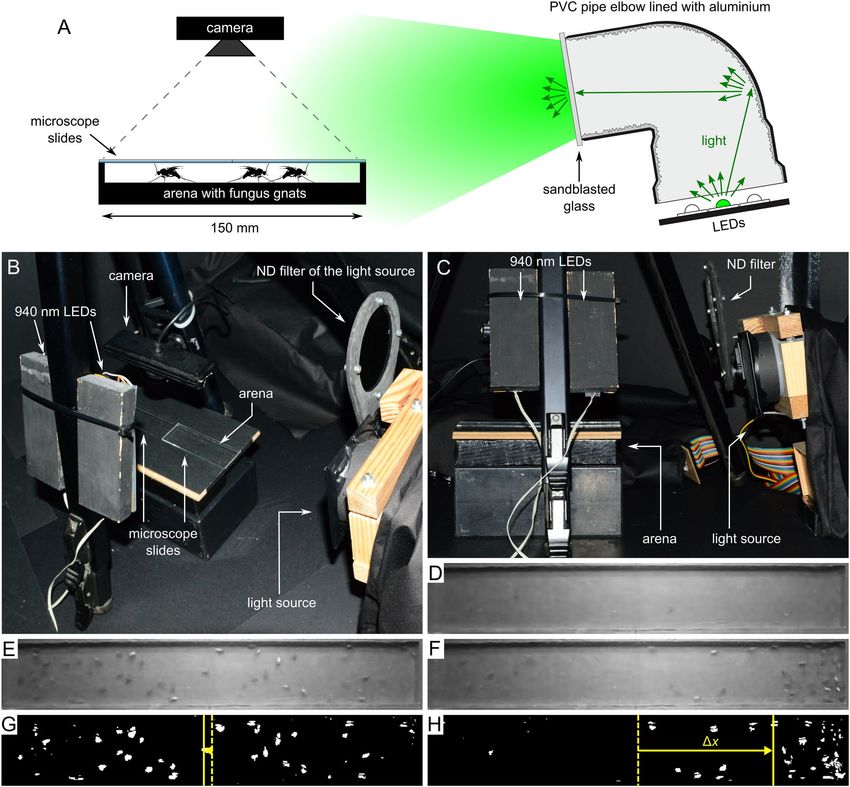
Figure 2. Experimental setup of behavioural experiment 2. (A) Exploded view of the hexagonal choice-box. (B)
Bottom of the lid of the choice-box with the exchangeable LED strips. (C) Central unit with the glass vials. (D)
Peripheral unit with the central unit inside. (E) Photo of the choice box with the closed lid.
between 7.51·102 and 1.53·1013 photons/cm2/s, but the applied intensity ranges per wavelength were different.
Experiments were carried out at 23–26 °C and 50–55% relative humidity.
Attraction of L. ingenua to a given stimulus was quantified by calculating the centroid of the insects relative
to the arena centre (centroid bias) at the beginning (Fig. 1G) and end of the stimulus (Fig. 1H). First of all, to
obtain a static background image of the arena, the median image of the 10 images corresponding to the stimulus
was calculated (Fig. 1D). The median image represented all stationary objects (e.g. arena walls, arena floor, acci-
dental immobile insect), and this image was subtracted from a given image to be evaluated (Fig. 1E, F) and after
subtraction, negative pixel values were multiplied by − 1. The resultant image was thresholded with the value of
16 (Fig. 1G, H): If a given pixel value was greater than 16, the pixel was set to white, otherwise to black. Finally,
the centroid of the white pixels and its distance Δx from the arena midperpendicular was calculated (centroid
bias) in centimetres (Fig. 1G, H). Centroid bias was obtained for the beginning (1st image) (Fig. 1E) and end (6th
image) (Fig. 1F) of each stimuli. With this method only actively moving insects contributed to the calculation of
Δx, because immobile insects appeared on the median image as being part of the static background.
Calculation of the action spectrum of phototaxis was the same as described by Egri et al.36. In short, for each
wavelength, all centroid biases obtained for the end of the stimuli were plotted against log stimulus photon
flux and sigmoid exposure-response curves were fitted to the data. Mean function value at the inflection points
of these 11 fitted curves was considered as the critical response criterion (Δxc = 1.7 cm). Action spectrum of
phototaxis was obtained by calculating the reciprocals of photon flux values needed for eliciting this standard
response criterion. To quantify the sensitivity of the action spectrum to the criterion response value, the same
calculation was performed for 20 additional values in the Δxc ± 0.7 cm range. All 21 action spectra were then
averaged, for each data point 95% confidence intervals were calculated, and the resulting action spectrum was
normalized with the maximal value.
Behavioural experiment 2. In this experiment, attraction of Lycoriella spp. to different wavelengths of
simultaneously present and equally bright light stimuli was tested in a hexagonal choice-box (Fig. 2) which
was inspired by previous studies27,37. The choice-box was composed of a central and a peripheral unit and a lid
(Fig. 2A). The central unit was a hexagonal prism (edge of base = 40 mm, height = 40 mm) with six glass vials
(diameter = 27 mm, length = 70 mm) attached to each side (Fig. 2A, C). The interior of the prism was lined with
black cardboard and holes (diameter = 5 mm) ensured passages for the test insects between the prism and the
vials (Fig. 2A). The peripheral unit was also a hexagonal prism (edge of base = 185 mm, height = 100 mm) with
its interior lined with aluminium foil and separated into six chambers (Fig. 2A, D). The central unit could be
placed into the peripheral unit in such a way that each vial entered into its own chamber and the neighbouring
vials could not be seen from a given vial (Fig. 2D). On the hexagonal lid of the choice-box, different LED strip
sections (UV, blue, green, red or white) could be attached to illuminate the interior of the chambers from above
(Fig. 2B, E). These LED strips were arbitrarily exchangeable with each other and the peak wavelengths (± half
bandwidth) of the UV, blue, green and red LED strips were 398 nm (± 6.4 nm), 447 nm (± 11.3 nm), 512 nm
(± 16.7 nm) and 631 nm (± 8.6 nm), respectively. The white LED strip was a 3000K warm white (WW) one. Nor-
malized emission spectra of these LED strips are shown in Supplementary Figure S2. In each chamber a piece of
Scientific Reports | (2021) 11:12770 | https://doi.org/10.1038/s41598-021-92230-y 5
Vol.:(0123456789)www.nature.com/scientificreports/
Figure 3. Arrangement of stimuli in the different trial types in behavioural experiment 2. (A) Type 1 trials
(N1 = 1000). (B) Type 2 trials (N2 = 1000). (C–F) Type 3 trials (N3 = 4 × 500 = 2000). Arrangement of stimuli was
randomized in each trial, but in type 3 trials the two applied light stimuli were always facing each other.
vertical sandblasted glass was inserted between the vial and the illuminated end of the chamber (Fig. 2A, D). In
the assembled choice-box each vial in its own chamber was homogeneously illuminated when the chamber was
lit by an LED strip. Thus, viewed from the middle of the central unit, the holes (passages to the vials) as illumi-
nating spots represented the light stimuli for the test insects. The light intensity of each LED strip was adjusted
with pulse width modulation (fPWM = 750 Hz) to a photon flux of 2.7·1013 photons/cm2/s (± 6.9%) (≈ brightness
of a heavily overcast sky) measured at the passage entrances to the vials with a radiometrically calibrated Ocean
Optics STS-VIS spectrometer (Ocean Optics, Largo, USA).
Trials were performed in Ócsa at the previously mentioned mushroom farm inside a production unit where
Lycoriella spp. were abundant. Fungus gnats were collected with an aspirator and were tested immediately after
collection. After setting the desired stimulus combination (LED strip arrangement) in the choice-box, 50 dark-
adapted fungus gnats were placed into the middle hexagonal prism of the central unit. After 45 min the numbers
of responding insects were registered for all chambers/vials of the choice-box. Figure 3 summarizes the three
types of trials performed on 5 experimental days. In type 1 trials, 5 chambers of the choice-box were illuminated
by the UV, blue, green, red and WW LEDs, while the sixth chamber was unexposed (Fig. 3A). Arrangement
of stimuli was randomized for each trial, number of performed trials was 20, thus N1 = 1000 individuals were
tested. Type 2 trials were identical with type 1 trials with the only exception that UV stimulus was excluded, thus
two unexposed control chambers were present (Fig. 3B) (N2 = 1000 individuals). In type 3 trials, preference of
fungus gnats to all kinds of available non-green stimuli (UV, blue, red, WW) versus green was tested in separate
experiments. Light stimuli were always facing each other in the choice-box while the other four chambers were
unexposed (Fig. 3C–F). Each stimulus pair was tested in 10 trials, thus N3 = 4 (stimulus pairs) × 10 (trials) × 50
(individuals) = 2000 specimens were tested in type 3 trials.
To estimate the species composition in the production unit, on each experimental day, 100 fungus gnats were
collected from random locations in the unit and were later i dentified3.
Statistics. For each tested wavelength, spectral sensitivity of female and male L. ingenua eye preparations
were compared with Mann-Whitney U-test. In behavioural experiment 1, to test whether a stimulus (fixed wave-
length and photon flux) elicited significant attraction, the distribution of Δx centroid bias values at the begin-
ning and at the end of the given stimuli were compared with Mann-Whitney U-test. To reduce the chance of
false negative results, no p-value adjustments were made during data a nalyses38. In behavioural experiment 2,
differences between the numbers of individuals attracted by the different chambers of the choice-box was com-
pared with a one-way ANOVA model with the stimulus wavelength/type considered as a fixed factor. Normality
of residuals was verified by Shapiro-Wilk’s test (Supplementary Table 1). To reveal statistically homogeneous
groups in attraction data to the different stimuli/chambers in trial types 1 and 2 (Fig. 3A, B), Games-Howell
post-hoc test was performed, because Levene’s test failed to verify homogeneity of variances. In the case of type
3 trials, based on Levene’s test results, Tukey’s post-hoc tests were performed (Fig. 3D–F), except for the green-
UV stimulus arrangement (Fig. 3C), which was examined with Games-Howell post-hoc test. Since in type 3
trials all of the chambers were accessible for the fungus gnats, the two light stimuli used in these trials were also
compared with the four empty chambers during data analyses. Non-responding specimens were excluded from
statistical analyses.
Statistical tests were performed with the R statistical package v3.6.039 and the software IBM SPSS version 22.
Scientific Reports | (2021) 11:12770 | https://doi.org/10.1038/s41598-021-92230-y 6
Vol:.(1234567890)www.nature.com/scientificreports/
Figure 4. Electroretinogram of L. ingenua. (A) Time course of a typical receptor potential measured from
a female L. ingenua eye preparation. Grey region represents the 500-ms-long light stimulus, and the pair of
vertical dashed lines show the 100-ms-long period where the response amplitude was determined. (B) Mean
relative spectral sensitivity of 12 female and 4 male L. ingenua eye preparations with vertical bars denoting SD.
The red continuous curve shows the fitted sum of two A1-based pigment t emplates41 with peak wavelengths of
λmax,UV = 370.1 nm (dashed purple curve) and λmax,G = 526.3 nm (dotted green curve), respectively. Curve fitting
was performed on the pooled data of females and males.
Ethical approval and informed consent. No permission, licence or approval was needed for our study.
Results
Electroretinography measurements. Figure 4A shows the time course of a typical receptor response
measurement. It is clear that the response magnitude is remarkably lower than the 10–20 mV magnitude of typi-
cal ERG signals, but electrode type and input impedance of the amplifier can strongly influence the magnitude
and shape of the measured r esponse40. As shown in Fig. 4B, the mean spectral sensitivity of all measured female
and male L. ingenua eye preparations is bimodal with two maxima in the UV and green spectral regions. Even
though UV-sensitivity of males seems to be higher than that of females, according to Mann–Whitney U tests,
they did not differ significantly at all wavelengths. Therefore, data for females and males were pooled together in
further evaluation. Assuming that two types of visual pigments dominate in the eyes, the sum of two A1-based
visual pigment templates were fitted on the data. Mathematical form of the templates was obtained from eqns.
(1)–(5) in Govardovskii et al.41. Since each template had 2 free parameters (λmax and a constant parameter allow-
ing to scale one template relative to the other), the sum of two A1-based templates had 4 parameters. Parameters
giving the best fit to the measured spectral sensitivity were calculated with GNU Octave 5.2.0. For the peak
wavelengths of the fitted UV and green visual templates λmax,UV = 370.1 nm and λmax,G = 526.3 nm were obtained,
respectively (Fig. 4B).
Behavioural experiment 1. Results of behavioural experiment 1 are displayed in Fig. 5. In Fig. 5A–K,
centroid bias values (Δx) with fitted sigmoid exposure-response curves are plotted against photon flux of the
light stimuli at all 11 wavelengths. Blue and red dots show Δx values measured at the beginning and end of
light stimuli, thus evaluation of one stimulus resulted in a pair of a blue and a red dot. Significant differences
(α = 0.005) revealed by Mann–Whitney U test performed between the distribution of the Δx values measured at
the beginning and end of the stimulus for a given wavelength and photon flux are shown by asterisks. It is clear
for all wavelengths that low light intensities elicited no significant reaction, but as stimulus intensity increases
the attraction of fungus gnats to light becomes significant.
Figure 5L shows the calculated action spectrum of phototaxis of L. ingenua with vertical bars denoting 95%
confidence intervals. The action spectrum has one major peak in the green spectral range and a ten times lower
minor peak in the UV. An A1-based pigment t emplate41 was fitted on the data and the obtained peak wavelength
was λmax = 526.6 nm.
Behavioural experiment 2. As shown in Fig. 6A, in type 1 trials, when all available 5 LED strips plus an
unexposed control chamber was present (Fig. 3A), the majority of the 622 choice-making fungus gnats chose
the UV-lit chamber (60.98%). The blue-, green-, red-, and white-lit chambers and the control chamber attracted
10.27%, 9.56%, 6.14%, 7.43% and 5.62% of the respondent individuals, respectively. According to the one-way
ANOVA model, significant differences were detected in these responses (F(5, 114) = 308.99, p < 0.001) and
Games–Howell post-hoc test revealed that the UV light source attracted significantly more gnats than each of
the other stimuli (p < 0.001 in each pairwise comparison with UV data).
Scientific Reports | (2021) 11:12770 | https://doi.org/10.1038/s41598-021-92230-y 7
Vol.:(0123456789)www.nature.com/scientificreports/
Figure 5. Phototactic responses of L. ingenua in behavioural experiment 1. (A–K) Responses with fitted
sigmoid exposure-response curves at 11 wavelengths. Blue and red dots represent the centroid bias values (Δx)
measured at the beginning and end of the applied light stimuli. Sigmoid exposure-response curves were fitted
to the Δx values obtained for the end of the stimuli (red dots). Dashed lines show the critical response criterion
(Δxc = 17.0 mm), and asterisks indicate whether distribution of the Δx values at the end of a light stimulus (red
dots for a given light intensity) significantly differ from the corresponding distribution of Δx values measured
at the beginning of the same stimulus (blue dots for the same light intensity) at α = 0.005 significance level.
Red and blue arrows in (B) show Δx values corresponding to Fig. 1E, G and 1F, H, respectively. (L) Calculated
action spectrum of phototaxis with error bars denoting 95% confidence intervals. Curve shows a fitted A1-based
pigment template with a λmax of 526.6 nm41.
Scientific Reports | (2021) 11:12770 | https://doi.org/10.1038/s41598-021-92230-y 8
Vol:.(1234567890)www.nature.com/scientificreports/
Figure 6. Choice percentages for the different chambers of the choice-box in trial types 1-2 in behavioural
experiment 2. (A) Results for type 1 trials (Fig. 3A) with vertical bars denoting SD. Lowercase letters indicate
statistically homogeneous groups at α = 0.05 significance level revealed by Tukey’s post-hoc test. Nr is the
number of respondent fungus gnat individuals out of the total number of 1000 tested specimens. (B) Same as A,
for type 2 trials (Fig. 3B). Total number of trials was 20 in case of both type 1 and type 2 trials.
Figure 7. Percentage of choices of fungus gnats for the four different stimulus pairs in type 3 trials in
behavioural experiment 2. (A) Results for the green-UV stimulus pair (Fig. 3C) with vertical bars denoting SD.
Lowercase letters indicate statistically homogeneous groups at α = 0.05 significance level revealed by Games-
Howell post-hoc test. Choice percentages for the four unexposed chambers are not displayed. Nr is the number
of respondent fungus gnat individuals out of the total number of 500 tested specimens. Total number of trials
was 10. (B) Same as A, for the green-blue stimulus pair (Fig. 3D) but with Tukey’s post-hoc test. (C) Same as (B),
for the green-red stimulus pair (Fig. 3E). (D) Same as (B), for the green-WW stimulus pair (Fig. 3F).
In type 2 trials (Fig. 3B), 620 individuals made choice and the most attractive stimulus was the green (41.26%
of respondents), followed by the blue (25.26% of respondents). The red, white and the two unexposed chambers
attracted 10.26%, 10.60%, 8.72% and 5.73% of the respondents, respectively (Fig. 6B). The one-way ANOVA
model revealed significant differences in the catch numbers of the chambers (F(5, 114) = 77.27, p < 0.001). Accord-
ing to Games–Howell post-hoc test, the green stimulus was significantly more attractive than any other stimuli
(p < 0.001 in each pairwise comparison with green data). More details about statistically homogeneous groups
are indicated by lowercase letters in Fig. 6B.
Figure 7 shows the results of type 3 trials, where preference for a single light stimulus (UV, blue, red and WW)
was tested against the green stimulus with the remaining four chambers being unexposed (Fig. 3C–F). Choice
Scientific Reports | (2021) 11:12770 | https://doi.org/10.1038/s41598-021-92230-y 9
Vol.:(0123456789)www.nature.com/scientificreports/
percentages are only shown for the given stimulus pair, but statistical tests involved the other four unexposed
chambers also. Total number of respondent individuals (Nr) is displayed for all stimulus configurations (top
of Fig. 7). In all cases, significant differences were detected by the one-way ANOVA model (green vs UV: F(5,
54) = 249.90, p < 0.001; green vs blue: F(5, 54) = 181.58, p < 0.001; green vs red: F(5, 54) = 295.78, p < 0.001; green
vs WW: F(5, 54) = 131.01, p < 0.001). According to post-hoc tests, significant difference emerged between the
attraction to the green and the other stimulus (p < 0.05 for all type 3 trials) and catch numbers of the unexposed
four chambers were statistically similar (p > 0.05 for all type 3 trials). Except for the UV-green stimulus pair
(Fig. 7A), the green stimulus was more attractive than the other stimulus (Fig. 7B–D).
Identification of the 500 fungus gnats collected for determining the species composition in the production
unit revealed that 76%, 19% and 5% of the individuals were L. ingenua, L. agraria and other Lycoriella spp.,
respectively. Consequently, the results of behavioural experiment 2 are dominated by the responses of L. ingenua
individuals.
Discussion
Until now, the only fungus gnat examined with ERG was the bioluminescent New Zealand glowworm Arach-
nocampa luminosa (Skuse, 1891) with eye spectral sensitivity adapted to the emission spectrum of the biolumi-
nescence of the i ndividuals42. The subject of our present work, L. ingenua is not that special as A. luminosa, but
its significance as a crop pest is infinitely superior.
According to our ERG measurements, L. ingenua has two sensitivity maxima, one in the UV and another
in the green spectral range. Only from dark-adapted ERG recordings one cannot unambiguously identify dif-
ferent photoreceptor types, although distinct sensitivity peaks may indicate that more than one photoreceptors
are present42. The fact that phototaxis was far the strongest for green and UV quasi monochromatic light in
behavioural experiments 1 and 2, respectively, may also indicate that the presence of the peaks in the spectral
sensitivity of the compound eye (Fig. 4B) are caused by distinct photoreceptor types. The reason for the different
attraction to light as a function of wavelength lies in the differences between the two setups.
There were three essential differences between behavioural experiments 1 and 2. Firstly, in behavioural experi-
ment 1, only one stimulus was present at a time, while in behavioural experiment 2, stimuli were simultaneously
present. Secondly, the results of behavioural experiment 1 (Fig. 5) and 2 (Figs. 6, 7) are primarily valid for dif-
ferent light intensity ranges. In behavioural experiment 1, typical minimal photon flux values being able to elicit
significant attraction depended on wavelength, but were in the 105–109 photons/cm2/s range even in the case
of the least attractive red wavelengths. These photon flux values are excessively lower than that of the stimuli
used in behavioural experiment 2 (~1013 photons/cm2/s). This is not especially surprising, because methodol-
ogy applied in behavioural experiment 1 is based on the determination of the minimal light intensity needed
for a given phototactic reaction (critical response criterion Δxc), and photon flux of the stimuli in behavioural
experiment 2 was arbitrarily chosen. The third important difference between the behavioural experiments was
related to the test insects. Behavioural experiment 1 was made exclusively with L. ingenua, while in behavioural
experiment 2, the proportion of this species was 76%, however, the rest 24% could not account for the high UV
preference (Figs. 6A, 7A) alone.
Thus, it seems that spectral sensitivity of phototaxis in L. ingenua depends on light intensity.
Explanation for our results may lie in the ocelli, which are simple eyes usually present in winged adult
insects43. Ocelli are extremely underfocused visual organs and mostly used to stabilize flight by blurry but rap-
idly perceiving the intensity pattern formed by the dark ground and the brighter s ky22. Although ocelli thought
to be unable to mediate phototactic reactions alone44, light reaching exclusively the ocelli can elicit phototaxis
from insects after a ll45,46. Because primarily green-sensitive ocelli are not uncommon among insects47–49, and
the light sensitivity of insect ocelli can be several orders of magnitude higher than that of the compound e yes50,
light perception through ocelli could have been dominated in behavioural experiment 1 resulting in the action
spectrum of phototaxis with λmax = 526.6 nm (Fig. 5L). Green-sensitive ocelli is a feature of mainly nocturnal
insects47, because night-light has very little UV content, especially under forest canopies22. Among fungus gnats,
both diurnality and nocturnality has already been d emonstrated51–53, but as far as we know, circadian activity of
L. ingenua has not been studied yet. In behavioural experiment 2, the higher stimulus intensities could account
for the mainly UV-dominated attraction (Fig. 6A) which result is in accordance with the finding of Stukenberg
et al.29 who used practically the same light intensities for quasi monochromatic stimuli in choice experiments with
the black fungus gnat B. difformis, being another notorious pest in mushroom cultivation. When UV stimulus
was not present in behavioural experiment 2 (Figs. 6B, 7B–D), the green stimulus was the most attractive which
is also in accordance with previous s tudies28.
On the other hand, the peak of the action spectrum of phototaxis (Fig. 5L) overlaps extremely well with the
green sensitivity peak in the spectral sensitivity of the compound eye (λmax,G = 526.3 nm, Fig. 4B), which may
suggest that the compound eye could still play significant role in behavioural experiment 1. It is also important
to mention that in behavioural experiment 2, only four quasi-monochromatic stimuli were applied and the
shortest-wavelength stimulus was the UV (398 nm) one. Consequently, the wavelength of maximal attraction
cannot be estimated as precisely as could be done for behavioural experiment 1 (Fig. 5L), but based on the ERG
results it is expected around 370 nm (Fig. 4B). However, independent of the underlying mechanisms causing the
light intensity dependent reactions, our experiments and ERG recordings highlight the importance of both UV
(~ 370–398 nm) and green (~ 526 nm) light, or even their combination for creating visually attractive monitoring
or trapping tools for L. ingenua at mushroom growing facilities.
In general, the spectral sensitivity obtained from ERG recordings is very informative, but the action spectrum
of phototaxis is not necessarily similar in shape. Thus performing behavioural experiments are essential in the
process of light trap development. The most important message of our paper is that UV and green spectral ranges
Scientific Reports | (2021) 11:12770 | https://doi.org/10.1038/s41598-021-92230-y 10
Vol:.(1234567890)www.nature.com/scientificreports/
attract L. ingenua individuals with the highest efficiency and future research should investigate the effectiveness
of trap prototypes in combining these spectral regions. Based on our results, we would also like to emphasize
that besides the wavelength composition of a light stimulus, light intensity is also a very important parameter,
which should not be disregarded when light trapping of insects is the aim.
Data availability
Our paper has a supplementary table and two supplementary figures.
Received: 11 February 2021; Accepted: 22 April 2021
References
1. Binns, E. S. Fungus gnats (Diptera: Mycetophilidae/Sciaridae) and the role of mycophagy in soil: A review. Rev. Ecol. Biol. Sol. 18,
77–90 (1981).
2. Fletcher, J. T. & Gaze, R. H. Pests. In Mushroom Pest and Disease Control: A Color Handbook 140–165 (Manson Publishing Ltd,
2008).
3. Menzel, F. & Mohrig, W. Revision der paläarktischen Trauermücken (Diptera, Sciaridae). (Ampyx-Verlag, 2000).
4. Mead, F. W. & Fasulo, T. R. Darkwinged Fungus Gnats, Bradysia spp. (Insecta: Diptera: Sciaridae). Entomology and Nematology
Department Series of Florida University. UF/IFAS Extension 14, 1–3 (2001).
5. Cloyd, R. A. Ecology of fungus gnats (Bradysia spp.) in greenhouse production systems associated with disease-interactions and
alternative management strategies. Insects 6, 325–332 (2015).
6. Mohrig, W. & Menzel, F. Sciaridae (Black Fungus Gnats). in Manual of Central American Diptera (eds. Brown, B. V. et al.) vol. 1
279–292 (NRC Research Press, 2009).
7. Taylor, G. J., Hall, S. A., Gren, J. A. & Baird, E. Exploring the visual world of fossilized and modern fungus gnat eyes (Diptera:
Keroplatidae) with X-ray microtomography. J. R. Soc. Interface. 17, 20190750 (2020).
8. White, P. F. Pest and Pesticides. in The Biology and Technology of the Cultivated Mushroom (eds. Flegg, P. B., Spencer, D. M. &
Wood, D. A.) 279–294 (Wiley, 1985).
9. Shamshad, A. The development of integrated pest management for the control of mushroom sciarid flies, Lycoriella ingenua
(Dufour) and Bradysia ocellaris (Comstock), in cultivated mushrooms: IPM for control of sciarid flies in mushrooms. Pest. Manag.
Sci. 66, 1063–1074 (2010).
10. Andreadis, S. S., Cloonan, K. R., Myrick, A. J., Chen, H. & Baker, T. C. Isolation of a female-emitted sex pheromone component
of the fungus gnat, Lycoriella ingenua, attractive to males. J. Chem. Ecol. 41, 1127–1136 (2015).
11. Hussey, N. W. & Gurney, B. Biology and control of the sciarid Lycoriella auripila Winn. (Diptera: Lycoriidae) in mushroom culture.
Ann. Appl. Biol. 62, 395–403 (1968).
12. White, P. F. The effect of sciarid larvae (Lycoriella auripila) on cropping of the cultivated mushroom (Agaricus bisporus). Ann. Appl.
Biol. 109, 11–17 (1986).
13. Shamshad, A., Clift, A. D. & Mansfield, S. The effect of tibia morphology on vector competency of mushroom sciarid flies. J. Appl.
Entomol. 133, 484–490 (2009).
14. Chang, S. T. & Miles, P. G. Insect diseases. in Mushrooms: Cultivation, Nutritional Value, Medicinal Effect, and Environmental
Impact 179–185 (CRC Press, 2004).
15. O’Connor, L. & Keil, C. B. Mushroom host Influence on Lycoriella mali (Diptera: Sciaridae) life cycle. J. Econ. Entomol. 98, 8 (2005).
16. Badshah, K. et al. Management of Lycoriella ingenua (Diptera: Sciaridae) on oyster mushroom (Pleurotus ostreatus) through dif-
ferent botanicals. Int. J. Trop. Insect Sci. https://doi.org/10.1007/s42690-020-00341-2 (2020).
17. Cloonan, K. R., Andreadis, S. S. & Baker, T. C. Attraction of female fungus gnats, Lycoriella ingenua, to mushroom-growing sub-
strates and the green mold Trichoderma aggressivum. Entomol. Exp. Appl. 159, 298–304 (2016).
18. Geösel, A. A termesztett csiperkegomba védelme. Növényvédelem 52, 461–471 (2016).
19. Grewal, P. S., Tomalak, M., Keil, C. B. O. & Gaugler, R. Evaluation of a genetically selected strain of Steinernema feltiae against the
mushroom sciarid Lycoriella mali. Ann. Appl. Biol. 123, 695–702 (1993).
20. Jess, S. & Bingham, J. F. W. Biological control of sciarid and phorid pests of mushroom with predatory mites from the genus
Hypoaspis (Acari: Hypoaspidae) and the entomopathogenic nematode Steinernema feltiae. Bull. Entomol. Res. 94, 159–167 (2004).
21. European Commission. Report from the Commission to the European Parliament and the Council. COM(2020) 204 final. https://
eur-lex.europa.eu/legal-content/EN/TXT/?uri=CELEX:52020DC0204 (2020).
22. Cronin, T. W., Johnsen, S., Marshall, N. J. & Warrant, E. J. Visual Ecology (Princeton University Press, 2014).
23. Shimoda, M. & Honda, K. Insect reactions to light and its applications to pest management. Appl. Entomol. Zool. 48, 413–421
(2013).
24. Kim, M.-G., Yang, J.-Y. & Lee, H.-S. Phototactic behavior: Repellent effects of cigarette beetle, Lasioderma serricorne (Coleoptera:
Anobiidae), to light-emitting diodes. J. Korean Soc. Appl. Biol. Chem. 56, 331–333 (2013).
25. Stringer, I. & Meyer-Rochow, V. Attraction of flying insects to light of different wavelengths in a Jamaican cave. Mémoires de
Biospeologie 21, 133–139 (1994).
26. Jess, S. & Bingham, J. F. W. The spectral specific responses of Lycoriella ingenua and Megaselia halterata during mushroom cultiva-
tion. J. Agric. Sci. 142, 421–430 (2004).
27. Cloyd, R. A., Dickinson, A., Larson, R. A. & Marley, K. A. Phototaxis of fungus gnat, Bradysia sp. nr coprophila (Lintner) (Diptera:
Sciaridae), adults to different light intensities. HortScience 42, 1217–1220 (2007).
28. Kim, H. H. et al. Attract effect of mushroom flies with different wavelength of light emitting diode(LED). J. Mushroom 12, 375–378
(2014).
29. Stukenberg, N., Ahrens, N. & Poehling, H.-M. Visual orientation of the black fungus gnat, Bradysia difformis, explored using
LEDs. Entomol. Exp. Appl. 166, 113–123 (2018).
30. An, L. et al. High innate preference of black substrate in the chive gnat, Bradysia odoriphaga (Diptera: Sciaridae). PLoS ONE 14,
e0210379 (2019).
31. Kühne, S. & Heller, K. Sciarid fly larvae in growing media—biology, occurrence, substrate and environmental effects and biological
control measures. in Peat in Horticulture—Life in Growing Media (ed. Schmilewski, G.) 95–102 (International Peat Society, 2010).
32. Broadley, A., Kauschke, E. & Mohrig, W. Black fungus gnats (Diptera: Sciaridae) found in association with cultivated plants and
mushrooms in Australia, with notes on cosmopolitan pest species and biosecurity interceptions. Zootaxa 4415, 201 (2018).
33. Egri, Á. & Kriska, G. How does the water springtail optically locate suitable habitats? Spectral sensitivity of phototaxis and polaro-
taxis in Podura aquatica. J. Exp. Biol. 222, jeb199760 (2019).
34. Land, B. R., Wyttenbach, R. A. & Johnson, B. R. Tools for physiology labs: An inexpensive high-performance amplifier and electrode
for extracellular recording. J. Neurosci. Methods 106, 47–55 (2001).
Scientific Reports | (2021) 11:12770 | https://doi.org/10.1038/s41598-021-92230-y 11
Vol.:(0123456789)www.nature.com/scientificreports/
35. DeVoe, R. D., de-Souza, J. M. & Ventura, D. F. Electrophysiological measurements of spectral sensitivities: a review. Braz. J. Med.
Biol. Res. 30, 169–177 (1997).
36. Egri, Á., Farkas, P., Bernáth, B., Guerin, P. M. & Fail, J. Spectral sensitivity of L2 biotype in the Thrips tabaci cryptic species complex.
J. Insect Physiol. 121, 103999 (2020).
37. Yang, E. C., Lee, D. W. & Wu, W. Y. Action spectra of phototactic responses of the flea beetle, Phyllotreta striolata. Physiol. Entomol.
28, 362–368 (2003).
38. Rothman, K. J. No adjustments are needed for multiple comparisons. Epidemiology 1, 43–46 (1990).
39. R Core Team. R: A Language and Environment for Statistical Computing. (Foundation for Statistical Computing, 2019).
40. Kugel, M. The time course of the electroretinogram of compound eyes in insects and its dependence on special recording condi-
tions. J. Exp. Biol. 71, 1–6 (1977).
41. Govardovskii, V. I., Fyhrquist, N., Reuter, T., Kuzmin, D. G. & Donner, K. In search of the visual pigment template. Vis. Neurosci.
17, 509–528 (2000).
42. Meyer-Rochow, V. B. & Eguchi, E. Thoughts on the possible function and origin of bioluminescence in the New Zealand glowworm
Arachnocampa luminosa (Diptera: Keroplatidae), based on electrophysiological recordings of spectral responses from the eyes of
male adults. N. Z. Entomol. 8, 111–119 (1984).
43. Land, M. F. & Nilsson, D.-E. Animal Eyes (Oxford University Press, 2012).
44. Cornwell, P. B. The functions of the ocelli of Calliphora (Diptera) and Locusta (Orthoptera). J. Exp. Biol. 32, 217–237 (1955).
45. Lazzari, C. R., Reiseman, C. E. & Insausti, T. C. The role of the ocelli in the phototactic behaviour of the haematophagous bug
Triatoma infestans. J. Insect Physiol. 44, 1159–1162 (1998).
46. Wehrhahn, C. Ocellar vision and orientation in flies. Proc. R. Soc. Lond. B 222, 409–411 (1984).
47. Berry, R. P., Wcislo, W. T. & Warrant, E. J. Ocellar adaptations for dim light vision in a nocturnal bee. J. Exp. Biol. 214, 1283–1293
(2011).
48. Goldsmith, T. H. & Ruck, P. R. The spectral sensitivities of the dorsal ocelli of cockroaches and honeybees: An electrophysiological
study. J. Gen. Physiol. 41, 1171–1185 (1958).
49. Lall, A. B. & Ovid Trouth, C. The spectral sensitivity of the ocellar system in the cricket Gryllus firmus (Orthoptera: Gryllidae). J.
Insect Physiol. 35, 805–808 (1989).
50. Wilson, M. The functional organisation of locust ocelli. J. Comp. Physiol. 124, 297–316 (1978).
51. Duque-Buitrago, C. A., Alzate-Quintero, N. F. & Tupac Otero, J. Nocturnal pollination by fungus gnats of the colombian endemic
species, Pleurothallis marthae (orchidaceae: pleurothallidinae). Lankesteriana 13, 407–417 (2014).
52. Li, H. J., He, X. K., Zeng, A. J., Liu, Y. J. & Jiang, S. R. Bradysia Odoriphaga copulatory behavior and evidence of a female sex
pheromone. J. Agric. Urban Entomol. 24, 27–34 (2007).
53. Mochizuki, K. & Kawakita, A. Pollination by fungus gnats and associated floral characteristics in five families of the Japanese flora.
Ann. Bot. 121, 651–663 (2018).
Acknowledgements
Project no. 131738 has been implemented with the support provided from the National Research, Development
and Innovation Fund of Hungary, financed under the PD_19 funding scheme. Á. Egri was supported by the János
Bolyai Research Scholarship of the Hungarian Academy of Sciences. This study was supported by the Ministry for
Innovation and Technology within the framework of the Thematic Excellence Programme 2020 - Institutional
Excellence Subprogram (TKP2020-IKA-12) for research on plant breeding and plant protection.
Authors contributions
Á.E. and S.K. designed and performed the experiments and analyzed data. Á.E., A.G., J.F. acquired funding.
All authors contributed to the writing of the manuscript and the final version was approved by all authors.
Figures 1A, 2A and 3 were created by Á.E. with the free drawing software Inkscape 1.0.2 (https://inkscape.org).
Competing interests
The authors declare no competing interests.
Additional information
Supplementary Information The online version contains supplementary material available at https://doi.org/
10.1038/s41598-021-92230-y.
Correspondence and requests for materials should be addressed to Á.E.
Reprints and permissions information is available at www.nature.com/reprints.
Publisher’s note Springer Nature remains neutral with regard to jurisdictional claims in published maps and
institutional affiliations.
Open Access This article is licensed under a Creative Commons Attribution 4.0 International
License, which permits use, sharing, adaptation, distribution and reproduction in any medium or
format, as long as you give appropriate credit to the original author(s) and the source, provide a link to the
Creative Commons licence, and indicate if changes were made. The images or other third party material in this
article are included in the article’s Creative Commons licence, unless indicated otherwise in a credit line to the
material. If material is not included in the article’s Creative Commons licence and your intended use is not
permitted by statutory regulation or exceeds the permitted use, you will need to obtain permission directly from
the copyright holder. To view a copy of this licence, visit http://creativecommons.org/licenses/by/4.0/.
© The Author(s) 2021
Scientific Reports | (2021) 11:12770 | https://doi.org/10.1038/s41598-021-92230-y 12
Vol:.(1234567890)You can also read