Leaching of inorganic and organic phosphorus and nitrogen in contrasting beech forest soils - seasonal patterns and effects of fertilization
←
→
Page content transcription
If your browser does not render page correctly, please read the page content below
Research article
Biogeosciences, 19, 1527–1546, 2022
https://doi.org/10.5194/bg-19-1527-2022
© Author(s) 2022. This work is distributed under
the Creative Commons Attribution 4.0 License.

Leaching of inorganic and organic phosphorus
and nitrogen in contrasting beech forest soils –
seasonal patterns and effects of fertilization
Jasmin Fetzer1,2 , Emmanuel Frossard2 , Klaus Kaiser3 , and Frank Hagedorn1
1 Forest Soils and Biogeochemistry, Swiss Federal Institute for Forest,
Snow and Landscape Research WSL, Birmensdorf, Switzerland
2 Department of Environmental Systems Science, ETH Zurich, Zürich, Switzerland
3 Soil Science and Soil Protection, Martin Luther University Halle-Wittenberg, Halle (Saale), Germany

Correspondence: Jasmin Fetzer (jasmin.fetzer@wsl.ch)

Received: 20 July 2021 – Discussion started: 4 August 2021
Revised: 26 January 2022 – Accepted: 27 January 2022 – Published: 17 March 2022

Abstract. Leaching is one major pathway of phosphorus              of DIN and DON from the Oe/Oa horizons increased upon
(P) and nitrogen (N) losses from forest ecosystems. Using          +N and +N+P but not upon +P fertilization. In conclusion,
a full factorial N × P fertilization and irrigation experiment,    the estimated P fluxes from the A horizons were comparable
we investigated the leaching of dissolved organic and inor-        in magnitude to reported atmospheric P inputs, suggesting
ganic P (DOP and DIP) and N (DON and DIN) from or-                 that these systems do not deplete in P due to leaching. How-
ganic layers (litter, Oe/Oa horizons) and mineral A hori-          ever, a particularly high sensitivity of DIP leaching to hotter
zons at two European beech sites of contrasting P status.          and drier conditions suggests accelerated P losses under the
Leachates showed the highest DIP and DIN concentrations in         expected more extreme future climate conditions. Increases
summer and lowest in winter, while dissolved organic forms         in P leaching due to fertilization and drying–rewetting were
remained rather constant throughout seasons. During the dry        higher in the low-P system, implying that the low-P system
and hot summer of 2018, DOC : DOP and DOC : DON ra-                is more susceptible to environmental future changes.
tios in leachates were particularly narrow, suggesting a re-
lease of microbial P due to cell lysis by drying and rewet-
ting. This effect was stronger at the low-P site. The esti-
mated annual mean fluxes from the Oe/Oa horizons in the            1   Introduction
non-fertilized treatment were 60 and 30 mg m−2 yr−1 for dis-
solved total P and 730 and 650 mg m−2 yr−1 for dissolved to-       Leaching is one major pathway of phosphorus (P) and nitro-
tal N at the high-P and the low-P site, respectively. Fluxes of    gen (N) loss from forest ecosystems (e.g. Bol et al., 2016;
P were highest in the organic layers and decreased towards         Hedin et al., 1995). Leaching refers to water-flow-related
the A horizon likely due to sorption by minerals. Fertiliza-       transport of solutes within and from soil. Leaching losses
tion effects were additive at the high-P but antagonistic at the   are a result of the balance between mineralization, disso-
low-P site: at the high-P site, fertilization with +N, +P, and     lution, and desorption processes on one side and biological
+N+P increased total P fluxes from the Oe/Oa horizon by            uptake, as well as abiotic precipitation and sorption, on the
+33 %, +51 %, and +75 %, while the respective increases            other side. High water flow conditions may support leaching
were +198 %, +156 %, and +10 % at the low-P site. The              since transport becomes faster than the uptake of nutrients
positive N effect on DIP leaching possibly results from a re-      by roots and microorganisms and sorption (e.g. Backnäs et
moved N limitation of phosphatase activity at the low-P site.      al., 2012; Barrow, 1983). Phosphorus and N are leached in
Fluxes of DOP remained unaffected by fertilization. Fluxes         dissolved inorganic and organic forms, or sorbed to colloids,
                                                                   with concentrations and fluxes varying strongly among soils

Published by Copernicus Publications on behalf of the European Geosciences Union.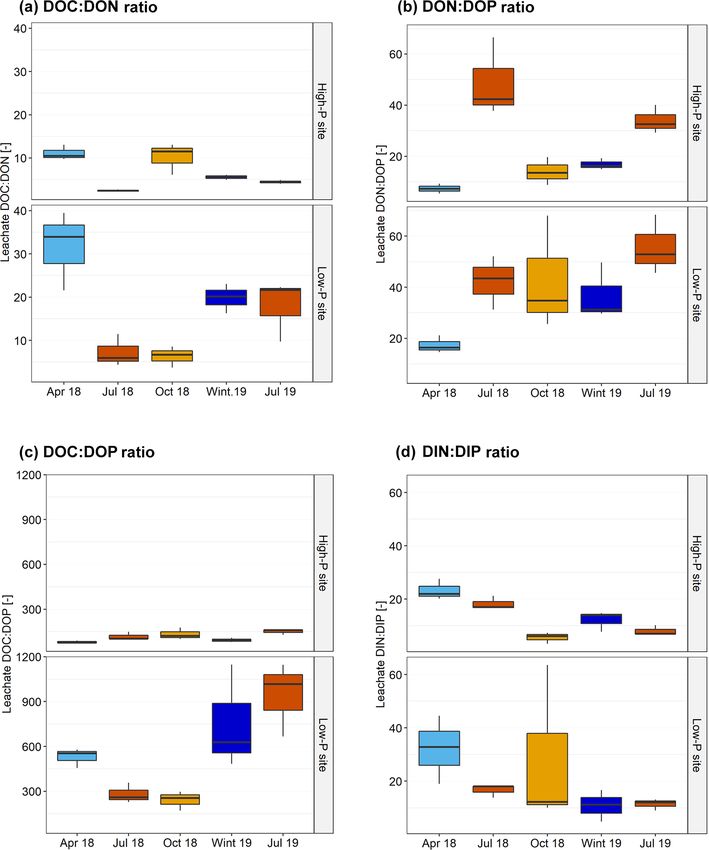
1528                                             J. Fetzer et al.: Leaching of inorganic and organic phosphorus and nitrogen

and ecosystem types (Bol et al., 2016; Kaiser et al., 2003;          main uncertain for P (e.g. Davies et al., 2016; Mooshammer
Qualls and Haines, 1991a). Dissolved organic N was found             et al., 2014). However, the concept of resource limitation has
to dominate the N losses from unpolluted ecosystems (Per-            shifted from an earlier paradigm of single-resource limita-
akis and Hedin, 2001, 2002), while inorganic N dominates in          tion (e.g. van der Ploeg et al., 1999) towards co-limitation
leachates from most temperate forest ecosystems receiving            by multiple resources (e.g. Harpole et al., 2011). Synergistic
high atmospheric N deposition (Hagedorn et al., 2001). Sub-          interactions between N and P have frequently been observed
stantially less is known about P leaching (Bol et al., 2016;         in aquatic and terrestrial ecosystems (Elser et al., 2007) but
Hannapel et al., 1964a, b), but the importance of organic            have not – to our knowledge – been studied in field studies
forms for leaching may be even greater for P than for N              on nutrient leaching in temperate forest ecosystems. Rising
(Qualls, 2000; Qualls and Haines, 1991a). Inorganic P forms          atmospheric CO2 , N, and P depositions may induce imbal-
strongly bind to or become incorporated into secondary min-          ances between C, N, and P, impacting the C : N : P ratio of
erals (e.g. Walker and Syers, 1976) or can be taken up by            SOM and hence the cycling and leaching of P and N (Fröberg
roots and microorganisms. Thus, concentrations of inorganic          et al., 2013; Mortensen et al., 1998; Peñuelas et al., 2013; Vo-
P in soil solutions are usually low even in soils where high         gel et al., 2021; Wang et al., 2014).
amounts of soil organic matter are mineralized (Bol et al.,             While several studies addressed these potential biotic and
2016; Kaiser et al., 2000; Qualls and Haines, 1991a). Some           abiotic factors individually, none has examined simultaneous
organic P compounds sorb less strongly on mineral surfaces           effects under field conditions. Here, we studied the leach-
than inorganic P (Anderson and Magdoff, 2005; Berg and Jo-           ing of dissolved organic and inorganic P and N in temper-
ern, 2006; Celi et al., 2003; Lilienfein et al., 2004), and it has   ate beech forest soils as affected by seasons, nutrient status,
been suggested that the most P-rich fractions of dissolved or-       and fertilization. For that, we used zero-tension lysimeters in
ganic matter (DOM) are more mobile than the rest (Frossard           three soil horizons that were artificially irrigated to standard-
et al., 1989; Kaiser et al., 2000, 2001; Qualls, 2000; Qualls        ize water flow. To cover different nutrient statuses, we took
and Haines, 1991a). Accordingly, much of the P in soil so-           advantage of two sites of contrasting nutrient availability (a
lution has been found in organic form (Hedin et al., 2003;           low-P sandy soil with low sorption capacities and a high-P
Kaiser et al., 2000, 2003; Qualls, 2000; Qualls and Haines,          loamy soil on basalt with high sorption capacities) that were
1991b), and it might lead to long-term P depletion of soils          subjected to a full factorial N × P fertilization experiment.
(Alvarez-Cobelas et al., 2009; Frossard et al., 1989; Hedin et       To cover seasonal differences, we sampled leachates and soil
al., 2003).                                                          solutions five times during 18 months.
   As outlined above, leaching is the net result of the inter-          With this study we aimed to quantify annual organic and
play of biotic and abiotic processes: models of C–N–P cy-            inorganic P and N fluxes from organic layers and from the
cles assume that microbial activity is driven by temperature,        mineral topsoil. We primarily focused on P fluxes since the
moisture, and organic matter bioavailability being key de-           leaching of N has been extensively studied before. We hy-
terminants for nutrient mineralization in soil (Colman and           pothesized the following. (i) Leaching of dissolved inorganic
Schimel, 2013; Davies et al., 2016; Yu et al., 2020). Be-            P (DIP) and N (DIN) from organic forest floor layers will
sides seasonal variation (Kaiser et al., 2003; Kalbitz et al.,       show stronger seasonal variations and stronger fertilization
2000; Michalzik et al., 2001), extreme changes in temper-            effects than dissolved organic P (DOP) and N (DON) as in-
atures by freeze–thaw cycles or in the precipitation regime          organic forms are more strongly controlled by mineralization
were found to increase nutrient release (e.g. Gao et al., 2020,      and biotic uptake; in the mineral soil, seasonal and fertiliza-
2021). Drying–rewetting effects can trigger release pulses of        tion effects on leaching will be superimposed by sorption
nutrients (Birch, 1958) that are then prone to leaching (Achat       processes. (ii) The contribution of dissolved organic forms
et al., 2012; Blackwell et al., 2010; Borken and Matzner,            to total P and N leaching from organic layers will be greater
2009; Brödlin et al., 2019b; Dinh et al., 2017, 2016). Cli-          at the low-P site due to stronger biotic uptake of inorganic
matic warming and the increasing frequency and severity of           nutrients. (iii) Fertilization with N and P removes nutrient
droughts influence soil organic matter (SOM) dynamics and            limitations and thus will enhance P and N leaching, with ef-
the associated release and leaching of P and N (e.g. Gao et          fect sizes depending on the site due to differences in nutrient
al., 2020).                                                          status and mineral assemblage; effect sizes will also differ
   In addition, the nutritional status of soils, defined by par-     between P and N due to differences in sorption and uptake
ent material, climatic conditions, and atmospheric input (Au-        affinities of the two nutrients. (iv) We expect synergistic ef-
gusto et al., 2017), exerts strong influence on nutrient release     fects of the combined N and P fertilization since N addition
(Mooshammer et al., 2014). The C : N : P stoichiometry of            will remove N limitation for biologically mediated P mobi-
SOM has been identified as a key parameter: while critical           lization processes.
C-to-nutrient ratios – above which nutrients that are mineral-
ized during decomposition become immobilized by soil mi-
croorganisms and below which they are released in excess
of biological demand – are well established for N, they re-

Biogeosciences, 19, 1527–1546, 2022                                                     https://doi.org/10.5194/bg-19-1527-2022
J. Fetzer et al.: Leaching of inorganic and organic phosphorus and nitrogen                                                    1529

2     Material and methods                                          Zero-tension (or gravity) lysimeters mainly sample macro-
                                                                    pore flow during rain events and when the soil is draining
2.1     Study site description                                      to field capacity (Litaor, 1988), and, therefore, they provide
                                                                    a sample of soil solution exported from the respective soil
The study was conducted in two mature beech forest stands           horizon. The two uppermost lysimeters were 20 cm × 20 cm
in Germany with contrasting parent material and P availabil-        acrylic glass plates with a mesh and three holes ensuring con-
ity. The stands are dominated by 120–140 year old Fagus             tact with the soil underneath. The third lysimeter in the min-
sylvatica (Lang et al., 2017). The soil with high P stock (Ta-      eral A horizon was a 19.5 cm × 25.5 cm pod with a 3.3 cm
ble 4) is a loamy Cambisol developed on basalt at Bad Brück-        high rim that was filled with three layers of acid-washed
enau (BBR; 809 m a.s.l.; 50.35◦ N, 9.27◦ E; mean annual pre-        quartz sand of different grain sizes to ensure a hydrologi-
cipitation: 1021 mm; referred to as “high-P site”) and a mull-      cal continuum with the mineral soil, having a design similar
like moder organic forest floor layer (Lang et al., 2017). The      to those used and described in greater detail by Makowski
soil with the lower P stock is a sandy Cambisol, featuring          et al. (2020b). The lysimeters at the three depths were in-
a thicker organic layer and initial podzolization at Unterlüss      stalled adjacent to each other. They were slightly inclined
(LUE; 115 m a.s.l.; 52.8◦ N, 10.3◦ E; mean annual precipi-          and connected to polyethylene (PE) bottles. Following instal-
tation: 779 mm; referred to as “low-P site”) that developed         lation, the plots were left to recover from disturbance for five
from glacial till. The organic forest floor layer is a mor-like     months. For more details see Fetzer et al. (2021) and Sect. S2
moder (Lang et al., 2017). The organic and A horizons of            in the Supplement.
the sites have greater C : P ratios at the low-P site but similar
C : N ratios (Table 1, Sects. S1 and S8 in the Supplement).
The differing P status is also mirrored by leaf P, being higher     2.2.3   Artificial irrigation and sampling
at the high-P site with 0.71 ± 0.02 g P kgleaves −1 compared
to 0.58 ± 0.2 g P kgleaves −1 at the low-P site. Compared to the    To measure solute leaching under standardized conditions
low-P site, the high-P site is characterized by a slightly higher   with little storage time, an area of 1 m2 above the installed
pH (3.2 vs. 3.0), higher cation exchange capacity (371 vs.          lysimeters at each plot was irrigated in April 2018, July 2018,
108 meq kg−1 ), and higher proportion of aluminum and iron          October 2018, February–March 2019, and July 2019. The ir-
oxides (29.3 and 8.4 vs. 0.9 and 0.3 g kg−1 in the A horizon;       rigation water was P- and N-free artificial rainwater match-
Lang et al., 2017; Sect. S1). More details on the two sites are     ing the pH (5.5) and electrical conductivity (25 µS cm−1 ) of
reported in Lang et al. (2017).                                     the average local throughfall of both sites. The artificial rain-
                                                                    water was applied at a constant rate of 20 L h−1 m−2 using an
2.2     Experimental setup and in situ measurements
                                                                    Accu-Power sprayer (Birchmeier Sprühtechnik AG, Switzer-
                                                                    land). This volume corresponds to 71 % and 61 % of the pore
2.2.1    Fertilization
                                                                    volume above the lysimeter in the mineral soil at the low-
At each site, plots of 20 m×20 m were established with 20 m         P and the high-P site, respectively. Soil solutions were col-
space in between. The plots were fertilized with either +N,         lected over a period of 1.5 h from the start of the irrigation.
+P, or +N+P, plus unfertilized control plots. They were repli-      The collection represents the “first flush” exporting the ma-
cated three times and arranged in blocks, resulting in a to-        jority of P leached during rainfall events (Bol et al., 2016;
tal of 12 plots per site (details on experimental setup are         Makowski et al., 2020a; Rinderer et al., 2021). The applica-
given in, for example, Hauenstein et al., 2020). A total of         tion rate represents maximum rainfall intensities at the study
5.0 g P m−2 was applied as KH2 PO4 in a single dose in 2016         sites. Rainfall intensities larger than 20 L h−1 m−2 have been
(0.6 % and 3.0 % of total P stock at the high-P and the low-        observed once at the low-P site and three times at the high-
P site; Table 5). This amount accounts for 0.6 % and 3 % of         P site during the last 10 years (Bayerische Landesanstalt
the total P stock within the top 1 m of soil plus forest floor      für Wald und Forstwirtschaft (LWF) and Nordwestdeutsche
at both sites (Table 5). To compensate for the K input to the       Forstliche Versuchsanstalt (NW-FVA)). The amount of wa-
P fertilized plots, 6.3 g m−2 was applied as KCl at the N-          ter added with irrigation corresponds to the average weekly
fertilized and control plots. Nitrogen was added as NH4 NO3         precipitation at the high-P site and exceeds it by 33 % at the
in five equal doses from 2016 to 2018, amounting to a total         low-P site. In 2018, the three irrigations, totaling 60 L m−2 ,
of 15 g N m−2 (1.2 % and 2.1 % of total N stock at the high-P       accounted for approx. 8 % of measured throughfall at the
and the low-P site; Table 6).                                       high-P site and 16 % at the low-P site (see Table 2). The two
                                                                    irrigations in 2019 added 40 L m−2 . Overall, leachates were
2.2.2    Zero-tension lysimeters                                    collected on five dates, at two sites, at three soil depths, and
                                                                    at four fertilization treatments applied in three blocks, result-
Zero-tension lysimeters were installed beneath the litter           ing in 360 samples. Leachates were collected in PE bottles,
layer, the fermented and/or humified horizon (Oe/Oa), and           stored in cooling boxes, and transported within 24 to 48 h to
the mineral topsoil (A) in November 2017 at both study sites.       the laboratory. Samples were filtered through 0.45 µm nitro-

https://doi.org/10.5194/bg-19-1527-2022                                                    Biogeosciences, 19, 1527–1546, 2022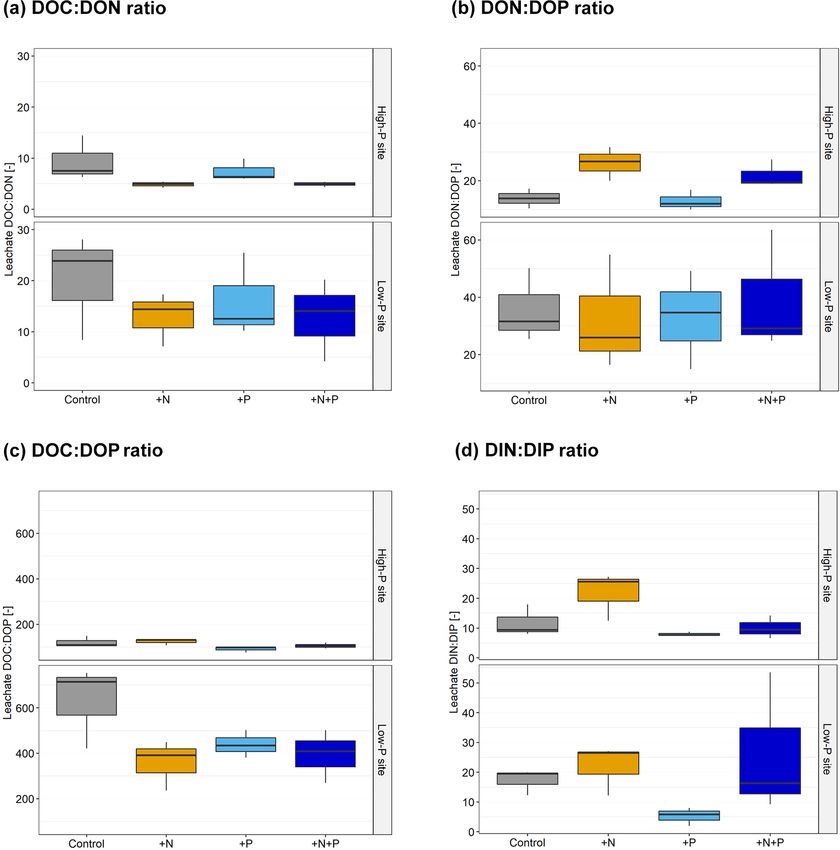
1530                                                         J. Fetzer et al.: Leaching of inorganic and organic phosphorus and nitrogen

Table 1. Soil organic carbon (SOC), total soil nitrogen (N), and total soil phosphorus (P) concentrations in litter, Oe/Oa, and A horizons from
the control treatment (unfertilized) at the high-P and the low-P site. Samples were taken in July 2019; values represent means ± standard
error of three field replicates.

           Site              Horizon          Horizon                SOC        Total soil N         Total soil P               Resin-          Total organic
                                            thicknessa                                                                  extractable Pb             P fraction
                                                  (cm)        (g C kg−1 )        (g N kg−1 )           (g P kg−1 )          (g P kg−1 )        (% of total Pc )
           High-P site       Litter                     2      451 (±1)             17 (±0)        0.96 (±0.08)                   NA                   67 (±7)
           High-P site       Oe/Oa                    2.5     352 (±17)          19 (±0.3)          2.3 (±0.32)         0.145 (±0.02)                  81 (±2)
           High-P site       A                          5     178 (±20)          12 (±1.3)         3.02 (±0.28)         0.039 (±0.01)                  85 (±3)
           Low-P site        Litter                   4.5      391 (±9)          14 (±0.3)         0.79 (±0.08)                   NA                   70 (±1)
           Low-P site        Oe/Oa                      6     230 (±25)          11 (±1.5)         0.53 (±0.08)         0.095 (±0.01)                  81 (±4)
           Low-P site        A                          5      70 (±14)          3.4 (±0.7)        0.17 (±0.02)            0.005 (±0)                  85 (±2)
         a Average horizon thickness above installed lysimeters (n = 12). b Measured by Maja Siegenthaler on air-dried material, sampled in September 2018 from
         the same sites. c Total organic P determined based on Saunders and Williams (1955) and related to total P determined in H2 SO4 extracts. NA: not available.

cellulose filters (GVS Life Sciences, Zola Predosa, Italy) and                            length dispersive X-ray fluorescence spectroscopy (S8 Tiger
stored at 4 ◦ C prior to analysis.                                                        Series 2, Bruker AXS, Karlsruhe, Germany). Phosphorus
   To quantify annual natural water and solute flux, we ad-                               extraction with resin (PResin ) (Hedley et al., 1982; Moir
ditionally collected leachate draining into the lysimeters be-                            and Tiessen, 2007) was carried out using samples taken
tween samplings using polyethylene canisters. To keep evap-                               in autumn 2018 at 1 : 30 soil : solution ratio, followed by
oration minimal, the sampling containers were placed in a                                 colorimetric phosphate determination (UV-1800, Shimadzu,
covered soil pit. Their water volume was determined gravi-                                Canby, USA) with the malachite green method of Ohno and
metrically.                                                                               Zibilske (1991). Total organic P and H2 SO4 extractable to-
                                                                                          tal P were determined with the ignition method (Saunders
2.3    Leachate analysis                                                                  and Williams, 1955). Two subsamples of 0.5 g of dried and
                                                                                          < 2 mm sieved soil were taken, one of them being ignited
Dissolved inorganic P was estimated spectrophotometri-                                    (550 ◦ C, 2 h). Ignited and unignited soils were extracted with
cally as molybdate-reactive P (MRP) using the molybdate-                                  25 mL of 0.5 M H2 SO4 for 16 h and subsequently filtered.
ascorbic acid method (Murphy and Riley, 1962) and a                                       In both extracts inorganic P was determined with the mala-
flow injection analyzer (Scan+, Skalar, Breda, The Nether-                                chite green method (Ohno and Zibilske, 1991). Organic P
lands). Dissolved total P (DTP) concentrations in leachates                               was calculated as the difference between the inorganic P in
were measured by inductive coupled plasma optical emis-                                   the ignited and unignited samples.
sion spectroscopy (ICP-OES; ULTIMA 2, Horiba Jobin-
Yvon, Longjumeau, France). Dissolved organic P was cal-                                   2.5     Soil microclimatic measurements
culated as the difference between DTP and DIP. Concen-
trations of dissolved organic carbon (DOC) and total nitro-                               Soil temperature and soil moisture sensors were installed in
gen (TN) were measured with a FormacsHT/TN analyzer                                       April 2018 and remained in place throughout the experimen-
(Skalar). Dissolved nitrate concentrations were measured by                               tal duration. Soil temperature (5 cm depth) was recorded by
ion chromatography (ICS 3000, Dionex, Sunnyvale, CA,                                      buried iButtons (iButton DS1922L-F5, Maxim Integrated,
USA) and dissolved ammonium concentrations with a FIAS                                    USA) installed at 9 out of 12 plots at 5 cm depth in the min-
300 (PerkinElmer, Waltham, MA, USA). Electrical conduc-                                   eral soil at both sites. In the same plots, moisture was mea-
tivity was measured with a LF 325 probe (WTW, Weilheim,                                   sured in the mineral soil at a depth of 5 cm with three EC-5
Germany) and pH with a LL ecotrode (Metrohm, Herisau,                                     soil moisture sensors per plot (Decagon Devices Inc., Pull-
Switzerland).                                                                             man, WA, USA, validated with gravimetrically measured soil
                                                                                          moisture).
2.4    Soil samples
                                                                                          2.6     Data analysis and statistics
Soil samples of each plot and horizon were taken in July
2019 (2 sites × 12 plots × 3 horizons, total n = 72).                                     2.6.1     Artificial irrigation and sampling
The material was freeze-dried and ground with a ball mill.
The concentrations of N and C were measured using an                                      For annual concentration averages, the four seasons were
automated elemental analyzer (Euro EA3000: Euro Vec-                                      weighed equally, meaning that for the summer concentration
tor, Pavia, Italy). Fused beads of sample aliquots ashed at                               values from summer 2018 and summer 2019 were averaged.
1000 ◦ C were used to determine total P by sequential wave-                               Annual element fluxes (July 2018 to July 2019), being the

Biogeosciences, 19, 1527–1546, 2022                                                                                https://doi.org/10.5194/bg-19-1527-2022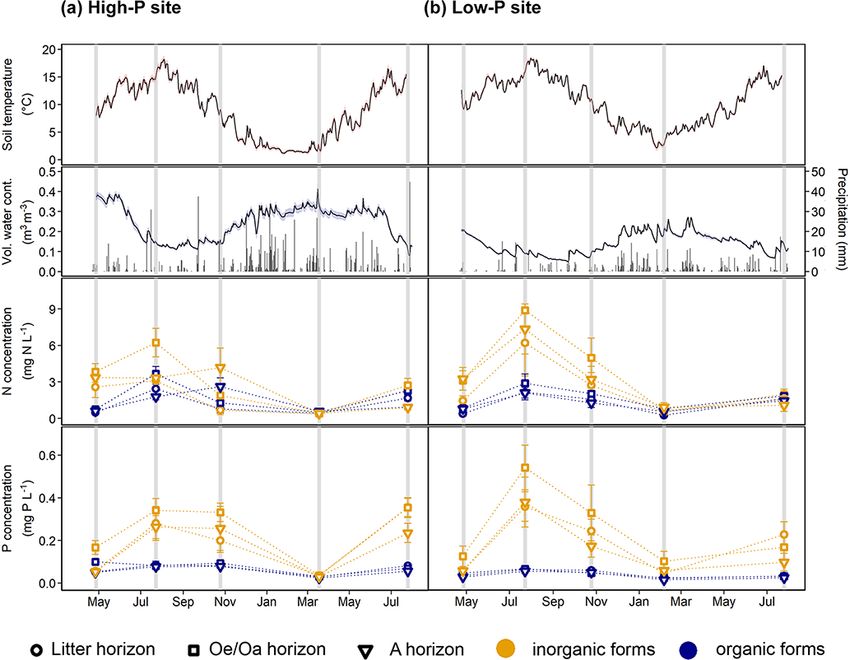
J. Fetzer et al.: Leaching of inorganic and organic phosphorus and nitrogen                                                                            1531

Table 2. Annual water fluxes measured by zero-tension lysimeters below the litter horizon, the Oe/Oa horizon, and the A horizon at the
high-P site and the low-P site from July 2018 to July 2019. For comparison, the modeled fluxes from the same sites (both ICP Forest level II
sites) are presented. Details are in Sect. S7 in the Supplement.

                  Site                                                 Specification                                          Annual water flux
                  (time period: 24 July 2018–24 July 2019)                                                                       (L m−2 yr−1 )
                  High-P site – ICP Forest sited                       Measured throughfall                                                     722
                  High-P siteb                                         Litter                                                                   525
                  High-P siteb                                         Oe/Oa horizon                                                            507
                  High-P siteb                                         A horizon                                                                411
                  High-P site – ICP Forest sitea,d                     Vertical matrix flow modeled avg. 5–6 cm                                 583
                  High-P site – ICP Forest sitea,d                     Vertical matrix flow modeled avg. 1–5 cm                                 553
                  High-P site – ICP Forest sitea,d                     Vertical matrix flow modeled −5 cm                                       489
                  Low-P site – ICP Forest sited                        Measured throughfall                                                    364
                  Low-P siteb                                          Litter                                                                  244
                  Low-P siteb                                          Oe/Oa horizon                                                           239
                  Low-P siteb                                          A horizon                                                               210
                  Low-P site – ICP Forest sitea,d                      Vertical water flow modeled at 0 m                                     249c
                  Low-P site – ICP Forest sitea,d                      Vertical water flow modeled at 0.2 m                                   233c
              a Modeled with LWF-Brook90R model. b Includes average volume of artificial irrigation. c Time period: modeled only until 14 July 2019.
              d Data source: personal communication. Northwest German Forest Research Institute (NW-FVA) and Bayrische Landesanstalt für Wald und
              Forstwirtschaft (LWF).

mass transfer per area unit from one compartment into the                            Sect. S3). Nutrient concentrations were interpolated accord-
next (mg m−2 yr−1 ), were estimated as the sum of daily wa-                          ing to Eq. (3).
ter volume (L m−2 ) multiplied with their nutrient concentra-                                     R2
tion (mg L−1 , interpolated from the point measurements). To                         R1 =           T 2−T 1
                                                                                                              ,                                         (3)
obtain continuous concentration data, the exponential rela-                                   Q10      10

tionship with soil temperature was used, expressed as Q10                            where R1 (mg L−1 ) is the predicted daily nutrient concentra-
values. The Q10 value is a measure of temperature sensi-                             tion in the leachate, T2 (◦ C) and R2 (mg L−1 ) are temperature
tivity that is exponential and based on biological, chemical,                        and nutrient concentration measured at the sampling event,
or physicals reaction rates. Q10 values were calculated from                         T1 (◦ C) is the daily measured soil temperature, and Q10 is the
the concentration data during the five irrigation events and                         estimated temperature dependency. Interpolation was done
the soil temperature delta between the samplings using non-                          for each of the five samplings and then averaged. Predicted
linear regression. Results showed that Q10 values averaged                           values for dissolved total N (DTN) and DTP differed on av-
to 4.3 and 3.2 for DIP and DIN and 1.8 and 3.2 for DOP and                           erage less than 50 % from measured concentrations (Sect. S4
DON, respectively (Sect. S3 in the Supplement). Out of 360                           in the Supplement).
possible sampled leachates, 12 were missing due to natural                              Daily water flux was interpolated from daily rainfall mea-
disturbances, such as damage to lysimeters by wild boars or                          surements, assuming that daily water volume from the zero-
mice. For calculation of annual fluxes, data of the missing                          tension lysimeters was directly proportional to daily rain-
12 samples were extrapolated from the other two field repli-                         fall quantity (for water yields see Table 2). Measured wa-
cates, considering the ratio between the replicates during the                       ter fluxes were compared with throughfall records and with
other samplings. For the interpolation of concentration data,                        water fluxes modeled using BROOK90R within the Interna-
first, the fitting parameters β0 and β1 were obtained accord-                        tional Co-operative Programme on Assessment and Monitor-
ing to Eq. (1), where T (◦ C) is the soil temperature at 5 cm                        ing of Air Pollution Effects on Forests (ICP Forests; Table 2).
depth.                                                                               As the plots received an artificial irrigation solution lacking
y = β0 e(β1 T )                                                            (1)       N and P and, therefore, direct inputs from throughfall were
                                                                                     excluded, the fluxes represent rather conservative estimates
Second, Q10 values were calculated based on β1 according                             as compared to standard soil solution monitoring.
to Eq. (2) (Guelland et al., 2013).
Q10 = e10β1                                                                (2)       2.6.2      Calculation of balances and stocks

This was done for each soil depth at each site inde-                                 Balances were calculated for the Oe/Oa horizon and the A
pendently (Q10 values and coefficient of determination in                            horizon as the difference between input (influx from the hori-

https://doi.org/10.5194/bg-19-1527-2022                                                                             Biogeosciences, 19, 1527–1546, 2022
1532 J. Fetzer et al.: Leaching of inorganic and organic phosphorus and nitrogen
zon above) and the output (export flux to the horizon be- 3.2 Patterns of dissolved carbon, nitrogen, and
neath). phosphorus in leachates
Stocks were calculated by multiplying soil nutrient con-
centrations with fine earth densities. Nutrient concentrations Dissolved total P concentrations in leachates differed signif-
were measured on soil samples taken in July 2019. Soil den- icantly between horizons (pHorizon < 0.01; Sect. S5 in the
sities in the mineral horizon were determined with a core cut- Supplement), with the highest concentrations in leachates
ter of 1 L volume, and soil densities from the organic layers from the Oe/Oa horizons. Despite strongly differing to-
were taken from Lang et al. (2017). tal soil P (Table 1), there was no statistical difference in
DTP concentration between the two sites in any of the hori-
2.6.3 Statistical analysis with linear mixed-effect zons (pSite = n.s., not significant). Concentrations of DTP in
models leachates varied strongly by season (pSeason < 0.01; Fig. 1),
being highest in summer (control means of Oe/Oa horizon:
We assessed treatment effects on element concentrations, 0.34 and 0.17 mg L−1 for the high-P and the low-P site) and
fluxes, and element ratios using linear mixed-effects mod- lowest in winter (control means of Oe/Oa horizon: 0.03 and
els with the lmer function from the lme4 package (Bates et 0.04 mg L−1 for the high-P and the low-P site). The increased
al., 2015). In the case of the unbalanced data set of concen- DTP concentrations in summer were mainly due to increased
trations, type 3 ANOVA was used; p values were obtained DIP concentrations, exceeding those in winter on average by
with the lmerTest package (Kuznetsova et al., 2017). Due to a factor of 20 at the high-P site and by a factor of 10 at the
non-normal distributed residuals, all tested parameters were low-P site. Concentrations of DOP increased from winter to
log-transformed for the statistical analysis. According to the summer on average only by a factor of 2.5 at both sites. Av-
experimental design, we included site, +N, +P, season, and eraged across sites, DOP constituted 49 % of DTP in spring
soil horizon with an interaction between site, +N, and +P, as and winter and 26 % of DTP in summer and fall. Overall, the
well as an interaction between horizon and sampling event contribution of DOP to DTP was higher at the high-P than at
as fixed effects. Blocks (level of replication, n = 3) and plots the low-P site (pSite = 0.01).
(fertilized squares) were used as random effects. For all sta- Dissolved total N (DTN) concentrations varied between
tistical analyses, fixed effects were considered significant at horizons (pHorizon < 0.01) but not between sites (pSite = n.s.
p < 0.05; p values between 0.05 and 0.1 were considered for all horizons). The highest concentrations occurred in
as marginally significant. Error estimates and error bars are leachates from the Oe/Oa horizons. As for DTP, DTN con-
standard errors of the means. All analyses were carried out centrations showed strong seasonal differences (pSeason <
using R version 3.6.3 (R Core Team, 2020). 0.01; Fig. 1), with the highest values in summer (control
means of Oe/Oa horizon: 5.0 and 3.0 mg L−1 for the high-
3 Results P and the low-P site) and lowest values in winter (control
means of Oe/Oa horizon: 0.5 and 1.0 mg L−1 for the high-
3.1 Soil temperature and moisture P and the low-P site). This pattern persisted for all N forms
(pSeason < 0.01), with DIN showing stronger seasonal vari-
The two study years, 2018 and 2019, were exceptionally ations than DON. While DIN concentrations were 9.5 and
dry and warm. In 2018, annual precipitation amounted to 3.5 times higher in summer than in winter at the high-P and
772 mm at the high-P site and 463 mm at the low-P site, the low-P site, respectively, DON concentrations increased
which corresponded to only 68 % and 60 % of the long-term from winter to summer by a factor of 3.8 at the high-P site
mean annual precipitation. This was even more pronounced and 3.4 at the low-P site.
for the period May to October, receiving only 50 % and 40 % Concentrations of DOC differed strongly between the two
of the long-term average at the high-P and the low-P site, re- sites (pSite < 0.01; Sect. S6 in the Supplement). They in-
spectively. Accordingly, volumetric water contents reached creased from the litter to the A horizon at the high-P site
values below 10 % in both summers (Fig. 1). Maximum soil (pHorizon < 0.01). At the low-P site, the highest concentra-
temperatures in summer were 18 ◦ C at both sites (Fig. 1). In tions occurred in leachates from the Oe/Oa horizon. When
winter, the high-P site experienced longer periods with soil averaged, DOC concentrations were twice as high at the low-
temperatures around 2 ◦ C. At the low-P site, winter soil tem- P site than at the high-P site (pSite < 0.01). The concentra-
peratures dropped that low only for a few days and were gen- tions varied strongly by season (pSeason < 0.01), and patterns
erally higher than at the high-P site. From July 2018 to July differed between sites and horizons (pSeason:Horizon < 0.01).
2019, the average soil temperature was 9.8 ◦ C at the low-P At the low-P site, DOC concentrations in leachates from the
site and 7.9 ◦ C at the high-P site (Fig. 1). There was a sta- Oe/Oa horizons of the control plots were highest in spring
tistically significant negative linear relationship between soil (24.8 mg L−1 ) and lowest in autumn (10.3 mg L−1 ). At the
temperature and soil moisture at the low-P site (R 2 = 0.61, high-P site, the DOC concentrations in leachates from the
p < 0.01) and at the high-P site (R 2 = 0.28, p < 0.01). Oe/Oa horizons of the control plots were highest in autumn
(13.3 mg L−1 ) and lowest in winter (1.7 mg L−1 ).
Biogeosciences, 19, 1527–1546, 2022 https://doi.org/10.5194/bg-19-1527-2022J. Fetzer et al.: Leaching of inorganic and organic phosphorus and nitrogen 1533
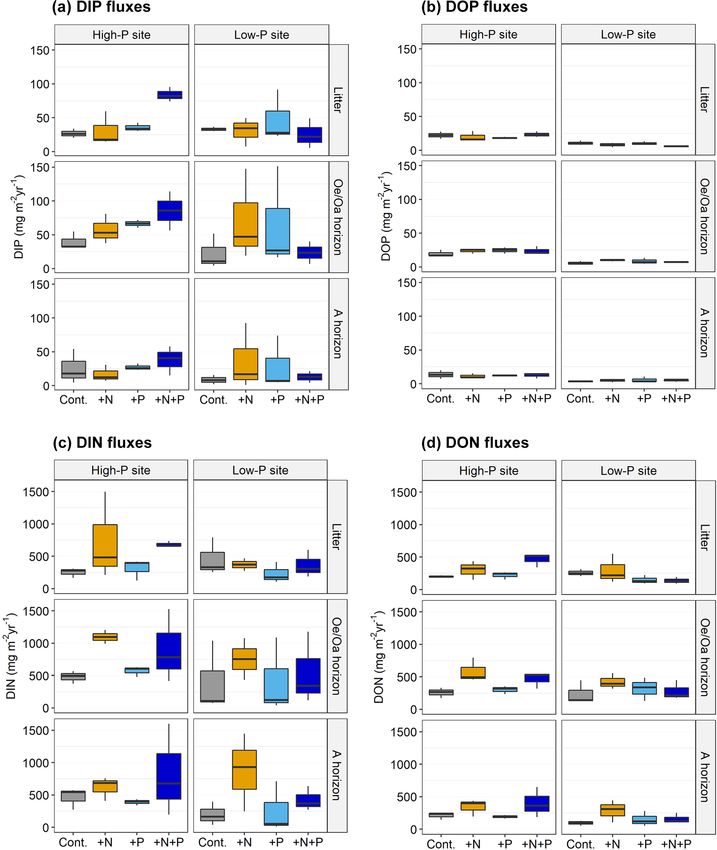
Figure 1. Soil temperature, soil moisture, and concentration of inorganic and organic nitrogen (N) and phosphorus (P) form during the
experimental duration at the high-P site (a) and the low-P site (b). Row 1 and 2: soil temperature and volumetric water content measured at
5 cm in the A horizon during the sampling period. Row 3 and 4: organic and inorganic N and P concentrations in leachates from litter, the
Oe/Oa horizon, and A horizon for each site and horizon (including fertilization treatments, n = 12), at five samplings at the two sites. Error
bars are standard error. Data for dissolved organic carbon can be found in Sect. S6.
3.3 Solute concentrations as related to temperature 3.4 Annual fluxes of water and solutes
and moisture
Annual measured vertical water fluxes, averaged over all
The seasonal variations of solute leaching were mirrored by horizons, amounted to 480 L m−2 yr−1 at the high-P site and
positive relationships of mean DIP, DOP, NH4 + , NO3 − , and 230 L m−2 yr−1 at the low-P site, corresponding to 57 %–
DON concentrations with soil temperature (Sect. S3), be- 73 % of measured throughfall. They decreased slightly with
ing stronger for P than for the N and for inorganic than soil depth (Table 2). Modeling of water fluxes using LWF-
for organic forms (higher Q10 values for inorganic N and P Brook90 (done by the Northwest German Forest Research
forms and higher Q10 values for DTP than DTN; Sect. S3). Institute (NW-FVA) and Bayrische Landesanstalt für Wald
The temperature–concentration relationships were better re- und Forstwirtschaft (LWF)) gave similar estimates, differing
flected by exponential than linear models (higher R 2 ). Mean from the measured water fluxes by 4 to 79 L m−2 yr−1 (+2 %
concentrations were negatively correlated with soil moisture, to +19 % of measured flux) at different depths at the low-P
especially for DON and DIP. Relations were less strong to and the high-P site, respectively (Table 2).
moisture than to soil temperature. The annual DTP fluxes in the control plots from all hori-
zons ranged between 12 and 60 mg m−2 yr−1 . They were
similar at both sites (pSite = n.s. for all horizons), with the
lowest values in the A horizons (pHorizon < 0.01). The A
horizons at both sited were P sinks as the balances (the dif-
https://doi.org/10.5194/bg-19-1527-2022 Biogeosciences, 19, 1527–1546, 20221534 J. Fetzer et al.: Leaching of inorganic and organic phosphorus and nitrogen
ference between the fluxes into and out of a given horizons) 3.5 Stoichiometry of inorganic and organic nitrogen
were positive (Table 3). At the high-P site, the Oe/Oa hori- and phosphorus leaching
zon was a source for P, exhibiting a negative balance, while
at the low-P site the Oe/Oa horizon was a P sink (Table 3). Ratios of DTN : DTP and DIN : DIP in leachates and soil
The DTP fluxes from the litter layer corresponded to 17 % of solutions increased with soil depth from litter to A horizon
the litter P stock at the high-P site and 9 % of litter P stock (pHorizon < 0.1 and pHorizon = 0.1). On average, ratios were
at the low-P site (Table 3). The portion of P stock leached greater at the low-P than at the high-P site (pSite = 0.09 and
decreased with soil depth. Fluxes of DTP from the A hori- 0.07). Concentrations of DOC and DOP correlated signifi-
zon represented 0.1 % of the horizon’s P stock at the high-P cantly, with stronger correlations at the high-P site than at
site and 0.2 % at the low-P site (Table 3). Annual DIP fluxes the low-P site. Ratios of DOC : DOP in control plots ranged
in the control plots did not differ between sites, whereas between 85 and 605 (Sect. S8). Mean DOC : DON ratios
DOP fluxes were higher at the high-P than at the low-P site ranged from 7 to 21 and mean DON : DOP ratios from 9
(pSite < 0.01). From the Oe/Oa horizon, mean DOP fluxes in to 37 (Sect. S8). The ratios were significantly higher at the
the control plots were 20 mg m−2 yr−1 at the high-P site and low-P than at the high-P site (pSite < 0.01), paralleling the
6 mg m−2 yr−1 at the low-P site. The contribution of DOP to C : N and C : P ratios in soil (Table 1). However, the corre-
DTP was more similar across sites, being on average 33 % at lations between ratios in leachates and soils were not sig-
the high-P site and 21 % at the low-P site. nificant (Sect. S9 in the Supplement). Stocks of PResin , as
Effects of fertilization on fluxes of DTP and DIP dif- a measure of available P, did only correlate with leached
fered among sites, with a comparable pattern for all hori- DIP in autumn (October 2018, R 2 = 28, p = 0.06) and win-
zons (pSite:N:P = 0.05 and 0.07; Fig. 2). At the low-P site, ter (February–March 2019, R 2 = 33, p = 0.03). All element
DTP leaching from the Oe/Oa horizon was increased by sep- ratios in leached DOM showed a pronounced seasonality
arate N and P additions (pP = 0.07; Oe/Oa horizon: +198 % (pSeason < 0.01) with smaller DOC : DON ratios and DOC :
and 156 % compared to leaching in the control plots) but not DOP ratios but higher DON : DOP ratios in summer and fall
when combined. At the high-P site, +N, +P, and +N+P fer- (Fig. 3). DIN : DIP ratios were highest in spring at both sites
tilization increased total P leaching (Oe/Oa horizon: +33 %, (Fig. 3).
+51 %, and +75 % compared to the control). However, only Nitrogen addition decreased DOC : DON ratios signifi-
the increase for the N × P treatment was statistically signif- cantly (pN < 0.01; Fig. 4) and increased the DON : DOP and
icant (pSite:N:P = 0.07). Fertilization did not affect DOP at DIN : DIP ratios (pN < 0.01). Fertilization with P had no ef-
either site or soil depth (pSite:N:P = n.s., Fig. 2). fect at the high-P site but caused decreases in DON : DOP
Fluxes of DTN in control plots ranged between 292 and DIN : DIP ratios at the low-P site (pSite:P = 0.04 and
and 734 mg m−2 yr−1 and were similar at the two sites pSite:N:P = 0.06).
(pSite = n.s. for all horizons) and differed between horizons
(pHorizon = 0.01). The high-P site had the smallest fluxes in
the litter layer, while at the low-P site the smallest fluxes 4 Discussion
occurred in the A horizon (Table 4). Since N-free rainwater
was applied, the fluxes basically reflect N release from soils. 4.1 Seasonal patterns
The average contribution of DON to DTN was 36 % at both
sites. There were differences between sites in distribution of In agreement with our hypothesis, DIP concentrations varied
NO3 − and NH4 + . At the high-P site, 20 % of DTN leached more strongly by season than DOP. Concentrations of DIP
was NH4 + and 44 % NO3 − . The contributions of NH4 + and represent the net result of release and retention processes,
NO3 − were each 30 % at the low-P site. Fertilization affected and thus, seasonal variations can be attributed to changes (i)
leaching at sites and horizons in a similar way: N addition in- in mineralization rates of SOM, (ii) in demand and uptake
creased the DTN leaching (pN < 0.01); P addition alone did by plants and microorganisms, (iii) in sorption kinetics, or
not affect leaching (pP = 0.40) (Fig. 2); N × P addition in- (vi) due to the rewetting, especially of dry soil during sum-
creased leaching at the high-P but not at the low-P site. mer. Demand and uptake of phosphate are greatest in sum-
Annual DOC fluxes in control plots ranged between 1.68 mer, and consequently the activity of phosphomonoesterases
and 3.40 g m−2 yr−1 (Sect. S6). They were higher at LUE and was found to be substantially higher in summer than in win-
highest in the Oe/Oa horizon (pSite = 0.02, pHorizon < 0.01) ter in the same soils (Fetzer et al., 2021). Also, desorption of
at both sites. Fertilization affected DOC fluxes at the sites phosphate increases with temperature and sudden rewetting
differently (pSite:N = 0.05). At the high-P site, DOC leaching of dry soil can cause desorption as well (Barrow, 1983), both
increased from all horizons upon N fertilization. At the low- potentially increasing DIP concentrations in summer. How-
P site, fertilization only affected the A horizon, where DOC ever, we assume that P from lysed microbial cells follow-
leaching was increased by all fertilization treatments (pN:P = ing drying–rewetting most strongly contributed to the sum-
0.11) on average by a factor of 1.6 compared to the control mer peak of P concentrations. In support, there was a strong
treatment. decline of DOC : DON ratios and DOC : DOP ratios from
Biogeosciences, 19, 1527–1546, 2022 https://doi.org/10.5194/bg-19-1527-2022J. Fetzer et al.: Leaching of inorganic and organic phosphorus and nitrogen 1535
Table 3. Comparison of dissolved organic, inorganic, and total phosphorus fluxes (DOP, DIP, DTP) from litter, Oe/Oa, and A horizons with
respective stocks (average of three field replicates taken in July 2019) of each horizon at the high-P site and the low-P site. Balances: the
difference between the fluxes into and out of a given horizon; positive values reflect net accumulations and negative values net losses. Data
from unfertilized plots (n = 3). Means ± standard error (SE). Data for dissolved organic carbon can be found in Sect. S6.
Site Horizon P stock of DTP flux of DIP flux of DOP flux of Annual DTP flux DTP
control control control control as percent of stock balance
(mg P m−2 ) (mg m−2 yr−1 ) (mg m−2 yr−1 ) (mg m−2 yr−1 ) (% yr−1 ) (mg P m−2 )
High-P Litter 290 49.7 (±4.6) 26.6 (±3.1) 22.1 (±2.4) 17
High-P Oe/Oa 4600 59.9 (±8.1) 39.5 (±6.2) 19.9 (±2.3) 1.3 −10.2
High-P A 60 500 39.2 (±14.5) 25.5 (±12.1) 13.6 (±3) 0.1 +20.7
Low-P Litter 630 43.4 (±2.1) 32.9 (±1.5) 10.5 (±1.5) 6.9
Low-P Oe/Oa 6350 28.2 (±13.2) 22.3 (±12) 5.8 (±1.3) 0.4 +15.2
Low-P A 6340 12.2 (±3.8) 8.7 (±3.3) 3.6 (±0.6) 0.2 +16.0
Table 4. Comparison of dissolved organic, inorganic, and total nitrogen fluxes (DON, DIN, DTN) from litter, Oe/Oa, and A horizons with
respective stocks (average of three field replicates taken in July 2019) of each horizon at the high-P site and the low-P site. Balances: the
difference between the fluxes into and out of a given horizon; positive values reflect net accumulations and negative values net losses. Data
from unfertilized plots (n = 3). Means ± standard error (SE). Data for dissolved organic carbon can be found in Sect. S6.
Site Horizon N stock of DTN flux of DIN flux of DON flux of Annual DTN flux DTN
control control control control as percent of stock balance
(mg N m−2 ) (mg m−2 yr−1 ) (mg m−2 yr−1 ) (mg m−2 yr−1 ) (% yr−1 ) (mg N m−2 )
High-P Litter 5110 449.1 (±41) 249.7 (±35.3) 201.0 (±7) 8.8
High-P Oe/Oa 38 900 733.8 (±81.8) 478.7 (±46.5) 257.4 (±36.8) 1.9 −285
High-P A 240 000 624.9 (±101.8) 462.3 (±78.6) 211.6 (±27.8) 0.3 +109
Low-P Litter 11 900 716.9 (±129.2) 458.5 (±137.1) 257.5 (±25.4) 6.0
Low-P Oe/Oa 141 000 652.9 (±340.4) 408.7 (±258.4) 238.3 (±84.6) 0.5 +63.9
Low-P A 128 000 292.4 (±104.2) 199.6 (±85.3) 93.7 (±17.8) 0.2 +361
spring to summer 2018, as well as a smaller summer peak dency. In agreement, DON also varied less by season than
of DIN than of DIP in forest floor leachates (Fig. 3). The DIN. We relate the low temperature effects to the canceling
decline in these element ratios mirror a higher share of mi- out of the production and mineralization of DOP and DON,
crobial metabolites in the leachates since released microbial which – as they are both microbial processes – are temper-
cytoplasm has very narrow C : N : P ratios of 12 : 3 : 1 at the ature sensitive. An analogous conclusion has been drawn in
same sites (Siegenthaler et al., 2021). The lysis of microbial soil warming studies in the laboratory and field, where leach-
cells leads to a pulse of N and P from microbial metabolites ing of DOC – correlating with DOP in our study – showed
(Gao et al., 2020; Schimel, 2018). In our study, the N and P less of a response to temperature than respiratory processes
summer peak was more pronounced at the low-P site, which (Gödde et al., 1996; Hagedorn et al., 2010; Müller et al.,
experienced a longer and stronger dry phase than the high- 2009).
P site and resulted in a drop of DOC : DON ratios from 28
in spring to ratios below 10 in summer. Artificial irrigation 4.2 Link of leaching rates to site properties
during the dry summer of 2018 with 20 mm h−1 could have
promoted the drying and rewetting effect by rapidly leaching We have expected that DTP fluxes would be higher in the
DIP and DOP, reducing the time for a biological uptake or high-P than in the low-P soil. In contrast to our hypothesis,
sorption. This effect was not observed in a microcosm study, there was no statistically significant difference in DTP fluxes
where soils of the same sites were subjected to drying and between the sites in all horizons. The surprisingly negligible
rewetting (Gerhard et al., 2021). However, in their study, the site effects could result from sorption that could have bal-
drying was only moderate, and the focus was laid on the min- anced out differences in the P release. Generally, phosphate
eral soil with lower SOM contents and hence less microbial can sorb to charged surfaces, which represents a dominant re-
biomass that can be released upon drying and rewetting. tention mechanism in mineral soils (Barrow, 1983; Berg and
In contrast to DIP, DOP shows similar concentrations Joern, 2006; Rechberger et al., 2021). Sorption seemed par-
throughout the year and hence a low temperature depen- ticularly strong in the mineral soil at the high-P site, which
had higher contents of clay and aluminum and iron oxides
https://doi.org/10.5194/bg-19-1527-2022 Biogeosciences, 19, 1527–1546, 20221536 J. Fetzer et al.: Leaching of inorganic and organic phosphorus and nitrogen Figure 2. Estimated annual fluxes of dissolved (a) inorganic and (b) organic phosphorus (DIP and DOP), as well as of dissolved (c) inorganic and (d) organic nitrogen (DIN and DON), from in the litter horizon, the Oe/Oa horizon, and the A horizon at the high-P site and the low-P site, as affected by N addition (+N), P addition (+P), and the combined N and P addition (+N+P), as compared to the control (Cont.). The annual flux was estimated for the time period July 2018 to July 2019. Data for dissolved organic carbon can be found in Sect. S6. that provide more sorptive mineral surfaces than the sandy mann, 1992; Rechberger et al., 2021). Here, phosphate com- low-P site with bleached quartz grains (Lang et al., 2017). petes for substantially smaller amounts of sorptive minerals The stronger sorption at the high-P site is supported by the than in the mineral soil, which is largely occupied by organic smaller proportion of the annual DTP flux compared to the matter (Rechberger et al., 2021). As a result, sorption in the P stock in the A horizon at the high-P site (Table 3). Sorp- organic horizons is less important than in mineral horizons. tion might also occur in the organic horizons, especially in Nevertheless, our assessment showed that the thick Oe/Oa the Oa horizons, as they can contain minerals due to aeolian horizon was a sink for P at the low-P site (Table 3), which deposition or bioturbation, with the latter being more pro- we primarily relate to biotic uptake under P-poor conditions. nounced at the high-P site and showing signs of high fau- However, unexpectedly, also in the litter and the Oe/Oa hori- nal activity. Phosphate can also sorb via cation bridges in zon, P leaching did not statistically differ between sites. This the organic horizons (Gaume et al., 2000; Gerke and Her- finding can be explained by a canceling out of the potentially Biogeosciences, 19, 1527–1546, 2022 https://doi.org/10.5194/bg-19-1527-2022
J. Fetzer et al.: Leaching of inorganic and organic phosphorus and nitrogen                                                                 1537

Figure 3. Temporal variations in ratios among dissolved organic carbon (DOC), nitrogen (DON), and phosphorus (DOP), as well as dissolved
inorganic N (DIN) and P (DIP) in leachates, from the Oe/Oa horizon at the high-P site and the low-P site. The same seasonal patterns were
observed for the litter and the A horizon. Data averaged over fertilization treatments, and boxplots depict variation from three field replicates.
Wint 19 = February–March 2019.

higher P release from the organic layer at the high-P site (re-            to thinner horizons. In contrast to the organic layers, P leach-
flected in higher PResin contents), by the greater thicknesses             ing from A horizons relative to P stocks was twice as high
of the organic layers at the low-P site, and hence by a greater            in the low-P than in the high-P soil possibly due to smaller
reservoir from which P can be mobilized. We presume that                   sorptive retention (Table 3). The smaller P leaching from the
the greater P stock in the organic layers at the low-P soil (Ta-           A horizon at the high-P site will foster the difference in P
ble 3) is an inherent site property linked to low-P sandy par-             storage between the two soils in the long-run.
ent material that promoted accumulation of organic material                   In contrast to DTP fluxes, we expected a higher contribu-
on top of mineral soils due to low biological activity (Hauen-             tion of DOP to total P leaching at the low-P site because DOP,
stein et al., 2018). Consequently, P fluxes in relative terms –            as part of DOM, is leached during SOM processing, while
when compared to P stocks – were larger from both organic                  phosphate is assumed to be more efficiently retained by plant
horizons in the high-P soil than in the low-P soil (Table 3) due           and microbial uptake in low-P forest ecosystems (Hedin et

https://doi.org/10.5194/bg-19-1527-2022                                                              Biogeosciences, 19, 1527–1546, 2022
1538                                             J. Fetzer et al.: Leaching of inorganic and organic phosphorus and nitrogen

Figure 4. Ratios of dissolved organic carbon (DOC), dissolved organic and inorganic nitrogen (DON and DIN), and dissolved organic and
inorganic phosphorus (DOP and DIP) in leachates from the Oe/Oa horizon as affected by +N, +P, and +N+P fertilization at the high-P and
the low-P site. Data averaged before over seasons (seasons were equally weighted), and the boxplots depict variation from the three field
replicates.

al., 2003). However, contrary to these expectations, the ab-           organic layer (only control plots) following irrigation was
solute DOP fluxes, as well as their contribution to total P            0.19 mg P L−1 at the low-P site and 0.24 mg P L−1 at the high-
fluxes, were higher in the high-P soil than in the low-P soil.         P site, those under natural precipitation were 0.56 mg P L−1
We relate this finding to the higher soil organic P content at         at the low-P site and 0.26 mg P L−1 at the high-P site
the high-P site (Table 1), resulting in a smaller C : P ratio          (Klaus Kaiser, unpublished data; mean over the 4 previ-
of SOM in all horizons, which translates also into smaller             ous years). We therefore assume that concentrations and
DOC : DOP ratios.                                                      fluxes estimated here are representative for the sites. The
                                                                       DTP fluxes ranged between 12 and 60 mg total P m−2 yr−1
4.3    Fluxes                                                          across all horizons (Table 3), which compare well with the P
                                                                       fluxes measured in other forest ecosystems, ranging from 9 to
Dissolved total P concentrations in the leachates follow-              62 mg P m−2 yr−1 (Qualls, 2000; Fitzhugh et al., 2001; Hedin
ing the experimental irrigation used to overcome site and              et al., 2003; Piirainen et al., 2007; Sohrt et al., 2019; Rinderer
weather variations corresponded closely to those measured              et al., 2021b). The P fluxes observed here are about 1 magni-
in an adjacent plot receiving natural precipitation. While             tude lower than those determined in a laboratory study with
the annual average concentration in the leachate from the

Biogeosciences, 19, 1527–1546, 2022                                                       https://doi.org/10.5194/bg-19-1527-2022
J. Fetzer et al.: Leaching of inorganic and organic phosphorus and nitrogen 1539 isolated horizons from the same sites (ranging from 70 to its P stock being leached during 1 year (Table 3), is impor- 320 mg P m−2 yr−1 across all horizons; Brödlin et al., 2019a). tant for redistributing P within the soil profile. When leached The higher P release in the laboratory than in situ can be at- from the entire profile or exported via lateral flow (Rinderer tributed to the regular leaching, the longer as well as more et al., 2021), it may also contribute to the depletion of the complete contact of soil with excessive artificial rainwater, ecosystems in P (e.g. Hedin et al., 2003; Richardson et al., and the lack of uptake by plants, rather reflecting potential 2004). release rates. The comparison between these two approaches demonstrates that in soil continuous release and immobiliza- 4.4 Fertilization effects tion of P takes place, but only a small proportion of released P eventually becomes leached. Phosphorus fluxes. In agreement with our hypothesis, fer- How relevant are these P leaching fluxes? The P export tilization had stronger effects on the leaching of inorganic from the Oe/Oa horizon observed in the present study is on than on organic P and N. Also, the fertilization effects were the same order of magnitude of reported P inputs with bulk stronger at the low-P than at the high-P site. However, coun- precipitation or throughfall at another German beech forest terintuitively, DIP leaching increased more strongly upon fer- (60 mg P m−2 yr−1 ; Sohrt et al., 2019). In Germany, atmo- tilization with N than with P at the low-P site. We relate this spheric P inputs may largely originate from fertilized agri- to the overcoming of N limitation for the production of en- cultural land, but in general, information on P deposition is zymes hydrolyzing organic P, which is indicated by the in- still scarce (Bol et al., 2016; Tipping et al., 2014; Vogel et creased activity of phosphomonoesterases after N addition in al., 2021; Wang et al., 2014) and not available for the two the studied leachates and soil solutions (Fetzer et al., 2021). study sites. The P fluxes from the A horizon at the high- Similar effects have been reported for grassland soils (Wid- P and at the low-P site are approx. 150 % and 50 % of re- dig et al., 2019) and in mesocosm experiments with soils ported atmospheric P deposition in Germany. In comparison, from the low-P site (Holzmann et al., 2016). Also, Siegen- N fluxes from the A horizons are only 30 % and 28 % of thaler et al. (2021) showed that N addition was the main atmospheric N depositions that have been measured at the factor driving changes in bacteria and fungi communities same high-P and low-P site (Brumme et al., 2021; NW-FVA, at the low-P site. Finally, N fertilization might have stimu- 2020), which might even represent an underestimate as atmo- lated overall microbial processing of SOM (Griepentrog et spheric N inputs are generally not completely captured due al., 2014; Hagedorn et al., 2012), which is supported by ob- to canopy exchange processes (Talkner et al., 2010). There- served increased DOC leaching at the high-P site (Sect. S6). fore, it seems that the leaching losses relative to atmospheric Although the amount of added P was much higher than inputs are greater for P than for N, which likely fosters the that of N when compared to soil N and P stocks (Tables 5 nutrient imbalances between N and P (Peñuelas et al., 2013). and 6), P fertilization affected P leaching less than N fertil- Since the P fluxes decreased towards the A horizon, they ization. In the Oe/Oa horizon, P addition corresponded to likely decrease further in deeper mineral soils due to lower 109 % and 79 % of the P stock at the high-P and the low- release of P and higher retention of DOP and DIP by sorption P site, while N addition was 39 % and 11 % of the N stock to reactive minerals (Barrow, 1983; Berg and Joern, 2006; at the high-P and the low-P site. Nevertheless, N leaching Brödlin et al., 2019a), as well as uptake by roots and mi- increased more than P leaching (Tables 5 and 6). Most prob- croorganisms in subsoils. Consequently, P leaching losses ably, a large fraction of added P was either rapidly sorbed from entire soil profiles are likely even smaller than from to reactive minerals, taken up by plants (Hauenstein et al., the topsoil observed here. This is supported by annual ex- 2020), or immobilized by soil microorganisms (Bünemann et port rates of P measured in the runoff of forested catch- al., 2012). Microbial biomass in the Oe/Oa horizons at two ments in Germany of 2–9 mg P m−2 yr−1 (Julich et al., 2017; study sites had very low microbial C : P ratios of 12 before Sohrt et al., 2019). Therefore, P losses from the entire soil the nutrient addition (Siegenthaler et al., 2021). Fertilization profile likely do not exceed P depositions, contradicting the with P did not affect the microbial P in the Oe/Oa horizons idea of these forest ecosystems being depleted in P due to at the high-P site but increased it at the low-P site with the leaching, as suggested by decreasing leaf P concentrations +N+P treatment compared to the +N treatment (Siegenthaler in beech trees (Lang et al., 2017; Talkner et al., 2015). The et al., 2021), strongly suggesting microbial immobilization estimated P fluxes from the Oe/Oa horizon are even 1 or- of added P. In temperate German beech forests of the same der of magnitude lower than the P input via annual litter- region, Zederer et al. (2017) found that in Oe/Oa horizons fall, which amounts to 229 mg P m−2 yr−1 at the high-P site with average soil C : P ratios of 390, microbial biomass had and 156 mg P m−2 yr−1 at the low-P site (Lang et al., 2017). C : P ratios of 13 and comprised approx. 30 %–50 % of to- This implies that a large proportion of litterfall P must be tal P. This indicates that organic layers have a high capacity taken up by plants and microorganisms. However, without to retain microbially bound P. Our leaching study shows that the current “P pollution” and at the centennial and millennial very little of retained P is re-released into soil solution, in- timescale, relevant for soil and ecosystem development, the dicating that P retention is effective in the organic layer and small P leaching in the A horizon, with 0.1 % and 0.2 % of not only in mineral soils where sorption is higher. https://doi.org/10.5194/bg-19-1527-2022 Biogeosciences, 19, 1527–1546, 2022
You can also read