Mesoscale simulation of typhoon-generated storm surge: methodology and Shanghai case study
←
→
Page content transcription
If your browser does not render page correctly, please read the page content below
Nat. Hazards Earth Syst. Sci., 22, 931–945, 2022
https://doi.org/10.5194/nhess-22-931-2022
© Author(s) 2022. This work is distributed under
the Creative Commons Attribution 3.0 License.

Mesoscale simulation of typhoon-generated storm surge:
methodology and Shanghai case study
Shuyun Dong1 , Wayne J. Stephenson1 , Sarah Wakes2 , Zhongyuan Chen3 , and Jianzhong Ge3
1 School of Geography, University of Otago, Dunedin, 9016, New Zealand
2 Department  of Mathematics and Statistics, University of Otago, Dunedin, 9016, New Zealand
3 State Key Laboratory of Estuarine and Coastal Research, East China Normal University, Shanghai, 200062, China

Correspondence: Wayne Stephenson (wayne.stephenson@otago.ac.nz)

Received: 23 January 2017 – Discussion started: 15 March 2017
Revised: 23 November 2021 – Accepted: 21 February 2022 – Published: 21 March 2022

Abstract. The increasing vulnerability of coastal megacities    essary to be well prepared and plan to ensure a sustainable
to storm surge inundation means both infrastructure and pop-    future for these cities (Jiang et al., 2001; Timmerman and
ulations are subject to significant threat. Planning for fur-   White, 1997; Yeung, 2001). Typhoon-generated storm surge
ther urban development should include consideration of the      is a major hazard for many coastal cities and leads to signif-
changing circumstances in coastal cities to ensure a sus-       icant economic losses. Considering the ongoing coastal de-
tainable future. A sustainable urban plan relies on sound       velopment and population growth in coastal megacities, pre-
preparedness and prediction of future climate change and        paredness and urban planning play a critical role in coastal
multiple natural hazards. In light of these needs for urban     management and hazard mitigation. Therefore, the increas-
planning, this paper develops a general method to simulate      ing vulnerability of coastal megacities to storm surge inun-
typhoon-generated storm surge at the mesoscale (1–100 km        dation needs be assessed to improve the resilience of these
in length). Mesoscale simulation provides a general approach    cities (Aerts et al., 2014; Woodruff et al., 2013).
with reasonable accuracy that could be implemented for             Many integration models for typhoons and storm surge
planning purposes while having a relatively low computation     have been developed and applied in past studies to simulate
resource requirement. The case study of Shanghai was cho-       regional storm surge inundation and analyze its impact (Choi
sen to implement this method. The mesoscale simulations of      et al., 2003; Davis et al., 2010; Dietrich et al., 2011b; El-
two historical typhoons not only provides realistic typhoon     saesser et al., 2010; Flather et al., 1998; Jakobsen and Mad-
storm surge inundation results at the city level but is also    sen, 2004; Lowe et al., 2001; Westerink et al., 2008; Zhang
suitable for implementing a large amount of simulations for     et al., 2008; Zheng et al., 2013). In order to achieve more
future scenario studies. The method will be generally appli-    accurate results, high-resolution mesh and data are usually
cable to all coastal cities around the world to examine the     employed in these models, which requires a large amount of
effect of future climate change on typhoon-generated storm      computing time, and the application of such models are lim-
surge even when historical observation data are inadequate      ited to small regions. As suggested by Aerts et al. (2014), ex-
or not available.                                               isting hydrological models for developing inundation scenar-
                                                                ios usually need to be adjusted for application at the regional
                                                                level. A high-resolution storm surge model could therefore
                                                                be too time consuming to be used for planning purposes
1   Introduction                                                when a large number of simulations need to be undertaken
                                                                to gain a better knowledge of storm surge inundation. Ogie
Rapid urban expansion in coastal megacities (cities with pop-   at al. (2019) argue that there is a need for less data-rich ap-
ulations over 10 million) leads to increased land demand and    proaches to flood models of coastal megacities where there
vulnerability to hazards for significant numbers of people      is often a paucity of data. The purpose of this paper is to de-
who are economically and socially disadvantaged. It is nec-

Published by Copernicus Publications on behalf of the European Geosciences Union.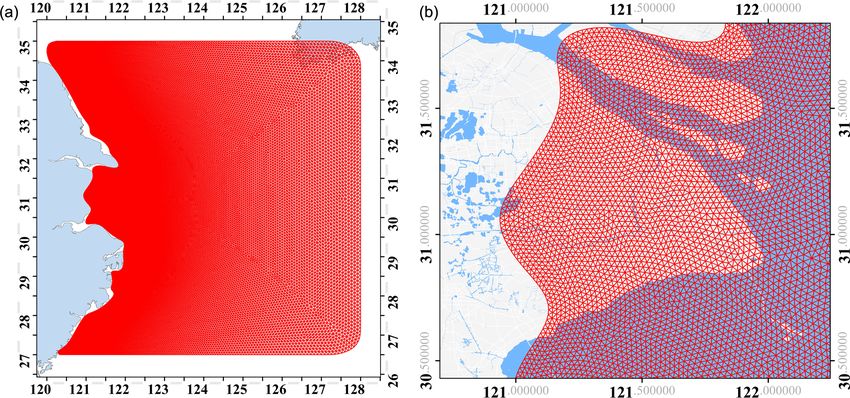
932                                                    S. Dong et al.: Mesoscale simulation of typhoon-generated storm surge

velop a less resource-intense simulation method for typhoon          monly used to provide advice for small-scale planning and
storm surge inundation at a city scale and to implement this         emergency management.
method using Shanghai as a case study. The approach de-                 There are a number of storm surge studies conducted in
veloped was to conduct numerical simulations of typhoons             China, and hydrological models for storm surge simulation
and their associated storm surge at a mesoscale (1–100 km            have been developed. However, these are either at a large or
in length), which can then be utilized to compute flooding           small scale, which may lead to a loss of spatial resolution in
scenarios.                                                           the simulated storm surge results or in huge costs in com-
                                                                     putation time. Most of these studies emphasized the signifi-
                                                                     cance of numerical modeling of storm surge and risk analysis
2   Previous work                                                    either for the coastline on a large spatial scale or for the lo-
                                                                     cal coastal area with a fine-resolution simulation. For exam-
There is a large amount of previous work on storm surge              ple, Zheng (2010) developed a numerical model to simulate
modeling. Regardless of the models used, previous studies            storm surge under the effects of tide and wind wave for the
can be divided into the three types based on scale of mod-           coast of China. In 2011, Tan et al. (2011) assessed the vul-
eling, namely large-, meso- and small-scale modeling. For            nerability of coast cities in China to storm surge using an
large-scale storm surge studies, they usually concentrate on         indicator system. Yin (2011) also assessed the China coastal
simulating storm surge at the national level (> 100 km in            area’s risk to typhoon storm surge based on the simulated re-
length). For example, Lowe et al. (2001) developed a storm           sults from a large-scale storm surge model and a proposed
surge with 35 km resolution for the northwest European con-          indicator system. Other studies placed emphasis on the anal-
tinental shelf region and then analyzed the effects of climate       ysis of storm surge at small regional-scale areas along the
change using a regional climate model. Fritz et al. (2010)           Chinese coast (Xie, 2010; Xie et al., 2010; Ye, 2011; Zhang
simulated the storm surge occurring in the Arabian Sea with          et al., 2006).
a spatial resolution range of 1–80 km. Haigh et al. (2014) uti-         This study, therefore, utilizes a mesoscale (between large
lized a high-resolution hydrodynamic model to estimate ex-           and regional scales) approach for inundation vulnerability
treme water level exceedance probabilities for the Australian        to typhoon storm surge to improve knowledge of inunda-
continental shelf region. Due to the high risk of storm surge,       tion vulnerability and to guide future vulnerability mitiga-
there have been studies conducted for the Louisiana coast,           tion strategies. Moreover, a large number of simulations are
USA (Butler et al., 2012; Sheng et al., 2010; Wamsley et al.,        involved in planning. Therefore, in order to fit this purpose,
2009; Westerink et al., 2008), and the Gulf of Mexico area           a mesoscale study for Shanghai as a whole is utilized, filling
(Dietrich et al., 2011a, b, 2012). Cheung et al. (2003) ana-         the gap between the small and large scales of previous stud-
lyzed the emergency plan for Hawaii based on storm surge             ies. In addition, this mesoscale simulation aims to provide a
simulations. These large-scale storm surge studies normally          general approach that could be easily implemented for other
apply a large spatial resolution, 50–100 km on average, to al-       coastal cities and has much lower requirements for computa-
low the simulation to be run smoothly in a large-scale area.         tion time and data than previous approaches.
It is inevitable that at such large spatial resolution small vari-
ations in terms of storm surge level at regional level is lost,
making it a less suitable type of model for studying the im-         3   Data and methods
pact of inundation at a city scale (typically 20–80 km length
of coast).                                                           The objective of this general methodology for simulating ty-
    Mesoscale storm surge modeling typically focuses on a            phoon storm surge inundation is to develop an adaptable pro-
scale of 1–100 km in length. Peng et al. (2004) utilized inte-       cedure that allows numerical simulations to be carried out
grated storm surge and inundation models to simulate storm           easily in coastal cities around the world. Firstly, the data
surge inundation in the Croatan–Albemarle–Pamlico Estuary            required in the typhoon and storm surge simulations were
in the USA. Shepard et al. (2012) demonstrated a method to           assembled, including the observation data from typhoons,
assess the community vulnerability of the southern shores            tidal constituents, topography and land use data. Two histor-
of Long Island, New York, to storm surge. For small-scale            ical typhoons were selected to develop typhoon profiles, and
storm surge studies, the focus is at a regional level (1–1000 m      then wind and pressure fields were calculated to drive the
in length). Taking the study of Funakoshi et al. (2008) as           hydrodynamic storm surge model. Typhoon wind and pres-
an example, a small-scale storm surge model was devel-               sure fields were calculated based on historical typhoon pro-
oped covering the St. Johns River Basin in the USA. Xie et           files. Moreover, tidal observed data were collected to vali-
al. (2008) developed storm surge modeling to simulate corre-         date the hydrodynamic models in the next step. The next step
sponding inundation. Frazier et al. (2010) examined the so-          was to implement a storm surge model to simulate the gen-
cioeconomic vulnerability to storm surge in Sarasota County,         eration and propagation of the typhoon-driven storm surge
Florida, USA. Small-scale storm surge studies normally fo-           model at coastal and regional scales. The historical wind
cus on the effect of storm surge at a local level and are com-       and pressure fields are inputs for the coastal hydrodynamic

Nat. Hazards Earth Syst. Sci., 22, 931–945, 2022                                      https://doi.org/10.5194/nhess-22-931-2022
S. Dong et al.: Mesoscale simulation of typhoon-generated storm surge                                                          933

model along with the tidal constituents as key driving fac-        the coastal hydrodynamic storm surge model will be utilized
tors to simulate the initial current- and wind-induced surge at    to calculate the corresponding distribution of the wave field
coastal scale. Then, considering river discharge and coastal       under the influence of a historical typhoon wind and pres-
protection works, storm surge is simulated using the regional      sure field. On this basis, a regional storm surge model can be
hydrodynamic model with a fine-spatial-resolution unstruc-         built for shallow water to consider wave refraction, diffrac-
tured mesh. Lastly, the flood depth can be extracted from          tion, and transformation in order to calculate storm surge in
the simulation results in a regional hydrodynamic model and        the area of interest. After calibration against measured histor-
overlaid onto the urban digital elevation model, where the         ical data of storm surge, this model can be applied to project
flood depth and its spatial extent are displayed on a two-         the impact of future storm surge for the study area.
dimension flood map. The proposed method is explained in
the following sections.                                            3.2.1   Grid model and resolution

3.1   Assembling data                                              In order to precisely simulate storm surge in any coastal
                                                                   area, a fine grid model with appropriate resolution should be
An accurate wind and pressure field has been identified as         constructed for the coastal terrain and topography. The grid
having an important role in storm surge modeling (Bode and         greatly affects the generation, propagation and reflection of
Hardy, 1997). In order to provide wind and pressure fields         the wave, as well as bottom friction. However, a very fine
to drive storm surge in the hydrodynamic model, historical         grid resolution causes significant increases in the computing
typhoon data need to be collected from records. There are          time and resources. Thus, a balance between the accuracy
various types of typhoon data, such as best-track data, ob-        of the numerical simulation and the computing requirement
served data, and satellite data. Typhoon wind and pressure         should be achieved in the model. The resolution of the un-
fields are calculated in this framework by applying the para-      structured mesh applied in the coastal hydrodynamic model
metric model built in the MIKE 21 Cyclone Wind Generation          is recommended to be set in a range of 1 km at the coastal
tool. Typhoon data required in the simulation are then the ty-     zone to 10 km at the open ocean boundary (Fig. 3a). For the
phoon track, the central and neutral air pressure, and the max-    regional hydrodynamic model, the resolution can be more
imum wind speed. These data can usually be found in best-          precise with an average of 300 m (Fig. 3b).
track data published by meteorological agencies (Ying et al.,
                                                                   3.2.2   Coastal hydrodynamic model
2014) or satellite reanalysis databases (Simmons, 2006). The
development and optimization process of typhoon wind mod-          Wind and pressure fields of the typhoons, together with as-
eling is described in Sect. 3.3. To pre-process the data for the   tronomic tide and waves, are the main factors of storm surge
subsequent modeling, all the historical topography and me-         that need to be taken into account in simulations (Savioli et
teorological data were digitized into appropriate formats, in-     al., 2003). Combining the statistical hydrological and me-
cluding bathymetry, urban digital elevation model, land use        teorological data, a coastal typhoon storm surge model is
map, and coastal engineering features (Dong, 2022). In this        designed and developed using MIKE software to simulate
step, tide constituents are prepared in the format that is re-     historical storm surge events, which in turn allows simula-
quired in storm surge modeling.                                    tion of the hydraulics, waves and related phenomena in the
                                                                   coastal area. This coastal hydrodynamic model with a flexi-
3.2   Developing a storm surge coupled model                       ble mesh is built up in the MIKE 21 flow model to simulate
                                                                   wind-generated waves and current conditions with respect to
Water propagation at the coast is significantly sensitive to       pre-processed tide, wind and pressures fields. This coastal
surface wind forcing and astronomic tides, especially during       typhoon storm surge model was first calibrated under normal
typhoon events. As suggested by Huang et al. (2010), wave-         circumstances to fit no storm tidal conditions firstly, and then
induced forces on storm surge are incremental, so there is         run for historical typhoon storm surge events to ensure the re-
no need to utilize an independent wave model. Therefore, in        liability of simulations. First, the coupled model was only run
this study, a coupled model will be built to simulate storm        to compute tide parameters during the 3 d before the typhoon
surge. In order to provide accurate wind and pressure fields       for the entire region for the purpose of calibration. Then the
and tide influence for the coastal and regional circulation, a     model was run to simulate historical typhoon events and the
two-domain, typhoon storm surge model was set up, covering         simulation calibrated with observed data of surge elevation.
the coastal and regional geographic scales. In this method,        In addition, computed data of wind speed and direction were
MIKE 21 was chosen to simulate typhoon-generated storm             calibrated against satellite data or locally measured data.
surge with consideration of river discharge and coastal pro-
tection works. As commercial software, MIKE 21 has broad           3.2.3   Regional hydrodynamic model
applicability and a low requirement of specialized knowl-
edge. In general, a hydrodynamic model for a coastal area          Based on the computed data from the coastal hydrodynamic
will be set up and calibrated against observed tide data. Then     model, a regional model was developed to simulate the

https://doi.org/10.5194/nhess-22-931-2022                                   Nat. Hazards Earth Syst. Sci., 22, 931–945, 2022
934                                                      S. Dong et al.: Mesoscale simulation of typhoon-generated storm surge

Table 1. Major configuring parameters for the simulation models.      3.3   Storm surge inundation modeling
CFL signifies Courant–Friedrichs–Lewy.
                                                                      For large-scale and mesoscale studies, storm surge inunda-
   Model parameter                  Configuration                     tion mapping can be conducted to predict the inundation
   Minimum time step                0.01 s                            depth and spatial extent. The approach to inundation map-
                                                                      ping can also be utilized for the purpose of further planning
   Maximum time                     30 s                              which aims to predict the distribution of storm surge inunda-
   Critical CFL number              0.8                               tion, especially in land reclamation planning. Based on the
   Drying depth                     0.005 m
                                                                      typhoon storm surge simulation results from the regional hy-
                                                                      drodynamic model, inundation maps are constructed using
   Flooding depth                   0.05 m                            ArcGIS. Flood maps drawn in ArcGIS provide graphic in-
   Wetting depth                    0.1 m                             formation with which to analyze the differences in inunda-
                                                                      tion depth across the city.
   Manning number                   80 m1/3 s−1 for ocean,
                                    32 m1/3 s−1 for land
                                                                      3.4   Optimizing process in wind field simulation by
   Neutral pressure of wind field   1008 hPa                                MIKE software
   Soft start interval for wind     3600 s
                                                                      In order to analyze the storm surge caused by typhoons, a
   Freshwater discharge             Simple source, 45 000 m3 s−1      precise simulation is closely bound to the accuracy of wind
                                                                      and pressure field specification. It is therefore of considerable
                                                                      significance that a specific, accurate and representative ty-
movement of typhoon-induced surge for a relatively small              phoon field is input into the typhoon model. In this study, the
regional area. Then this regional model was run for differ-           wind and pressure fields of the typhoon were generated by
ent scenarios to project the effects of global climate change         the parametric model in the MIKE 21 Cyclone Wind Gener-
and land subsidence on the regional storm surge level. This           ation tool. There are four parametric models built in this tool:
regional hydrodynamic model can provide predicted results             Young and Sobey (Young and Sobey, 1981), Holland (Hol-
under various scenarios for decision making, hazard mitiga-           land, 1980), Holland for double vortex (Harper and Holland,
tion and emergency evacuation planning. By analyzing var-             1999), and Rankine (1872). The Holland model has been
ious future scenarios, a better understanding of coastal vul-         chosen to simulate the typhoon wind field in the Shanghai
nerability can be reached, and then appropriate preparedness          case study because the adjustability of the Holland param-
and mitigation planning can be made.                                  eter B allows the model to be modified to fit existing data
                                                                      more realistically.
3.2.4   Major model parameters                                           Most of the parameters in the Holland model can be col-
                                                                      lected from the typhoon best-track dataset of the China Me-
The hydrodynamic module in the MIKE 21 Flow Model was                 teorological Administration (CMA) and the European Centre
employed in this study to implement the coastal and regional          for Medium-Range Weather Forecasts (ECMWF) (Molteni
hydrodynamic models. A number of model parameters need                et al., 1996). The best-track data were recorded every 6 h,
to be set ahead of running simulations, so these are now de-          and then the model will simulate the wind and pressure fields
scribed. The horizontal eddy viscosity specified as a constant        at 1 h intervals. The remaining two parameters, the radius of
of 0.8 is taken from Smagorinsky (1963) and used in the               maximum wind Rmw and parameter B, was calculated by
SC-TSSM (Shanghai Coastal Typhoon Storm Surge Model).                 Eq. (1) (Ge et al., 2013) and Eq. (2) (Vickery et al., 2000),
The effect of different shapes of sea walls in the storm surge        respectively.
model is minor; therefore the shape of the sea wall was as-
sumed to be trapezoidal. In our case study below, the height          Rmw = (7.5757576 × 10⁻⁵ ) × Pc2 − 0.50560606 × Pc
of the sea wall along the Shanghai coastline is 6.37 m rela-
tive to mean sea level, and this value is used in the model.                + 477.01515,                                           (1)
Boundary conditions in the open sea are driven by the astro-          B = 1.38 − 0.00184 |Pc − Pn | + 0.00309Rmw ,                 (2)
nomical tide. In this study, the tide profile before and dur-
ing the typhoon period was computed by the Global Tide                where Pc represents the pressure at the typhoon center or
Model in MIKE. TOPEX/Poseidon altimetry data have been                central pressure, and Pn is the ambient pressure field or neu-
employed in the Global Tide Model with a spatial resolution           tral pressure.
of 0.25◦ × 0.25◦ . The output data of boundary condition files           Although the computed results by the Holland model show
have a 1 h interval. Other parameters configured in the coastal       that the model is in good agreement with the actual ob-
and regional hydrodynamic models are listed in Table 1.               servations, a relative error remains in the computation af-
                                                                      ter typhoon landfall (Fig. 1). Compared to the observation
                                                                      data, the computed wind speeds fall rapidly after the ty-

Nat. Hazards Earth Syst. Sci., 22, 931–945, 2022                                       https://doi.org/10.5194/nhess-22-931-2022
S. Dong et al.: Mesoscale simulation of typhoon-generated storm surge 935
phoon made landfall. In order to improve the quality of ty- Along the Shanghai coast, land reclamation has grown
phoon simulated results, a commonly applied approach is to substantially due to the increasing demand for land for fur-
blend computed wind speed results with a satellite reanaly- ther urban development; about 480 km2 land was claimed in
sis database, such as the global National Centers for Envi- Shanghai between 1954–1990 (Shanghai Nongken Chroni-
ronmental Prediction and National Center for Atmospheric cles Compilation Committee, 2004). Reclaimed land can al-
Research (NCEP/NCAR) reanalysis data and the ECMWF leviate the pressure on land that results from the continuous
reanalysis dataset (Dutta et al., 2003; Jia et al., 2011). The growth of cities in the process of rapid expansion. Most of the
ECMWF reanalysis dataset has a better spatial resolution newly reclaimed land has been used for agriculture and in-
of 0.25◦ than NCEP/NCAR (2.5◦ ). Therefore, the ECMWF dustry (Shanghai Municipal Planning and Land & Resources
dataset was chosen here as the background wind field to Administration, 2010). However, such extensive reclamation
achieve a more precise result at the outer area of the radius activities require long-term, well-developed planning, or oth-
of maximum wind. erwise there may be increased vulnerability and even catas-
The ECMWF reanalysis dataset is a continually updat- trophic damage due to natural hazards.
ing dataset with the finest resolution of a 0.25◦ × 0.25◦ grid Typhoon Winnie in August 1997 and Typhoon Wipha in
mesh presented by the European Centre for Medium-Range September 2007 were chosen as case studies to simulate ty-
Weather Forecasts. It has been recording joint data from di- phoon storm surge and assess the vulnerability to typhoon
verse, advanced, operational, numerical models, representing storm surge inundation of differing land use types under sea
the state of the Earth’s atmosphere, incorporating observa- level rise and land subsidence scenarios. Both Winnie and
tions and a numerical weather prediction model four times Wipha were categorized as super typhoons by the CMA and
daily since 1948 (Simmons, 2006). As a result of the assim- caused serious storm surges in Shanghai. These two typhoons
ilation of the observational data, the recorded atmospheric affected a wide-ranging area, so simulation results could pro-
circumstances in the ECMWF dataset can be regarded as pro- vide more information on the vulnerability of different land
viding a close approximation of the state of the atmosphere use types under worse case scenarios. In addition, Winnie
(Molteni et al., 1996). Therefore, the ECMWF can provide and Wipha represented typical turning track typhoons. They
a precise, nearly real atmospheric background for adjusting developed in the northern Pacific Ocean and then tracked
the Holland model. northwestward to China. After they passed across the East
In order to integrate the strong points of the MIKE soft- China Sea, they moved northeastward. As with the majority
ware and the ECMWF reanalysis dataset, the MIKE software of typhoons affecting Shanghai, although they did not make
development kit (SDK) is used here to optimize the simu- landfall directly in Shanghai, they generated a high storm
lation results from the MIKE 21 Cyclone Wind Generation surge in the city: 5.72 m during Winnie and 3.39 m during
tool. The wind speed V (r) at a distance r from the center of Wipha. In addition, the 10-year interval between these two
the typhoon can be given by Eq. (3): typhoons could allow the simulations to reveal how inunda-
tion vulnerability of different land use types to typhoon storm
VMIKE , r < Rmw surge changed over time.
V (r) = VECMWF , r > Rmw , (3) Typhoon Winnie (1997) was an especially large and devas-
aVMIKE + (1 − a)VECMWF , r = Rmw
tating typhoon. After passing north of Taiwan, Winnie made
landfall at the southeast of Shanghai in Wenling, Zhejiang
where VMIKE is the wind speed calculated by the MIKE 21
Province, on 18 August 1997. Its center was never closer than
Cyclone Wind Generation tool, VECMWF is the wind speed
400 km from Shanghai; however the storm surge caused by
computed from the ECMWF interpolation results, and a is
Winnie led to extraordinary levels of flooding. Winnie gave
the weight factor in order to smooth rough edges. An opti-
rise to 212 deaths, over 1 million people were displaced, and
mized coupled wind and pressure field can be generated by
there was CNY 4.1 billion worth of economic losses (State
programming in the MIKE SDK based on Eq. (3). This pro-
Oceanic Administration, 2022). A resulting storm surge of
duced a wind and pressure field that matched the actual ty-
up to 6.57 m was measured at Jinshanzui station. After land-
phoon event well.
fall, Winnie shifted from the northeast to northwest, giving
rise to approximately 37 km of riverbank overflow and 70 km
4 Case studies in Shanghai of dike breaches (Zhu et al., 2002). A storm surge with a
wave height of approximately 7.9 m developed in Zhejiang
Following the proposed framework for assessing inundation Province, and then this decreased to around 5.72 m as it ap-
vulnerability to storm surge, a case study of Shanghai is used proached the Shanghai area. Typhoon Wipha (2007) was an-
to examine the application of this proposed approach (Fig. 2). other destructive typhoon which passed near Shanghai and
There were 16 major storm surge events in Shanghai from landed in Cangnan, Zhejiang Province, on 19 September
1905 to 2000; five of them (in 1905, 1933, 1981, 1997 and 2007. As a typical turning track typhoon, it passed to the west
2000) have led to severe flooding and billions of yuan in eco- of Shanghai after making landfall to the south. Although the
nomic damage. eye of Wipha did not pass near Shanghai, its strong outer
https://doi.org/10.5194/nhess-22-931-2022 Nat. Hazards Earth Syst. Sci., 22, 931–945, 2022
936                                                       S. Dong et al.: Mesoscale simulation of typhoon-generated storm surge

Figure 1. Model data comparison for (a) results at Tanxu station and (b) results at Daji station. The blue points indicate the observation data,
the red curve shows the simulated results following the Holland model, and the grey curve represents the results computed by the Young and
Sobey model.

wind and rain bands resulted in severe flooding in Shang-                 interval and therefore integrate well with each other in the
hai. Although the recorded highest water level in Shanghai                typhoon model to improve the accuracy of simulated results.
was only 3.39 m during this typhoon on 19 September 2007,                    The computational models in this study for storm surge
there were 128 roads flooded, and over CNY 1 million (2007)               simulation employ an unstructured mesh spacing of 1 km in
worth of direct losses were caused in Shanghai. In addition,              the regional area and 100 km for the open sea area. The to-
almost 300 000 people had to be evacuated by the Shanghai                 pographical data applied in the urban area to generate the
government (State Oceanic Administration, 2022).                          flexible mesh were provided by the East China Normal Uni-
                                                                          versity. The topographical data were extracted from the dig-
4.1   Required data and processing                                        ital elevation model of Shanghai with a 5 m spatial resolu-
                                                                          tion. Bathymetry was taken from the ETOPO1 Global Re-
Data regarding topography and meteorological data from                    lief Model downloaded from NOAA with a grid resolution of
Shanghai for both 1997 and 2007 were collected and pro-                   1 arcmin in the open sea area, while data provided by the East
cessed before modeling. Assimilated wind data were re-                    China Normal University with a spatial resolution of 1 km
quired using best-track data from the CMA Tropical Cyclone                were adopted to improve the accuracy of the bathymetry data
Data Center and ECMWF global reanalysis products with a                   near shore (Fig. 3).
resolution of 0.25◦ . Both of these two datasets have a 6 h

Nat. Hazards Earth Syst. Sci., 22, 931–945, 2022                                             https://doi.org/10.5194/nhess-22-931-2022
S. Dong et al.: Mesoscale simulation of typhoon-generated storm surge                                                                937

                                                                         4.2   Typhoon modeling

                                                                         In this study, the impacts of typhoons are derived from the
                                                                         wind and pressure fields using the MIKE 21 Cyclone Wind
                                                                         Generation tool. In order to improve the accuracy of the sim-
                                                                         ulated results, the reanalysis dataset from ECMWF has been
                                                                         applied in MIKE SDK. Details are given in the following sec-
                                                                         tions regarding the setup, calibration and computed results of
                                                                         typhoons Winnie and Wipha.
                                                                            The typhoon model produces an output with a 1 h inter-
                                                                         val, including the air pressure, and U and V components
                                                                         of wind speed. Afterwards, the simulated results have been
                                                                         passed to the storm surge model to generate wind-induced
                                                                         waves. The dataset used to initialize and, subsequently, simu-
                                                                         late wind and pressure fields in MIKE 21 was extracted from
                                                                         the best-track data published by the CMA Tropical Cyclone
                                                                         Data Center. The data for model optimization in MIKE SDK
                                                                         were an ECMWF reanalysis dataset with 6 h intervals and a
                                                                         resolution of 0.25◦ × 0.25◦ . In this study, the wind and pres-
                                                                         sure fields were generated with the parametric model of Hol-
                                                                         land’s wind field profile for the area between 30–35◦ N, 120–
Figure 2. Local map of Shanghai with the dashed red line indicating      130◦ E. ETOPO1 data and local measured data were em-
the city’s political boundary and simulation area, while the blue line
                                                                         ployed to develop a topographical profile of the entire coastal
indicates the Huangpu and Dazhi rivers. The yellow points represent
                                                                         domain.
two tide gauges used to calibrate the models, while the blue points
represent tide gauges used for tide validation. Sources: Esri, De-          The Holland parameter B was set using Eq. (2). A
Lorme, HERE, USGS, Intermap, iPC, NRCan, Esri Japan, METI,               geostrophic correcting parameter can be implemented as a
Esri China (Hong Kong), Esri (Thailand), MapmyIndia and Tom-             constant or varied according to the wind speed at different
Tom.                                                                     places. In order to correct the asymmetrical forward move-
                                                                         ment of a tropical cyclone, a correction factor δfm and the
                                                                         maximum angle of cyclone movement are introduced into
   Four gauge stations were utilized here to validate and                the model to adjust the wind profile. In the case of Shang-
calibrate the simulated results from the typhoon and storm               hai, δfm was set to 1 as recommended in the MIKE 21 user
surge models. For the purpose of model validation, the SC-               manual. The maximum angle was set to 115 and 150◦ as the
TSSM was run for a period of 1 month before both histori-                maximum angles of Winnie’s and Wipha’s movements, re-
cal typhoon events. In these simulations, the effect of wind             spectively. Observed data from two wind gauge stations (Daji
forcing was not taken into account in order to compare the               and Tanxu) have been used to calibrate the typhoon model.
plain model results with actual data at the Sheshandao and               Results were outputted from the Holland model at 1 h inter-
Zhongjun stations. Since observed tide levels at these gauge             vals and compared against observed data (Figs. 5 and 6). For
stations are not available during the selected typhoon events,           both typhoons, calibration results of wind speed show that
in order to validate the coastal storm surge model, the tide             the simulation agrees well with measured data before each
level extracted from a tide table was adopted. The compar-               typhoon made landfall at Daji and Tanxu stations. After the
ison between extracted data and simulated data is shown in               landfall, the simulation shows a 17.9 % and a 14.4 % mean
Fig. 4. It shows that the SC-TSSM has produced good sim-                 absolute percentage error against observed data. The reason
ulations for tide propagation in the coastal domain. From                for this large increase in the error after landfall is mainly the
Fig. 4, the simulations show a good agreement with the ex-               long distance between the track of both typhoons and the
tracted data from the two gauge stations. At Sheshandao and              wind gauge stations. In addition, previous studies suggested
Zhongjun stations, overall errors of 3.30 % and 0.52 % oc-               significant fluctuations during typhoon events may be related
curred during Winnie and Wipha, respectively. Computed                   to regional wind fields rather than the wind field driven by
wind and storm surge results from numerical models have                  the typhoon (Zhu et al., 2002). Thus, the simulations around
been calibrated based on observation data at the two gauge               these two gauge stations failed to capture such fluctuations in
stations off the coast of Shanghai, at Daji and Tanxu stations           wind speed. Although the simulated data cannot reflect mi-
(Fig. 2).                                                                nor changes in wind direction at shorter time intervals, they
                                                                         still have the same trend as the observed data do (Fig. 5). Af-
                                                                         ter calibration of the model, the computed results have been
                                                                         passed to MIKE SDK and integrated with ECMWF.

https://doi.org/10.5194/nhess-22-931-2022                                         Nat. Hazards Earth Syst. Sci., 22, 931–945, 2022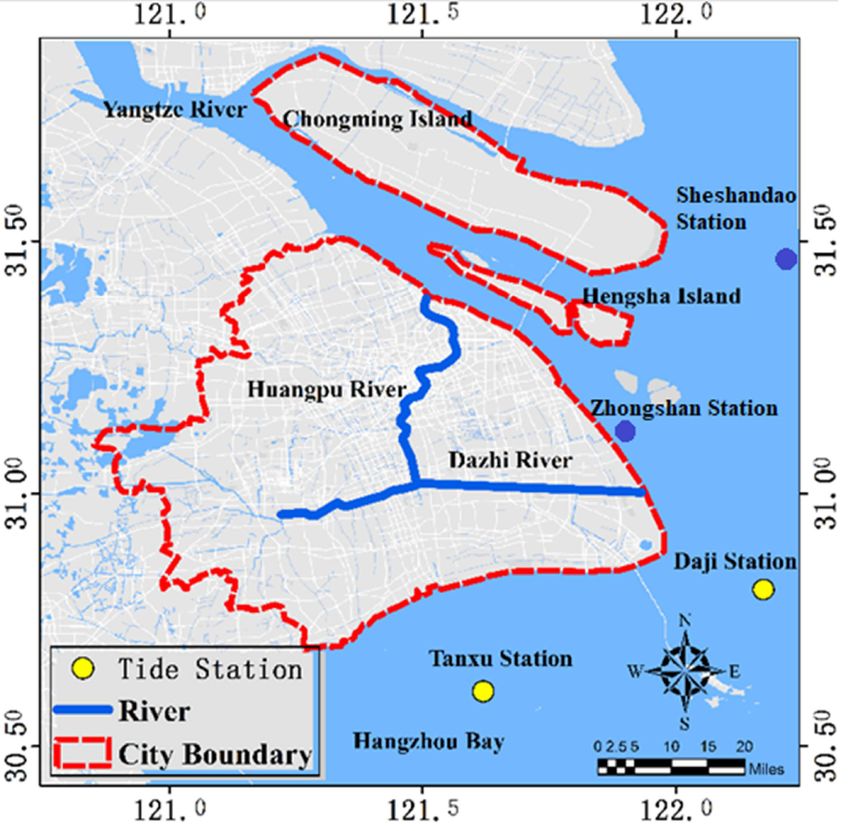
938 S. Dong et al.: Mesoscale simulation of typhoon-generated storm surge
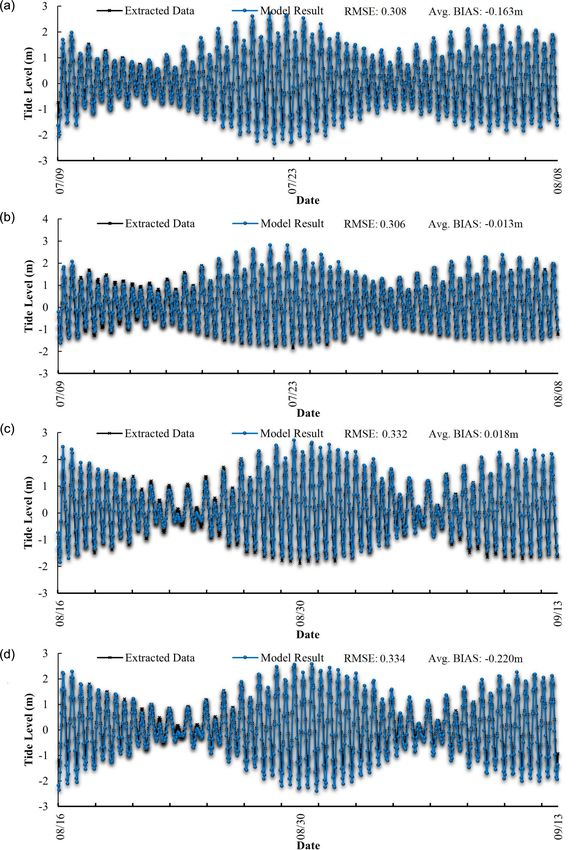
Figure 3. Shanghai Coastal Storm Surge Model with the resolution varying from 10 to 100 km. Panel (a) shows the unstructured mesh with
the differing resolution, ranging from 10 to 100 km. Panel (b) provides an enlarged image of the mesh around Shanghai. Sources: Esri,
DeLorme, HERE, USGS, Intermap, iPC, NRCAN, Esri Japan, METI, Esri China (Hong Kong), Esri (Thailand), MapmyIndia and TomTom.
4.3 Results of the Shanghai Coastal Typhoon Storm sen as the bed resistance factor, and it was set to 80 m1/3 s−1
Surge Model for ocean and 32 m1/3 s−1 for land area. For wind forcing,
the input wind profile was generated from the computed re-
sults of the typhoon model, including air pressure and U
The typhoon simulation results were used as input for a storm and V components of wind velocity that varied in time and
surge model to provide the wind profile. In order to simu- domain. Since the Yangtze Estuary is included in the SC-
late a typhoon-generated storm surge at coastal and regional TSSM, the river’s discharge should be taken into considera-
scales, the Shanghai Coastal Typhoon Storm Surge Model tion as a source of freshwater. Based on previous work, the
(SC-TSSM) was developed here. In this section, the config- discharge of Yangtze River has been set to 45 000 m3 s−1 as
uration, validation and calibration of the SC-TSSM will be the mean discharge for the period of July–September (Ge,
described in detail, and the simulated results of a storm surge 2010).
caused by two selected typhoons will be discussed accord- As shown in Fig. 7, the results suggest that the SC-TSSM
ingly. SC-TSSM covers the Shanghai coastal area between can simulate the propagation of storm surge satisfactorily. In
latitudes 27–35◦ N and longitudes 120–128◦ E with varying general, the numerical computation results are in good agree-
domain resolutions from 1 to 100 km (Fig. 3). ment with the observations, although some sections of the
This unstructured-grid high-resolution model has been simulation are underpredicted. For example, the differences
developed to satisfy the computation requirements during between computation and observations are in the range of
storm surge simulation within the geographic coverage of 0.2–0.5 m from 17 to 19 September 2007.
the Shanghai sea and coastal area. This model system con- Based on simulation results from MIKE 21, distribution
tains both the Shanghai Coastal Typhoon Storm Surge Model maps of storm surge inundation and inundation depth in
(SC-TSSM) and the regional Hengsha Island Typhoon Storm Shanghai during the two case study typhoon events are pre-
Surge Model (HI-TSSM). Multiple physical factors are in- sented in Fig. 8. Simulation results show both typhoons gave
cluded in this model system, such as typhoon events, open rise to storm surge inundation in Shanghai across a large area.
ocean currents, astronomical tides, surface waves and fresh- The distribution of storm surge inundation caused individu-
water discharge. A surface water modeling system (SMS) ally by Winnie and Wipha was basically the same but with
was used to generate mesh for this study since it has a more a few differences in flood depth observed along the coastline
effective grid generation function than MIKE, and it can re- and on the east and north coasts of Chongming and Heng-
fine a flexible mesh gradually which cannot be achieved in sha islands. The average inundation levels of the storm surge
MIKE. that occurred during these two typhoons were 1.78 m in 1997
In this model, the effect of different shapes of the sea wall (Winnie) and 0.9 m in 2007 (Wipha) in eastern Shanghai.
in the storm surge model is small; therefore the shape of the In order to analyze the effect typhoon storm surge may
sea wall was assumed to be trapezoidal. The height of the have on reclamation projects around Hengsha Island, a sur-
sea wall along the Shanghai coastline has been set to 6.37 m vey line and six survey points along the south bank of the on-
relative to mean sea level. The Manning number was cho-
Nat. Hazards Earth Syst. Sci., 22, 931–945, 2022 https://doi.org/10.5194/nhess-22-931-2022S. Dong et al.: Mesoscale simulation of typhoon-generated storm surge 939
Figure 4. Time series of tide level (unit: m) at the tide gauge stations
(Sheshandao and Zhongjun stations) presented in Fig. 2. Panels (a)
and (b) present tide level at Sheshandao and Zhongjun stations from
8 July to 8 August 1997 before Typhoon Winnie, while (c) and (d)
present tide level at Sheshandao and Zhongjun stations from 15 Au-
gust to 15 September 2007 before Typhoon Wipha. The black line
indicates the extracted data, while the computed results from the
SC-TSSM are shown with the blue line.
Figure 5. Data comparison between computed wind speed (m s−1 )
and observed data at the two wind gauge stations in Shanghai during
typhoons Winnie and Wipha. The blue line presents the simulated
going project have been drawn (Fig. 9a). As the tide moved
results from the typhoon model, while the black line indicates the
toward the south bank of Hengsha Island during the study measured data at the gauge stations. (a, b) Winnie and (c, d) Wipha
period in the Yangtze Estuary, the time series of water level at Daji and Tanxu stations.
at these survey points can reveal the variation characteris-
tics of storm surge in this area. The water level and wave
speed at these six survey points have been extracted from
simulations in the HI-TSSM (Hengsha Island Tropical Storm 0.52 m (Wipha) at high tide, while it was up to 1.79 m and
Surge Model). An hourly output from the HI-TSSM for the 1.32 m, respectively, during low tide (Fig. 8c). Coastal vul-
period from 18 h before the landfall of the typhoon to 12 h af- nerability to typhoon storm surge inundation defined in this
ter demonstrates the differences of surge elevation and speed study is sensitive to the elevation of the storm surge, espe-
between the different locations (Fig. 9b and c). cially during high tide. Therefore, although there are only
Water levels at these survey points decreased slightly from slight differences in surge level (0.52–1.79 m between points
points a to f. Differences in water level between these se- a and f) along the survey line, it will lead to a variation in
lected points were larger during low tide than high tide. The coastal inundation vulnerability to storm surge. The results
difference between points a and f was 0.72 m (Winnie) and also imply that vulnerability of land reclamation to typhoon
https://doi.org/10.5194/nhess-22-931-2022 Nat. Hazards Earth Syst. Sci., 22, 931–945, 2022940 S. Dong et al.: Mesoscale simulation of typhoon-generated storm surge
Figure 7. Comparison of the observation data (black) and simulated
results (blue) of storm surge levels (a, b) during Typhoon Winnie
and (c, d) during Typhoon Wipha at Daji and Tanxu stations.
fected areas during these typhoon storm surge inundations.
Figure 6. Data comparison between computed wind direction (de- The inundation depths at these places were usually over
gree) and observed data at the two wind gauge stations in Shang- 1.0 m. Maximum inundation depth in those areas reached
hai during typhoons Winnie and Wipha. The blue line presents the 3.82 m during Winnie and 2.65 m during Wipha. Severe
simulated results from the typhoon model, while the black line in- storm surge led to widespread flooding, and the airport, fac-
dicates the measured data at the gauge stations. (a, b) Winnie and tories, warehouses, and commercial and residential buildings
(c, d) Wipha at Daji and Tanxu stations.
were flooded. Combined with heavy rainfall, this meant the
transportation system was disrupted, including communica-
tion lines and international airports. The detailed information
storm surge varies from place to place. Therefore, it is im- on storm surge inundation in Shanghai during Winnie and
portant to analyze coastal vulnerability to storm surge inun- Wipha was not available; thus the oceanic disaster commu-
dation of reclaimed land before allocating different land use nique of China published by the State Oceanic Administra-
types. Better understanding of such vulnerability will also tion (2022) was utilized to validate the inundation situation
provide crucial support to stakeholders for them to generate in Shanghai. The simulation results were in good agreement
sustainable effective coastal protection strategies. with the published descriptions and in line with previous
Generally, the mouth of Yangtze River, Hangzhou Bay, studies in Shanghai (Chen and Wang, 2000; French, 2001;
Chongming and Hengsha islands, and the riverbank along Hu et al., 2005; Hu and Jin, 2007; Ge, 2010; Yin, 2011; Yin
the Dazhi and Huangpu rivers were the most seriously af- et al., 2013; Harwood et al., 2014).
Nat. Hazards Earth Syst. Sci., 22, 931–945, 2022 https://doi.org/10.5194/nhess-22-931-2022S. Dong et al.: Mesoscale simulation of typhoon-generated storm surge 941
Figure 8. Distribution of the maximum inundation area and depth in Shanghai during typhoons (a) Winnie and (b) Wipha.
The results from this study also suggested that the height ably needed to pay more attention to the river basins. How-
of storm surge along the Huangpu River and Dazhi River ever, results from this study show that the river basins of
basin was high, and the riverbanks experienced serious flood- the Dazhi and Huangpu rivers were among the most seri-
ing during typhoon-induced storm surge, which was also re- ously impacted areas during typhoons Winnie and Wipha.
ported by the oceanic disaster communique of China pub- Mesoscale (1–100 km in length) studies on storm surge have
lished by the State Oceanic Administration (2022). Previous not been conducted for Shanghai, and the mesoscale frame-
studies have failed to capture these features (Chen and Wang, work in this study fills the gap.
2000; French, 2001; Hu et al., 2005; Hu and Jin, 2007; Ge, Large- and small-scale simulations do each have their own
2010; Yin, 2011; Yin et al., 2013; Harwood et al., 2014). advantages. For example, large-scale simulations require low
consumption of computation resources and time depending
on the resolution used. Large-scale studies therefore could
5 Discussion be applied on a national scale to analyze typhoon storm surge
impacts, to simulate typhoons and storm surge changes over
For typhoon storm surge modeling in this study, we demon-
time, and to provide necessary data to propose general plans
strate that a mesoscale simulation can be used to compute
for hazard mitigation. Small-scale simulations usually in-
storm surge inundation and assess the inundation vulnera-
volve fine spatial resolutions, ranging from 5 to 100 m, in
bility of different land use types. This study enlarges the
order to capture subtle changes in the flood waters. Nonethe-
body of knowledge on storm surge studies in Shanghai and
less, neither large- nor small-scale simulations always fit for
also proposes that a mesoscale simulation can be used for
coastal planning purposes. Large-scale simulation is not suit-
coastal planning purposes. Previous studies of storm surge
able for local planning because its coarse spatial resolution
were usually conducted at national or local levels (Butler et
cannot reflect the detailed distribution of storm surge inunda-
al., 2012; Dietrich et al., 2011a). In China, most of these stud-
tion. Although numerical simulation, in the context of coastal
ies tended to emphasize the significance of numerical mod-
planning, requires a significant number of accurate and de-
eling of storm surge and risk analysis either for the coastline
tailed computation results at a regional level, high spatial
on a large spatial scale (> 100 km in length) (Tan et al., 2011;
resolution at the local scale will have high costs in terms
Yin, 2011; Zheng, 2010) or for the small-scale coastal area
of computation resources and time. For example, a small-
(1–1000 m in length) with fine-resolution simulations (Xie,
scale model with a fine-spatial-resolution mesh of 100 m–
2010; Xie et al., 2010; Ye, 2011; Zhang et al., 2006). The
1 km was initially used in this study, covering only the estu-
majority of these studies concentrated on three districts in
ary and coastal area. It required over 600 h to run one sim-
the Shanghai coastal area, namely the Pudong, Jinshan and
ulation on a computer with 16 GB RAM, 500 GB SSD and
Fengxian districts (Xie, 2010; Ye, 2011). These studies prob-
https://doi.org/10.5194/nhess-22-931-2022 Nat. Hazards Earth Syst. Sci., 22, 931–945, 2022942 S. Dong et al.: Mesoscale simulation of typhoon-generated storm surge Figure 9. (a) Location of the survey line (blue) and six survey points (red) along the south bank of the reclamation project around Hengsha Island, as well as distribution of water level (m) at the survey points during (b) Winnie and (c) Wipha. Sources: Esri, DigitalGlobe, GeoEye, i-cubed, USDA FSA, USGS, AEX, GetMapping, AeroGRID, IGN, IGP, swisstopo and the GIS user community. quad-core Intel Core i5 processors. Compared to the 600 h The simulations conducted in this study have enlarged the of computation time of the small-scale model, the multi- body of knowledge about storm surge inundation in Shang- nested mesoscale model only required about 30 h to run a hai and suggested that more attention needs to be paid not single simulation with reasonable accuracy where required. only to the area along the coastline but also to the nearby Mesoscale studies could therefore not only fulfill the require- rivers. Some studies in Shanghai started to look at the inun- ments for simulation accuracy but also take less time and re- dation along Huangpu River caused by typhoon storm surge sources. They are more suitable for use when a large num- (Borsje et al., 2011; Yin et al., 2013). Globally, the work con- ber of simulations are required over a long timescale. By im- ducted by Rupp and Nicholls (2002) on the river Thames plementing this mesoscale model, the focus of storm surge emphasized the interaction of surge and tide in river basins. simulation is at an appropriate medium scale to fit planning Ali (1996) also demonstrated in their study that the most se- purposes. Nat. Hazards Earth Syst. Sci., 22, 931–945, 2022 https://doi.org/10.5194/nhess-22-931-2022
S. Dong et al.: Mesoscale simulation of typhoon-generated storm surge                                                                943

vere inundation area during a synthetic typhoon in eastern           References
North Carolina was in the Pamlico River region.

                                                                     Aerts, J. C., Botzen, W. W., Emanuel, K., Lin, N., De Moel,
6   Conclusions                                                        H., and Michel-Kerjan, E. O.: Evaluating flood resilience
                                                                       strategies for coastal megacities, Science, 344, 473–475,
                                                                       https://doi.org/10.1126/science.1248222, 2014.
This paper developed a resource- and time-efficient approach
                                                                     Ali, A.: Vulnerability of Bangladesh to climate change and sea
for simulating typhoon-generated storm surge, which can be             level rise through tropical cyclones and storm surges, Water Air
applied to coastal megacities around the world even where              Soil Pollut., 92, 171–179, https://doi.org/10.1007/BF00175563,
flood observation data are inadequate. Typhoon-induced                 1996.
storm surge was simulated in Shanghai, and inundation maps           Bode, L., and Hardy, T. A.: Progress and recent developments
were drawn in ArcGIS. These maps provide a clearer picture             in storm surge modeling, J. Hydraul. Eng., 123, 315–331,
of the spatial distribution of and the variation in such vul-          https://doi.org/10.1061/(ASCE)0733-9429(1997)123:4(315),
nerability for Shanghai. Results showed the south of Shang-            1997.
hai, the riverbanks along the Huangpu and Dazhi rivers, and          Borsje, B. W., van Wesenbeeck, B. K., Dekker, F., Paalvast, P.,
most of Chongming Island were subject to serious typhoon               Bouma, T. J., van Katwijk, M. M., and de Vries, M. B.: How eco-
storm surge inundation. It also showed that reclamation land,          logical engineering can serve in coastal protection, Ecol. Eng.,
                                                                       37, 113–122, https://doi.org/10.1016/j.ecoleng.2010.11.027,
such as that on Hengsha Island, is particularly vulnerable to
                                                                       2011.
storm surge inundation. The mesoscale simulation method              Butler, T., Altaf, M. U., Dawson, C., Hoteit, I., Luo, X., and Mayo,
proposed in this study provides a realistic storm surge inun-          T.: Data assimilation within the advanced circulation (ADCIRC)
dation result at the city level. Furthermore, due to its low data      modeling framework for hurricane storm surge forecasting, Mon.
and time consumption, this approach can be implemented                 Weather Rev., 140, 2215–2231, https://doi.org/10.1175/MWR-
when a large number of models are required for mitigation              D-11-00118.1, 2012.
and planning.                                                        Chen, M. and Wang, S.: Storm-tide disaster and its fore-
                                                                       cast in Shanghai city, Journal of Catastrophology 15, 26–29,
                                                                       https://doi.org/10.3969/j.issn.1000-811X.2000.03.005, 2000 (in
Data availability. Data can be found in the publication of             Chinese).
Dong (2022).                                                         Cheung, K. F., Phadke, A. C., Wei, Y., Rojas, R., Douyere, Y.
                                                                       M., Martino, C. D., Houston, S. H., Liu, P. F., Lynett, P. J.,
                                                                       Dodd, N., and Liao, S.: Modeling of storm-induced coastal flood-
Author contributions. SD and SW devised the numerical experi-          ing for emergency management, Ocean Eng., 30, 1353–1386,
ments. SD carried out the numerical simulations and analysis of        https://doi.org/10.1016/S0029-8018(02)00133-6, 2003.
the results. ZC and JG supplied the validation data and commented    Choi, B. H., Eum, H. M., and Woo, S. B.: A synchronously coupled
and advised on model construction and outputs. SD, WJS and SW          tide–wave–surge model of the Yellow Sea, Coast. Eng., 47, 381–
prepared the manuscript.                                               398, https://doi.org/10.1016/S0378-3839(02)00143-6, 2003.
                                                                     Davis, J. R., Paramygin, V. A., Forrest, D., and Sheng, Y. P.: Toward
                                                                       the probabilistic simulation of storm surge and inundation in a
                                                                       limited-resource environment, Mon. Weather Rev., 138, 2953–
Competing interests. The contact author has declared that neither
                                                                       2974, https://doi.org/10.1175/2010MWR3136.1, 2010.
they nor their co-authors have any competing interests.
                                                                     Dietrich, J. C., Westerink, J. J., Kennedy, A. B., Smith, J. M.,
                                                                       Jensen, R. E., Zijlema, M., Holthuijsen, L. H., Dawson, C., Luet-
                                                                       tich, R. A., Powell, M. D., and Cardone, V. J.: Hurricane Gus-
Disclaimer. Publisher’s note: Copernicus Publications remains          tav (2008) waves and storm surge: hindcast, synoptic analysis,
neutral with regard to jurisdictional claims in published maps and     and validation in Southern Louisiana, Mon. Weather Rev., 139,
institutional affiliations.                                            2488–2522, https://doi.org/10.1175/2011MWR3611.1, 2011a.
                                                                     Dietrich, J. C., Zijlema, M., Westerink, J. J., Holthuijsen,
                                                                       L. H., Dawson, C., Luettich Jr., R. A., Jensen, R. E.,
Acknowledgements. The authors would like to acknowledge the            Smith, J. M., Stelling, G. S., and Stone, G. W.: Mod-
University of Otago PhD scholarship to Shuyun Dong which was           eling hurricane waves and storm surge using integrally-
the sole source of funding for this work and DHI for access to         coupled, scalable computations, Coast. Eng., 58, 45–65,
MIKE 21.                                                               https://doi.org/10.1016/j.coastaleng.2010.08.001, 2011b.
                                                                     Dietrich, J. C., Tanaka, S., Westerink, J. J., Dawson, C. N.,
                                                                       Luettich, R. A., Zijlema, M., Holthuijsen, L. H., Smith, J.
Review statement. This paper was edited by Paolo Tarolli and re-       M., Westerink, L. G., and Westerink, H. J.: Performance of
viewed by Brian Finlayson and three anonymous referees.                the unstructured-mesh, SWAN + ADCIRC model in comput-
                                                                       ing hurricane waves and surge, J. Sci. Comput., 52, 468–497,
                                                                       https://doi.org/10.1007/s10915-011-9555-6, 2012.

https://doi.org/10.5194/nhess-22-931-2022                                      Nat. Hazards Earth Syst. Sci., 22, 931–945, 2022
944 S. Dong et al.: Mesoscale simulation of typhoon-generated storm surge Dong, S.: Mesoscale simulation of typhoon-generated storm surge, China Normal University (Natural Science), 2005, 177–182, OSFHOME [data set], https://doi.org/10.17605/OSF.IO/94VFU, https://doi.org/10.1111/j.1745-7254.2005.00209.x, 2005 (in Chi- 2022. nese). Dutta, D., Herath, S., and Musiake, K.: A mathematical Huang, Y., Weisberg, R. H., and Zheng, L.: Coupling of model for flood loss estimation, J. Hydrol., 277, 24–49, surge and waves for an Ivan-like hurricane impacting the https://doi.org/10.1016/S0022-1694(03)00084-2, 2003. Tampa Bay, Florida region, J. Geophys. Res., 115, C12009, Elsaesser, B., Bell, A. K., Shannon, N., and Robinson, C.: Storm https://doi.org/10.1029/2009JC006090, 2010. surge hind and forecasting using Mike21FM - Simulation of Jakobsen, F. and Madsen, H.: Comparison and further development surges around the Irish Coast, in: Proceedings of the DHI Interna- of parametric tropical cyclone models for storm surge modelling, tional User Conference, Copenhagen, Denmark, 6–8, September J. Wind Eng. Ind. Aerod., 92, 375–391, 2004. 2010. Jia, A., Wang, Y., and Yang, Q.: Research on Inunda- Flather, R., Smith, J., Richards, J., Bell, C., and Blackman, D.: Di- tion Loss Assessment Model for Farmland, Journal of rect estimates of extreme storm surge elevations from a 40-year Water Resources and Architectural Engineering, 9, 15–18, numerical model simulation and from observations, The Global https://doi.org/10.3969/j.issn.1672-1144.2011.06.005, 2011 (in Atmosphere and Ocean System, 6, 165–176, 1998. Chinese). Frazier, T. G., Wood, N., Yarnal, B., and Bauer, D. H.: Influence Jiang, Y., Kirkman, H., and Hua, A.: Megacity development: man- of potential sea level rise on societal vulnerability to hurricane aging impacts on marine environments, Ocean Coast. Manage., storm-surge hazards, Sarasota County, Florida, Appl. Geogr., 30, 44, 293–318, https://doi.org/10.1016/S0964-5691(01)00052-7, 490–505, https://doi.org/10.1016/j.apgeog.2010.05.005, 2010. 2001. French, P. W.: Coastal defences: processes, prob- Lowe, J., Gregory, J., and Flather, R.: Changes in the occurrence lems and solutions, Psychology Press, 384 pp., of storm surges around the United Kingdom under a future cli- https://doi.org/10.4324/9780203187630, 2001. mate scenario using a dynamic storm surge model driven by Fritz, H. M., Blount, C. D., Albusaidi, F. B., and Al-Harthy, A. H. the Hadley Centre climate models, Clim. Dynam., 18, 179–188, M.: Cyclone Gonu storm surge in Oman, Estuar. Coast. Shelf S., https://doi.org/10.1007/s003820100163, 2001. 86, 102–106, https://doi.org/10.1016/j.ecss.2009.10.019, 2010. Molteni, F., Buizza, R., Palmer, T. N., and Petroliagis, T.: Funakoshi, Y., Hagen, S. C., and Bacopoulos, P.: Coupling of The ECMWF ensemble prediction system: Methodology hydrodynamic and wave models: Case study for Hurricane and validation, Q. J. Roy. Meteor. Soc., 122, 73–119, Floyd (1999) hindcast, J. Waterway Port C., 134, 321–335, https://doi.org/10.1002/qj.49712252905, 1996. https://doi.org/10.1061/(ASCE)0733-950X(2008)134:6(321), Ogie, R. I., Adam, C., and Perez, P.: A review of structural approach 2008. to flood management in coastal megacities of developing nations: Ge, J.: Multi Scale FVCOM Model System for the East China Sea current research and future directions, J. Environ. Plann. Man., and Changjiang Estuary and Its Applications, PhD thesis, unpub- 63, 127–147, https://doi.org/10.1080/09640568.2018.1547693, lished, East China Normal University, China, 2010 (in Chinese). 2019. Ge, J., Ding, P., Chen, C., Hu, S., Fu, G., and Wu, L.: An inte- Peng, M., Xie, L., and Pietrafesa, L. J.: A numerical study grated East China Sea–Changjiang Estuary model system with of storm surge and inundation in the Croatan–Albemarle– aim at resolving multi-scale regional–shelf–estuarine dynamics, Pamlico Estuary System, Estuar. Coast. Shelf S., 59, 121–137, Ocean Dynam., 63, 881–900, https://doi.org/10.1007/s10236- https://doi.org/10.1016/j.ecss.2003.07.010, 2004. 013-0631-3, 2013. Rankine, W. J. M.: A manual of applied mechanics, Charles Griffin Haigh, I. D., Wijeratne, E. M. S., MacPherson, L. R., Pattiaratchi, and Company, 652 pp., 1872. C. B., Mason, M. S., Crompton, R. P., and George, S.: Es- Rupp, S. and Nicholls, R. J.: Managed realignment of coastal flood timating present day extreme water level exceedance proba- defences: a comparison between England and Germany, in: Pro- bilities around the coastline of Australia: tides, extra-tropical ceedings of Dealing with Flood Risk Interdisciplinary Seminar of storm surges and mean sea level, Clim. Dynam., 42, 121–138, the Regional Implications of Modern Flood Management, Delft, https://doi.org/10.1007/s00382-012-1652-1, 2014. Delft Hydraulics, 1–9, 2002. Harper, B. and Holland, G.: An updated parametric model of the Savioli, J., Pedersen, C., Szylkarski, S., and Kerper, D.: Modelling tropical cyclone, in: Proc. 23rd Conf. Hurricanes and Tropical the threat of tropical cylone storm tide to the Burdekin Shire, Meteorology, Dallas, TX, 10–15 January, 1999, 1999. Queensland Australia, in: Coasts & Ports 2003 Australasian Con- Harwood, S., Carson, D., Wensing, E., and Jackson, L.: Natural haz- ference: Proceedings of the 16th Australasian Coastal and Ocean ard resilient communities and land use planning: the limitations Engineering Conference, the 9th Australasian Port and Harbour of planning governance in tropical Australia, Journal of Geogra- Conference and the Annual New Zealand Coastal Society Con- phy & Natural Disasters, 4, 1–15, https://doi.org/10.4172/2167- ference, Institution of Engineers, Australia, p. 285, 2003. 0587.1000130, 2014. Shanghai Municipal Planning and Land & Resources Adminis- Holland, G. J.: An analytic model of the wind and pressure profiles tration: Shanghai Master Plan (2010–2030), Shanghai Munici- in hurricanes, Mon. Weather Rev., 108, 1212–1218, 1980. pal Planning and Land & Resources Administration, Shanghai, Hu, C. and Jin, Y.: Storm surge disaster in Shanghai: Quasi- 31 pp., 2010 (in Chinese). periodicity and prediction, Urban Roads Bridges & Flood Con- Shanghai Nongken Chronicles Compilation Committee: Shang- trol, 26–29, 2007. hai Nongken Chronicles, Shanghai Academy of Social Sciences Hu, D., Gong, M., and Yazhen, K.: Study of the influ- Press, Shanghai, 765 pp., 2004 (in Chinese). ence of strong storm surges in Shanghai, Journal of East Nat. Hazards Earth Syst. Sci., 22, 931–945, 2022 https://doi.org/10.5194/nhess-22-931-2022
You can also read