Analytical Research on the Impact Test of Light Steel Keel and Lightweight Concrete of Composite Wall - MDPI
←
→
Page content transcription
If your browser does not render page correctly, please read the page content below
applied
              sciences
Article
Analytical Research on the Impact Test of Light Steel Keel and
Lightweight Concrete of Composite Wall
Jianyu Yang, Jiaming Zou and Weijun Yang *

                                          School of Civil Engineering, Changsha University of Science and Technology, Changsha 410014, China;
                                          jianyuy@csust.edu.cn (J.Y.); 21002020044@stu.csust.edu.cn (J.Z.)
                                          * Correspondence: yyyaozhijian@163.com

                                          Abstract: In order to study the impact resistance of light steel keel and lightweight concrete of
                                          composite walls (LSKLCW) under low-velocity impact, four composite wall specimens were designed
                                          to conduct dynamic simulation impact tests, and the failure mode, time-history curves of strain and
                                          displacement were analyzed and studied using test equipment and a loading system. The results
                                          show that the failure characteristics of the composite wall sample were elastic–plastic. Moreover,
                                          the vertical displacement and strain at the most unfavorable collision point were linearly related to
                                          the impingement height. Furthermore, the capacity of the composite wall (such as crack resistance,
                                          elastic–plastic deformation and energy dissipation) was affected by the concrete strength and the
                                          arrangement of the light steel netting. In addition, the impact resistance of the wall was significantly
                                          improved when the concrete strength was enhanced and the light steel netting was installed. Lastly,
                                          the test results were fitted and verified through the impact force calculation model of the composite
                                          wall, and then the accuracy of the test model was analyzed. The certain experimental basis and
                                          theoretical analysis basis for the impact resistance research of the composite wall can be provided by
                                          these research results.


                                          Keywords: composite wall; impact; experimental study; failure modes; time-history analysis
Citation: Yang, J.; Zou, J.; Yang, W.
Analytical Research on the Impact
Test of Light Steel Keel and
Lightweight Concrete of Composite
Wall. Appl. Sci. 2022, 12, 2957.
                                          1. Introduction
https://doi.org/10.3390/                       Nowadays, the construction industry is developing and innovating in the direction
app12062957                               of green energy saving, environmental protection and safety. LSKLCW have been widely
                                          used in construction in recent years because of their better fire resistance, heat and sound
Academic Editor: Marek Krawczuk
                                          insulation and other performance aspects. Scholars have carried out preliminary research
Received: 19 February 2022                and exploration on multiple types and different combinations of composite walls. Research
Accepted: 10 March 2022                   has shown that composite walls have good deformation or energy dissipation capabilities
Published: 14 March 2022                  and other excellent performance characteristics [1–5]. In addition, the research field of the
Publisher’s Note: MDPI stays neutral
                                          impact resistance of composite walls is gradually attracting more attention. Scholars at
with regard to jurisdictional claims in   home and abroad have carried out a series of work in the field of impact [6–11]. However,
published maps and institutional affil-   there are few studies on the impact resistance of composite walls under low-speed impact
iations.                                  and the variation law of impact force.
                                               During the engineering application process, the composite wall will experience various
                                          impact effects, such as collision in the process of installation and transportation, impact,
                                          explosion and external impact. Among them, the building safety of composite walls will be
Copyright: © 2022 by the authors.         affected by low-speed impacts. Therefore, studying the effect of impact on its performance
Licensee MDPI, Basel, Switzerland.        and the law of impact force change has practical guiding significance for the impact research
This article is an open access article    of composite walls. In this paper, four composite wall specimens were produced to study
distributed under the terms and
                                          the impact resistance of LSKLCW, and the dynamic measurement method [12] was adopted
conditions of the Creative Commons
                                          to collect the date of the impact test. In addition, the failure form, strain time-history curve
Attribution (CC BY) license (https://
                                          and displacement time-history curve of the composite wall were collected and analyzed
creativecommons.org/licenses/by/
                                          after the impact test. Moreover, based on the law of conservation of kinetic energy and the
4.0/).

Appl. Sci. 2022, 12, 2957. https://doi.org/10.3390/app12062957                                               https://www.mdpi.com/journal/applsci
Appl. Sci. 2022, 12, 2957                                                                                                2 of 14

                            momentum theorem, a numerical model was established and the accuracy of the model
                            was verified by the test results. Finally, the result provides a certain experimental basis and
                            theoretical analysis basis for the impact resistance research of composite walls.

                            2. Test Overview
                            2.1. Specimen Design and Production
                                 In order to reasonably simulate the situation of the composite wall under the low-speed
                            impact in the actual scenario and design a comparison test group to study the response of
                            the components inside the composite wall under low-speed impact, four composite wall
                            specimens were designed and manufactured, which were numbered W1, W2, W3 and W4.
                            The design dimensions of the test piece are shown in Figure 1. Three cold-formed thin-
                            walled light steels were arranged inside each test piece as vertical force-bearing skeletons,
                            and the skeleton spacing was set to 300 mm. Moreover, after setting the comparative test
                            parameters, the specific parameters of each wall specimen were as shown in Table 1. The
                            solid model of the specimen after pouring and curing is shown in Figure 2.

                            Figure 1. Size design drawing of LSKLCW. (a) Front size; (b) Cross-section size.

                            Table 1. Parameters of LSKLCW test.

                                                                           Wall        Whether to Set          Lightweight
                               Serial      Specimen        Section
                                                                          Height,      Up Light Steel           Concrete,
                              Number        Number        Size, mm
                                                                           mm              Mesh                   MPa
                                 1            W1          140 × 600        1200              Yes               No setting
                                 2            W2          140 × 600        1200              Yes                   8
                                 3            W3          140 × 600        1200              Yes                  10
                                 4            W4          140 × 600        1200              No                    8

                                 In Table 1, the selected model type of steel is S350GD, and the yield strength is
                            435 MPa. Then, the elastic modulus of the steel is 2.06 × 10⁵ N/mm2 , the density is around
                            7.85 g/cm3 , and the coefficient of linear thermal expansion is 1.2 × 10⁻⁵ ◦ C.
Appl. Sci. 2022, 12, 2957                                                                                         3 of 14

                            Figure 2. Solid model diagram of test piece. (a) W1; (b) W2; (c) W3; (d) W4.

                            2.2. Test Equipment and Loading System
                                 We selected a DH3822 portable dynamic signal test and analysis system, LVDT digital
                            acquisition recorder, dynamic displacement meter and other dynamic measurement as test
                            equipment. In addition, this test system can quickly feedback the real-time changes in the
                            measurement point strain in the test, and these instruments are used frequently in tests
                            because of their intelligent and convenient mechanism. Furthermore, partial parameters
                            and connection methods of the DH3822 portable dynamic signal test and analysis system are
                            shown in Figure 3. Moreover, the LVDT digital acquisition recorder, including the different
                            inductance-type transducer and Lab-VIEW analysis software, and partial parameters of
                            LVDT are shown in Figure 4.

                            Figure 3. Partial parameters and connection methods of DH3822. (a) Parameter; (b) Connection
                            method.

                                In the test, the 30 kg standard sandbag was selected as the collision object and the
                            impact height was chosen as a parameter variable; the loading test was carried out in
                            two groups of different impact heights. In addition, the test process was recorded by the
                            experimental instrument, and measurements of each set of data were separated by 1 h.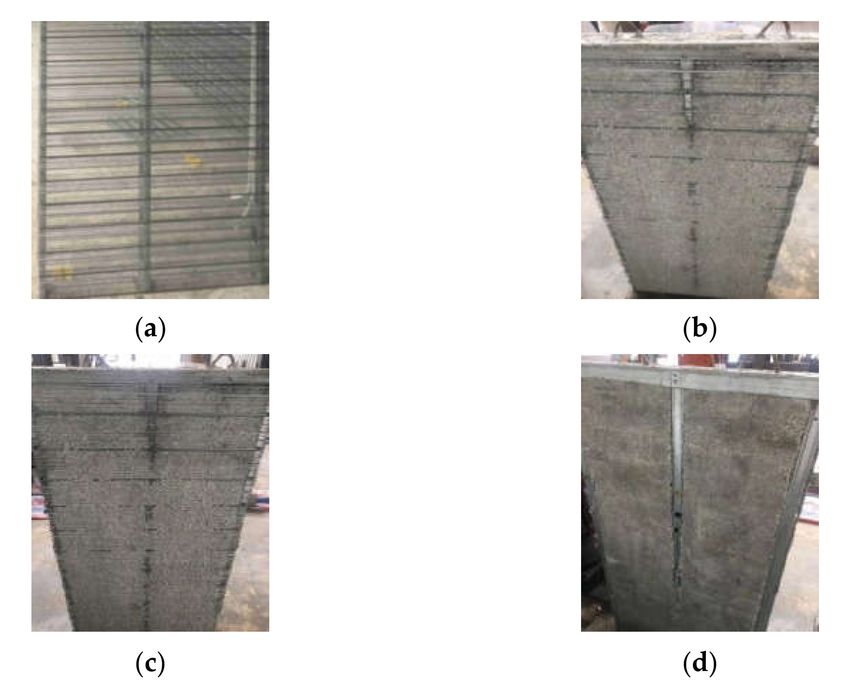
Appl. Sci. 2022, 12, 2957                                                                                          4 of 14

                            Figure 4. Partial parameters of LVDT.

                            2.3. Measuring Method and Measuring Point Layout
                                 Furthermore, the low-speed collision process in actual engineering problems can
                            be simulated by the free-release form, which adopts the falling sandbag [13,14]. The
                            arrangement of strain measuring points on the contact surface of the test piece is shown in
                            Figure 5. Moreover, the vertical displacement at the most unfavorable position in the center
                            of the wall specimen under impact was measured by the dynamic displacement meter.
                            They were respectively arranged on the back side of the impact surface of the composite
                            wall. In the vertical displacement test, these measuring points were set on the center
                            and circumference of each test piece. In addition, the layout of the vertical displacement
                            measuring points is shown in Figure 6. Furthermore, all measuring points were arranged
                            after each piece was installed, with the panel and the layout of the test shown in Figure 7.

                            Figure 5. Layout drawing of strain measuring point of specimen.

                            Figure 6. Displacement measuring point arrangement on the back side of the specimen.

                            Figure 7. Test layout. (a) Wire layout; (b) Device connection.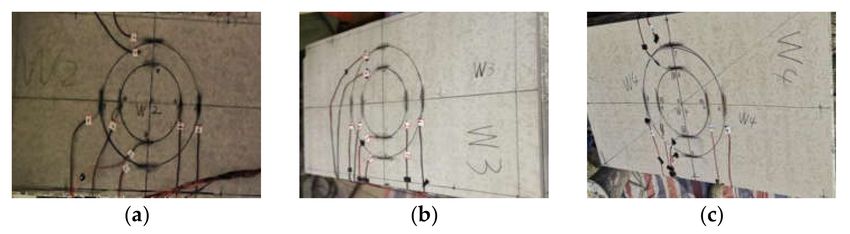
Appl. Sci. 2022, 12, 2957 5 of 14
In Figure 5, a circle with a diameter of 250 mm and another with a diameter of 350 mm
are shown in the center of the test piece, and the strain measuring points were installed on
the circumference of each circle. In addition, points 1 to 8 were the strain measuring point
positions on the contact surface, where the length and width are given in millimeters.
In Figure 6, points 1 to 5 are the vertical displacement measuring point positions.
Among them, point 1 was set at the center of the circle as the most unfavorable point, and
points 2 to 4 were set on a circle with a diameter of 250 mm. Length and width are in
millimeters.
In Figure 7, the wire layout of one of the specimens as a demonstration is shown in
Figure 7a. The device connection of the test is shown in Figure 7b.
3. Low-Speed Impact Test Process
The test process of W1 under an impact height of one meter is shown in Figure 6.
Before the start of the test, a tape measure was used to focus the center point of collision
between the suspended sandbag and the composite wall, as shown in Figure 8a. In addition,
the falling process of the sandbag showed that the decreasing rate of the sandbags in unit
time increased, as shown in Figure 8b,c. Moreover, a small deformation occurred on
the impact area and the compression deformation of the sandbag under the cushioning
extrusion of the impact surface could be observed by the naked eye, as shown in Figure 8d.
Figure 8. Test process diagram of W1. (a) Cross-center correction; (b) Falling process; (c) Moments
before fall contact; (d) Collision contact.
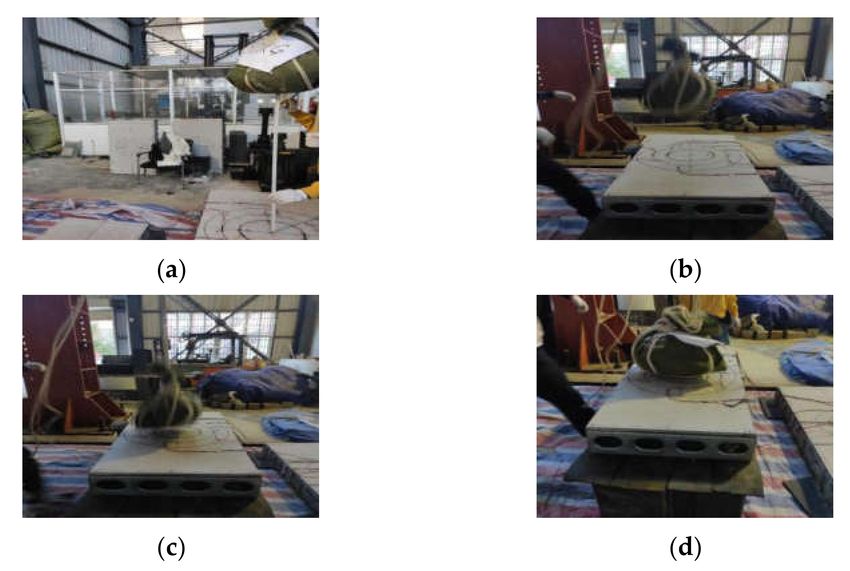
In order to reduce the influence of the compressional deformation and make the impact
force generated by the falling object more evenly and effectively act on the collision surface,
the sandbag was tied up before the impact test of W2, W3 and W4, and then the progress of
the W1 test was repeated, as shown in Figure 9. In addition, the failure from of W2, W3,
W4 at different impact heights was similar. Since the concrete slurry was poured into these
wall specimens, the impact test results showed that the impact resistance of the W2, W3
and W4 wall specimens was significantly improved. In addition, after the impact test, there
was no obvious deformation or visible cracks or depressions on the collision surfaces of
these test pieces, and these specimens showed better overall stability.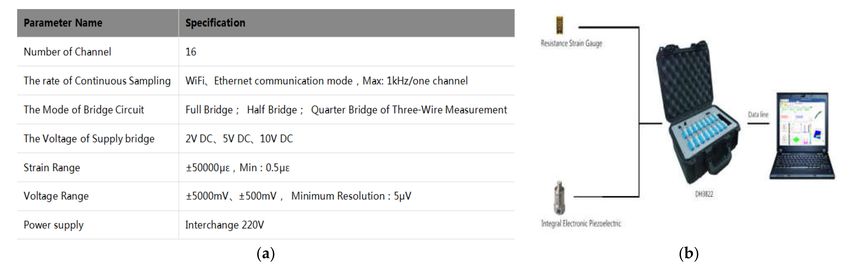
Appl. Sci. 2022, 12, 2957                                                                                        6 of 14

                            Figure 9. Test process diagram of W2, W3 and W4. (a) W2; (b) W3; (c) W4.

                                 Furthermore, the deformation trend of the specimens under low-speed impact was
                            similar. As the result, the W1 specimen was taken as a typical failure morphology for
                            analysis. The failure form of W1 without grouting concrete inside was more serious than
                            that of W2, W3, W4. Under the impact of the sandbag, the panel sank and cracked, and
                            the panel was obviously sinking at the most unfavorable collision point within the contact
                            range. In addition, the cracks in the impact area of the W1 specimen were densely and
                            widely distributed, spreading out from the center to the surrounding area, as shown in
                            Figure 10.

                            Figure 10. Destruction morphology diagram of W1 specimen.

                                 Then, the damage patterns of the W2, W3 and W4 specimens were found to be basically
                            similar, and the damage degree of the wall under the two sets of different impact height
                            tests was not significant. After the collision, the panel had no obvious depression or
                            deformation, and no cracks appeared on the collision surface. Moreover, after these test
                            pieces were subjected to impact, the strain gauges on each measuring point could work
                            normally, as shown in Figure 11. Figure 11 shows that the concrete in the composite wall
                            can well absorb most of the energy generated by the impact, and these specimens only
                            produce small deformations under the action of low-speed impact.

                            Figure 11. Damage diagrams of W2, W3 and W4 specimens after being impacted. (a) W2; (b) W3;
                            (c) W4.

                            4. Test Results and Analysis of Time-History Curve
                            4.1. Strain Time-History Curve
                                According to the data from the test, the strain versus time curve of each measuring
                            point of each test piece under different impact heights was obtained through the data
                            acquisition system and software analysis. The W1 specimen was used as a typical specimen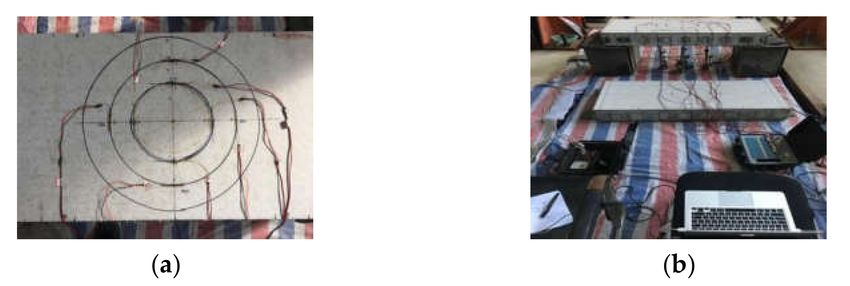
Appl. Sci. 2022, 12, 2957                                                                                         7 of 14

                            for experimental analysis under the impact of an impact height of 1 m. The strain time-
                            history curves of each measurement point of the W1 to W4 specimens are shown in
                            Figure 12.

                            Figure 12. Strain time-history curves of W1 to W4. (a) W1; (b) W2; (c) W3; (d) W4.

                                 As shown in Figure 12, the changes in strain of each measurement at any moment
                            were recorded by the instrument. In order to distinguish and describe the strain curves
                            for each measured point, the curves were processed through different colors and different
                            shapes of icons.
                                 In Figure 12a, the record starts from the effective contact time of 0.6 s. The damaged
                            W1 specimen was analyzed by the strain time0history curve of other specimens and failure
                            forms. Figure 12 indicates that falling objects collide with the contact surface of the wall
                            within a short contact time in the range of 0.61 s to 0.62 s and the strain of the measuring
                            point increases rapidly. However, the curve of measuring point 8 showed an upward
                            phenomenon and did not appear in a descending stage. The strain gauge was damaged due
                            to the crack development of measuring point 8, which caused the strain change to exceed
                            the measuring range of the strain gauge. The result was basically in line with the test.
                            Furthermore, the strain change from measuring point 1 to measuring point 7 was similar to
                            measuring point 8, but the change was relatively small. Analyzing the failure morphology
                            of W1, the cracking failure from measuring point 1 to measuring point 7 developed rapidly;
                            the panel cracking released most of the energy, and the crack development did not pass
                            through the measurement area of the strain gauge. The results were basically consistent
                            with the test.
                                 Moreover, as shown in Figure 12, the trend of tensile tension and compression of
                            these strain curves was different as these strain gauges were glued to the specimens in a
                            horizontal and vertical manner. In order to obtain the maximal response variable, we only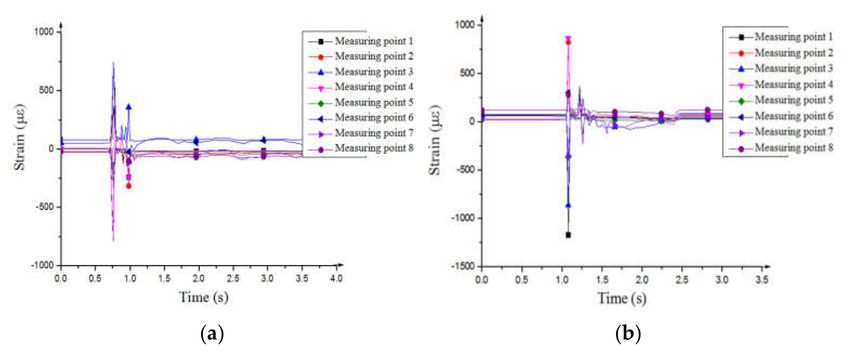
Appl. Sci. 2022, 12, 2957                                                                                                8 of 14

                            explored the increment in the strain gauge of each measuring point. The further cases of
                            strain change were analyzed as follows.
                                 Comparing and analyzing the strain time-history curves of W2, W3 and W4 specimens,
                            the time-varying law was similar. In the test, the W4 specimen was taken as a typical
                            specimen for test analysis and description. The strain time-history curves of W4 at the
                            impact height of 1 m and the impact height of 1.5 m are shown in Figure 13.

                            Figure 13. Strain time-history curve of W4 specimen; (a) Impact at a height of 1 m; (b) Impact at a
                            height of 1.5 m.

                                 Figure 13 illustrates that the impact height of the sandbag was proportional to the
                            degree of strain change. The strain at the measuring point changed sharply until reaching
                            the top, and then it decreased rapidly. After the wall was impacted, the elastic deformation
                            was recovered slowly, the strain decay rate gradually decreased, and the change in the
                            strain value gradually became stabilized after a short period of aging. The strain value
                            after the test of each measuring point was different from the initial strain, which indicates
                            that a certain small residual deformation occurred after the composite wall was impacted.
                                 Through comparative analysis of the results of the strain time-history curves of each
                            specimen, the strain change degree of W4 was found to be higher than that of W2 and
                            W3. The analysis showed that the influencing factors were mainly related to the light steel
                            formwork and the strength of the poured concrete. Comparing W2 and W4, the W2 test
                            piece was compared with the W4 test piece by adding a light steel mesh, which led to an
                            increase in the impact resistance of the composite wall test piece. Therefore, the strain
                            variation of the strain measuring point on the panel of W2 was smaller than that of W4.
                            Comparing W2 and W3, the concrete strength of W3 was higher than that of W2, which
                            resulted in W3 having better impact resistance. The deformation ability and measured
                            strain change degree of W3 were lower than those of W2.

                            4.2. Vertical Displacement Time-History Curve
                                  According to the analysis of the test results, the vertical displacement time-history
                            curves of the W2, W3 and W4 specimens had a certain similarity, so the W4 specimen was
                            taken as a typical result for analysis. The displacement time-history curves of W4 at the
                            impact height of 1 m and the impact height of 1.5 m are shown in Figure 14.
                                  It can be seen from Figure 14 that the vertical displacement of the measuring point
                            of W4 under the two different impact heights changed within a short recording time from
                            0.1 s to 0.2 s. Since measuring point 1 was located at the most unfavorable force position
                            in the center, and measuring points 2, 3, 4 and 5 were arranged on the circumference of a
                            circular contact area with a diameter of 250 mm, the vertical displacement of measuring
                            point 1 was greater than that of other measuring points.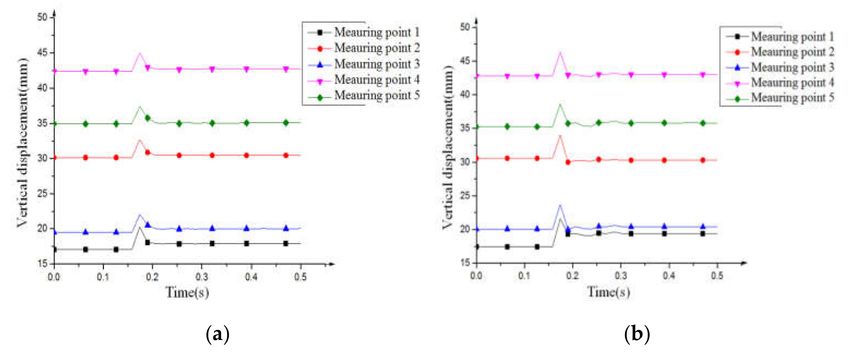
Appl. Sci. 2022, 12, 2957                                                                                            9 of 14

                            Figure 14. The displacement time-history curve of W4 specimen. (a) Impact at a height of 1 m;
                            (b) Impact at a height of 1.5 m.

                                  Furthermore, the vertical displacement of measuring points 1–5 was measured. It
                            seems that the maximum displacement values were measured at point 1 in theory when
                            the center of gravity of the sandbag coincided with the center of the specimen. This is
                            because measuring point 1 was under the most unfavorable position, and the data of point
                            1 in Figure 14 confirm this result. In addition, the difference in the displacement value
                            between point 1 and the other points was not large because the power of the low-speed
                            impact was small. Moreover, the displacement values at points 2–5 should be the same in
                            theory. However, there was a deviation in the results due to the effect of a test error and the
                            effect of the dimensions of the specimen. This situation was normal and reasonable.
                                  Moreover, the vertical displacement value recorded after 0.2 s was slightly higher
                            than the vertical displacement value recorded at the initial moment, which was due to the
                            elastic deformation performance of the wall. The recorded results show that there was a
                            dynamic process of slow recovery of deformation after the composite wall was subjected
                            to a low-speed collision. In addition, the vertical displacement change of each measuring
                            point under the impact height of 1.5 m was greater than that under the impact height of
                            1 m.
                                  By comparing the test results of W2, W3 and W4, it can be seen that the measured
                            maximum vertical displacement of the W3 specimen was smaller than that of W2. The
                            analysis results indicate that the concrete strength of the W3 specimen was higher than that
                            of W2, which led to an increase in the overall strength of the composite wall and enhanced
                            the impact resistance of the W3 specimen to a certain extent.
                                  It can be seen from the vertical displacement curve that the vertical displacement
                            change of the W4 specimen was higher than that of W2. The analysis result shows that
                            W4 was not equipped with light steel mesh, which resulted in the impact resistance of W4
                            being weaker than that of W2. In addition, the vertical displacement trend of the W2 and
                            W3 specimens under different impact heights was similar to that of W4.

                            4.3. Peak Strain at the Center of Collision
                                 Combined with the test data, the peak strains of the collision centers of the W2, W3
                            and W4 specimens are shown in Table 2. It can be seen that the peak strain of the collision
                            center point of the specimen in the impact test state was arranged from small to large as
                            W3, W2 and W4.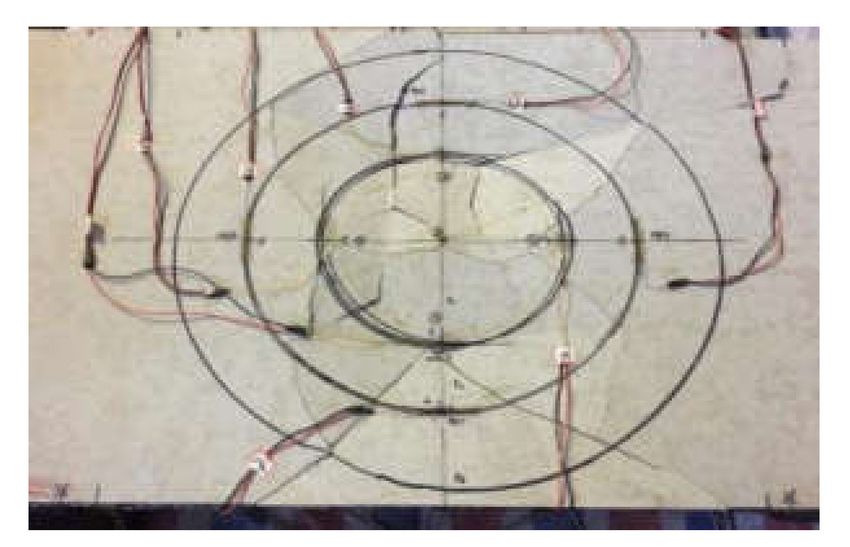
Appl. Sci. 2022, 12, 2957                                                                                                    10 of 14

                            Table 2. Results of peak strain at the center of collision.

                                 Specimen Number           Impact Height, m             Peak Strain at the Center of Collision, µε
                                        W2                           1                                   864.604
                                        W3                           1                                   688.905
                                        W4                           1                                   955.211
                                        W2                          1.5                                 1084.582
                                        W3                          1.5                                  886.314
                                        W4                          1.5                                 1190.876

                            4.4. Conversion Measurement Result of Maximum Impact Force Value
                                 The maximum impact test results of W2, W3 and W4 specimens were obtained from
                            the test data, which are shown in Table 3. The W1 specimen was used as a failure model for
                            comparative testing. Therefore, it was not included in the results.

                            Table 3. Results of maximum impact force test.

                                   Specimen Number                        Impact Height, m           Maximum Impact Value, kN
                                             W2                                    1                               5.364
                                             W3                                    1                               4.639
                                             W4                                    1                               6.872
                                             W2                                   1.5                              6.704
                                             W3                                   1.5                              5.982
                                             W4                                   1.5                              8.797

                                 It can be seen from Table 3 that the maximum impact force value was proportional
                            to the impact height, and the calculated values of maximum impact force were arranged
                            in descending order as W4, W2 and W3. In addition, the analysis result shows that the
                            light steel mesh can improve the impact resistance of the composite wall to a certain extent.
                            Moreover, the deformability of the composite wall would be affected by the strength of
                            concrete, and the impact resistance of the wall can be enhanced when the strength of the
                            concrete is increased.

                            5. Validation of Numerical Model of Test Impact Force
                                 The analysis of the test process was based on the law of conservation of kinetic energy
                            and the momentum theorem. In addition, the elastic–plastic deformation state of the
                            composite wall under impact would be considered. Simplified assumptions were made
                            when the experimental model based on the Hertz elastic collision model and Thornton
                            elastic-plastic theory were analyzed [15,16]. It is assumed that the collision between the
                            sandbag and the composite wall satisfies the Hertz contact theory. The assumptions are as
                            follows:
                            1.     The contact surface of the wall panel was regarded as a semi-infinite space.
                            2.     The wall was homogeneous, continuous and isotropic.
                            3.     The sandbag did not rotate.
                            4.     The falling objects of the sandbag were homogeneous and regular spheres.
                            5.     The direction of the sandbag falling speed was perpendicular to the wall panel.
                                 Before the plastic deformation zone was generated on the collision surface of the wall,
                            the condition of elastic contact was satisfied. In the elastic range, the relationship between
                            the elastic contact pressure and the compression of normal deformation can be described
                            by Equation (1), which is as follows:

                                                                                  4    1 3
                                                                           Pe =     ER 2 δ 2                                     (1)
                                                                                  3
Appl. Sci. 2022, 12, 2957 11 of 14
where Pe (kPa) is the pressure of elastic contact; E (N/m2 ) is the equivalent elastic modulus,
−1
1−ν21 1−ν22
E= E + E2 ; ν1 is the Poisson’s ratio of the sandbag; ν2 is the Poisson’s ratio
1
of the composite wall; E1 (N/m2 ) is the elastic modulus of the sandbag; E2 (N/m2 ) is the
−1
elastic modulus of the composite wall; R (m) is the equivalent radius, R = R1 + R12 ;
1
R1 (m) is the radius of the sandbag; R2 (m) is the radius of the wall panel and treated as
infinite, R2 → +∞ ; δ (m) is the compression of normal deformation.
Based on the Hertz elastic collision model, the radius of the contact surface between
two colliding objects r* (m) was assumed. The relationship between the elastic contact
pressure, the radius of the contact surface, the amount of deformation and the contact
pressure stress during a collision can be described by Equation (2). In addition, the rela-
tionship of the radius of the contact surface between the sandbag and the composite wall,
the equivalent radius and the compression of normal deformation can be described by
Equation (3). These equations are as follows:
3Pe
r 2 12
P(r) = 1− ∗ (2)
2πr∗ 2 r
1
r∗ = (Rδ)
2
(3)
where P(r) (MPa) is the compressive stress of the contact compression; r* (m) is the radius
of the contact surface between the sandbag and the composite wall; r (m) is the variable of
the radius of the contact, in the range of (0,r*).
We adopted Thornton’s elastic–plastic basic theory as the premise. The yield strength
of the contact object was taken as the critical point during collision. The plastic deformation
area would be formed on the collision surface when the yield strength of the collision object
is less than the limit value of the contact compressive stress. Considering the elastic–plastic
nature of the contact material and the material hardening under the dynamic loading
conditions (the process of the elastic–plastic change of the material), in order to simplify
the calculation process, the elastic–plastic property of the material was simplified to satisfy
the hypothetical condition. Furthermore, the relationship between the stress of the yield
pressure and the radius of the contact surface at the initial yield time can be established by
combining Equations (1)–(3), as shown in Equation (4).
2Ery
py = (4)
πR
where py (MPa) is the stress of the yield pressure in the plastic area of the collision contact
surface; ry (m) is the radius of the contact surface at the initial yield time.
According to the Hertz contact theory, it is assumed that the falling sandbag satisfies
the Von Mises yield criterion [17]. The calculation formula for the stress of the yield pressure
in the plastic area of the collision contact surface is as shown in Equation (5).
py = Cv Y (5)
where Cν is the contact coefficient, Cν = 1.234 + 1.256ν; ν is the Poisson ratio of the contact
material; Y (MPa) is the yield strength of the contact material.
Equations (2)–(5) were solved simultaneously to obtain the initial yield compression of
the normal deformation δy (m). Substituting the result into Equation (1), we can obtain the
initial yield compressive stress of the normal direction Py (kPa). The contact material can
be assumed as an ideal elastic–plastic material by the Thornton theory [18]. In addition, the
relationship between the compressive stress of the elastic–plastic contact compression at
the normal deformation and the normal compressive deformation was defined, as shown
in Equation (6):
Pep = Py + 2πRpy δ − δy (6)Appl. Sci. 2022, 12, 2957 12 of 14
where Pep (kPa) is the compressive stress of the elastic–plastic contact compression at the
normal deformation; Py (kPa) is the initial yield compressive stress of the normal direction,
1 3
Py = 43 ER 2 δy2 ; δy (m) is the initial yield compression of the normal deformation.
Through the analysis of energy conservation, it can be seen that the kinetic energy gen-
erated by the falling sandbag was mainly composed of the local elastic deformation energy,
the elastic–plastic deformation energy of the contact area and the overall bending deforma-
tion energy of the composite wall [19]. Integrating the conservation of momentum into the
equation, the maximum compression of the normal deformation under consideration of
elastic–plastic deformation can be obtained, as shown in Equation (7):
2 1 − ν2
1 2 1 2
Z δy Z δmax 24Pep 2
mv + mv = Pe (δ)dδ + Pep (δ)dδ + (7)
2 1 2 2
0 4 3 1 1
δy π E2 h ab a2 + b2
where δmax (m) is the maximum compression of the normal deformation under considera-
tion of elastic–plastic deformation.
By solving the integral Equation (7), one can determine the δmax . Considering the
strength characteristics and the impact resistance of various materials in the test, an em-
∗
pirical deformation magnification factor κ was given. Substituting δmax = κδmax into
Equation (6), the maximum impact force of the collision after considering the elastic–plastic
theory can obtained. After considering the coupling effect of the experimental composite
materials, the modified parameter reduction coefficients of LSKLCW were given. The
maximum impact force calculation model was obtained through the joint solution process,
as shown in Equation (8).
h i
Fmax = γ Py + 2πRpy δmax − δy (8)
where Fmax (kN) is the maximum impact force of the collision after considering the elastic–
plastic theory and the reduction factor of modified parameter; γ is the reduction factor of
the modified parameter.
Fitting analysis was based on the mathematical calculation model and test results. We
took the W4 specimen as a typical calculation example for fitting, and the results of the
fitting are shown below in Table 4.
Table 4. Data results comparison of the maximum impact force between test and theoretical calculation.
Result of Theoretical Contrast Ratio of Theoretical
Impact Height, m Test Result, kN
Calculation, kN Calculation to Test
1 6.87 7.31 1.06
1.5 8.79 8.98 1.02
It can be seen from Table 4 that the impact force test value was slightly smaller than
the calculated model algorithm value. The analysis shows that there were multiple friction
losses in the test, and the elastic modulus of the composite material was different in a
complex coupling state. Based on the influence of the above multiple factor, the test result
was smaller than the result of the theoretical calculation model. The ratio of the fitting
result of the composite wall specimen under the impact height of 1 m was 1.06, and the
ratio of the fitting result under the impact height of 1.5 m was 1.02. After verification, the
test calculation model was scientific and reasonable and applicable within the allowable
error range of the test.
6. Conclusions
The analysis of the strain and the displacement time-history curve show that the
impact process of the test of the composite wall was roughly divided into three stages:
elasticity, elastic–plastic and failure stages. Among them, the elasticity stage and the elastic–Appl. Sci. 2022, 12, 2957 13 of 14
plastic stage occupied most of the duration of the low-speed impact test, and the failure
stage was relatively short. The vertical displacement of the most unfavorable collision
point of the composite wall and the amount of strain were increased after the velocity of
the impact object increased and have a certain positive correlation. Moreover, the law of
the elastic–plastic change of the composite wall under the low-velocity impact was fed
back through the test, and the analysis basis of the composite wall in the impact resistance
research is provided by these results.
The impact resistance of composite wall specimens would be affected by the light
steel mesh, light steel framework, concrete strength and other factors. Among them, the
influence of concrete strength was more significant. The LSKLCW was still in the elastic
working stage under the impact of a 30 kg standard sandbag. The results show that this type
structure of composite wall would not produce obvious cracks when under the accidental
impact of a weight within 30 kg. The composite wall of this type of combination has good
impact resistance. Therefore, in the design of composite walls with low-velocity impact
resistance, the strength of the concrete can be mainly improved, which can better improve
the impact resistance of the composite wall.
By comparing and fitting the numerical calculation model with the results of the test,
the effectiveness of the model and the accuracy of the algorithm were verified by these
results. The results of the test could feedback to the actual situation realistically within the
range of error, and the numerical model is suitable for the calculation of wall specimens
under a low-velocity impact. In addition, the model can calculate the impact force under
the low-velocity impact state through the damage state of the composite wall, and can
provide an analytical basis and help in the impact detection and impact resistance design
of the composite wall. Above all, the results of this paper provide a certain experimental
basis and theoretical reference basis for the impact research of composite walls.
Furthermore, this paper studies the impact resistance of LSKLCW under low-velocity
impact. However, more trials and analytical research are needed to study the impact
resistance of composite walls under medium-velocity and high-velocity impact in the
future.
Author Contributions: Conceptualization; Methodology; Resources; Software; Validation; Writing—
original draft; Writing—review and editing, J.Y., J.Z. and W.Y. All authors have read and agreed to
the published version of the manuscript.
Funding: This research was funded by the Open Fund of National Joint Engineering Research
Laboratory (No. 16BCX01) and the National and Local Joint Engineering Laboratory for Long-Term
Performance Improvement Technology of Bridges in Southern Region of Changsha University of
Science and Technology of Hunan Province, No. 960.
Institutional Review Board Statement: Not applicable.
Informed Consent Statement: Not applicable.
Data Availability Statement: The data presented in this study are available on request from the
corresponding author.
Acknowledgments: This research was supported by the Open Fund of National Joint Engineering
Research Laboratory (No. 16BCX01) and the National and Local Joint Engineering Laboratory for
Long-Term Performance Improvement Technology of Bridges in Southern Region of Changsha
University of Science and Technology of Hunan Province, No. 960.
Conflicts of Interest: The authors declare no conflict of interest. The funder had no role in the design
of the study; in the collection, analyses, or interpretation of data; in the writing of the manuscript, or
in the decision to publish the results.Appl. Sci. 2022, 12, 2957 14 of 14
References
1. Tian, W.; Wen, X.; Peng, J.; Song, X.; Gao, Z.; Wang, L. Experimental study on mechanical property for light steel-framed composite
wall with square steel pipe fitting filled with foam concrete. J. Build. Struct. 2021, 42, 124–133. (In Chinese)
2. Gunalan, S.; Kolarkar, P.; Mahendran, M. Experimental study of load bearing cold-formed steel wall systems under fire conditions.
Thin-Walled Struct. 2013, 65, 72–92. [CrossRef]
3. Ye, J.; Chen, W. Simplified calculation of fire resistant temperature for cold-formed steel load-bearing composite walls. Structures
2020, 28, 1661–1674. [CrossRef]
4. Han, J.; Shu, G.; Qin, Y.; Zhou, G.; Zhou, X. Experimental seismic behavior of T-shaped double skin composite wall with steel
truss. J. Constr. Steel Res. 2021, 184, 106776. [CrossRef]
5. Zhang, X.; Zhang, E.; Li, C. Study on axial compression mechanical behavior of cold-formed thin-walled C-shaped steel composite
wall sheathed with straw board on both sides. Structures 2021, 33, 3746–3756. [CrossRef]
6. Rafiei, S.; Hossain, K.M.; Lachemi, M.; Behdinan, K. Impact shear resistance of double skin profiled composite wall. Eng. Struct.
2017, 140, 267–285. [CrossRef]
7. Morada, G.; Ouadday, R.; Vadean, A.; Boukhili, R. Low-velocity impact resistance of ATH/epoxy core sandwich composite
panels: Experimental and numerical analyses. Compos. Part B Eng. 2017, 114, 418–431. [CrossRef]
8. Guo, Q.; Zhao, W. Design of steel-concrete composite walls subjected to low-velocity impact. J. Constr. Steel Res. 2019, 154,
190–196. [CrossRef]
9. Jung, J.W.; Yoon, Y.C.; Jang, H.W.; Hong, J.W. Investigation on the resistance of steel-plate concrete walls under high-velocity
impact. J. Constr. Steel Res. 2019, 162, 105732. [CrossRef]
10. Lee, K.; Shin, J.; Kim, K.; Varma, A. Local responses of steel-plate composite walls subjected to impact loads: Intermediate scale
tests. Eng. Struct. 2020, 206, 110131. [CrossRef]
11. Kim, J.M.; Varma, A.; Seo, J.; Bruhl, J.; Lee, K.; Kim, K. Steel-Plate Composite Walls Subjected to Missile Impact: Experimental
Evaluation of Local Damage. J. Struct. Eng. 2021, 147, 04020312. [CrossRef]
12. Cao, W.J.; Koh, C.G.; Smith, I.F. Enhancing static-load-test identification of bridges using dynamic data. Eng. Struct. 2019, 186,
410–420. [CrossRef]
13. Labiouse, V.; Descoeudres, F.; Montani, S. Experimental study of rock sheds impacted by rock blocks. Struct. Eng. Int. 1996, 6,
171–176. [CrossRef]
14. Fu, K.; Wang, H.; Chang, L.; Foley, M.; Friedrich, K.; Ye, L. Low-velocity impact behaviour of a shear thickening fluid(STF)and
STF-filled sandwich composite panels. Compos. Sci. Technol. 2018, 165, 74–83. [CrossRef]
15. Schmidt, M.E.; Cheng, L. Impact Response of Externally Strengthened Unreinforced Masonry Walls Using CFRP. J. Compos. Constr.
2009, 13, 252–261. [CrossRef]
16. Thornton, C. Coefficient of Restitution for Collinear Collisions of Elastic-Perfectly Plastic Spheres. J. Appl. Mech. 1997, 64, 383–386.
[CrossRef]
17. Brizmer, V.; Kligerman, Y.; Etsion, I. The effect of contact conditions and material properties on the elasticity terminus of a
spherical contact. Int. J. Solids Struct. 2005, 43, 5736–5749. [CrossRef]
18. Thornton, C.; Ning, Z. A theoretical model for the stick/bounce behaviour of adhesive, elastic-plastic spheres. Powder Technol.
1998, 99, 154–162. [CrossRef]
19. Wu, C.; Li, L.; Thornton, C. Energy dissipation during normal impact of elastic and elastic–plastic spheres. Int. J. Impact Eng. 2005,
32, 593–604. [CrossRef]You can also read