Either IL-7 activation of JAK-STAT or BEZ inhibition of PI3K-AKT-mTOR pathways dominates the single-cell phosphosignature of ex vivo treated ...
←
→
Page content transcription
If your browser does not render page correctly, please read the page content below
Either IL-7 activation of JAK-STAT or BEZ inhibition
of PI3K-AKT-mTOR pathways dominates the single-cell
phosphosignature of ex vivo treated pediatric T-cell
acute lymphoblastic leukemia cells

by Daniela Kuzilková, Cristina Bugarin, Katerina Rejlova, Axel R. Schulz, Henrik E. Mei,
Maddalena Paganin, Alessandra Biffi, Andrea Biondi, Tomas Kalina, and Giuseppe Gaipa

Received: March 17, 2021.
Accepted: October 12, 2021.

Citation: Daniela Kuzilková, Cristina Bugarin, Katerina Rejlova, Axel R. Schulz, Henrik E. Mei,
Maddalena Paganin, Alessandra Biffi, Andrea Biondi, Tomas Kalina, and Giuseppe Gaipa.
Either IL-7 activation of JAK-STAT or BEZ inhibition of PI3K-AKT-mTOR pathways dominates
the single-cell phosphosignature of ex vivo treated pediatric T-cell acute lymphoblastic leukemia cells.
Haematologica. 2021 Oct 21. doi: 10.3324/haematol.2021.278796. [Epub ahead of print]

Publisher's Disclaimer.
E-publishing ahead of print is increasingly important for the rapid dissemination of science.
Haematologica is, therefore, E-publishing PDF files of an early version of manuscripts that
have completed a regular peer review and have been accepted for publication. E-publishing
of this PDF file has been approved by the authors. After having E-published Ahead of Print,
manuscripts will then undergo technical and English editing, typesetting, proof correction and
be presented for the authors' final approval; the final version of the manuscript will then
appear in a regular issue of the journal. All legal disclaimers that apply to the
journal also pertain to this production process.

Either IL-7 activation of JAK-STAT or BEZ inhibition of PI3K-AKT-mTOR pathways

dominates the single-cell phosphosignature of ex vivo treated pediatric T-cell acute

lymphoblastic leukemia cells

Daniela Kuzilková1,2*, Cristina Bugarin3*, Katerina Rejlova1,2, Axel R. Schulz4, Henrik E.
Mei4, Maddalena Paganin5, Alessandra Biffi5, Andrea Biondi3, Tomas Kalina1,2#, Giuseppe
Gaipa3#.
D.K. and C.B.co-first authors

T.K. and G.G. equally contributed as last authors

1
    Childhood Leukaemia Investigation Prague, Czech Republic

2
Department of Pediatric Hematology and Oncology, 2nd Faculty of Medicine, Charles
University Prague, Czech Republic

3
    Fondazione Tettamanti, Clinica Pediatrica Università degli Studi Milano Bicocca, Monza
(MB), Italy
4
    German Rheumatism Research Center Berlin (DRFZ), a Leibniz Institute, Berlin, Germany
5
    Pediatric Hematology, Oncology and Stem Cell Transplant Division, Women and Child
Health Department, University of Padova, Padova, Italy.

Key words: childhood leukemia, T-cell ALL, cell signaling, JAK-STAT, IL-7, PI3K-AKT-
mTOR, mass cytometry, Prednisone

Running title: Single-Cell Phospho-kinase Signatures in Pediatric T-ALL

Corresponding author:

Andrea Biondi
Professor of Pediatrics
University of Milano-Bicocca
Director, Department of Pediatrics
European Reference Network (ERN) PaedCan, EuroBloodNet, MetabERN.
Fondazione MBBM/Ospedale San Gerardo
Via Pergolesi, 33 20900 Monza (IT)

                                              1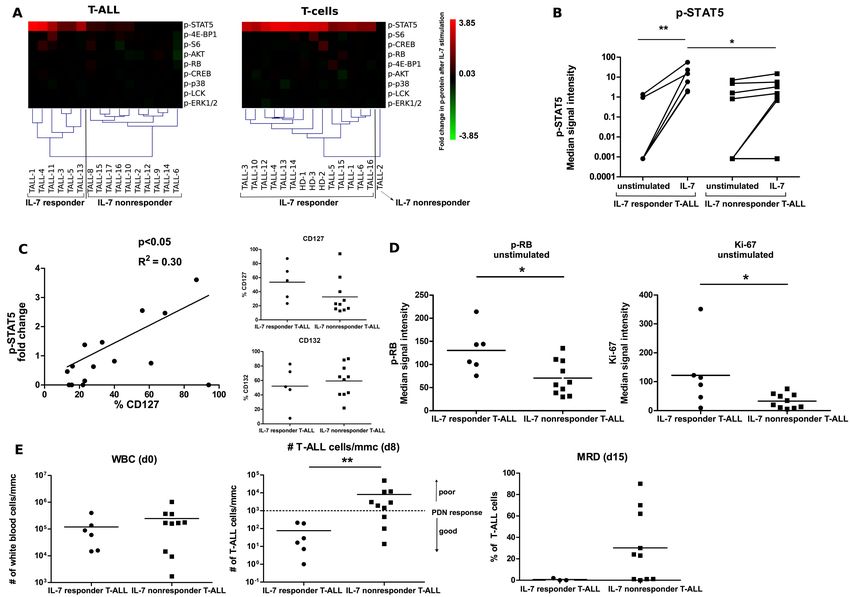
Tel. +39 039 233.6816; 3661
Email: andrea.biondi@unimib.it; abiondi.unimib@gmail.com

Data sharing statement

The data are available upon request

Word count
Abstract word count: 245
Text word count: 5523
Number of tables: 2
Number of figures: 6
Number of references: 62
Number of supplementary tables: 3
Number of supplementary figures: 13

Acknowledgments

This project was supported by Fondazione Alessandro Maria Zancan ONLUS “Grande Ale
ONLUS”, Fondazione M. Tettamanti De Marchi and NU20-05-00282 from Ministry of
Health, Czech Republic. It was also partially funded by the following grants: AIRC IG 2017
ref. id 20564, AIRC 5x1000 Ref.id 21147 to AB, AIRC Accelerator Award 2018 id 22791.
We wish to thank to Ondrej Hrusak for fruitful discussions and to Daniel Thürner and Pavel
Semerak for superb handling of the Helios instrument.

Author Contributions

D.K. performed the experiments, analyzed the data and wrote the manuscript, C.B. performed
the experiments, analyzed the data, wrote the manuscript, K.R. performed the experiments,
A.R.S. performed the conjugations experiments, H.E.M designed and performed conjugations
experiments, M. P. performed part of mutation screening, A. Bif. revised the manuscript,
A.Bio. revised the manuscript, T.K. designed the research, analyzed the data and wrote the
manuscript, G.G. designed the research, analyzed the data and wrote the manuscript. All
authors have read and approved the final submission of the manuscript

                                             2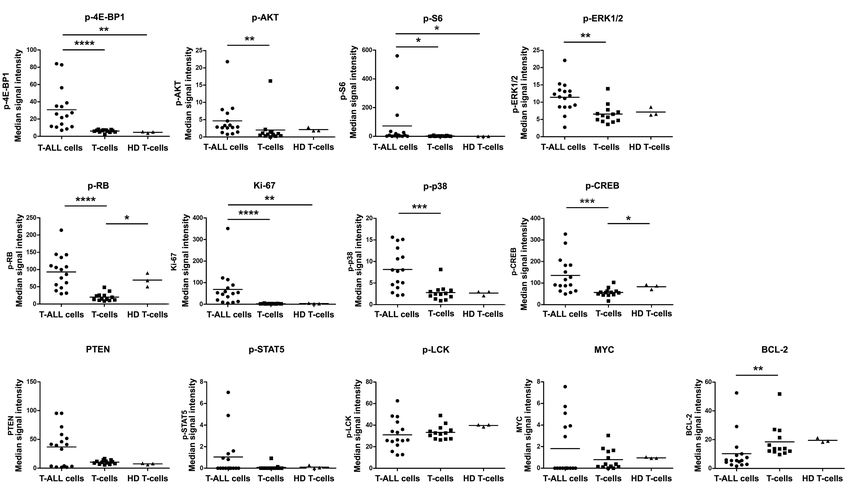
Conflict of Interest

The authors have no conflicts of interest to declare.

Abstract

T-cell acute lymphoblastic leukemia (T-ALL) is an aggressive cancer arising from
lymphoblasts of T-cell origin. While T-ALL accounts for only 15% of childhood and 25% of
adult ALL, 30% of patients relapse with a poor outcome. Targeted therapy of resistant and
high-risk pediatric T-ALLs is therefore urgently needed, together with precision medicine
tools allowing the testing of efficacy in patient samples. Furthermore, leukemic cell
heterogeneity requires drug response assessment at the single-cell level.

Here, we used single-cell mass cytometry to study signal transduction pathways such as the
JAK-STAT, PI3K-AKT-mTOR and MEK-ERK pathways in 16 diagnostic and 5 relapsed T-
ALL primary samples and investigated the in vitro response of cells to Interleukin-7 (IL-7)
and the inhibitor BEZ-235. T-ALL cells showed upregulated activity of the PI3K-AKT-
mTOR and MEK-ERK pathways and increased proliferation and translation markers. We
found that perturbation induced by the ex vivo administration of either IL-7 or BEZ-235
reveals a high degree of exclusivity with respect to the phospho-protein responsiveness to
these agents.

Notably, these response signatures were maintained from diagnosis to relapse in individual
patients.

In conclusion, we demonstrated the power of mass cytometry single-cell profiling of signal
transduction pathways in T-ALL. Taking advantage of this advanced approach, we were able
to identify distinct clusters with different responsiveness to IL-7 and BEZ-235 that can persist
at relapse.

Collectively our observations can contribute to a better understanding of the complex
signaling network governing T-ALL behavior and its correlation with influence on the
response to therapy.

                                               3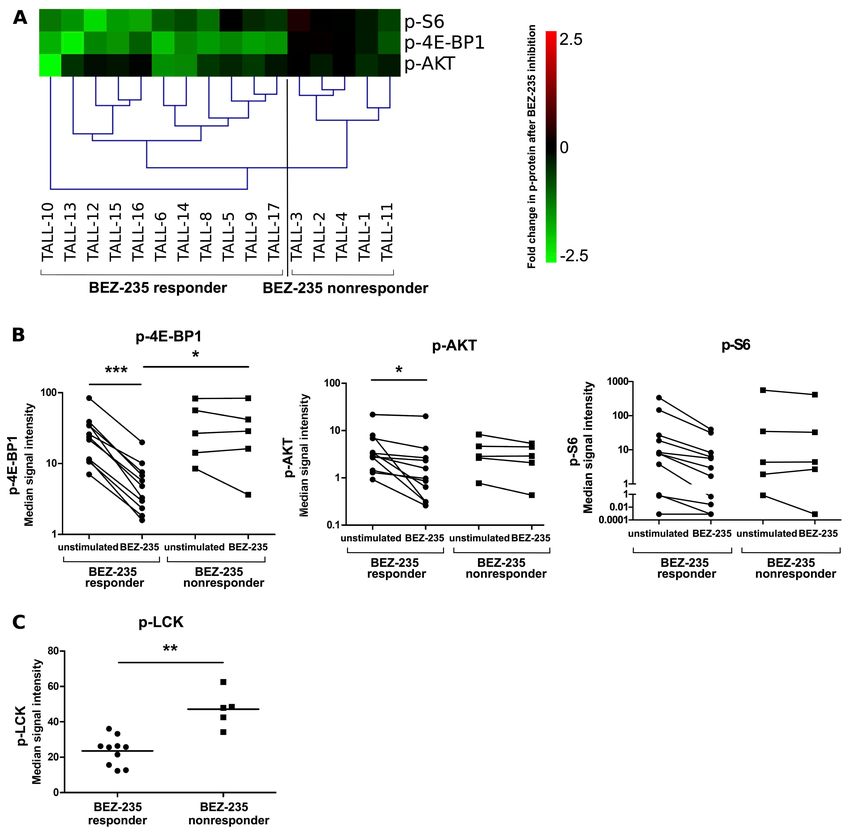
Introduction

The incidence of acute lymphoblastic leukemia (ALL) in children peaks between 2 and 5
years of age, and approximately 15% of cases are of T-cell origin and lead to T-cell ALL (T-
ALL). The survival rates of pediatric T-ALL patients have improved in recent years,
approaching a 5-year event-free survival of 70-80%.1 However, 25% of children with T-ALL
relapse with a generally more aggressive disease with a very poor outcome. Thus, efforts in
the investigation of disease biology that might contribute to the development of more
effective and specific treatments are urgently needed.2,3 Glucocorticoids (GCs) represent
central components of T-ALL therapy, and the early response to GC-based therapy is an
important predictor of long-term outcome.4 Accordingly, in Berlin-Frankfurt-Münster-
oriented trials for childhood ALL, patients are stratified based on prednisone (PDN) response
following 7 days of PDN monotherapy, and PDN poor responders (PPR) have a significantly
worse outcome than PDN good responders (PGR)5, indicating that intrinsic differences in GC
sensitivity at diagnosis impact the outcome. However, despite the consolidated use of GCs in
ALL clinical management, a comprehensive understanding of the mechanisms underlying
GC sensitivity is still lacking.6–8

The IL-7R-JAK-STAT5 signaling pathway plays a critical role in T-ALL, contributing to
leukemogenesis in vivo9–11 or driving disease progression by regulating cell viability and
proliferation.12–15

Somatic gain-of-function mutations in the specific IL-7Rα (CD127) subunit can occur in
roughly 10-12% of pediatric and adult T-ALL cases, leading to constitutive activation of the
receptor.16,17 Mutations may also occur in downstream effectors of IL-7/IL-7R-mediated
signaling, such as JAK-STAT, PI3K-AKT-mTOR and RAS-MEK-ERK pathways which are
found in a large proportion (30–50%) of T-ALL cases.18–21 IL-7R pathway mutations are
enriched in subtypes of patients overexpressing HOXA and TLX17,18,22 or with early T-cell
precursor ALL (ETP-ALL) phenotype.23,24 However mutations in IL-7R, JAK1 and JAK3
were also shown to associate with genetic lesions in WT1, PRC2 or PHF6 epigenetic
regulators.25 Furthermore, the IL-7R-JAK-STAT5 pathway has been investigated for its role
in GC resistance in T-ALL. Li et al19 performed whole genome and targeted exome
sequencing in patients with T-ALL and found that mutations in the IL-7R signaling
components JAK1 and KRAS correlated with steroid resistance and poor outcome in a subset

                                             4
of T-ALL whereas Meyer et al26 showed that IL-7 mediates an intrinsic and physiologic
mechanism of GC resistance in normal thymocyte development that is retained during
leukemogenesis in a subset of T-ALLs. A large cohort of adult T-ALL cases studied by Kim
and collaborators contained a subgroup of patients with IL-7R-pathway mutations with slow-
response to remission induction regimen measured at day 8 and week 6.21

PI3K-AKT-mTOR is a major signaling pathway implicated in T-ALL malignant
transformation promoting several functions including cell survival and proliferation.27 The
major negative regulator of this pathway is the tumor suppressor lipid phosphatase and tensin
homolog (PTEN), which is frequently inactivated in human cancer.28,29 PTEN non-sense or
frame-shift mutations cluster in exon 7, resulting in a C-terminal truncated protein leading to
a decreased or absent PTEN expression and activity30 resulting in PI3K-AKT aberrant
activation.

Gene expression profiling of T-ALL cases revealed subgroups of T-ALL, each characterized
by a specific transcriptional profile and the ectopic expression of one particular transcription
factor which could impact the differentiation process of the cells. The most represented
subgroup shows ectopic TAL1 expression, whereas other major subgroups show mutual
exclusive expression of TLX1, TLX3, HOXA9/10, LMO2, or NKX2-1.31–33 Furthermore, the
ETP-ALL is characterized by aberrant expression of LYL12; hematopoietic transcription
factors such as RUNX1 and ETV6 are frequently mutated in this genetically heterogeneous
subgroup.24

In addition to the ectopic expression of transcription factors, which can represent an initiating
step in T-ALL development, further mutations are required for the full leukemic
transformation. These include mutations leading to dysregulation of the activity of PTEN,
WT1, RAS, IL-7R and PHF6 affecting several signal transduction pathways implicated in the
development of T-ALL.20

Relapsed disease represents one of the most challenging settings in the clinical management
of T-ALL. Globally, recent studies have indicated that relapsed blasts can evade therapy by
utilizing a variety of biological pathways.34 Despite the need for targeting molecules to treat
resistant and high-risk pediatric T-ALLs, in vitro drug testing may not be predictive of in vivo
efficacy due to the complexity of the signaling network and due to the cell heterogeneity
within the individual sample.35 Single-cell mass cytometry analysis represents a promising
                                               5
tool in the comprehension of signaling networks and their role in the response to drugs.36
Currently, mass cytometry allows the measurement of more than 40 parameters per single
cell, rendering this approach an ideal method to assay drug candidate mechanisms of action
and selectivity to cancer cells.37 Although many efforts have been made to characterize the
genomic landscape of relapsed T-ALL, many aspects of leukemia resistance are still to be
learned. Thus, the integration of genomic and epigenetic studies with new functional
proteomic approaches at the single-cell level is essential to continue identifying potential
drug targets or biomarkers. In this work, we aimed to evaluate the functional profiles of T-
ALL cells collected from children with T-ALL at diagnosis or at relapse and correlate them
with their biological and clinical features, including early response to therapy, by mass
cytometry.

Methods

Primary samples and diagnostic procedures

This study was approved by the institutional review board of San Gerardo Hospital (Monza,
Italy), informed consent was obtained from all patients and their guardians in accordance
with the Declaration of Helsinki.
Bone marrow (BM) or peripheral blood (PB) mononuclear cells (MNCs) were collected from
16 children with T-ALL enrolled in the AIEOP-ALL-2009 or R2006 protocols at the
Pediatric Clinic of University Milano Bicocca at San Gerardo Hospital, stored and thawed as
described previously.38 Immunophenotyping and evaluation of genetic aberrations were
performed as described previously38, the T-ALL diagnosis was based on consensus criteria.39
We also collected PB-MNCs from 3 healthy subjects. The immunological classification and
clinical and genetic features are reported in Table 1.

In vitro prednisolone response assay
In order to explore the functional involvement of individual or combined treatments on cell
survival, we cultured 10 primary T-ALL samples in technical duplicate for 48 hours in
complete medium in the presence of IL-7 (50 ng/mL, Peprotech), Methylprednisolon (50
ug/mL, Urbason, Sanofi), BEZ-235 (a dual PI3K/mTOR inhibitor, 800nM) or without any
treatment used as basal control. Cells were then stained with Annexin V/7-
Aminoactinomycin D and absolute viable (and non-apoptotic) cell counts were performed by

                                               6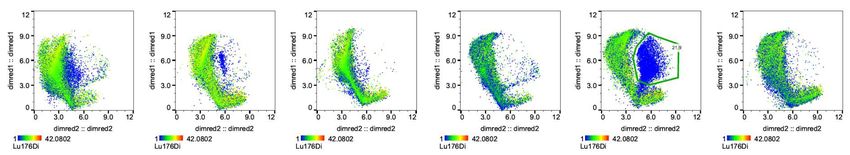
adding CountBright Absolute Counting Beads (Invitrogen) and calculated upon bead-based
correction factor according to manufacturer´s instructions.

Mass cytometry
Sample preparation

An average of 0.5-1x10⁶ cells per condition were starved in X-VIVO medium (37°C, 1 h),
stimulated with IL-7 (50 ng/mL, 15 min) or inhibited with BEZ-235 (800 nM, 30 min) at
37°C. Samples were fixed (MaxPar FIX-I) and stored (10% glycerol in fetal bovine serum, -
20°C, adapted from Watson et al40).

Sample staining

Monoclonal antibody (moAb) characteristics are listed in Table S1. In-house antibody
conjugations with palladium, indium and platinum isotopes were performed as described
previously.41,42 Two sets of antibody cocktails (surface moAbs, intracellular moAbs) were
prepared and handled as described previously.43 The samples were thawed, washed with
MaxPar Cell Staining Buffer (CSB, 800 g, 5 min, RT), and barcoding moAbs were added (15
min, RT). The cells were washed, pooled together and washed in CSB (800 g, 5 min, RT). To
minimize technical variability between stimulated and unstimulated samples, differently
treated samples from particular donors were barcoded, mixed and further processed in one
tube. To control for the batch effect, each patient sample was acquired together with
barcoded healthy donor PB-MNCs as an internal spike-in control. The samples were stained
according to the MaxPar Phosphoprotein Staining with Fresh Fix (Fluidigm) protocol as
recommended by the manufacturer.

Sample acquisition

The instrument (Helios, Fluidigm, CyTOF 6.7.1014 software) was prepared for acquisition
according to the manufacturer’s recommendation.

Analysis

Signal spillover between channels was corrected using the CATALYST R package as
described previously.44 Compensated fcs files were further processed using FlowJo (v10.5,
FlowJo LLC) or Infinicyt v2.0 (Cytognos) software (Figure S1). Heatmaps were created in

                                              7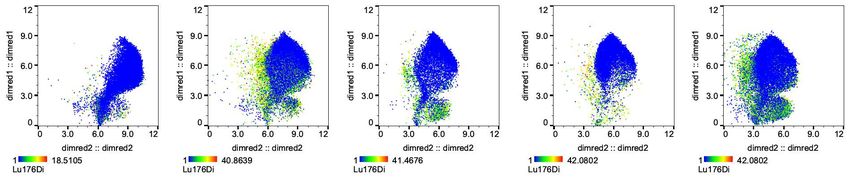
MeV software45 by displaying arcsinh transformed absolute values of median intensities. The
fold change was calculated by subtracting the arcsinh-transformed median of unstimulated
samples from the arcsinh-transformed median of stimulated samples.

Vaevictis dimensionality reduction

For visual projection of our data, we used the deep learning-based tool Vaevictis
(https://github.com/stuchly/vaevictis/), which combines ideas adapted from Szubert el al46
and Ding et al47 with biased sampling. Using this approach, Vaevictis can produce reusable
parametric mapping into the lower dimensional space to visualize both local and global
relationships in very large datasets. Vaevictis dimensional reduction was calculated from a
set of 13 parameters (p-4E-BP1, p-STAT5, p-AKT, p-p38, p-S6, p-LCK, p-CREB-1, p-
ERK1/2, p-RB, Ki-67, PTEN, MYC, and BCL-2).

Molecular characterization of T-ALL samples

The somatic mutation analysis was performed on primary genomic T-ALL DNA BM
samples. PTEN mutation analysis was performed by PCR Sequencing of PTEN exon 7 and
PCR products were directly sequenced in both directions using Applied Biosystems ABI
PRISM-3130 Genetic Analyzer instrument (Life Technologies). Alignment was performed
using     the     Basic     Local     Alignment        Search   Tool   database   (BLAST,
www.blast.ncbi.nlm.nih.gov). IL-7R mutations/deletions were studied by Sanger sequencing
of the PCR products of IL7R exon 6 (FW: TGCATGGCTACTGAATGCTC, RV:
CCCACACAATCACCCTCTTT). NOTCH1 mutation analysis was performed by PCR
amplification and direct DNA sequencing of exons 26, 27, and 28 and part of exon 34 on
TAD and PEST domains.48 The sequences were BLAST aligned and manually checked for
mutations identification.

Statistical analysis

Mann-Whitney U tests and Pearson correlation were performed in GraphPad Prism 5. A p-
value below 0.05 was considered statistically significant.

Results

T-ALL cells show constitutive activation of several signaling pathways relevant for
proliferation, survival and translation activity
                                                   8
We first evaluated the basal signaling profiles of proliferation and intracellular regulators in
primary cells obtained from the BM or PB of 16 pediatric T-ALL diagnostic specimens, 14 of
which were reported previously.38 The clinical and laboratory characteristics of the patients
are described in Table 1. Using CyTOF, we analyzed the samples with a panel of 30 moAbs,
including eight CD45 barcodes, fifteen surface markers and fifteen intracellular regulators of
various pathways and cellular processes, such as the PI3K-AKT-mTOR, JAK-STAT, MEK-
ERK, MAPK pathways, and the activation of T-cell receptors, the cell cycle, transcription
and apoptosis (Table S1). Viable T-ALL cells were gated separately from residual
nonmalignant T-cells (Figure S1). T-cells obtained from healthy donor PB (n=3) were used
as controls.

Compared to their healthy T-cell counterparts, T-ALL cells showed constitutive activation of
several functional markers: phosphorylated forms of 4E-BP1, AKT and S6 (PI3K-AKT-
mTOR pathway members); Ki-67, a cell cycle progression marker; p-RB, a regulator of the
G1 to S transition; p-ERK1/2 and p-p38, members of the mitogen-activated kinase (MAPK)
family; and CREB, a transcription factor regulating proliferation, differentiation and survival
(Figure 1).

In contrast, the expression of BCL-2 (regulating anti apoptotic activity) was significantly
lower in T-ALL cells. Overall the phospho-signature and levels of intracellular regulators
was similar in healthy donors’ peripheral T-cells and residual nonmalignant T-cells (internal
control) and distinct from T-ALL.

Single-cell analysis of functional parameters reveals intra- and interindividual heterogeneity
of T-ALL cells

To visualize the internal heterogeneity of the signaling network in T-ALL cells at the
phospho-proteomic level, we applied deep learning-based Vaevictis dimensionality reduction
(Figure 2A). Signaling, proliferation and internal regulators (13 parameters) were considered
for the projection calculation. In the presented cohort of pediatric T-ALL samples, we
observed heterogeneity in the signaling regulators; however, there was a dominant subset
(>50%) within the T-ALL cell compartment in the majority of T-ALL patient specimens
(Figure 2A, Figure S2). In addition to the dominant subset, minor subsets of T-ALL cells
were identified with a continuous transition between individual subsets. Notably, in some

                                               9
patients (e.g., TALL-10), a subset of T-ALL cells is clearly separated from the major subset,
suggesting an intrinsic heterogeneity of T-ALL cells.
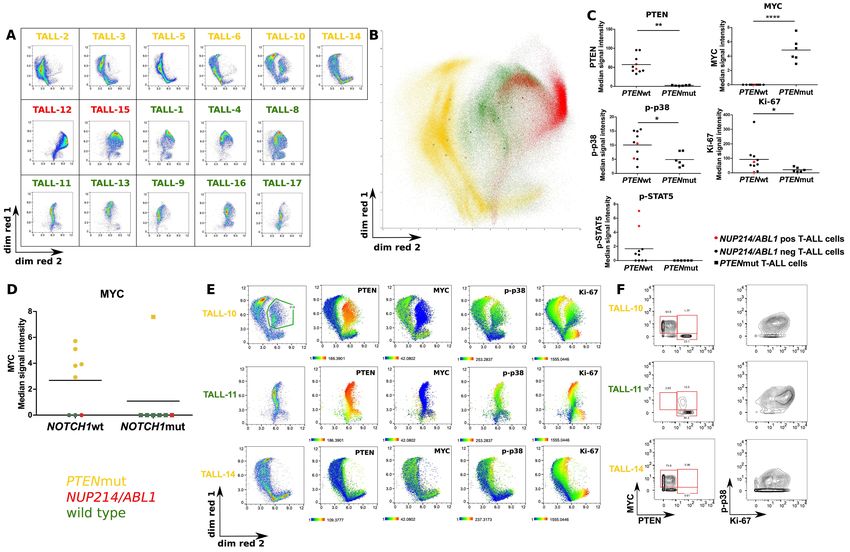
We then compared interindividual differences in T-ALL patients’ signaling, proliferation and
intracellular regulators. We observed a similar pattern in six PTEN exon 7 mutated
(PTENmut) T-ALL patients (Figure 2A). Interestingly, on overlaid Vaevictis projections
(Figure 2B), PTENmut patients are located in the same compartment of the map, forming a
cluster. T-ALL samples with NUP214/ABL1 gene fusion are located within the same
compartment but do not separate from PTEN wild-type (PTENwt) cells. As expected,
PTENmut cells showed the absence of PTEN protein and a significantly higher MYC
expression than PTENwt cells (Figure 2C). PTENwt cells showed only partial expression of
MYC, documenting the maintenance of PTEN-MYC axis regulation. We also observed
decreased levels of Ki-67 and p-p38 MAP kinase in PTENmut T-ALL patients. Finally, T-
ALL patients with the NUP214/ABL1 gene fusion showed constitutive activation of the JAK-
STAT pathway, documented as p-STAT5, compared to T-ALL patients without this gene
fusion (Figure 2C). The impact of both PTEN and MYC expression on the pattern of
signaling, proliferation and intracellular regulators is shown on the Vaevictis map (Figure S3
and S4).
Further, we analyzed the correlation of MYC expression with NOTCH1 status in 15 out of
the 16 patients. The distribution of MYC expression among NOTCH1wt cases was variable
with two clear clusters, one low (3 cases) and one high (5 cases) as illustrated in Figure 2D.
Of the 7 NOTCH1mut cases, 6 were MYC low and one was very high. We then analyzed the
correlation between NOTCH1 and PTEN status. Six cases were PTENwt/NOTCH1mut, 1
case was PTENmut/NOTCH1mut, 5 cases PTENmut/NOTCH1wt and 3 cases
PTENwt/NOTCH1wt (Table 1). As shown in Figure 2D, the level of MYC was low in all
PTENwt cases regardless of NOTCH1 status (three cases NOTCH1wt and 6 cases
NOTCH1mut), whereas all PTENmut cases displayed high MYC (five cases NOTCH1wt and
1 case NOTCH1mut).
To further investigate the intrinsic heterogeneity observed in the Vaevictis projections, we
analyzed the TALL-10 sample with the most pronounced separated subsets, and we identified
mosaic expression of both PTEN and MYC proteins. On the contrary homogeneous
expression of these two proteins was observed in representative PTENwt (TALL-11) or
10PTENmut (TALL-14) patients (Figure 2E, 2F), indicating that PTEN-MYC regulation can
be maintained even at a subclonal level in T-ALL. On the other hand, no differences in the
phosphorylation of p38 or the expression of Ki-67 were observed in the two subclones of
TALL-10 patient.
Finally, to confirm the reliability of the approach, we evaluated interindividual variability in
the signaling profiles of both proliferation and intracellular regulators in residual T-cells
(Figure S4) and compared it to that of T-ALL cells. Residual T-cells showed very low
interpatient variability, while T-ALL cells showed a high degree of intersample
heterogeneity, indicating that the activation signatures in T-ALL blasts were disease-specific
and not caused by sample handling or processing.
In vitro response to IL-7 correlates with higher proliferation and predicts good response to
prednisone induction
The IL-7/IL-7R signaling axis activates three main pathways in T-cells, the JAK-STAT,
PI3K-AKT-mTOR and MEK-ERK pathways, ultimately promoting leukemia cell viability,
cell cycle progression and growth. The contribution of each of these pathways to a particular
functional outcome is still not completely known and appears to differ between normal and
malignant states.20 For these reasons, we investigated the impact of IL-7/IL-7R signaling on
the modulation of the before mentioned functional nodes upon IL-7 stimulation.
For this purpose, we analyzed IL-7-induced ex vivo perturbation of nine phospho-epitopes in
T-ALL cells, residual T-cells and T-cells obtained from healthy donor´s PB (Figure 3A). We
resolved two response types: (i) IL-7-responsive T-ALL samples (n=6) and (ii) IL-7-
nonresponsive T-ALL samples (n=10), distinguished by their difference in p-STAT5
activation. P-STAT5 increased by 2.5-fold in IL-7 responders, while it remained unchanged
in IL-7 T-ALL nonresponders. The fold increase in p-STAT5 was caused solely by IL-7
induction (Figure 3B), since the basal levels were comparable in both groups (Figure S5). In
contrast, in normal T-cells, we observed a homogeneous pattern of the p-STAT5 response in
14/15 samples (Figure 3A, Figure S6). However, apart from p-STAT5, no other tested nodes
were differentially expressed between the two subgroups (Figure S7) .We next investigated
the correlation between IL-7-induced STAT5 phosphorylation and the expression of the IL-
7R in T-ALL cells (n=15) and residual T-cells (n=9). The fold change in p-STAT5 upon IL-7
stimulation quantitatively correlated with the percentage of CD127 (Figure 3C) but not with
11CD132 (common γ chain, a subunit of the IL-7 receptor, Figure S8) expression. However,
the IL-7 nonresponsiveness of T-ALL blasts cannot be explained solely by the lower
expression of CD127 or CD132. For example, cases TALL-15 and TALL-9 expressed
CD127 at 60% and >90% respectively but responded poorly to IL-7. TALL-15 was harboring
NUP214/ABL1 gene fusion with basal p-STAT5 already at the maximal level, which can
explain its non responsiveness. By contrast TALL-9 (PTENwt, IL-7Rwt and
NUP214/ABL1wt) displayed low responsiveness despite its low basal p-STAT5. Yet, STAT-
5 was phosphorylated after pervanadate treatment showing that the method worked and also
that STAT-5 could potentialy be phosphorylated in these cells. Thus the lack of
responsiveness to IL-7 in this specific case remains unclear.
To further investigate the characteristics of IL-7 nonresponsive T-ALL samples, we
compared the profiles of all intracellular regulators in unstimulated T-ALL samples and we
identified higher levels of p-RB and Ki-67, both markers of cell cycle progression, in IL-7 T-
ALL responders compared to IL-7 nonresponders (Figure 3D, Figure S9). Interestingly,
while both subgroups had comparable white blood cell counts at diagnosis, IL-7 responder T-
ALL patients had significantly lower absolute blast cell counts at day +8 of treatment (Figure
3E), the predictor of prognosis in pediatric T-ALL5, indicating that ex vivo IL-7
responsiveness might reflect the sensitivity to prednisone therapy in vivo. In order to
experimentally test the sensitivity to prednisolone, we treated either IL-7 responder (TALL-1,
-3, -4, -11, -13) or IL-7 nonresponder (TALL-10, -12, -14, -16, -17) samples ex vivo with IL-
7 and prednisolone. Cells from IL-7 responder cases significantly increased their counts upon
IL-7 administration, while the cells from IL-7 nonresponders did not (Figure S10A). Next,
we tested the ex vivo response to prednisolone in the absence or presence of IL-7.
Prednisolone alone induced a significant reduction of viable cells in the culture of IL-7
responder cases but only an insignificant decrease in IL-7 nonresponder cultures (Figure
S10B and S10C). However, in the presence of IL-7 the effect of prednisolone in responders
was mitigated to the level observed at basal condition (Figure S10B).
The PI3K pathway can be inhibited in vitro by BEZ-235 in 11 of 16 T-ALL samples
As reported previously49, the level of basal phosphorylation of the PI3K pathway members p-
4E-BP1, p-AKT and p-S6 was high in T-ALL (Figure 1). Therefore, we tested the inhibitory
12potential of the dual PI3K/mTOR inhibitor BEZ-235. Since no basal activation of the PI3K
pathway was observed in the residual T-cells or T-cells obtained from PB of healthy donors,
we did not include any of those in the analysis. Considering the extent of BEZ-235-induced
decrease in levels of p-4E-BP1, p-AKT and p-S6 (Figure 4A), we dissected two clusters of
T-ALL patients: (i) ex vivo BEZ-235 responder T-ALL samples (n=11), which showed a
decreased level of p-4E-BP1 and (ii) ex vivo BEZ-235 nonresponder T-ALL samples (n=5),
which showed no to mild change in the level of PI3K pathway members´ phosphorylation.
When we compared the basal phosphorylation of p-4E-BP1, p-AKT and p-S6 in the two
clusters of T-ALL, we did not find any difference (Figure 4B). However, we observed
significant inactivation of 4E-BP1 and AKT only in the BEZ-235 responder T-ALL samples.
Then, to further investigate the features associated with nonresponsiveness to BEZ-235, we
compared the profiles of all the analyzed intracellular regulators (Figure S11). Only the
inhibitory carboxy-terminal Tyr of Lck was hyperphosphorylated in BEZ-235 nonresponder
T-ALL patients under the basal conditions (Figure 4C). Next, we wanted to investigate
whether the BEZ-235 response correlates with GC responsivity and if the addition of BEZ-
235 can increase cells’ sensitivity to prednisolone. We treated cells with BEZ-235 in the
presence or absence of prednisolone. The decrease in viability induced by BEZ-235 alone in
4 samples from the group considered BEZ-235 responders (TALL-10, -14, -16, -17) was not
significant. Furthermore, prednisolone + BEZ-235 combined treatment did not increase cells’
sensitivity to GCs (Figure S12A). Similar results were obtained when the 4 samples from the
group of BEZ-235 nonresponders (TALL-1, 3, 4, 11) were tested, as shown in Figure S12B.
JAK-STAT pathway activation and PI3K-AKT pathway inhibition are mutually exclusive
features of T-ALL
Interestingly, we observed a high degree of mutual exclusivity in IL-7 and BEZ-235
responsiveness among the T ALL samples: Four of 16 samples (TALL-1, -3, -4,-11) were IL-
7 responders but not BEZ-235 responders; in contrast, 9/16 samples (TALL-6, -8, -9, -10, -
12, -14, -15, -16, -17) were BEZ-235 responders but IL-7 nonresponders. Two samples
(TALL-5 and TALL-13) responded to both ex vivo treatments, and only one sample (TALL-
2) was not responsive to any ex vivo treatment (Figure 5A, Table S2), Furthermore, when we
analyzed the composition of the IL-7- or BEZ-235-based clusters with regards to the in vivo
response to GCs (Figure 5B), we noticed that all the IL-7 responder samples were from PGR
patients (Table S2), while samples of BEZ-235 responders were enriched in PPR samples (6
13of 9, 66.6%), suggesting a correlation between JAK-STAT or PI3K-AKT activation and the
early response to treatment in vivo.
Phospho-signatures and the dominance of the JAK-STAT or PI3K-AKT pathway are
maintained at relapse
Since phosphokinases are dynamic regulators of signaling networks, we investigated whether
the phospho-signature present at diagnosis was maintained at relapse. Using the CyTOF
panel, we analyzed five pairs of diagnostic and relapsed T-ALL patient samples (TALL-1, -2,
-15, -16, -17). To visualize phospho-signatures, Vaevictis dimensionality reduction was
applied (Figure 6A). Signaling, proliferation and internal regulators (13 parameters) were
considered for the projection calculation. First, we applied a gating strategy to identify the
dominant and secondary clones of T-ALL cells in the diagnostic samples. Next, we applied
an identical gating strategy on the relapse samples and compared the expression patterns of
our markers in all paired samples (Figure S13). In TALL-1, TALL-15 and TALL-16, the
major diagnostic clone (accounting for 72.1%, 58.9% and 79.3% of cells, respectively) was
the subset characterized by highly phosphorylated RB and 4E-BP1, indicating active PI3K-
AKT pathway and cell cycle progression. At relapse, the major diagnostic clone was still
present in TALL-1 and TALL-15, although in a reduced proportion (24.2% and 8.93%,
respectively); the major clones represented at relapse (62.3% and 67%, respectively) retained
intermediate levels of p-RB and p-4E-BP1. In TALL-16, the dominant diagnostic clone
(79.3%) was virtually absent at relapse (0.13%), showing a concomitant dramatic increase
(84.2%) in the clone with intermediate levels of p-RB and p-4E-BP1. In TALL-2 and TALL-
17, the dominant clusters at diagnosis (70.6% and 60.8%, respectively), with intermediate
levels of p-RB and p-4E-BP1, remained prevalent at relapse (53.5% and 82%). In summary,
we observed that in 4 of 5 paired T-ALL samples (TALL-1, -2, -15, -17), the pattern of
phospho-signatures was maintained at relapse, with a redistribution of cells from clones with
highly phosphorylated RB and 4E-BP1 towards clones with lower p-RB. In one sample
(TALL-16), the dominant cluster (with the highest activation level) disappeared at relapse.
We next sought to assess whether these findings corresponded with the dominance of the
JAK-STAT or PI3K-AKT pathway. We performed the same ex vivo treatments applied to
diagnostic samples to their relapsed counterparts. We observed that with regards to the fold
change in phosphoproteins (n=9) after ex vivo IL-7 stimulation, all relapsed samples were
14allocated to the same cluster as their diagnostic counterparts, specifically (i) ex vivo IL-7
responder T-ALL samples containing paired samples from TALL-1 and (ii) ex vivo IL-7
nonresponders T-ALL samples containing paired samples from patients with TALL-2,
TALL-15, TALL-16 and TALL-17 (Figure 6B). Similarly, we analyzed the BEZ-235-
induced PI3K-AKT response (p-4E-BP1, p-AKT and p-S6) in the 5 paired T-ALL samples
(Figure 6C); 4 of 5 relapsed samples were allocated to the same cluster as the diagnostic
paired specimens, specifically: (i) ex vivo BEZ-235 responders TALL-15 and TALL-17; (ii)
ex vivo BEZ-235 nonresponders TALL-1 and TALL-2. An exception was TALL-16 in which
the relapse sample shifted to the BEZ-235 nonresponder cluster, while its diagnostic
counterpart was originally located in the BEZ-235-responder cluster. Notably, TALL-16 was
the only sample that lost the dominant diagnostic clone (with a highly active PI3K-AKT
pathway) at relapse (Figure 6A).
Discussion
In the present study, we provide original evidence showing that T-ALL blasts exhibit
intrapatient heterogeneity of phospho-signaling regulators that are activated at different levels
within interconnected cell subsets and that this regulatory activity is generally maintained at
relapse. Our study accidentally identified one patient with subclonal PTEN mutation that
demonstrated unique heterogeneity of intracellular regulators documenting that single cell
analysis by mass cytometry can tackle this type of complex patterns. Furthermore, we
observed that perturbation induced by the ex vivo administration of either IL-7 or BEZ-235
reveals a high degree of mutual exclusivity with respect to the responsiveness to these agents
at phospho-protein level. One limitation of the present study is the low number of patients.
Also, we have selected the primary samples based on the availability of frozen vials in the
cell bank, the number of cells/vial and the cell viability at the time of thawing. This resulted
in a final selection which does not fully reflect the classical T-ALL case distribution. In
particular, our series does not contain IL-7R mutated cases and is slightly enriched in PTEN
mutated patients (37.5%) compared to the reported incidence of this subgroup in other reports
such as those by Palomero et al50 and by Zuurbier L et al30 who documented the incidence
ranging from 16% to 17% of T-ALL. In addition to the bias in genetic mutations distribution,
our series is slightly enriched in PPR patients, being 43.7% compared to 34% in historical
prospective series of childhood T-ALL reported by Schrappe et al.51
15Mass cytometry allowed us to apply a broad panel of moAbs, demonstrating for the first time
the feasibility and power of this technology in the detailed characterization of signaling
networks in T-ALL samples. Mass cytometry phospho-profiling was pioneered by
Bodenmiller36, who also used cellular barcoding to study the signaling dynamics and cell-to-
cell communication in human blood cells. Here, we confirm and extend our previous
observations by phospho-flow cytometry of hyperactivated status of T-ALL.38 We
demonstrate the potential value of this technology as a tool for identification of the dominant
features of the response to IL-7 activation or BEZ-235 inhibition (here, p-STAT5 and p-4E-
BP1). Importantly, barcoding of samples and gating of residual T-cells allowed for multiple
levels of internal controls, assuring technical accuracy and proper context for interpretation.
The running cost of mass cytometry technology with barcoding is comparable to
conventional cytometry, while it provides the advantage of a high number of parameters,
notably phosphoproteins, that can be reliably measured. Our workflow overcomes some
limitations of mass cytometry (high equipment cost and demanding reagent stock production)
by shipping fixed samples after in vitro treatment to a collaborator.
The Vaevictis projection shows recurrent patterns in patients with particular mutations.
Notably, PTENmut cells displayed high MYC expression. MYC is a master transcription
factor regulating several critical cell functions, such as metabolism, proliferation and
survival52, and it functions as a potent oncogene in a large number of cancers.53 In line with
our findings, Bonnet et al54 showed that modulation of MYC protein was maintained through
downregulation of PTEN via the PI3K-AKT axis in T-ALL. This explains the significant
inverse correlation between MYC and PTEN expression. Furthermore we analyzed the
correlation between NOTCH1, PTEN status and MYC levels. We observed that MYC was
low in all PTENwt cases regardless of NOTCH1 status, while all the PTENmut cases
displayed high MYC in line with Bonnet et al.54 These authors showed that high MYC
expression levels can be observed in the absence of (known) NOTCH1 and/or FBXW7
mutations and that modulation of MYC protein can be observed in the presence of
downregulation of PTEN as a major alternative pathway of MYC activation in T-ALL
independently from NOTCH1 mutations.
GC resistance remains a major challenge in the treatment of pediatric ALL, and although
several mechanisms have been suggested6,55,56, our understanding of the molecular basis
remains incomplete.
16We found that all IL-7 responding samples were from patients with a good response to GCs
in vivo whereas all BEZ-235 responding (but IL-7 nonresponding) samples were from
patients with poor response to GCs in vivo. However, due to the limited number of patients
studied we cannot state that IL-7R pathway activation in vitro reflects the sensitivity to PDN
therapy in vivo. Nevertheless, our preliminary observations are also supported by GC
cytotoxicity experiments that assessed/tested ex vivo prednisolone response in T-ALL
primary cells in the absence or presence of IL-7.
Firstly, we observed that in samples that responded to IL-7 stimulation by increased
phosphorylation of STAT5 the number of viable cells significantly increased upon ex vivo
administration of IL-7. In contrast, the IL-7 nonresponsive samples did not show any
significant increase. We then exposed both kinds of samples to prednisolone in the absence or
presence of IL-7. In the absence of IL-7, we observed a significant reduction in the number of
viable cells , whereas when combined, IL-7 and prednisolone mutually canceled out their
effects. Similar investigations were carried out by Delgado-Martin et al57 who assessed p-
STAT5 responsiveness to IL-7 with regards to GC sensitivity, and he found that the
responder subsets displayed resistance to GC-induced death while the IL-7 nonresponder
subset was mostly GC sensitive. However these authors did not formally assess the pro-
survival effect of IL-7 alone, but only as a protective factor from chemotherapy-induced
death.
In our series of primary T-ALL samples, the IL-7 response was assessed as both p-STAT5
response and the pro-survival response. These characteristics correlated with good GC
response in vivo. Notably, the IL-7 responder cells in our series displayed a significantly
higher expression of both Ki-67 and p-RB indicating a higher proliferative functional state as
compared to IL-7 nonresponder blasts. This is consistent with a more effective action of GCs
and other cytotoxic drugs on highly proliferating cells.58,59
Furthermore, we assessed whether the observed fold change in phospho-proteins after BEZ-
235 treatment correlated with drug sensitivity, and if its addition could increase cells'
sensitivity to GCs. Indeed, BEZ-235 treatment did not increase the cells' sensitivity to
prednisolone in the 4 BEZ-235 phospho-responder samples. Hall and collaborators60
examined the cytotoxic activity of BEZ-235 and dexamethasone, as single agents and in
combination in both T-ALL cell lines and primary T-ALL samples. BEZ-235 alone did not
17show any significant activity, in line with our data. However, these authors observed a
synergistic cytotoxic effect of BEZ-235 and dexamethasone in most T-ALL cell lines tested,
and in primary T-ALL lymphoblast’s. Li and colleagues19 studied a large cohort of primary
T-ALL samples and demonstrated that genes involved in the IL7R–RAS–MAPK–AKT
signaling pathway were significantly associated with steroid resistance and poor clinical
outcome. They subsequently evaluated the drug synergism between PDN and several agents
including a PI3K-AKT-mTOR inhibitor in 11 primary T-ALL samples collected at diagnosis
and they observed an enhanced steroid response in most samples in line with the data by Hall
et al.60 We tested the synergism between prednisolone and BEZ-235 in only four patients.
Furthermore, we have not performed any extended screening of the mutational state of the
IL-7R pathway, thus our observation of the lack of additive effect of BEZ-235 and PDN
activity should be taken with caution.
Recently, Liu et al22 performed an integrated genomic analysis of a large cohort of T-ALL
patients and identified 10 functional pathways recurrently mutated in T-ALL, including the
PI3K-AKT-mTOR and JAK-STAT pathways, in 29% and 25% of cases, respectively. Mutual
exclusivity was observed between the PI3K-AKT pathway and JAK-STAT or Ras pathway
alterations. Our data are in line with this hypothesis at least at the phospho-proteomic level as
we found two subsets of patients with opposite response to IL-7 and to BEZ-235.
Notably, the signature associated with either IL-7 or BEZ-235 responsiveness was
maintained at relapse, with the exception of a single case in which the loss of the highly
activated dominant clone was observed. In this regard the importance of the conservation of
the functional dominance suggests that functional studies at an early stage (i.e. at diagnosis)
may be of relevance for treatment of relapse. The cases of refractory T-ALL patients warrant
further in-depth studies.
We are well aware that any clinical correlation of our biology-oriented study in a limited non-
representative series of childhood T-ALL (for example no IL-7R mutated patients are
included) should be corroborated in further extensive investigations, nevertheless we do
believe that our data should be considered in view of a better understanding of the
mechanisms of cortico-resistance in childhood T-ALL.
In summary, we demonstrated the translational potential of the mass cytometry-based T-ALL
profiling at the single-cell level. Further, our analysis allowed us to investigate the
18heterogeneity within a single T-ALL sample, revealing a rare case of subclonal PTEN
mutation28.
Because of this advanced approach, we were able to identify distinct functional clusters of
IL-7 and BEZ-235-responsive T-ALL cells with different sensitivity to GC, which can persist
at relapse. Collectively, our observations can contribute to a better understanding of the
complex signaling network governing T-ALL behavior and its correlation with the response
to therapy.
19References
1. Pui CH. Acute Lymphoblastic Leukemia: Introduction. Semin Hematol. 2009;46(1):1-
2.
2. Girardi T, Vicente C, Cools J, Keersmaecker K De. The genetics and molecular
biology of T-ALL. Blood. 2017;129(9):1113-1123.
3. Klumper E, Pieters R, Veerman A, et al. In vitro cellular drug resistance in children
with relapsed/refractory acute lymphoblastic leukemia. Blood. 1995;86(10):3861-
3868.
4. Gao J, Liu WJ. Prognostic value of the response to prednisone for children with acute
lymphoblastic leukemia: A meta-analysis. Eur Rev Med Pharmacol Sci.
2018;22(22):7858-7866.
5. Lauten M, Moricke A, Beier R, et al. Prediction of outcome by early bone marrow
response in childhood acute lymphoblastic leukemia treated in the ALL-BFM 95 trial:
differential effects in precursor B-cell and T-cell leukemia. Haematologica.
2012;97(7):1048-1056.
6. Follini E, Marchesini M, Roti G. Strategies to Overcome Resistance Mechanisms in T-
Cell Acute Lymphoblastic Leukemia. Int J Mol Sci. 2019;20(12):3021.
7. Scheijen B. Molecular mechanisms contributing to glucocorticoid resistance in
lymphoid malignancies. Cancer Drug Resist. 2019;2:647-664.
8. De Smedt R, Morscio J, Goossens S, Van Vlierberghe P. Targeting steroid resistance
in T-cell acute lymphoblastic leukemia. Blood Rev. 2019;38:100591.
9. Rich BE, Campos-Torres J, Tepper RI, Moreadith RW, Leder P. Cutaneous
lymphoproliferation and lymphomas in interleukin 7 transgenic mice. J Exp Med.
1993;177(2):305-316.
10. Lindqvist CM, Lundmark A, Nordlund J, et al. Deep targeted sequencing in pediatric
acute lymphoblastic leukemia unveils distinct mutational patterns between genetic
subtypes and novel relapse-associated genes. Oncotarget. 2016;7(39):64071-64088.
2011. Abraham N, Ma MC, Snow JW, Miners MJ, Herndier BG, Goldsmith MA.
Haploinsufficiency identifies STAT5 as a modifier of IL-7-induced lymphomas.
Oncogene. 2005;24(33):5252-5257.
12. Silva A, Laranjeira ABA, Martins LR, et al. IL-7 Contributes to the Progression of
Human T-cell Acute Lymphoblastic Leukemias. Cancer Res. 2011;71(14):4780-4789.
13. Dibirdik I, Langlie M, Ledbetter J, et al. Engagement of interleukin-7 receptor
stimulates tyrosine phosphorylation, phosphoinositide turnover, and clonal
proliferation of human T-lineage acute lymphoblastic leukemia cells. Blood.
1991;78(3):564-570.
14. Treanor LM, Zhou S, Janke L, et al. Interleukin-7 receptor mutants initiate early T cell
precursor leukemia in murine thymocyte progenitors with multipotent potential. J Exp
Med. 2014;211(4):701-713.
15. Ribeiro D, Melão A, van Boxtel R, et al. STAT5 is essential for IL-7–mediated
viability, growth, and proliferation of T-cell acute lymphoblastic leukemia cells. Blood
Adv. 2018;2(17):2199-2213.
16. Shochat C, Tal N, Bandapalli OR, et al. Gain-of-function mutations in interleukin-7
receptor-α (IL7R) in childhood acute lymphoblastic leukemias. J Exp Med.
2011;208(5):901-908.
17. Zenatti PP, Ribeiro D, Li W, et al. Oncogenic IL7R gain-of-function mutations in
childhood T-cell acute lymphoblastic leukemia. Nat Genet. 2011;43(10):932-939.
18. Canté-Barrett K, Spijkers-Hagelstein JAP, Buijs-Gladdines JGCAM, et al. MEK and
PI3K-AKT inhibitors synergistically block activated IL7 receptor signaling in T-cell
acute lymphoblastic leukemia. Leukemia. 2016;30(9):1832-1843.
19. Li Y, Buijs-Gladdines JGCAM, Canté-Barrett K, et al. IL-7 Receptor Mutations and
Steroid Resistance in Pediatric T cell Acute Lymphoblastic Leukemia: A Genome
Sequencing Study. PLoS Med. 2016;13(12):e1002200.
20. Oliveira ML, Akkapeddi P, Alcobia I, et al. From the outside, from within: Biological
and therapeutic relevance of signal transduction in T-cell acute lymphoblastic
21leukemia. Cell Signal. 2017;38:10-25.
21. Kim R, Boissel N, Touzart A, et al. Adult T-cell acute lymphoblastic leukemias with
IL7R pathway mutations are slow-responders who do not benefit from allogeneic
stem-cell transplantation. Leukemia. 2020;34(7):1730-1740.
22. Liu Y, Easton J, Shao Y, et al. The genomic landscape of pediatric and young adult T-
lineage acute lymphoblastic leukemia. Nat Genet. 2017;49(8):1211-1218.
23. Goossens S, Radaelli E, Blanchet O, et al. ZEB2 drives immature T-cell lymphoblastic
leukaemia development via enhanced tumour-initiating potential and IL-7 receptor
signalling. Nat Commun. 2015;6(1):5794.
24. Zhang J, Ding L, Holmfeldt L, et al. The genetic basis of early T-cell precursor acute
lymphoblastic leukaemia. Nature. 2012;481(7380):157-163.
25. Vicente C, Schwab C, Broux M, et al. Targeted sequencing identifies associations
between IL7R-JAK mutations and epigenetic modulators in T-cell acute lymphoblastic
leukemia. Haematologica. 2015;100(10):1301-1310.
26. Meyer LK, Huang BJ, Delgado-Martin C, et al. Glucocorticoids paradoxically
facilitate steroid resistance in T cell acute lymphoblastic leukemias and thymocytes. J
Clin Invest. 2020;130(2):863-876.
27. Okkenhaug K, Vanhaesebroeck B. PI3K in lymphocyte development, differentiation
and activation. Nat Rev Immunol. 2003;3(4):317-330.
28. Mendes RD, Sarmento LM, Canté-Barrett K, et al. PTEN microdeletions in T-cell
acute lymphoblastic leukemia are caused by illegitimate RAG-mediated recombination
events. Blood. 2014;124(4):567-578.
29. Milella M, Falcone I, Conciatori F, et al. PTEN: Multiple functions in human
malignant tumors. Front Oncol. 2015;5:24.
30. Zuurbier L, Petricoin EF, Vuerhard MJ, et al. The significance of PTEN and AKT
aberrations in pediatric T-cell acute lymphoblastic leukemia. Haematologica.
2012;97(9):1405-1413.
2231. Homminga I, Pieters R, Langerak AW, et al. Integrated Transcript and Genome
Analyses Reveal NKX2-1 and MEF2C as Potential Oncogenes in T Cell Acute
Lymphoblastic Leukemia. Cancer Cell. 2011;19(4):484-497.
32. Ferrando AA, Neuberg DS, Staunton J, et al. Gene expression signatures define novel
oncogenic pathways in T cell acute lymphoblastic leukemia. Cancer Cell.
2002;1(1):75-87.
33. Soulier J, Clappier E, Cayuela JM, et al. HOXA genes are included in genetic and
biologic networks defining human acute T-cell leukemia (T-ALL). Blood.
2005;106(1):274-286.
34. Bhatla T, Jones CL, Meyer JA, Vitanza NA, Raetz EA, Carroll WL. The Biology of
Relapsed Acute Lymphoblastic Leukemia. J Pediatr Hematol Oncol. 2014;36(6):413-
418.
35. Loosveld M, Castellano R, Gon S, et al. Therapeutic Targeting of c-Myc in T-Cell
Acute Lymphoblastic Leukemia (T-ALL). Oncotarget. 2014;5(10):3168-3172.
36. Bodenmiller B, Zunder ER, Finck R, et al. Multiplexed mass cytometry profiling of
cellular states perturbed by small-molecule regulators. Nat Biotechnol.
2012;30(9):858-867.
37. Bendall SC, Simonds EF, Qiu P, et al. Single-cell mass cytometry of differential
immune and drug responses across a human hematopoietic continuum. Science.
2011;332(6030):687-696.
38. Bonaccorso P, Bugarin C, Buracchi C, et al. Single-cell profiling of pediatric T-cell
acute lymphoblastic leukemia: Impact of PTEN exon 7 mutation on PI3K/Akt and
JAK–STAT signaling pathways. Cytometry B Clin Cytom. 2020;98(6):491-503.
39. Dworzak MN, Buldini B, Gaipa G, et al. AIEOP-BFM Consensus Guidelines 2016 for
Flow Cytometric Immunophenotyping of Pediatric Acute Lymphoblastic Leukemia.
Cytometry B Clin Cytom. 2018;94(1):82-93.
40. Watson M, Chow S, Barsyte D, et al. The study of epigenetic mechanisms based on
the analysis of histone modification patterns by flow cytoametry. Cytometry A.
232014;85(1):78-87.
41. Mei HE, Leipold MD, Maecker HT. Platinum-conjugated antibodies for application in
mass cytometry. Cytometry A. 2016;89(3):292-300.
42. Mei HE, Leipold MD, Schulz AR, Chester C, Maecker HT. Barcoding of Live Human
Peripheral Blood Mononuclear Cells for Multiplexed Mass Cytometry. J Immunol.
2015;194(4):2022-2031.
43. Schulz AR, Baumgart S, Schulze J, Urbicht M, Grützkau A, Mei HE. Stabilizing
Antibody Cocktails for Mass Cytometry. Cytometry A. 2019;95(8):910-916.
44. Chevrier S, Crowell HL, Zanotelli VRT, Engler S, Robinson MD, Bodenmiller B.
Compensation of Signal Spillover in Suspension and Imaging Mass Cytometry. Cell
Syst. 2018;6(5):612-620.
45. Saeed AI, Sharov V, White J, et al. TM4: A Free, Open-Source System for Microarray
Data Management and Analysis. Biotechniques. 2003;34(2):374-378.
46. Szubert B, Cole JE, Monaco C, Drozdov I. Structure-preserving visualisation of high
dimensional single-cell datasets. Sci Rep. 2019;9(1):8914.
47. Ding J, Condon A, Shah SP. Interpretable dimensionality reduction of single cell
transcriptome data with deep generative models. Nat Commun. 2018;9(1):2002.
48. Sulis ML, Williams O, Palomero T, et al. NOTCH1 extracellular juxtamembrane
expansion mutations in T-ALL. Blood. 2008;112(3):733-740.
49. Silva A, Yunes JA, Cardoso BA, et al. PTEN posttranslational inactivation and
hyperactivation of the PI3K/Akt pathway sustain primary T cell leukemia viability. J
Clin Invest. 2008;118(11):3762-3774.
50. Palomero T, Sulis ML, Cortina M, et al. Mutational loss of PTEN induces resistance to
NOTCH1 inhibition in T-cell leukemia. Nat Med. 2007;13(10):1203-1210.
51. Schrappe M, Valsecchi MG, Bartram CR, et al. Late MRD response determines
relapse risk overall and in subsets of childhood T-cell ALL: Results of the AIEOP-
BFM-ALL 2000 study. Blood. 2011;118(8):2077-2084.
2452. Dang C V., O’Donnell KA, Zeller KI, Nguyen T, Osthus RC, Li F. The c-Myc target
gene network. Semin Cancer Biol. 2006;16(4):253-264.
53. Meyer N, Penn LZ. Reflecting on 25 years with MYC. Nat Rev Cancer.
2008;8(12):976-990.
54. Bonnet M, Loosveld M, Montpellier B, et al. Posttranscriptional deregulation of MYC
via PTEN constitutes a major alternative pathway of MYC activation in T-cell acute
lymphoblastic leukemia. Blood. 2011;117(24):6650-6659.
55. Piovan E, Yu J, Tosello V, et al. Direct Reversal of Glucocorticoid Resistance by AKT
Inhibition in Acute Lymphoblastic Leukemia. Cancer Cell. 2013;24(6):766-776.
56. Serafin V, Capuzzo G, Milani G, et al. Glucocorticoid resistance is reverted by LCK
inhibition in pediatric T-cell acute lymphoblastic leukemia. Blood.
2017;130(25):2750-2761.
57. Delgado-Martin C, Meyer LK, Huang BJ, et al. JAK/STAT pathway inhibition
overcomes IL7-induced glucocorticoid resistance in a subset of human T-cell acute
lymphoblastic leukemias. Leukemia. 2017;31(12):2568-2576.
58. Ebinger S, Özdemir EZ, Ziegenhain C, et al. Characterization of Rare, Dormant, and
Therapy-Resistant Cells in Acute Lymphoblastic Leukemia. Cancer Cell.
2016;30(6):849-862.
59. Martelli AM, Lonetti A, Buontempo F, et al. Targeting signaling pathways in T-cell
acute lymphoblastic leukemia initiating cells. Adv Biol Regul. 2014;56:6-21.
60. Hall CP, Reynolds CP, Kang MH. Modulation of Glucocorticoid Resistance in
Pediatric T-cell Acute Lymphoblastic Leukemia by Increasing BIM Expression with
the PI3K/mTOR Inhibitor BEZ235. Clin Cancer Res. 2016;22(3):621-632.
61. Coustan-Smith E, Mullighan CG, Onciu M, et al. Early T-cell precursor leukaemia: a
subtype of very high-risk acute lymphoblastic leukaemia indentified in two
independent cohorts. Lancet Oncol. 2009;10(2):147-156.
62. Basso G, Veltroni M, Valsecchi MG, et al. Risk of Relapse of Childhood Acute
Lymphoblastic Leukemia Is Predicted By Flow Cytometric Measurement of Residual
25Disease on Day 15 Bone Marrow. J Clin Oncol. 2009;27(31):5168-5174.
26Table 1. Clinical and biological characteristics of studied T-ALL patients
code SEX AGE WBC/mm3 EGIL ETP PDN MRD at PTEN NUP214 IL7R NOTCH1(exons
(years) at diagnosis score immunophenotype response day 15* /ABL1 exon 6 26-27-28-34T-
P)**
M 14 88900 T-IV no PGR nd wt wt nd nd
TALL-1
M 14 TI/II no PPR 30.0% mut wt wt wt
TALL-2 169570
F 9 136720 T-III no PGR nd mut wt wt mut
TALL-3
M 6 T-III no PGR nd wt wt wt mut
TALL-4 60050
F 12 400000 T-III no PGR 2.0% mut wt wt wt
TALL-5
F 13 T-IV no PPR 70.0% mut wt wt wt
TALL-6 1026000
F 5 362600 T-III no PGR 1.15% wt wt wt mut
TALL-8
M 6 T-III no PGR 0.01% wt wt wt mut
TALL-9 14420
TALL- no 24.5% mut wt wt
M 14 168090 T-IV PPR wt
10
TALL- no 0.14% wt wt mut
M 17 15800 T-III PGR wt
11
TALL- no 23.1% wt wt wt
M 11 159580 TI/II PPR mut
12
TALL- 27
M 8 T-III no PGR 0.14% wt wt wt mut
14630
13TALL- no 61.9% mut wt wt
M 3 369810 T-III PPR wt
14
TALL- no 1.30% wt wt mut
M 11 9390 TI/II PGR mut
15
TALL- 90.1% wt wt wt
F 17 1700 TI/II yes PPR wt
16
TALL- 0.99% wt wt wt
M 8 176000 T-III no PPR wt
17
PDN, Prednisone; PGR, Prednisone Good Responder; PPR, Prednisone Poor Responder; IR, Intermediate Risk; HR, High Risk; SR, Standard
Risk; wt, wild type; mut, mutated. ETP, Early T-cell Phenotype according to Coustan-Smith et al.61
*According to the criteria by Basso et al62 the % of flow cytometry MRD in the BM of day 15 identifies three patient’s risk groups: standard
(SR, 0.1% blasts), intermediate (IR, 0.1 to 10%), and high (HR, ≥10); nd, not determined
** Details on the specific exons associated to mutation are reported in Table S3
28You can also read