Long non-coding RNA SLC2A1-AS1 induced by GLI3 promotes aerobic glycolysis and progression in esophageal squamous cell carcinoma by sponging ...
←
→
Page content transcription
If your browser does not render page correctly, please read the page content below
Liu et al. Journal of Experimental & Clinical Cancer Research            (2021) 40:287
https://doi.org/10.1186/s13046-021-02081-8

 RESEARCH                                                                                                                                          Open Access

Long non-coding RNA SLC2A1-AS1 induced
by GLI3 promotes aerobic glycolysis and
progression in esophageal squamous cell
carcinoma by sponging miR-378a-3p to
enhance Glut1 expression
Hongtao Liu1*† , Qing Zhang1,2†, Yinsen Song2, Yibin Hao2, Yunxia Cui1, Xin Zhang1, Xueying Zhang1, Yue Qin1,
Guangzhao Zhu1, Feng Wang3,4, Jinghan Dang5, Shanshan Ma1, Yanting Zhang1, Wenna Guo1, Shenglei Li6*,
Fangxia Guan1* and Tianli Fan7*

  Abstract
  Background: Emerging evidence demonstrates that lncRNAs play pivotal roles in tumor energy metabolism;
  however, the detailed mechanisms of lncRNAs in the regulation of tumor glycolysis remain largely unknown.
  Methods: The expression of SLC2A1-AS1 was investigated by TCGA, GEO dataset and qRT-PCR. The binding of GLI3
  to SLC2A1-AS1 promoter was detected by Luciferase Reporter Assay System and Ago2-RIP assay. FISH was
  performed to determine the localization of SLC2A1-AS1 in ESCC cells. Double Luciferase Report assay was used to
  investigate the interaction of miR-378a-3p with SLC2A1-AS1 and Glut1. Gain-of-function and Loss-of-function assay
  were performed to dissect the function of SLC2A1-AS1/miR-378a-3p/Glut1 axis in ESCC progression in vitro and
  in vivo.
  Results: We identified a novel lncRNA SLC2A1-AS1 in ESCC. SLC2A1-AS1 was frequently overexpressed in ESCC tissues
  and cells, and its overexpression was associated with TNM stage, lymph node metastasis and poor prognosis of ESCC
  patients. Importantly, GLI3 and SLC2A1-AS1 formed a regulatory feedback loop in ESCC cells. SLC2A1-AS1 promoted
  cell growth in vitro and in vivo, migration and invasion, and suppressed apoptosis, leading to EMT progression and
  increased glycolysis in ESCC cells. SLC2A1-AS1 functioned as ceRNA for sponging miR-378a-3p, resulting in Glut1
  overexpression in ESCC cells. MiR-378a-3p inhibited cell proliferation and invasion as well as induced apoptosis,
  resulting in reduced glycolysis, which was partly reversed by SLC2A1-AS1 or Glut1 overexpression in ESCC cells.

* Correspondence: liuht1230@126.com; lslbljys@126.com;
guanfangxia@126.com; fantianlipp@163.com
†
 Hongtao Liu and Qing Zhang contributed equally to this work.
1
 School of Life Sciences, Zhengzhou University, Zhengzhou 450001, Henan,
China
6
 Department of Pathology, the First Affiliated Hospital of Zhengzhou
University, 40 Daxue Road, Zhengzhou 450052, Henan, China
7
 Department of Pharmacology, School of Basic Medicine, Zhengzhou
University, 100 Kexue Road, Zhengzhou 450001, Henan, China
Full list of author information is available at the end of the article

                                       © The Author(s). 2021, corrected publication 2021. Open Access This article is licensed under a Creative Commons Attribution
                                       4.0 International License, which permits use, sharing, adaptation, distribution and reproduction in any medium or format, as
                                       long as you give appropriate credit to the original author(s) and the source, provide a link to the Creative Commons licence,
                                       and indicate if changes were made. The images or other third party material in this article are included in the article's Creative
                                       Commons licence, unless indicated otherwise in a credit line to the material. If material is not included in the article's Creative
                                       Commons licence and your intended use is not permitted by statutory regulation or exceeds the permitted use, you will need
                                       to obtain permission directly from the copyright holder. To view a copy of this licence, visit http://creativecommons.org/
                                       licenses/by/4.0/. The Creative Commons Public Domain Dedication waiver (http://creativecommons.org/publicdomain/zero/1.
                                       0/) applies to the data made available in this article, unless otherwise stated in a credit line to the data.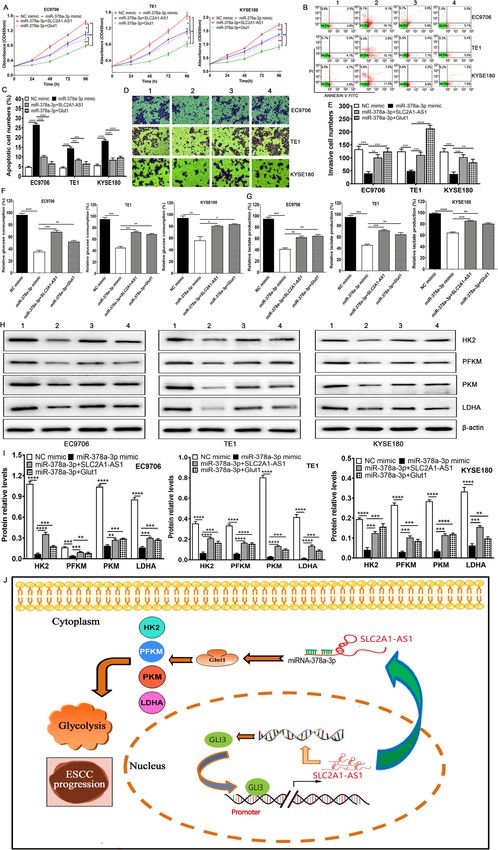
Liu et al. Journal of Experimental & Clinical Cancer Research   (2021) 40:287                                              Page 2 of 20

  Conclusion: SLC2A1-AS1 plays important roles in ESCC development and progression by regulating glycolysis, and
  SLC2A1-AS1/miR-378a-3p/Glut1 regulatory axis may be a novel therapeutic target in terms of metabolic remodeling of
  ESCC patients.
  Keywords: Esophageal squamous cell carcinoma, SLC2A1-AS1, miR-378a-3p, Glucose transporter 1, Glycolysis

Background                                                                cell growth, survival, differentiation, apoptosis, invasion
Esophageal cancer (ESCA) is the seventh leading cause                     and metastasis [26–29]. Recently, lncRNAs have been re-
of cancer-related death in the world, which consists of                   ported to be tightly associated with tumor glycolysis
two histological types, esophageal squamous cell carcin-                  [30–32], and thus targeting these lncRNAs may be novel
oma (ESCC) and esophageal adenocarcinoma (EAC) [1,                        therapeutic strategies for a variety of tumors. Recently,
2]. In China, ESCC accounts for 90% of all ESCA types,                    SLC2A1-AS1 as a novel lncRNA has been verified to
and mainly distributes in Lin County and An Yang area,                    promote tumor proliferation by absorbing miR-508-5p
Henan province [3]. Although tremendous advances in                       in lung adenocarcinoma (LUAD) [33]. Besides, SLC2A1-
diagnosis and treatment of ESCC patients, the 5-year                      AS1 triggered the suppression of Glut1 expression, fur-
survival rate for ESCC patients is quite poor [4, 5],                     ther resulting in the inhibition of glycolysis of hepatocel-
which may be mainly due to diagnosis at an advanced                       lular carcinoma (HCC) by competitively binding to
stage, high recurrence and metastasis [6, 7]. Therefore, it               transketolase and signal transducer and activator of tran-
is extremely urgent for us to seek for novel prognostic                   scription 3 (STAT3) [34]. Our previous report revealed
markers and therapeutic targets for ESCC patients.                        differential expression of lncRNAs in ESCA [35], and
  Tumor cells mainly obtain energy via a high rate of                     SLC2A1-AS1 was given our exclusive attention due to in
glycolysis for tumor survival, and this metabolic feature                 the same human chromosome 1 with Glut1, suggesting
is now considered as one of tumor hallmarks [8]. Otto                     that it may be implicated in the regulation of glycolysis
Warburg has verified that tumor cells preferentially up-                  in ESCA. However, its roles and regulatory mechanisms
take glucose as main energy source to produce lactate,                    involved in glycolysis remain elusive.
even in the present of plentiful oxygen, to support the                     In the present study, we reported a novel lncRNA
increased metabolic rate [9], which is well known as                      SLC2A1-AS1 in ESCC. We found that SLC2A1-AS1 was
“Warburg effect” or “aerobic glycolysis” [10]. The meta-                  frequently overexpressed in ESCC tissues and cells,
bolic characteristics is implicated in a series of the alter-             which might be due to the high expression of transcrip-
ation of metabolic enzymes, such as glucose transporter                   tion factor GLI3, and its depletion suppressed ESCC cell
1 (Glut1, also named SLC2A1), hexokinase 2 (HK2),                         growth in vitro and in vivo, migration and invasion as
pyruvate kinase type M2 (PKM2) and lactate dehydro-                       well as glycolysis, and induced cell apoptosis in ESCC
genase A (LDHA) [11–16]. Notably, many transcrip-                         cells. Mechanistically, SLC2A1-AS1 sponged miR-378a-
tional factors including c-myc, hypoxia inducible factor-                 3p to enhance the Glut1 expression, which further
1α (HIF-1α), nuclear factor kappa-B (NF-κB) promote                       triggered the increased glycolysis in ESCC. Taken
tumor lactagenesis by regulating the expressions of                       altogether, our current data presented herein suggest
metabolic enzymes [17–19]. Recent studies have demon-                     that SLC2A1-AS1/miR-378a-3p/Glut1 regulatory axis
strated that targeting glycolysis-related pathways may be                 plays an essential role in ESCC development and pro-
a novel therapeutic target for a variety of tumors [20–                   gression, and thus targeting the signal axis may be a
22], which will link many metabolic enzymes involved in                   novel therapeutic target for ESCC patients.
glycolysis. Despite tremendous advances in tumor gly-
colysis, its regulatory mechanisms implicated its meta-                   Materials and methods
bolic enzymes and transcriptional factors remain to be                    Tissue samples
further identified.                                                       Sixty cases of ESCC samples and paired normal esopha-
  Long non-coding RNAs (lncRNAs) as key regulatory                        geal epithelial tissues were obtained during surgical re-
elements of cell biological processes are longer than 200                 section at the First Affiliated Hospital of Zhengzhou
nucleotides, without protein-coding potential, which is                   University from 2010 to 2016. Tissue samples confirmed
transcribed by RNA polymerase II [23]. LncRNAs are                        using H&E staining by experienced pathologists were
considered to be involved in many biological processes,                   immediately frozen in liquid nitrogen after resection,
including gene expression regulation, decoy for tran-                     which was further investigated by quantitative real-time
scription factors, competing endogenous RNAs (ceR-                        PCR (qRT-PCR), Western blot and immunohistochemis-
NAs) and scaffolding, etc. [24, 25]. Increasing reports                   try (IHC). Informed consent of all tissue samples was
have demonstrated that lncRNAs widely participate in                      obtained from each patient and the utilization of tissue
Liu et al. Journal of Experimental & Clinical Cancer Research   (2021) 40:287                                               Page 3 of 20

samples was approved by the Research and Ethics Com-                      Lipofectamine™ 2000 (Invitrogen Life Technologies,
mittee of Zhengzhou University in this study. Mean-                       Carslbad, CA, USA) according to manufacturer’s
while, the study methodologies completely conformed to                    instruction.
the standards set by the Declaration of Helsinki.
                                                                          Cell counting Kit-8 (CCK-8) assay for cell proliferation
IHC assay                                                                 CCK-8 kit was employed to evaluate cell proliferation in
IHC assay was performed according to previous reports                     ESCC cells. Briefly, various treatment ESCC cells
[36]. In brief, tissue slides were fixed using formalin, em-              (EC9706, TE1 and KYSE180 cells) at a density of 2 × 10³
bedded in paraffin and cut continuously for 4-6 μm.                       cells per well were seeded into 96-well plates. At the in-
After deparaffinization, rehydration and antigen retrieval                dicated time points, CCK-8 (Beyotime Biotech, Haimen,
using microwave heating in citrate buffer (pH 6.0). Pri-                  China) was added to corresponding wells according to
mary antibodies against Glut1 (Abcam, Cambridge, MA,                      manufacturer’s protocol, and absorbance value at 450
USA) were incubated with tissue sections. After rinsing,                  nm was determined in a microplate reader (Thermo Sci-
the corresponding second antibody was added to tissue                     entific, Waltham, MA).
slides. Staining signals were developed using DAB re-
agent. The staining results were evaluated by two excel-                  Colony formation
lent pathologists.                                                        Colony formation was performed to access the cell prolif-
                                                                          eration ability. Briefly, ESCC cells (1 × 10³) with different
                                                                          transfection were added to 6-well plate for 72 h. Then,
Public database assay                                                     fresh medium was used to replace the old medium to cul-
Gene expression profiles from ESCA patients were down-                    ture ESCC cells for continuous 10 days. Finally, ESCC cells
loaded from The Cancer Genome Atlas (TCGA) dataset                        was fixed using 4% of paraformaldehyde for 1 h and
using the GDC data portal (https://portal.gdc.cancer.gov/                 stained with 0.1% crystal violet for 30 min.
repository), which was analyzed according to our previous
publication [35]. GEO DataSet (GSE111011) was applied                     EdU staining assay
to examine the SLC2A1-AS1, GLI3 and Glut1 expression                      EdU staining assay was performed according to manu-
in 7 cases of ESCC patients and 7 cases of paired normal                  facturer’s protocol. EC9706, TE1 and KYSE180 cells
samples, and GSE43732 was utilized to detect the miR-                     (6 × 10³ cells/well) were seeded into 96-well plate, and
378a-3p expression in 119 cases of ESCC tissues and                       then were transfected with NC, SLC2A1-AS1 siRNA,
paired normal tissues. TCGA database from StarBase                        pcDNA3.1 and pcDNA3.1-SLC2A1-AS1 according to
(ENCORI) (The Encyclopedia of RNA Interactomes) was                       manufacturer’s protocol. Cells were labeled with EdU re-
used to investigate the SLC2A1-AS1, GLI3, miR-378a-3p                     agent in a final concentration of 50 μM for 2 h. Cells
and Glut1 expression in 162 cases of ESCA patients and                    were rinsed using PBS buffer for 5 min. Subsequently,
11 cases of normal samples. GSE111011 was performed to                    cells was fixed in PBS buffer containing 4% polyformal-
analyze the expression of glycolysis-related proteins in 7                dehyde for 30 min, and glycine (2 mg/ml) in a volume of
cases of ESCC tissues and corresponding normal tissues.                   50 μl was added to cells for 5 min. Finally, TritonX-100
                                                                          in a volume of 100 μl was used for decolorization for 10
Cell lines, cell culture and transfection                                 min. Regarding Apollo staining, a total of 100 μl of 1 ×
Human ESCC cell lines including EC9706, TE1, Eca109,                      Apollo staining liquid was applied to each well, and in-
KYSE70, KYSE30, KYSE180, KYSE450, KYSE510 and                             cubated for 30 min. PBS buffer containing 0.5% TritonX-
KYSE520 as well as normal esophageal epithelial cell                      100 in a volume of 100 μl was used for decolorization
Het-1A were obtained from the Chinese Academy of                          for 10 min. Finally, DNA staining was performed using
Sciences Cell Bank, which was maintained in RMPI 1640                     1 × Hoechst33342 according to manufacturer’s instruc-
medium supplemented with 10% Fetal Bovine Serum                           tion. The photo was taken using florescent microscope.
(Gibco, Invitrogen, USA) in a humidified incubator har-
boring 5% CO2. GLI3 siRNA #1, 2 and 3, control siRNA                      Migration and invasion assay by Transwell chamber
(con-siRNA), SLC2A1-AS1 siRNA #1 and 2, negative                          Cell migration and invasion were investigated by Trans-
control (NC) (Supplementary Table 1), pcDNA3.1,                           well chamber without or with Matrigel (BD Biosciences,
pcDNA3.1-SLC2A1-AS1, pcDNA3.1-GLI3, pcDNA3.1-                             San Diego, CA, USA) according to previous report [37].
Glut1 (Supplementary Table 2), NC-mimic, miR-378a-                        Briefly, EC9706, TE1 and KYSE180 cells (1 × 10⁵) were
3p mimic, NC-inhibitor, miR-378a-3p inhibitor (Gene-                      placed in the upper layer of chamber, whereas 20% FBS
Pharma Company, Shanghai, China), control siRNA and                       was added to underlayer of chamber. Subsequently, mi-
Glut1 siRNA (Santa Cruz company, USA) were trans-                         gratory and invasive cells were fixed using methanol,
fected into EC9706, TE1 and KYSE180 cells by                              followed by staining with crystal violet 48 h after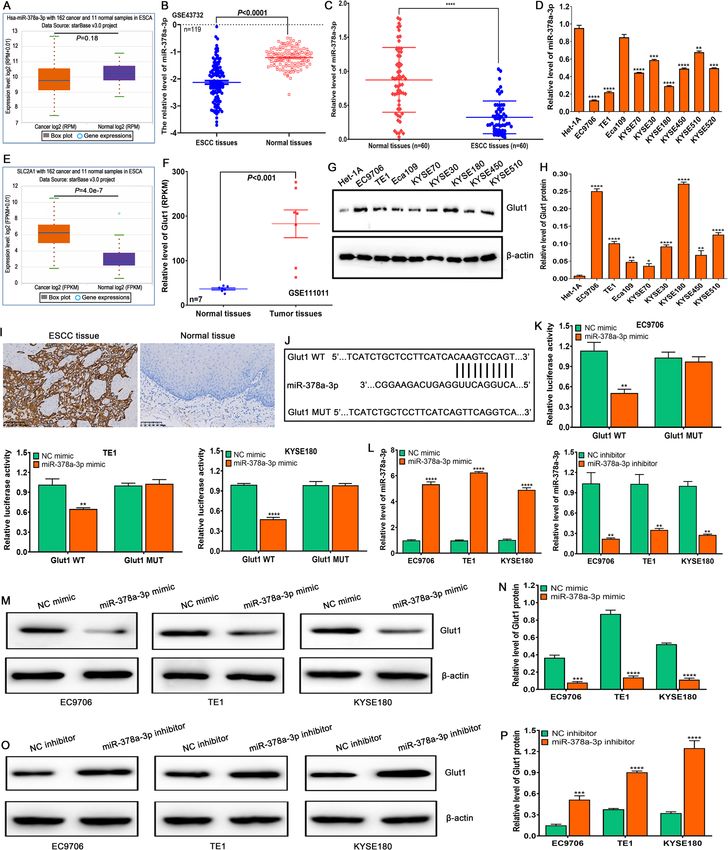
Liu et al. Journal of Experimental & Clinical Cancer Research   (2021) 40:287                                              Page 4 of 20

transfection. Finally, the number of invasive cells was in-               after blocking with skimmed milk. Subsequently, the
vestigated under the field of 200× magnification.                         secondary antibody (ZSGB-BIO, Guangzhou, China) was
                                                                          added to PVDF membrane. Finally, enhanced chemilu-
Glucose uptake and lactate production assays                              minescence (ECL) reagent (Beyotime, Haimen, China)
Glucose and lactate assay kits (Nanjing Jiancheng Bio-                    was utilized to develop the protein signal.
engineering Institute, Nanjing, China) were used to de-
termine the glucose consumption and lactate production                    The detection of luciferase activity
according to manufacturer’s instructions. All data ob-                    The dual luciferase reporter assay system was conducted to
tained were normalized to protein quantitative values.                    determine the direct interaction of SLC2A1-AS1 and miR-
                                                                          378a-3p as well as miR-378a-3p and Glut1. Recombinant vec-
Subcellular fractionation                                                 tor pmirGLO-SLC2A1-AS1-wild type (WT) and pmirGLO-
Cell nucleus and cytoplasm RNA isolation kit (Beibei,                     SLC2A1-AS1-mutation (MUT) as well as pmirGLO-Glut1-
Biotech, Co. Ltd., China) was used to extract the nuclear                 WT and pmirGLO-Glut1-MUT (TSINGKE Biological
RNA and cytoplasmic RNA, respectively, according to                       Technology, Beijing, China, the sequences of WT and MUT
manufacturer’s instruction, and then were investigated                    attached in Supplementary Table 4) along with miR-378a-3p
using qRT-PCR (Supplementary Table 3).                                    mimic and NC-mimic were transfected into EC9706, TE1
                                                                          and KYSE180 cells, respectively. For luciferase assay, pGL3-
Fluorescence in situ hybridization (FISH)                                 basic with SLC2A1-AS1 promoter MUT and WT sequences
SLC2A1-AS1 probe (5′-AAAAGCAAGGCTTGGCTC                                   (Supplementary Table 5) combined with pcDNA3.1 or
ACAA-3′) was synthesized and labeled using Cy3 by                         pcDNA3.1-GLI3 were transfected into EC9706, TE1 and
GenePharma Company, Shanghai, China. For FISH                             KYSE180 cells. The Luciferase activity was determined using
assay, EC9706, TE1 and KYSE180 cells were grown in                        the Luciferase Reporter Assay System (Promega, USA) 48 h
24-well plates with glass cover slips for 24 h. After                     after transfection according to manufacturer’s instruction.
immobilization and permeabilization, EC9706, TE1 and
KYSE180 cells were hybridized with 20 μM Cy3-labeled                      RNA immunoprecipitation (RIP)
SLC2A1-AS1 probe, and 6-diamidino-2-phenylindole                          RIP assay was performed in EC9706, TE1 and KYSE180
(DAPI) was used to stain cell nuclei of ESCC cells. The                   cells by using RNA-binding protein immunoprecipita-
images were observed with a florescent microscope.                        tion kit (Millipore company, Billerica, MA, USA) as de-
                                                                          scribed previously [38, 39]. Briefly, RIP lysates were
qRT-PCR                                                                   prepared from EC9706, TE1 and KYSE180 cells trans-
Total RNA was isolated by Trizol reagent (Invitrogen)                     fected with miR-378a-3p mimic or NC-mimic, and then
according to the manufacturer’s instructions. For mRNA                    were subjected to immunoprecipitation using 5 μl of ei-
analysis, qRT-PCR was performed using Power SYBR_                         ther a normal mouse IgG or 5 μl of Anti-Ago2 antibody
green PCR master mix (Applied Biosystems) on an ABI                       and the Mana RIP™ RNA-binding Protein Immunopre-
7500 series PCR machine Applied Biosystems using the                      cipitation Kit. The mRNA levels of SLC2A1-AS1 and
specific primers (Supplementary Table 3). For miR-                        miR-378a-3p enriched on beads was determined by
378a-3p expression assay, total RNA was reverse tran-                     qRT-PCR (Supplementary Table 3).
scribed using the miScript Reverse Transcription Kit
(Qiagen, Valencia, CA). qRT-PCR amplification for miR-                    In vivo nude mouse model
378a-3p was performed using the miScript PCR Kit                          Four- to six-week old female BALB/c nude mice pur-
(Qiagen) using the specific primers (Supplementary                        chased from Beijing Vital River Laboratory Animal Tech-
Table 3). Experiments were normalized to U6.                              nology Co.,Ltd. were utilized for the animal experiment.
                                                                          The protocols of animal experiments were approved by
Western blot                                                              the Animal Experiment Administration Committee of
Total proteins were extracted from ESCC cells using                       Zhengzhou University. For tumorigenesis assay, EC9706
RIPA lysis (Solarbio, Beijing, China) and the concentra-                  cells (1 × 10⁶ cells/each mouse) were subcutaneously
tion of the proteins was measured by Bradford method.                     injected into the right flank of nude mice at their back,
The proteins were separated by SDS-PAGE, and then                         with 5 mice per group. When tumor volume reached
transferred to PVDF membranes (Millipore Corporation,                     around 100mm3, NC, SLC2A1-AS1 siRNA, pcDNA3.1
Bedford, MA, USA). The primary antibodies against E-                      and pcDNA3.1-SLC2A1-AS1 were used to inject intratu-
cadherin, N-cadherin, Vimentin, Glut1, HK2, PFKM,                         morly into the nude mice (NC and SLC2A1-AS1 siRNA
PKM, LDHA and β-actin (1: 200 dilution, Abcam, Cam-                       modified by methylation and cholesterol, 2 nM for each
bridge, MA, USA) were incubated with PVDF membrane                        mouse; pcDNA3.1 and pcDNA3.1-SLC2A1-AS1 for each
(Roche, Switzerland) overnight at room temperature                        mouse with 2.5 μg) twice every week for a total of 4 weeks.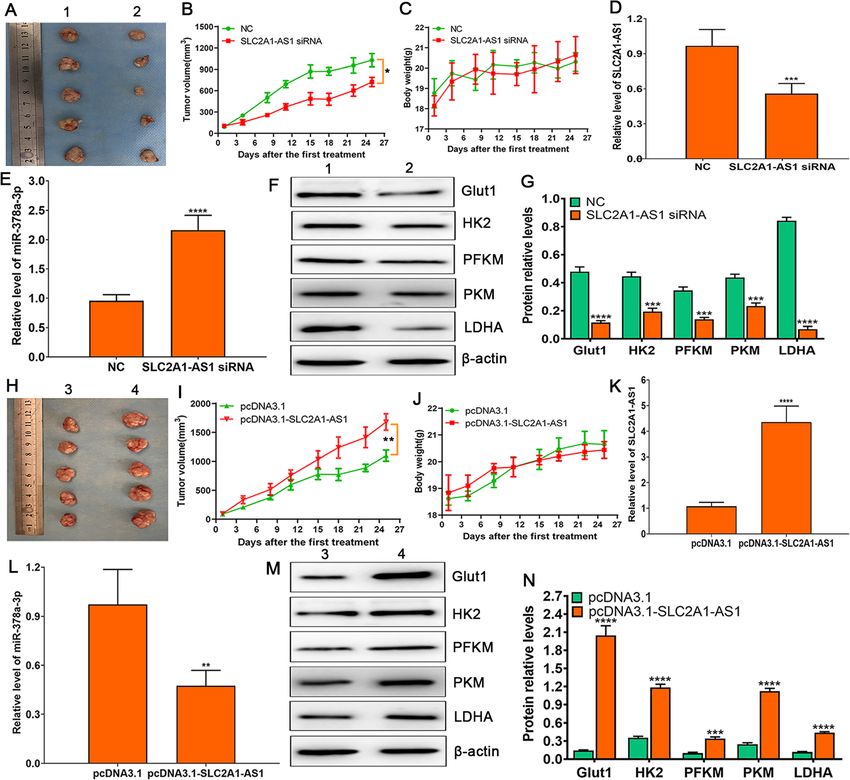
Liu et al. Journal of Experimental & Clinical Cancer Research   (2021) 40:287                                            Page 5 of 20

Tumor volume was measured twice every week, and                           These findings suggest that SLC2A1-AS1 may partici-
tumor growth curve was made using the formula                             pate in ESCC development.
“length×width2 × 3.14/6”. The mice were euthanized when                     To further dissect the role of SLC2A1-AS1 in progres-
the experiment was terminated. The tumor tissues were                     sion and metastasis of ESCC, we investigated the expres-
obtained for the isolation of total RNAs and proteins,                    sion of SLC2A1-AS1 in ESCC patients with diverse
qRT-PCR was used to investigate the SLC2A1-AS1 and                        clinicopathological features. We found that SLC2A1-
miR-378a-3p expression, and Western blot was performed                    AS1 expression was not related to the patients’ gender,
to determine the expressions of Glut1, HK2, PFKM, PKM                     age, smoking status, drinking, differentiation degree and
and LDHA proteins.                                                        tumor size (P > 0.05), however, its expression was tightly
                                                                          associated with TNM stage and lymph node metastasis
Statistical analysis                                                      (Fig. 1H). Notably, the survival time of ESCC patients
All experimental data from at least three independent                     with high SLC2A1-AS1 level was extremely lower than
repeats were investigated using GraphPad Prism 6.0 soft-                  that of ESCC patients with low SLC2A1-AS1 level (P <
ware. Data were presented as mean with standard devi-                     0.05) (Fig. 1I). These data indicate that SLC2A1-AS1
ation (SD). The IHC results were examined using chi-                      may be a novel predictor for metastasis and prognosis
square, and survival assay were performed using Log-                      for ESCC patients.
rank test. For the matched samples, the data was ana-
lyzed using Wilcoxon signed rank, and for non-matched                     Transcriptional factor GLI3 binds to SLC2A1-AS1
samples, the data were compared by Mann-Whitney test.                     promoter and induces its expression in ESCC
The comparison between two groups was determined                          To explore possible molecular events implicated in
using a Student’s t-test, and the comparison of > 3groups                 SLC2A1-AS1 high expression in ESCC, UCSC Genome
was determined using one-way ANOVA, and then Bon-                         Browser (http://genome.ucsc.edu/) was used to obtain
ferroni test was selected for further statistical assay when              the promoter sequence of SLC2A1-AS1, hTFtarget and
datasets contain > 3 groups. A P value less than 0.05 was                 JASPAR online software was used to predict the binding
regarded to be statistical significance.                                  site of transcription factors, we found that transcrip-
                                                                          tional factor GLI3 bound to three potential sites in
Results                                                                   SLC2A1-AS1 promoter region (Fig. 2A). pGL3-basic
SLC2A1-AS1 is upregulated in ESCC and correlated with                     with SLC2A1-AS1-promoter-WT or –MUT vectors
TNM stage, lymph node metastasis and patients’                            along with pcDNA3.1 or pcDNA3.1-GLI3 were co-
prognosis                                                                 transfected into ESCC cells, the results demonstrated
In this study, we investigated SLC2A1-AS1 expression in                   that co-transfection of pcDNA3.1-GLI3 and pGL3-
ESCA tissues by TCGA database and GEO dataset, the                        SLC2A1-AS1-promoter-WT extremely enhanced the ac-
data from TCGA database revealed that SLC2A1-AS1                          tivity of luciferase in EC9706, TE1 and KYSE180 cells,
expression in 162 cases of ESCA samples was markedly                      whereas the other groups displayed no difference (Fig.
higher than that in 11 cases of normal samples (Fig. 1A),                 2B). To verify the precise interaction site of GLI3 in
with no difference between EAC samples and normal                         SLC2A1-AS1 promoter region, three mutation vectors
samples (P > 0.05) (Fig. 1B), but significance difference                 harboring different SLC2A1-AS1 promoter mutation re-
exhibited in ESCC samples and normal samples (P <                         gion were constructed, these vectors combined with
0.0001) (Fig. 1C), suggesting SLC2A1-AS1 may be a                         pcDNA3.1 or pcDNA3.1-GLI3 were co-transfected to
novel biomarker for discriminating EAC and ESCC                           ESCC cells, we found that the mutation of site 2 signifi-
histological types. Further GEO dataset assay demon-                      cantly reduced the activity of luciferase in EC9706, TE1
strated that SLC2A1-AS1 level in 7 cases of ESCC tis-                     and KYSE180 cells (Fig. 2C), suggesting GLI3 mainly
sues was significantly higher than that in paired normal                  binds to the site2 region of SLC2A1-AS1 promoter.
esophageal tissues (Fig. 1D). To validate these data, we                     To further elucidate the expression of GLI3 in ESCC,
detected SLC2A1-AS1 expression in 60 cases of ESCC                        the result of TCGA database revealed that there was no
tissues and corresponding normal tissues by qRT-PCR                       difference in GLI3 expression between ESCA samples
using SLC2A1-AS1 specific primers. The results showed                     and normal samples (Fig. 2D), in which there was no dif-
that ESCC tissues displayed higher SLC2A1-AS1 expres-                     ference between EAC samples and normal samples (Sup-
sion than normal tissues (Fig. 1E). Afterwards, FISH                      plementary Fig. 1), however, significant difference was
assay demonstrated that SLC2A1-AS1 expression in                          found in ESCC samples and normal samples from
ESCC tissues was dramatically higher than that in nor-                    TCGA database (Fig. 2E),which was further confirmed
mal tissues (Fig. 1F). Meanwhile, we also found the high                  by GEO dataset in 7 cases of ESCC tissues and paired
expression of SLC2A1-AS1 in 4 ESCC cell lines, includ-                    normal tissues (Fig. 2F). Further investigation showed
ing EC9706, TE1, KYSE180 and KYSE450 (Fig. 1G).                           that GLI3 expression and SLC2A1-AS1 expression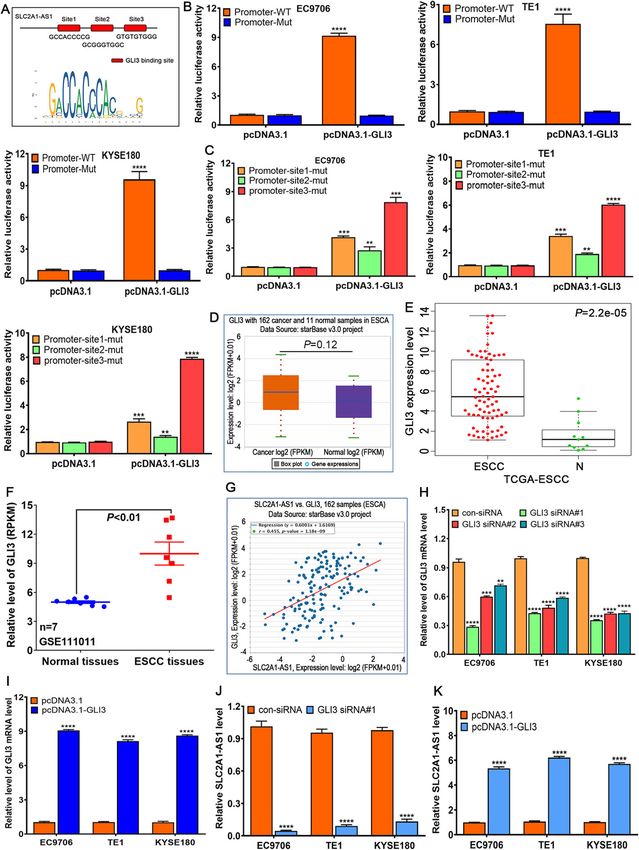
Liu et al. Journal of Experimental & Clinical Cancer Research   (2021) 40:287   Page 6 of 20

 Fig. 1 (See legend on next page.)
Liu et al. Journal of Experimental & Clinical Cancer Research (2021) 40:287 Page 7 of 20
(See figure on previous page.)
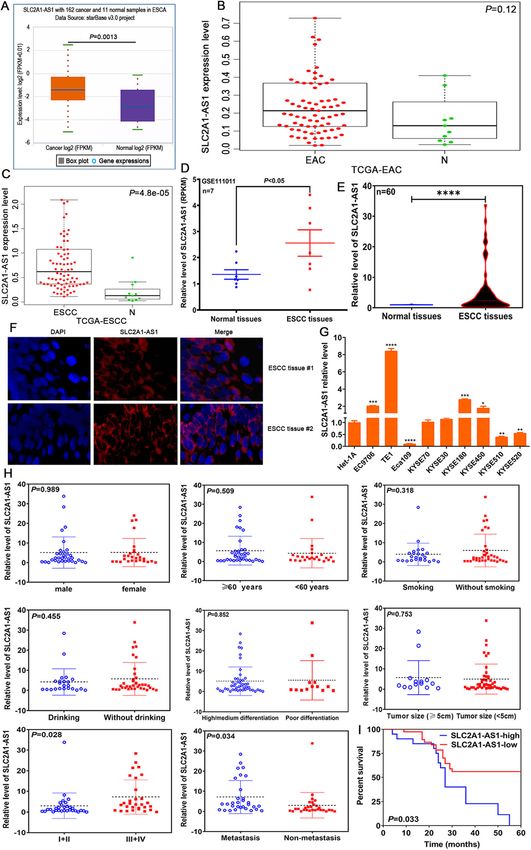
Fig. 1 SLC2A1-AS1 overexpression is correlated with TNM stage, lymph node metastasis and poor prognosis in ESCC patients. A. StarBase online
software assay for SLC2A1-AS1 expression level in 162 cases of ESCA tissues and 11 normal samples. B. TCGA database assay for SLC2A1-AS1
expression level in EAC samples and normal samples. C. TCGA database investigation for SLC2A1-AS1 expression level in ESCC samples and
normal samples. D. GEO dataset GSE111011 analysis for SLC2A1-AS1 expression level in 7 cases of ESCC tissues and paired normal tissues. E. qRT-
PCR assay for SLC2A1-AS1 expression level in 60 cases of ESCC tissues and corresponding normal tissues. F. Representative images of FISH results
regarding the high expression of SLC2A1-AS1 in ESCC tissues. G. The expression of SLC2A1-AS1 was detected by qRT-PCR in a panel of ESCC cells.
H. The correlations between SLC2A1-AS1 expression level and clinicopathological features, including gender, sex, smoking, drinking, differentiation
degree, tumor size, TNM stage and lymph node metastasis. I. Log-rank test determination for the prognostic value of SLC2A1-AS1 in ESCC
patients. Compared to normal tissues or Het-1A cell, *P < 0.05, **P < 0.01, ***P < 0.001 and ****P < 0.0001, indicating statistical significance
exhibited evidently positive correlation (P < 0.0001) (Fig. SLC2A1-AS1 depletion suppresses cell proliferation and
2G). To further verify whether GLI3 expression affected induces cell apoptosis in ESCC cells
the SLC2A1-AS1 expression in ESCC cells, three GLI3 Sustaining proliferation ability and resisting cell death
siRNAs designed were transfected to ESCC cells, we are two representative tumor hallmarks, which have
found GLI3 siRNA#1, 2 and 3 significantly downregu- been verified to be involved in tumor development and
lated the GLI3 expression in EC9706, TE1 and KYSE180 progression. Hence, we further investigated the roles of
cells (Fig. 2H), whereas pcDNA3.1-GLI3 markedly up- the alteration of SLC2A1-AS1 expression in cell prolifer-
regulated the GLI3 expression in EC9706, TE1 and ation and cell apoptosis in ESCC cells. Two siRNAs
KYSE180 cells (Fig. 2I). Stepwise investigation showed against SLC2A1-AS1 or NC was transfected into
that GLI3 downregulation triggered the decrease of EC9706, TE1 and KYSE180 cells, qRT-PCR was used to
SLC2A1-AS1 expression (Fig. 2J), whereas GLI3 upregu- verify the SLC2A1-AS1 expression. We found that two
lation evoked the increase of SLC2A1-AS1 expression in SLC2A1-AS1 siRNAs were both markedly downregu-
EC9706, TE1 and KYSE180 cells (Fig. 2K). These find- lated the SLC2A1-AS1 expression, in which SLC2A1-
ings suggest that GLI3 can bind to the promoter region AS1 siRNA #2 had the better interference effect (Fig. 3A),
of SLC2A1-AS1 and manipulate its expression in ESCC whereas pcDNA3.1-SLC2A1-AS1 significantly upregu-
cells. lated the SLC2A1-AS1 expression in EC9706, TE1 and
Whether SLC2A1-AS1 affected GLI3 expression in KYSE180 cells (Supplementary Fig. 3A). Subsequently,
ESCC cells, to this end, we firstly analyzed the possible CCK-8, colony formation and EdU staining was used to
regulatory correlation of SLC2A1-AS1 by LncACTdb2.0 assess the proliferation ability of ESCC cells, the results
online software, we found that SLC2A1-AS1 might ma- demonstrated that SLC2A1-AS1 downregulation signifi-
nipulate the GLI3, VEGFA, RUNX1, etc. (Supplementary cantly suppressed cell proliferation, reduced colony for-
Fig. 2A and B), further investigation showed that mation and EdU positive staining cell numbers (Fig. 3B-
SLC2A1-AS1 was tightly associated with self-sufficiency F), whereas the opposite data was presented after
in growth signals, evading apoptosis, tissue invasion and SLC2A1-AS1 overexpression (Supplementary Fig. 3B-F).
metastasis as well as reprogramming energy metabolism Further Flow cytometry assay revealed that SLC2A1-AS1
(Supplementary Fig. 2C). These findings suggest that depletion contributed to cell apoptosis (Fig. 3G and H).
SLC2A1-AS1 is widely implicated in tumor progression, In contrast, SLC2A1-AS1 overexpression suppressed cell
metastasis and metabolism, therefore, we further de- apoptosis (Supplementary Fig. 3G and H). Overall, these
tected several key signaling pathways, which was con- data imply that SLC2A1-AS1 functions as an oncogenic
firmed to be closely involved in tumor development and lncRNA in ESCC cells.
progression. We found that SLC2A1-AS1 mainly af-
fected Shh and Wnt signaling pathways. SLC2A1-AS1 SLC2A1-AS1 downregulation inhibits cell migration and
downregulation suppressed the expressions of GLI1, invasion accompanying reduced glycolysis in ESCC cells
GLI3, PTCH1, CD44 and Wnt10A (Supplementary Fig. Metabolic reprogramming has been verified to be in-
2D), whereas SLC1A1-AS1 overexpression enhanced volved in tumor progression and metastasis through af-
GLI1 and GLI3 expressions in EC9706, TE1 and fecting the expressions of glycolysis-related proteins.
KYSE180 cells (Supplementary Fig. 2E), in which GLI3 Here, we found that SLC2A1-AS1 depletion suppressed
displayed the most significant alteration among all genes, cell migration and invasion in ESCC cells (Fig. 4A, B
suggesting that SLC2A1-AS1 manipulates GLI3 expres- and C), coupled with increased E-cadherin protein ex-
sion in feedback regulatory manner. pression and reduced N-cadherin and Vimentin protein
expressions (Fig. 4D and E), whereas SLC2A1-AS1 over-
expression promoted cell migration and invasion in
ESCC cells (Supplementary Fig. 4 A, B and C), accom-
panying reduced E-cadherin protein expression and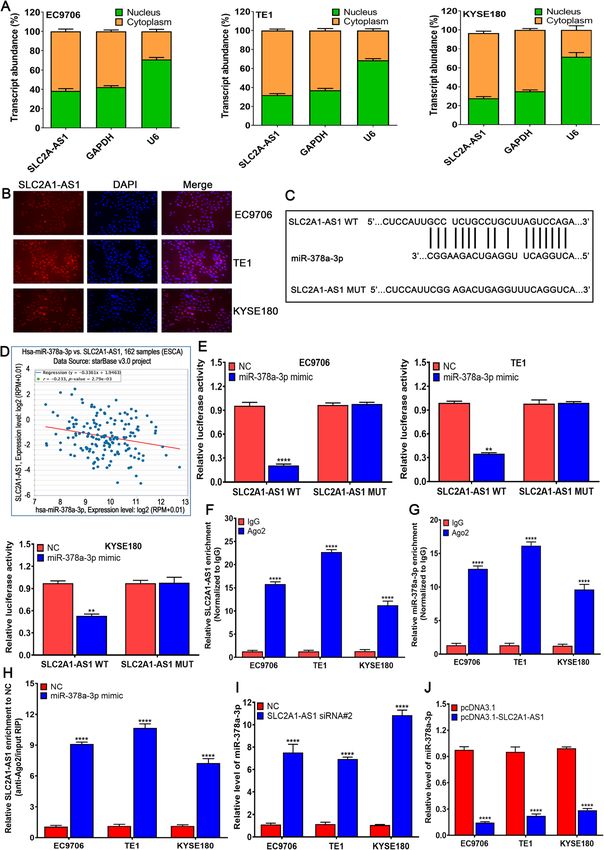
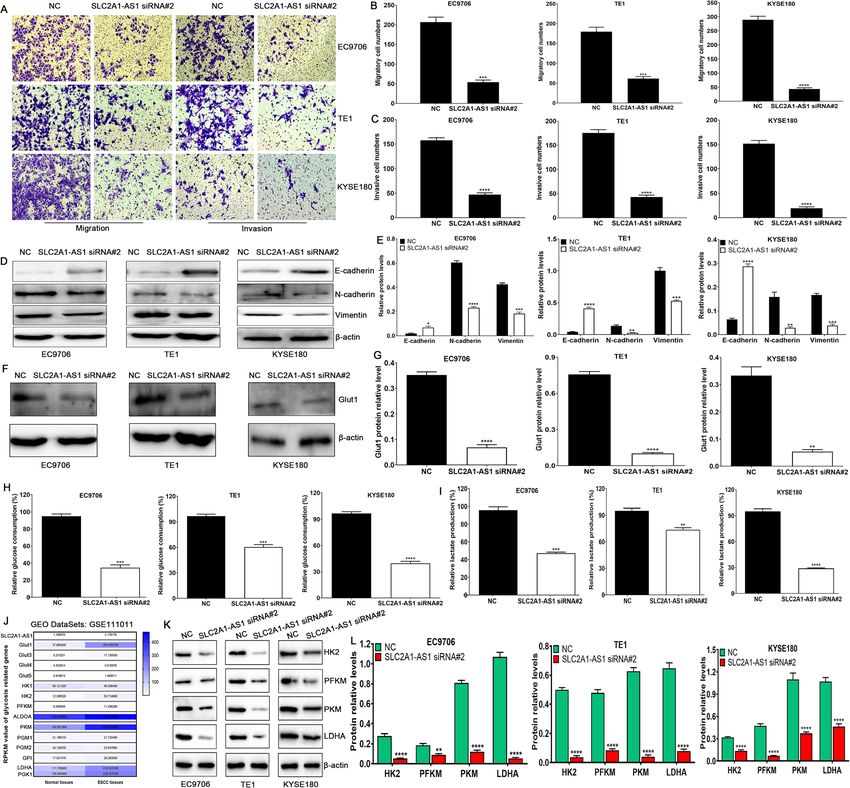
Liu et al. Journal of Experimental & Clinical Cancer Research      (2021) 40:287                                                            Page 8 of 20

 Fig. 2 Transcriptional factor GLI3 binds to the promoter region of SLC2A1-AS1 and manipulates its expression in ESCC cells. A. Three predicted GLI3
 binding sites on SLC2A1-AS1 promoter by hTFtarget and JASPAR online software. B and C. The luciferase reporter assay of pGL3-basic SLC2A1-AS1
 promoter vector with WT or MUT GLI3 binding sites in EC9706, TE1 and KYSE180 cells transfected with pcDNA3.1 or pcDNA3.1-GLI3 vector. D. StarBase
 online software assay for GLI3 expression in ESCA tissues. E. TCGA assay for GLI3 expression level in ESCC samples and normal samples. F. GEO dataset
 GSE111011 assay for GLI3 expression in 7 cases of ESCC tissues and paired normal tissues. G. StarBase online software assay for the correlation between
 GLI3 expression and SLC2A1-AS1 expression in ESCA samples. H. The detection of GLI3 expression after transfection with GLI3 siRNAs in ESCC cells. I.
 GLI3 expression assay after transfection with pcDNA3.1-GLI3 vector in ESCC cells. J. GLI3 siRNA markedly downregulates the SLC2A1-AS1 expression in
 ESCC cells. K. GLI3 overexpression significantly upregulates the SLC2A1-AS1 level in ESCC cells. Compared to pcDNA3.1 or con-siRNA group, **P < 0.01,
 ***P < 0.001 and ****P < 0.0001, indicating statistical significance

increased N-cadherin and Vimentin protein expressions                         effects (Supplementary Fig. 4 F-I). To further elucidate
(Supplementary Fig. 4 D and E). Further investigation re-                     the underlying mechanisms of glucose and lactate alter-
vealed that SLC2A1-AS1 depletion markedly downregu-                           ations mediated by SLC2A1-AS1, GSE111011 was used
lated the expression of Glut1 protein, and suppressed                         to investigate the expressions of glycolysis-related pro-
glucose consumption and lactate production (Fig. 4F-I),                       teins in 7 cases of ESCC tissues and paired normal tis-
whereas SLC2A1-AS1 overexpression showed opposite                             sues, we found that Glut1, HK2, PFKM, ALDOA, PKM,
Liu et al. Journal of Experimental & Clinical Cancer Research (2021) 40:287 Page 9 of 20
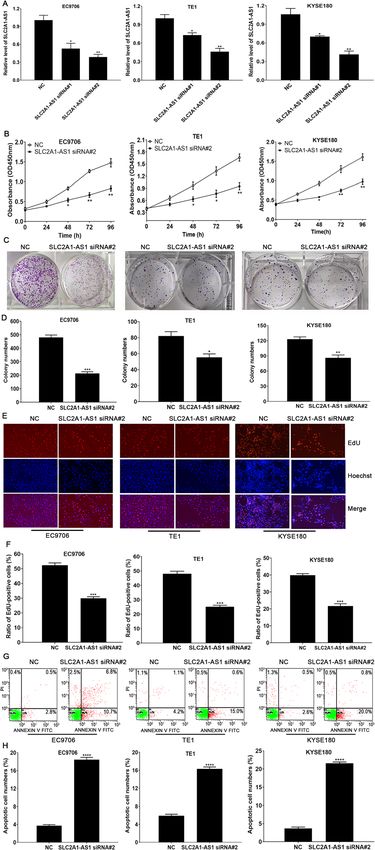
Fig. 3 SLC2A1-AS1 depletion contributes to the suppression of cell
proliferation and the induction of cell apoptosis in ESCC cells. A.
qRT-PCR was used to determine SLC2A1-AS1 expression following
transfection with SLC2A1-AS1 siRNA in ESCC cells. B. CCK-8 assay for
cell proliferation at 24 h, 48 h, 72 h and 96 h after transfection with
SLC2A1-AS1 siRNA in ESCC cells. C. SLC2A1-AS1 downregulation
markedly reduced colony formation in ESCC cells. D. Statistical assay
for the number of colony formation in ESCC cells treated with NC or
SLC2A1-AS1 siRNA. E. EdU staining assay for EdU-positive cell
numbers in ESCC cells treated with NC or SLC2A1-AS1 siRNA. F.
Quantitative assay of the ratio of EdU-positive cell numbers in ESCC
cells treated with NC or SLC2A1-AS1 siRNA. G. Flow cytometry
detection for cell apoptosis in different treatment ESCC cells. H.
Quantitative analysis for apoptotic cell numbers in a variety of ESCC
cells. Compared to NC group, *P < 0.05, **P < 0.01, ***P < 0.001 and
****P < 0.0001, indicating statistical significance
GPI, LDHA and PGK1 displayed high expression in
ESCC tissues, compared to normal tissues (Fig. 4J),
which was also confirmed in ESCC samples, EAC sam-
ples and normal samples from TCGA database (Supple-
mentary Fig. 5) as well as in 60 cases of ESCC samples
and paired normal samples (Supplementary Fig. 6). To
further dissect whether SLC2A1-AS1 affected the above
altered glycolysis-related proteins, we selected 4 key pro-
teins (HK2, PFKM, PKM and LDHA) as rate-limiting
enzymes of glycolysis. We found that SLC2A1-AS1
downregulation dramatically suppressed the expressions
of HK2, PFKM, PKM and LDHA proteins in EC9706,
TE1 and KYSE180 cells (Fig. 4 K and L), whereas
SLC2A1-AS1 overexpression evidently promoted the ex-
pressions of HK2, PFKM, PKM and LDHA in EC9706,
TE1 and KYSE180 cells (Supplementary Fig. 4 J and K).
These findings suggest that SLC2A1-AS1 depletion sup-
presses cell migration and invasion by inhibiting EMT
progression and glycolysis in ESCC cells.
SLC2A1-AS1 acts as a ceRNA and competitively absorbs
miR-378a-3p in ESCC cells
To investigate how SLC2A1-AS1 exerts its function in ESCC
cells, qRT-PCR assay of SLC2A1-AS1 level in the nucleus
and cytoplasm demonstrated that SLC2A1-AS1 was mainly
localized in the cytoplasm of ESCC cells (Fig. 5A), which was
further confirmed by FISH assay (Fig. 5B). Based on the
localization of SLC2A1-AS1, we hypothesized that SLC2A1-
AS1 functioned as a ceRNA in ESCC cells, and thus DIANA
LncBase Predicted v.2 was utilized to predict the possible
binding miRNAs of SLC2A1-AS1. We found that SLC2A1-
AS1 harbored the binding sites of miR-378a-3p (Fig. 5C).
SLC2A1-AS1 expression displayed the negative correlation
with miR-378a-3p in ESCA tissues (Fig. 5D). To test the
interaction of SLC2A1-AS1 and miR-378a-3p in ESCC cells,
Double Luciferase Report experiment was used to verify their
interaction. The results demonstrated that the luciferase in-
tensity was significantly reduced by co-transfecting miR-
378a-3p mimic and SLC2A1-AS1 WT, but not in theLiu et al. Journal of Experimental & Clinical Cancer Research (2021) 40:287 Page 10 of 20 Fig. 4 SLC2A1-AS1 depletion suppresses cell migration and invasion as well as glycolysis in ESCC cells. A. SLC2A1-AS1 downregulation suppresses cell migration and invasion in ESCC cells. B and C. Quantification of migrated cell numbers (B) and invasive cell numbers (C) in a variety of ESCC cells. D. SLC2A1-AS1 depletion suppressed EMT progression in ESCC cells. E. Quantification of E-cadherin, N-cadherin and Vimentin protein relative levels following treatment with NC or SLC2A1- AS1 siRNA. F. SLC2A1-AS1 knockdown suppresses Glut1 protein expression in a panel of ESCC cells. G. Quantification of Glut1 protein relative level following treatment with NC or SLC2A1-AS1 siRNA. H and I. SLC2A1-AS1 downregulation suppressed glucose consumption (H) and lactate production (I) in EC9706, TE1 and KYSE180 cells. J. GEO dataset GSE111011 assay for the expressions of glycolysis-related genes in 7 cases of ESCC samples and paired normal samples. K. SLC2A1-AS1 downregulation suppresses the expressions of glycolysis-related proteins, such as HK2, PFKM, PKM and LDHA, in ESCC cells. L. Quantification of relative expressions of HK2, PFKM, PKM and LDHA after transfection with NC or SLC2A1-AS1 siRNA in EC9706, TE1 and KYSE180 cells. Compared with NC group, *P < 0.05, **P < 0.01, ***P < 0.001 and ****P < 0.0001, indicating statistical significance mutant vector without miR-378a-3p binding site in EC9706, G). Besides, Ago2-RIP assay showed that SLC2A1-AS1 en- TE1 and KYSE180 cells (Fig. 5E). As a core component of richment in miR-378a-3p mimic group was markedly higher the RNA-induced silencing complex (RISC), Ago2 is in- than that in NC group (Fig. 5H). Subsequently, we found volved in miRNA-mediating mRNA destabilization or trans- that SLC2A1-AS1 silencing obviously enhanced miR-378a- lational repression, therefore, we further performed RIP assay 3p level (Fig. 5I), whereas SLC2A1-AS1 overexpression dra- by anti-Ago2 antibody, we found that SLC2A1-AS1 and matically reduced miR-378a-3p level in EC9706, TE1 and miR-378a-3p levels precipitated by anti-Ago2 antibody were KYSE180 cells (Fig. 5J). These data suggest that SLC2A1- dramatically increased compared to IgG group (Fig. 5F and AS1 directly regulates miR-378a-3p level in ESCC cells.
Liu et al. Journal of Experimental & Clinical Cancer Research           (2021) 40:287                                                                Page 11 of 20

 Fig. 5 SLC2A1-AS1 competitively absorbs miR-378a-3p by ceRNA mechanism in ESCC cells. A. qRT-PR assay of subcellular SLC2A1-AS1 level in the nucleus and
 cytoplasm of EC9706, TE1 and KYSE180 cells, GAPDH and U6 are employed as endogenous controls. B. Subcellular localization of SLC2A1-AS1 in EC9706, TE1 and
 KYSE180 cells is investigated by FISH experiment, SLC2A1-AS1 is labeled by Cy3 (red) and nuclei are stained with DAPI (blue). C. The miR-378a-3p binding sites in
 SLC2A1-AS1 transcript are predicted by DIANA LncBase Predicted v.2. D. The correlation of SLC2A1-AS1 with miR-378a-3p is examined in ESCA samples using the
 bioinformatics tool StarBase E. Double luciferase report experiment is performed to verify the interaction of SLC2A1-AS1 with miR-378a-3p by co-transfecting
 pmirGLO-SLC2A1-AS1-WT or pmirGLO-SLC2A1-AS1-MUT along with NC-mimic or miR-378a-3p mimic into ESCC cells, compared to NC group, **P < 0.01 and
 ****P < 0.0001, indicating statistical significance. F. Fold enrichment of SLC2A1-AS1 by Ago2 antibody or IgG in EC9706, TE1 and KYSE180 cells. G. Fold enrichment
 of miR-378a-3p by Ago2 antibody or IgG in EC9706, TE1 and KYSE180 cells. H. Enrichment of SLC2A1-AS1 in EC9706, TE1 and KYSE180 cells transfected with NC
 mimic or miR-378a-3p mimic, (F, G and H, compared to IgG group, ****P < 0.0001, indicating statistical significance). I. SLC2A1-AS1 depletion promotes the
 expression of miR-378a-3p in EC9706, TE1 and KYSE180 cells compared to NC group, ****P < 0.0001, indicating statistical significance. J. SLC2A1-AS1
 overexpression suppresses the expression of miR-378a-3p in EC9706, TE1 and KYSE180 cells, compared to pcDNA3.1, ****P < 0.0001, indicating
 statistical significance
Liu et al. Journal of Experimental & Clinical Cancer Research   (2021) 40:287                                            Page 12 of 20

The associations of miR-378a-3p and Glut1 expressions                     whereas miR-378a-3p inhibitor markedly downregulated
with clinicopathological features and Glut1 is a target of                the level of miR-378a-3p in EC9706, TE1 and KYSE180
miR-378a-3p in ESCC cells                                                 cells (Fig. 6L). Western blot assay showed that miR-
To explore the possible roles of miR-378a-3p and Glut1                    378a-3p mimic dramatically downregulated the expres-
in ESCC development and progression, we detected their                    sion of Glut1 protein (Fig. 6M and N), whereas miR-
expressions and investigated their correlations with clini-               378a-3p inhibitor extremely upregulated the expression
copathological features. TCGA assay revealed that there                   of Glut1 protein in EC9706, TE1 and KYSE180 cells
was no difference in the miR-378a-3p or miR-378a ex-                      (Fig. 6O and P). These findings suggest that Glut1 is a
pressions between ESCC and normal samples or EAC                          direct target of miR-378a-3p in ESCC cells.
and normal samples (Fig. 6A, Supplementary Fig. 7 A
and B), but GEO assay exhibited significant difference in
miR-378a-3p expression level between ESCC tissues and                     The alterations of proliferation, apoptosis and invasion
normal tissues (Fig. 6B), which was further validated by                  triggered by miR-378a-3p are reversed by SLC2A1-AS1
qRT-PCR in 60 cases of ESCC tissues and paired normal                     and Glut1 overexpression in ESCC cells
tissues (Fig. 6C) as well as ESCC cells and normal                        To verify whether the biological roles of miR-378a-3p
esophageal epithelial cell Het-1A (Fig. 6D). Besides,                     exerted in a SLC2A1-AS1- or Glut1-dependent manner,
TCGA and GEO assay demonstrated that Glut1 expres-                        we transfected ESCC cells using NC mimic, miR-378a-
sion in ESCC and EAC tissues was significantly higher                     3p mimic, miR-378a-3p mimic plus pcDNA3.1-SLC2A1-
than that in normal tissues (Fig. 6E and F, Supplemen-                    AS1 and miR-378a-3p mimic plus pcDNA3.1-Glut1 as
tary Fig. 8 A and B), which was also confirmed in ESCC                    well as NC inhibitor, miR-378a-3p inhibitor, miR-378a-
cells and normal esophageal epithelial cell Het-1A by                     3p inhibitor plus SLC2A1-AS1 siRNA and miR-378a-3p
Western blot (Fig. 6G and H) as well as in 60 cases of                    inhibitor plus Glut1 siRNA. We found miR-378a-3p
ESCC tissues and paired normal tissues by IHC assay                       mimic suppressed cell proliferation and invasion and in-
(Fig. 6I, Supplementary Table 6). These findings suggest                  creased apoptotic cell numbers (Fig. 7A-E), whereas
that low miR-378a-3p or high Glut1 expression may par-                    SLC2A1-AS1 and Glut1 overexpressions recovered in
ticipate in ESCC development and progression.                             part the effects in ESCC cells (Fig. 7A-E). Conversely,
   To further investigate the associations of miR-378a-3p                 miR-378a-3p inhibitor promoted cell proliferation and
and Glut1 with clinicopathological features of ESCC pa-                   invasion and decreased apoptotic cell numbers (Supple-
tients, GraphPad Prism 8.0 software was used to analyze                   mentary Fig. 9A-E), whereas SLC2A1-AS1 and Glut1 si-
the their correlations. We found that miR-378a-3p level                   lencing reversed in part the effects in ESCC cells
was not related to ESCC patients’ gender, age, smoking,                   (Supplementary Fig. 9A-E). These findings revealed that
drinking and differentiation degree (P > 0.05), but was                   miR-378a-3p functions as tumor suppressor in a
closely correlated with tumor size, TNM stage and                         SLC2A1-AS1- or Glut1-dependent manner.
lymph node metastasis (P < 0.05) (Supplementary                              Given the links of SLC2A1-AS1 with miR-378a-3p, we
Table 7). Besides, Glut1 expression was not related to                    put forward to whether miR-378a-3p triggered the alter-
ESCC patients’ gender, age, smoking, drinking and                         ations of glycolysis in ESCC and whether these changes
tumor size (P > 0.05), but was tightly correlated with dif-               were also reversed by SLC2A1-AS1 or Glut1. Thus, we
ferentiation degree, TNM stage and lymph node metas-                      investigated the changes of glucose consumption and
tasis (P < 0.05) (Supplementary Table 8). These findings                  lactate production as well as glycolysis-related gene ex-
suggest that miR-378a-3p and Glut1 may be novel pre-                      pressions. We found that miR-378a-3p mimic reduced
dictors for TNM stage and metastasis of ESCC patients.                    glucose consumption, lactate production and the expres-
   To further explore the regulatory role of miR-378a-3p                  sions of HK2, PFKM, PKM and LDHA proteins (Fig. 7F-
on Glut1 in ESCC cells, miRDB online software was                         I), whereas SLC2A1-AS1 and Glut1 overexpressions re-
used to predict the target genes of miR-378a-3p. We                       covered in part the effects (Fig. 7F-I). Conversely, miR-
found that Glut1 had the potential binding sites of miR-                  378a-3p inhibitor promoted glucose consumption, lac-
378a-3p (Fig. 6J). Further Double Luciferase Report assay                 tate production and the expressions of HK2, PFKM,
revealed that the luciferase intensity was significantly re-              PKM and LDHA proteins (Supplementary Fig. 9F-I),
duced by co-transfecting miR-378a-3p mimic and Glut1                      whereas SLC2A1-AS1 and Glut1 silencing exhibited the
     WT, but not in the mutant vector without miR-                        opposite effects (Supplementary Fig. 9F-I). These find-
378a-3p binding site in EC9706, TE1 and KYSE180 cells                     ings suggest that SLC2A1-AS1 functions as an onco-
(Fig. 6K). Subsequently, we detected the miR-378a-3p                      genic lncRNA that promoted cell proliferation,
expression in ESCC cells by tranfecting miR-378a-3p                       migration and invasion as well as glycolysis via SLC2A1-
mimic or inhibitor, we found that miR-378a-3p mimic                       AS1/miR-378a-3p/Glut1 signal axis in ESCC cells (Fig.
significantly upregulated the level of miR-378a-3p,                       7J).
Liu et al. Journal of Experimental & Clinical Cancer Research (2021) 40:287 Page 13 of 20 Fig. 6 (See legend on next page.)
Liu et al. Journal of Experimental & Clinical Cancer Research        (2021) 40:287                                                             Page 14 of 20

 (See figure on previous page.)
 Fig. 6 The expressions of miR-378a-3p and Glut1, and Glut1 is a direct target of miR-378a-3p in ESCC cells. A. The expression of miR-378a-3p is
 detected in 162 cases of ESCA samples and 11 cases of normal samples by StarBase online software. B. The miR-378a-3p level is investigated in 119
 cases of ESCC tissues and paired normal tissues by GEO dataset GSE43732. C. The miR-378a-3p level is determined in 60 cases of ESCC tissues and
 paired normal tissues by qRT-PCR, compared to normal tissues, ****P < 0.0001, indicating statistical significance. D. The expression of miR-378a-3p is
 examined by qRT-PCR in a panel of ESCC cells, compared to Het-1A cell, **P < 0.01, ***P < 0.001 and ****P < 0.0001, indicating statistical significance. E.
 The expression of Glut1 is detected in 162 cases of ESCA samples and 11 cases of normal samples by StarBase online software. F. The Glut1 level is
 investigated in 7 cases of ESCC tissues and paired normal tissues by GEO Dataset GSE111011. G. Western blot assay for Glut1 protein expression in a
 panel of ESCC cells and normal esophageal epithelial cell Het-1A. H. Quantification of relative levels of Glut1 in a number of ESCC cells and normal
 esophageal epithelial cell Het-1A, compared to Het-1A cell, *P < 0.05, **P < 0.01 and ****P < 0.0001, indicating statistical significance. I. IHC assay for
 Glut1 protein expression in 60 cases of ESCC tissues and paired normal tissues. J. The miR-378a-3p binding sites in Glut1 transcript are predicted by
 miRDB online software. K. Double luciferase report experiment is carried out to confirm the interaction of Glut1 with miR-378a-3p by co-transfecting
 pmirGLO-Glut1-WT or pmirGLO-Glut1-MUT as well as NC-mimic or miR-378a-3p mimic into ESCC cells. L. miR-378a-3p mimic upregulates the
 expression of miR-378a-3p, whereas miR-378a-3p inhibitor downregulates the miR-378a-3p level in ESCC cells. M. miR-378a-3p mimic suppresses the
 expression of Glut1 protein in ESCC cells. N. The analysis of relative level of Glut1 protein after transfection with NC mimic or miR-378a-3p mimic in
 ESCC cells. O. miR-378a-3p inhibitor enhances the expression of Glut1 protein in ESCC cells. P. The assay of relative level of Glut1 protein after
 transfection with NC inhibitor or miR-378a-3p inhibitor in ESCC cells. (K, L and N, compared to NC-mimic or NC-inhibitor, **P < 0.01, ***P < 0.001 and
 ****P < 0.0001, indicating statistical significance)

SLC2A1-AS1 promotes tumorigenesis and glycolysis                                 in vitro and in vivo, migration and invasion ability, and
in vivo in ESCC xenografted nude mice                                            induced cell apoptosis, coupled with alterations of EMT-
To verify the roles of SLC2A1-AS1 in ESCC cells xeno-                            related molecules and glycolysis-related proteins. Im-
grafted nude mice, chemically modified siRNA and over-                           portantly, SLC2A1-AS1 sponged miR-378a-3p to in-
expression vector of SLC2A1-AS1 were used to treat the                           crease the Glut1 expression, further promoted the
tumor. The tumor growth curve demonstrated that                                  expressions of glycolysis-related proteins, which led to
SLC2A1-AS1 knockdown dramatically suppressed tumor                               ESCC progression and increased glycolysis, and thus tar-
growth (Fig. 8A and B), but not affected the body weight                         geting SLC2A1-AS1/miR-378a-3p/Glut1 signal axis may
of nude mice (Fig. 8C), coupled with SLC2A1-AS1                                  be a novel therapeutic target for ESCC patients.
downregulation and miR-378a-3p upregulation in                                      Genome-wide analysis has identified a large number of
EC9706 cells xenografted tumor tissues (Fig. 8D and E).                          differential lncRNAs in a number of tumor types. Our
Further Western blot assay showed that SLC2A1-AS1                                previous report has unveiled many differential lncRNAs
depletion markedly reduced the expressions of Glut1,                             in ESCA [35]. Based on this study, we focused on
HK2, PFKM, PKM and LDHA in EC9706 cells xeno-                                    SLC2A1-AS1 as a novel lncRNA molecule in ESCA. We
grafted tumor tissues (Fig. 8F and G); whereas SLC2A1-                           found SLC2A1-AS1 was highly expressed in ESCC tis-
AS1 overexpression displayed the opposite effects on                             sues and cells, and its overexpression was tightly corre-
tumor growth (Fig. 8H and I), mice weight (Fig. 8J), the                         lated with TNM stage, lymph node metastasis and poor
expressions of SLC2A1-AS1 and miR-378a-3p (Fig. 8K                               prognosis of ESCC patients, which was similar to the
and L) as well as the expressions of glycolysis-related                          study reported in LUAD [33], but was inconsistent with
proteins (Glut1, HK2, PFKM, PKM and LDHA) (Fig. 8M                               the data previously reported in HCC [34]. These differ-
and N) in EC9706 cells xenografted tumor tissues. These                          ent expression of SLC2A1-AS1 in different tumor types
data indicate that SLC2A1-AS1 contributes to ESCC                                suggest that SLC2A1-AS1 expression may be tumor
tumorigenesis and glycolysis in vivo.                                            dependent. Many studies have revealed that transcrip-
                                                                                 tional factors play important regulatory roles in the ex-
Discussion                                                                       pressions of many genes. Wang C, et al. found that c-
Currently, a great number of lncRNAs implicated in                               myc bound to the promoter region of PVT1 to enhance
tumor progression and glycolysis are rapidly expanding                           the expression of PVT1 in cervical cancer [41]. HIF-1
[30, 40]. In this study, we reported a novel lncRNA                              was identified to directly bind to the promoter region of
SLC2A1-AS1 involved in ESCC glycolysis. SLC2A1-AS1                               PDIA3P1, further resulting in its transcription activation
was frequently overexpressed in ESCC tissues and cells,                          in glioma [42]. Notably, the transcription factor activat-
and its overexpression was tightly correlated with TNM                           ing enhancer binding protein 2 α (TFAP2A) regulated
stage, lymph node metastasis and poor prognosis of                               the transcription of SLC2A1-AS1 by directly binding to
ESCC patients. GLI3 as a transcriptional factor drove                            its promoter region in LUAD cells [33]. To explore the
the SLC2A1-AS1 expression in ESCC cells, whereas                                 possible regulatory factors of SLC2A1-AS1 in ESCC
SLC2A1-AS also manipulated the GLI3 expression,                                  cells, hTFtarget and JASPAR online software were used
which formed an important regulatory feedback loop in                            to predict the binding sites of transcription factors in the
ESCC. SLC2A1-AS1 silencing suppressed cell growth                                promoter region of SLC2A1-AS1, we found that GLI3
Liu et al. Journal of Experimental & Clinical Cancer Research (2021) 40:287 Page 15 of 20 Fig. 7 (See legend on next page.)
Liu et al. Journal of Experimental & Clinical Cancer Research          (2021) 40:287                                                              Page 16 of 20

 (See figure on previous page.)
 Fig. 7 miR-378a-3p mimic mediated biological effects is dependent on the SLC2A1-AS1 and Glut1 expression in ESCC cells. A. ESCC cell proliferation was
 assessed by CCK-8 assay in NC mimic group, miR-378a-3p mimic group, miR-378a-3p plus pcDNA3.1-SLC2A1-AS1 group and miR-378a-3p plus pcDNA3.1-Glut1
 group. B. Cell apoptosis was determined by Flow cytometry in the same groups appeared in cell proliferation. C. Quantitative assay of apoptotic cell numbers in
 different treatment ESCC cells. D. Cell invasion ability was detected using Transwell chamber in various ESCC cells with different groups. E. Quantification of
 invasive cell numbers in diverse ESCC cells with various groups. F and G. The determination of glucose consumption (F) and lactate production (G) in different
 groups. H. Western blot assay for HK2, PFKM, PKM and LDHA protein expressions in diverse groups. I. Quantification of the relative levels of HK2, PFKM, PKM and
 LDHA proteins in different treatment groups. *P < 0.05, **P < 0.01, ***P < 0.001 and ****P < 0.0001 were regarded as statistical significance. J. A proposed
 scheme of the roles and molecular mechanisms of SLC2A1-AS1 in ESCC progression and glycolysis is presented. Note: 1: NC mimic; 2: miR-378a-3p mimic; 3:
 miR-378a-3p plus SLC2A1-AS1; 4: miR-378a-3p plus Glut1

potentially bound to three sites of SLC2A1-AS1 pro-                               378a-3p in ESCC cells, notably, when miR-378a-3p was
moter region. At present, GLI3 has been reported to be                            overexpressed, the enrichment of SLC2A1-AS1 was dra-
tightly associated with tumor development and progres-                            matically enhanced, suggesting that SLC2A1-AS1 and
sion [43, 44]. Further investigation revealed that GLI3                           miR-378a-3p appeared in the same RISC in ESCC cells.
bound to the region of SLC2A1-AS1 promoter and pro-                               Meanwhile, SLC2A1-AS1 depletion significantly upregu-
moted its expression in ESCC cells, whereas SLC2A1-                               lated the miR-378a-3p level, whereas SLC2A1-AS1 over-
AS1 also affected the expression of GLI3, which formed                            expression extremely downregulated the miR-378a-3p
an important regulatory feedback loop in ESCC cells,                              level in ESCC cells. These findings indicate that
however, how SLC2A1-AS1 recruited other transcription                             SLC2A1-AS1 functions as the sponge of miR-378a-3p to
factors affecting GLI3 expression needs to be further                             regulate miR-378a-3p expression in ESCC cells.
explored.                                                                           There is growing evidence that miRNAs are widely
    Increasing evidence has demonstrated that lncRNAs                             deregulated in a number of tumors, highlighting its key
are implicated in the regulation of biological processes,                         regulatory role in onset, growth and metastasis of tu-
such as cell proliferation, apoptosis, invasion and metas-                        mors [51]. Emerging data suggest that miRNAs play es-
tasis in a multiple of tumors [45, 46], and manipulation                          sential regulatory roles in different physiological and
of its expression may be a novel therapeutic strategy                             pathological processes by targeting a majority of mRNAs
[47]. In this study, we verified that SLC2A1-AS1 down-                            [52]. At present, miR-378a-3p has been reported to be
regulation suppressed tumor growth and glycolysis                                 involved in tumor development, progression and drug
in vitro and in vivo, decreased migration and invasion                            resistance by manipulating a series of targeted genes. For
and enhanced cell apoptosis, coupled with increased E-                            example, miR-378 functions as an enhancer of cell
cadherin expression and reduced expressions of N-                                 growth, cell survival and angiogenesis by targeting SuFu
cadherin, Vimentin, HK2, PFKM, PKM and LDHA pro-                                  and Fus-1 [53]. MiR-378a-3p has been confirmed to
teins, and converse data were obtained following                                  sensitize tumor cells to cisplatin in ovarian cancer by
SLC2A1-AS1 overexpression. The alterations of these                               targeting MAPK2/GRB2 [54]. To further unveil the
fundamental phenotypes evoked by SLC2A1-AS1 sug-                                  functions of miR-378a-3p in ESCC, we firstly examined
gest that SLC2A1-AS1 may function as oncogene in                                  the expression of miR-378a-3p in ESCC. We found that
ESCC and play an essential role in ESCC glycolysis.                               miR-378a-3p was frequently downregulated in ESCC tis-
  In general, nuclear lncRNAs play the important regu-                            sues and cells by TCGA database, GEO dataset and
latory roles in chromatin structure and gene transcrip-                           qRT-PCR, and its expression was tightly associated with
tion [48, 49], whereas cytoplasmic lncRNAs function as                            tumor size, TNM stage and lymph node metastasis in
ceRNA to control gene expression [50], implying that                              ESCC patients, suggesting its implication in ESCC devel-
the function of lncRNAs is dependent on its subcellular                           opment and progression. To uncover its underlying tar-
localization. Given the complexity and diversity of                               get genes, miRDB database was used to predict the
lncRNA functions in tumor cells, we firstly examined                              possible downstream target genes. We found that Glut1
subcellular localization of SLC2A1-AS1 in ESCC cells.                             was a potential target of miR-378a-3p. To test the pre-
We found that SLC2A1-AS1 mainly localized in cyto-                                diction, Double Luciferase Report experiment was used
plasm of ESCC cells by qRT-PCR and FISH. We hypoth-                               to validate it. We confirmed that miR-378a-3p bound to
esized that SLC2A1-AS1 exerted its function via ceRNA                             3′-UTR region of Glut1 to manipulate its expression in
mechanism. Our data supported the hypothesis that                                 ESCC cells. MiR-378a-3p overexpression markedly sup-
SLC2A1-AS1 sponged miR-378a-3p in ESCC cells by                                   pressed the Glut1 expression, whereas miR-378a-3p in-
Double Luciferase Report Assay. Stepwise investigation                            hibitor dramatically promoted the Glut1 expression in a
from Ago2-RIP assay demonstrated that Anti-Ago2 anti-                             panel of ESCC cells. These findings highlight the link of
body markedly enriched the SLC2A1-AS1 and miR-                                    miR-378a-3p with Glut1 in ESCC cells.
You can also read