ELECTROCHEMICAL DETECTION OF ASCORBIC ACID IN ARTIFICIAL SWEAT USING A FLEXIBLE ALGINATE/CUO-MODIFIED ELECTRODE
←
→
Page content transcription
If your browser does not render page correctly, please read the page content below
Microchimica Acta (2020) 187: 520
https://doi.org/10.1007/s00604-020-04510-5

    ORIGINAL PAPER

Electrochemical detection of ascorbic acid in artificial sweat using
a flexible alginate/CuO-modified electrode
Bergoi Ibarlucea 1,2        &   Arnau Pérez Roig 1 & Dmitry Belyaev 1 & Larysa Baraban 1,2 & Gianaurelio Cuniberti 1,2

Received: 16 May 2020 / Accepted: 18 August 2020 / Published online: 27 August 2020
# The Author(s) 2020

Abstract
A flexible sensor is presented for electrochemical detection of ascorbic acid in sweat based on single-step modified gold
microelectrodes. The modification consists of electrodeposition of alginate membrane with trapped CuO nanoparticles. The
electrodes are fabricated at a thin polyimide support and the soft nature of the membrane can withstand mechanical stress beyond
requirements for skin monitoring. After characterization of the membrane via optical and scanning electron microscopy and
cyclic voltammetry, the oxidative properties of CuO are exploited toward ascorbic acid for amperometric measurement at
micromolar levels in neutral buffer and acidic artificial sweat, at ultralow applied potential (− 5 mV vs. Au pseudo-reference
electrode). Alternatively, measurement of the horizontal shift of redox peaks by cyclic voltammetry is also possible. Obtaining a
limit of detection of 1.97 μM, sensitivity of 0.103 V log (μM)−1 of peak shift, and linear range of 10–150 μM, the effect of
possible interfering species present in sweat is minimized, with no observable cross-reaction, thus maintaining a high degree of
selectivity despite the absence of enzymes in the fabrication scheme. With a lateral flow approach for sample delivery, repeated
measurements show recovery in few seconds, with relative standard deviation of about 20%, which can serve to detect increased
loss or absence of vitamin, and yet be improved in future by optimized device designs. This sensor is envisioned as a promising
component of wearable devices for e.g. non-invasive monitoring of micronutrient loss through sweat, comprising features of light
weight, low cost, and easy fabrication needed for such application.

Keywords Ascorbic acid . Nonenzymatic sensor . Electroanalysis . CuO nanoparticles

Introduction                                                                in secreted body fluids, e.g., sweat [2]. Consequently, heat-
                                                                            exposed activities (e.g., in steel factories) or prolonged sport
The long-time known essential ascorbic acid (vitamin C) is a                sessions result in nutrient loss through sweating, including
water-soluble molecule that, like other water-soluble vitamins,             that of ascorbic acid [3], making it necessary to monitor them
cannot be stored in the body for a long time [1]; it can be found           for the on-time response by dietary intake without delay.
                                                                            Thus, ascorbic acid is an important target for quantitative
Electronic supplementary material The online version of this article        sensing and monitoring in the biomedical field, relevant also
(https://doi.org/10.1007/s00604-020-04510-5) contains supplementary         for the food and beverage industry, e.g., for quality control. It
material, which is available to authorized users.
                                                                            is typically measured by high-performance liquid chromatog-
                                                                            raphy [4], enzyme-based colorimetric multiwell kits [5], or
* Bergoi Ibarlucea
  bergoi.ibarlucea@tu-dresden.de                                            capillary electrophoresis [6], with limits of detection and lin-
                                                                            ear ranges oscillating between nanomolar and micromolar
* Larysa Baraban
  l.baraban@hzdr.de                                                         concentrations. These methods are remote laboratory tech-
                                                                            niques, with no possibility for on-site measurements.
1
                                                                                Taking into account modern day lifestyle and needs, the
     Institute for Materials Science and Max Bergmann Center for
     Biomaterials, Technische Universität Dresden, Dresden, Germany
                                                                            sensor design principles should evolve correspondingly [7]. In
2
                                                                            special professional groups like athletes or heat-exposed
     Center for advancing electronics Dresden (cfaed), Technische
     Universität Dresden, Dresden, Germany
                                                                            workers, a miniaturized electrical device with low power re-
3
                                                                            quirements and low cost but retaining high sensitivity, inte-
     Present address: Institute of Radiopharmaceutical Cancer Research,
     Helmholtz-Zentrum Dresden-Rossendorf e.V., Dresden, Germany
                                                                            grated in the garment or the skin, would fulfill the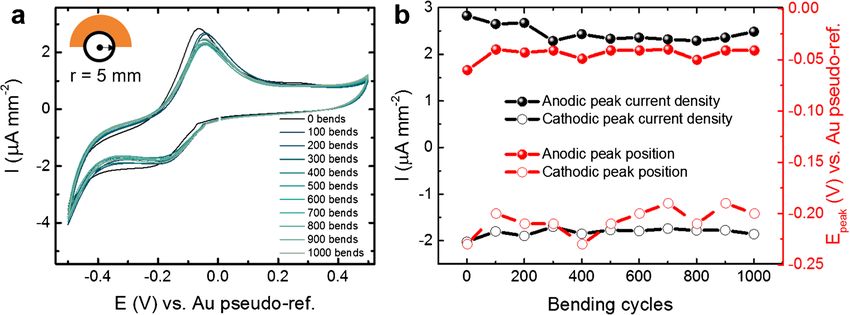
520 Page 2 of 11                                                                                          Microchim Acta (2020) 187: 520

requirements of a continuous monitoring for preventive               overlapping oxidation potentials [30–32]. Krishnan et al.
healthcare application. In this context, micro- and                  [33] proposed indium tin oxide electrodes with graphitic
nanofabrication techniques play an important role by helping         C3N4 nanosheets that were modified with nanocomposites
to perform detection processes in a small and low-cost chip [8,      made of mesoporous Ag-doped TiO2-SnO2. Differential
9] with the potential to include flexible characteristics to with-   pulsed voltammetry experiments allowed to obtain three dis-
stand mechanical stress produced by the movement of the end          tinct peaks for ascorbic acid, dopamine, and uric acid in 50-
user [10–13]. Several advanced examples of flexible and even         fold diluted urine. The same three analytes can be distin-
stretchable sensors that could potentially be applied for sweat      guished as well by using combinations of different materials,
sensing can be found in the state of the art, based on different     among which we may mention: TmPO4 and graphene oxide
materials and focused on different target analytes. The most         composites [34], assemblies of positively charged Zn-NiAl-
usual materials that can be found are polymeric, like polydi-        layered double hydroxide with negatively charged reduced
methylsiloxane, with channels containing dyes for the colori-        graphene oxide [35], or three dimensional porous structures
metric sensing of pH, lactate, glucose, and chloride [14], or        of MoS2 and reduced graphene oxide composites [36].
polyethylene terephthalate, with electrodes modified with the        Instead, if reduced graphene oxide containing Fe3O4 nanopar-
corresponding enzymes and ionophores for electrochemical             ticles is modified with hydroxypropyl-β-cyclodextrin, ascor-
and potentiometric detection of glucose, lactate, sodium, and        bic acid, serotonin, and dopamine can be distinguished using
potassium [13]. Other materials can be found as well, like           the same electrochemical technique [37], as demonstrated in
temporary transfer tattoo paper modified with enzyme-                serum samples. On the other hand, it is also known that metal
modified electrodes for lactate detection [15], or conductive        oxide NPs provide a high surface area and good electron
textiles modified with iridium oxide for pH monitoring [16].         transport kinetics [38], which also make them a good candi-
Preferably, the fabrication process should be as simple as pos-      date for the development of nonenzymatic sensors. Ascorbic
sible in order to allow a cheap and rapid workflow. Some             acid is known to be a reducing agent for nanostructured cop-
recent examples of such rapid fabrication include galvanosta-        per, being used for NP preparation [39], and as aforemen-
tic electrodeposition of hydrogels containing enzymes [17],          tioned, it has a preference for electron donation to the copper
stamping of electrode material with further simple enzyme            center of the ascorbate oxidase enzyme. This property can be
cross-linking [18], or material vacuum filtration through a          exploited for its determination using simpler copper-based
mask [19] followed by layer-by-layer or potentiodynamic de-          nonenzymatic materials, as demonstrated using CuO (copper
position of receptor layers. Similar concepts would be desired       oxide) nanowires synthesized on Cu foils by a thermal oxida-
for ascorbic acid measurement.                                       tion process at 350 °C for 100 min [40], or with 3D graphene/
   Most of the recently reported biosensors for ascorbic acid        CuO nanoflowers fabricated by copper electrodeposition on a
are electrochemical, either enzymatic or nonenzymatic, as it         graphene structure grown by chemical vapor deposition
will be described in the following lines. The first group makes      (CVD) on a nickel foam that was later etched [41].
use of the natural selectivity of enzymes to discriminate be-            The generality of the aforementioned examples makes use
tween analyte and possible interferents, being ascorbate oxi-        of either high fabrication temperatures, complex equipment
dase the one used for the present case [20]. This enzyme             (CVD), long fabrication times, or commercially unavailable
catalyzes the oxidation of ascorbic acid to dehydroascorbic          NPs or nanostructures and nanocomposites that need to be
acid by accepting electrons on its copper center, causing the        synthesized. In most occasions, the mechanical properties
electron movement that can be measured by the transducer, as         for application in flexible sensors were not tested and in some
it was recently shown with an electrochemical tattoo with an         cases they also result in sensors that measure at a high poten-
integrated iontophoresis structure to extract sweat [21]. On the     tial with the resulting increased probability of oxidizing other
other side, nonenzymatic sensors make use of new materials           molecules. Considering the envisioned application of a wear-
to overcome the limitations of biological receptors in terms of      able device for ascorbic acid monitoring in sweat in heat-
cost and stability [22]. A multitude of attempts have pursued        exposed individuals, minimizing the consumed power (and
this approach for ascorbic acid determination, for example           therefore the working potential) is a must together with good
using carbon-supported PdNi nanoparticles (NPs) [23], car-           mechanical properties (flexible nature) and ease of fabrication
bon nanoplatelets derived from ground cherry husks [24], sil-        in terms of cost and time. The function in acidic solutions
ver NPs grafted graphene/polyaniline nanocomposites [25],            should also be demonstrated.
molybdophosphate films [26], graphene oxide/multi-walled                 Here, we report on a new ascorbic acid sensor that com-
carbon nanotubes/gold nanorods combinations [27], ZiNi               bines for the first time the rapid fabrication possibility of the
nanoalloy-modified carbon nanotubes [28], or TiO2/reduced            alginate membrane with the encapsulation of the commercial-
graphene oxide nanocomposites [29]. Some sensors provide             ly available CuO NPs to exploit their ascorbic acid oxidizing
an added value with the possibility of performing the simul-         capabilities. The sensor is fabricated via electrodeposition of
taneous detection of various analytes that typically show            an alginate membrane using a precursor mixed with CuO NPs
Microchim Acta (2020) 187: 520                                                                                     Page 3 of 11 520

on gold electrodes evaporated on a light-weight polyimide               The alginate membrane precursor solution was composed
support [42]. The alginate membrane, which is reported to           by 1 wt% alginic acid sodium salt and 0.5 wt% calcium car-
be biocompatible and permeable to the diffusion of the elec-        bonate. A total of 16 mg mL−1 CuO nanopowder (< 50 nm)
trochemical substrates but impermeable to cells or large par-       was added to the mix as catalyst for the ascorbic acid deter-
ticles, has previously been used to trap enzymes for glucose        mination, unless otherwise stated. Twenty microliters of the
and lactate determination [17, 43] and carbon nanotubes to          mix was drop casted on the electrodes (minimum volume to
measure microbial activity [44]. Here, we trap CuO NPs from         cover reliably the electrodes) and a galvanostatic deposition
a commercially available and low-cost nanopowder to make            was carried out using a PalmSens4 potentiostat–galvanostat at
use of their natural interaction with ascorbic acid previously      a current density of 1.7 A m−2 (larger current densities led to
mentioned. The membrane is formed in few minutes in one             electrode delamination) for 140 s (until observing stability of
step and its size can be controlled by the electrodeposition rate   the measured potential). The same system was used for all
[45]. Moreover, it can be easily removed by using a calcium         next cyclic voltammetries and chronoamperometries with
chelating buffer like phosphate-buffered saline (PBS), offer-       DC current. The anodic current produces a water electrolysis
ing reusability of the electrodes to immobilize a new mem-          generating protons that react with the calcium carbonate,
brane with possibly different catalysts for additional measure-     which tends to buffer the solution by consuming the protons
ments [17]. The use of simple gold electrodes on polyimide          and forming Ca2+ ions and CO2 [45]. The calcium ions inter-
makes it compatible with a variety of techniques like inkjet        act with the alginate polymers by cross-linking them and cre-
printing or photolithography and with the future application as     ating the membrane, where the CuO NPs get trapped (Fig. 1a-
a flexible, wearable device. Finally, the determination of          i). The process resulted in a flexible chip with a membrane on
ascorbic acid is done at the micromolar range as it is found        the working electrode (Fig. 1a-ii). The drop with the precursor
in sweat [3, 46], and in artificial perspiration solution without   mix could be recovered and used for the deposition on further
interference of any of the other present biomolecules.              electrodes. Subsequently, the formed membrane was rinsed in
                                                                    145 mM NaCl and 10 mM imidazole buffer supplemented
                                                                    with 145 mM KCl to mimic physiological conditions and
Materials and methods                                               10 mM CaCl2 to prevent Ca2+ ion loss and therefore mem-
                                                                    brane dissolution. This imidazole buffer, adjusted to pH 7.4,
Materials and reagents                                              was used for the electrical characterization of the sensor as
                                                                    well as for ascorbic acid measurements in buffer and at room
Support for electrode fabrication: Kapton HN500 (125-μm-            temperature.
thick polyimide film from Dupont, USA, www.dupont.com).
Chemicals and reagents: alginic acid sodium salt, calcium           Alginate membrane characterization
carbonate (> 99%), CuO nanopowder (< 50 nm), NaCl (>
99.5%), imidazole (> 99%), KCl (> 99%), and CaCl2 (>                The membrane was characterized by optical microscopy,
98%), NH4Cl (> 99.5%), acetic acid (> 99.7%), lactic acid           scanning electron microscopy (SEM), and cyclic
(sodium L-lactate > 99%), D(+)-glucose monohydrate (>               voltammetry.
99%), uric acid sodium salt, pyruvic acid sodium salt, L-              Larger current densities than 1.7 A m−2 led to electrode
glutamic acid (> 99%), and urea (> 98%),                            delamination, while smaller ones produced weak and unsta-
hexamethyldisilazane (HMDS, > 99%) were purchased from              ble membranes that are easily removed. Shorter electrode-
Sigma-Aldrich—Germany (www.sigmaaldrich.com). Filter                position times (60 s) resulted in soft membranes from which
paper for lateral flow sample delivery: 413-type, VWR,              the CuO NPs were easily washed away (Fig. S1,
Germany, de.vwr.com/store                                           Supplementary Material), while above 140 s the membrane
                                                                    was adsorbed to the electrode in a stable manner during the
Electrode fabrication and modification                              rinsing steps and the NPs covered the whole working elec-
                                                                    trode. The evolution of the potential drift due to the galva-
Gold electrodes were first fabricated on a 125-μm-thick pol-        nostatic deposition process is shown in Fig. S2, where sta-
yimide film (Dupont, USA, www.dupont.com) by a standard             bility starts to be observed after one minute. The resulting
photolithography process [11] followed by 100 nm gold               membrane after 140 s had a thickness of ca. 10 μm as mea-
thermal evaporation on 3 nm chromium adhesion layer. The            sured via digital microscopy (Fig. 1a, iv) with a toluidine
chip (Fig. 1a) consisted of three electrodes, using the smallest    blue O stained membrane to confer a more homogeneous
one (1.2 mm2) as working electrode, so that the kinetics at the     and non-particulated contrast.
counter electrode do not limit those at the working one. The           The membranes were prepared for SEM observation fol-
area of counter and reference electrodes were 3.8 and 4.            lowing a protocol for hydrogel fixation reported elsewhere
1 mm2, respectively.                                                [47] but replacing the used buffer for the imidazole-based
520 Page 4 of 11 Microchim Acta (2020) 187: 520
a CaCO Ca2+
CuO Alginate b No CuO
3
H+
2H2O O2 + 4H+ + 4e- 1 µm
i e- e- e- e- e- Working electrode
60
Height (μm)
1 mm
30 CuO
0
12 3
0 2 4 6 8 1 µm
ii iii iv Profile distance (mm)
1.0
c d 1.0 0.025 V/s
0.05 V/s
0.5 0.075 V/s
0.5 0.1 V/s
I (μA mm-2)
I (μA mm-2)
0.125 V/s
0.0 0.0
Peak current (μA mm-2)
1.2
-0.5 -0.5
0.8
Au
Au/alginate/CuO (1 mg/mL) -1.0 0.4
-1.0 Au/alginate/CuO (16 mg/mL) R2 = 0.99
0.1 0.2 0.3 0.4
-1.5 v1/2
-1.5
-0.6 -0.4 -0.2 0.0 0.2 0.4 0.6 -0.4 -0.2 0.0 0.2 0.4
E (V) vs. Au pseudo-ref. E (V) vs. Au pseudo-ref.
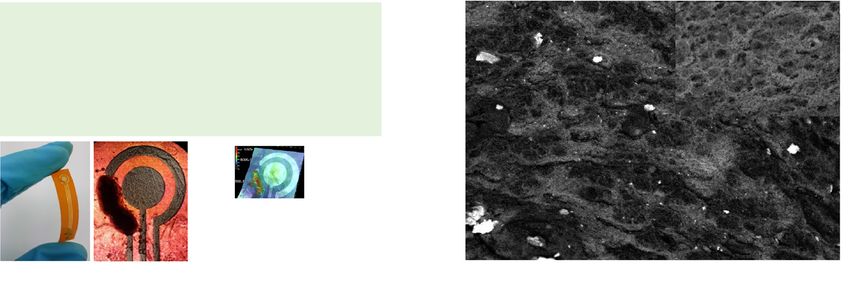
Fig. 1 (a) Alginate electrodeposition with CuO nanopowder. (i) Scheme belonging to the CuO (arrows indicate some examples). Inset shows the
of electrodeposition mechanism. The flexible chip is shown in (ii), with membrane without CuO, where no white spots can be seen. (c) Cyclic
the membrane formed after 140 s electrodeposition time. Yellow numbers voltammogram of bare electrodes (blue line) and modified electrodes (red
indicate electrode function: (1) working, (2) counter, (3) pseudo-refer- and green), showing the appearance of the redox pair belonging to CuO.
ence. Film thickness (10 μm) is shown in (iv), measured along the red (d) Scan rate test and calibration (inset) showing linear relation with
dotted circle in inset. (b) SEM imaging of alginate membrane with CuO square root of the scan rate. All cyclic voltammetries were performed in
NPs. Backscattered electrons provide the contrast, with the white spots imidazole buffer at pH 7.4 and room temperature
one to avoid membrane dissolution. First, hydrogels with and (pH 7.4, room temperature) between each cycle to observe
without CuO NPs were fixed in 2.5% glutaraldehyde in imid- variations in the signal.
azole buffer for 2 h at room temperature. They were then left at
4 °C for 12 h. After washing twice for 5 min in imidazole Ascorbic acid determination
buffer, the samples were dehydrated in solutions of increasing
ethanol concentration (10, 25, 50, 70, 90, and 100%) for 5 min All measurements in buffer were done in the aforementioned
per concentration. Later, the alginate hydrogel was incubated imidazole system as non-chelating buffer, adjusted to pH 7.4
for 20 min in 50% HMDS diluted in ethanol followed by an and at room temperature. First, cyclic voltammetry at
additional incubation in a new solution with same character- 0.1 V s−1 was used to observe the effect on the signal produced
istics. Finally, the double incubation was repeated in two by the effect of ascorbic acid. Then, the optimal working po-
100% HMDS solutions. Membranes were left to dry overnight tential was chosen for amperometric measurements with dif-
in a desiccator and coated with a 20-nm Au layer by thermal ferent ascorbic acid concentrations at constant pH, to calibrate
evaporation. the sensor and determine the concentration range that could be
measured. Next, we proceeded to measure in artificial sweat
samples. For this, an artificial perspiration solution was pre-
Bending test pared based on the work by Kilic et al. [46], which was com-
posed of 20 g L−1 NaCl, 17.5 g L−1 NH4Cl, 5 g L−1 acetic acid,
The flexibility of the sensor owing to the mechanical 15 g L−1 lactic acid, 0.17 mM glucose, 59 uM uric acid,
properties of the thin polyimide foil and the soft nature 0.18 mM pyruvic acid, 0.37 mM glutamic acid, and 10 mM
of the alginate was tested by performing cyclic urea. As sweat is a mildly acidic fluid [48, 49], the pH was
voltammetries before and after controlled bending events. adjusted to pH 5.5 using HCl. Prior to the measurements di-
For this, the chip with the electrodeposited membrane was rectly in this solution, the possible interference by the presence
placed on a cylinder of 5-mm radius and bent 1000 times of the organic molecules in the recipe was analyzed. Finally,
in 10 cycles of 100 bending events each. Cyclic the artificial perspiration solution was spiked with ascorbic
voltammetries were performed in imidazole buffer acid and measured in the same way. Considering theMicrochim Acta (2020) 187: 520 Page 5 of 11 520
difficulties of delivering sweat from skin to a wearable device, noted that 5 mm is far beyond the required radius for skin
we also propose a lateral flow approach as a preliminary de- biomonitoring [51].
sign by placing a rectangular filter paper (413-type, VWR,
Germany, de.vwr.com/store) in perpendicular to the sensor, Ascorbic acid determination in buffer
and directly drop casting 10 μL samples of the artificial
sweat with 100 μM ascorbic acid which were absorbed and Ascorbate produced a pronounced shift of the redox peaks to a
redirected toward the sensing area. positive potential direction (Fig. 3a), indicating a migration of
the CuO through different oxidation states. The linearity with
the square root of the scan rate however was not lost (Fig.
S4b). Taking the position of the cathodic peak as a reference,
Results and discussion
the shift increased linearly with the logarithm of the ascorbic
acid (Fig. 3b) in a range between 1 and 125 μM, obtaining a
Sensor characterization
limit of detection (LOD) of 1.97 ± 1.03 μM (calculated as the
concentration giving a signal 3-fold the standard deviation of
SEM imaging of backscattered electrons showed the contrast
the blank) and a sensitivity (S) of 0.103 ± 0.004 V log(μM)−1
between the membrane material and the trapped CuO (Fig.
(y = (0.32 ± 0.01) + (0103 ± 0.004)x; R2 = 0.99). As seen from
1b). The porous membrane appears dark, with white spots
the averaged results of four independent sensors, all of them
belonging to the CuO nanoparticles and aggregates of hetero-
showed the same measurable range.
geneous sizes. In absence of CuO NPs (inset to Fig. 1b), no
The fact that the current measured at zero volts in
white spots could be found. An energy-dispersive X-ray spec-
the backwards sweep of the cyclic voltammetry belongs
troscopy found the presence of carbon and oxygen atoms
solely to the capacitive current makes it possible to set
through the whole surface as part of the alginate membrane,
this potential in a chronoamperometry and measure the
as well as calcium cross-linking the alginic acid (Fig. S3).
shift of the reducing peak as an increasing current as it
Carbon only lost its presence in the area where the CuO par-
shifts and approaches the working potential. Therefore,
ticles agglomerated. On these agglomerates, both copper and
a chronoamperometry was performed at nearly zero
oxygen were found. The presence of gold atoms could be seen
volts (− 5 mV vs. Au pseudo-ref. electrode), minimizing
beneath the membrane, as part of the electrodes. The presence
the possibility to oxidize other possible interfering bio-
of potassium and silicon atoms can be explained as remaining
molecules in a real sample. It is important to note that
traces from the prior immersions in the imidazole buffer con-
the measurement is also possible at 0 V; however, −
taining KCl during the rinsing steps, and from the immersion
5 mV was chosen for the sake of stability of the elec-
in HMDS in the SEM preparation protocol, respectively.
trical signal. Imidazole buffer containing ascorbic acid
A cyclic voltammetry of the resulting CuO-containing
in a range between 1.8 and 125 μM was measured.
membrane showed the peaks of the redox pair corresponding
Twenty-microliter samples were drop casted on the sen-
to the presence of the CuO NPs (Fig. 1c). The scan rate test
sor and the chronoamperometry was carried out for 60 s
between 25 and 125 mV s−1 showed a linear increase (R2 =
for each concentration, observing an increasing negative
0.99, see Fig. S4a for three independent sensors) of the peak
current together with the increase in analyte concentra-
amplitude with the square root of the scan rate and with no
tion (inset to Fig. 3c). The linear range was observed to
peak shift (Fig. 1d), indicating a reversible and diffusion con-
be up to 30 μM (Fig. 3c, y = (0.001 ± 0.002) + (0.0027 ±
trolled system. A slight negative shift was observed only in the
2.8 × 10⁻⁴)x; R2 = 0.95), allowing to perform measure-
cathodic peak; hence, we cannot discard to a certain degree a
ments in the range where ascorbic acid is found in
kinetically controlled behavior [50].
sweat (10–30 μM) [3, 46]. The LOD in this case was
2.3 ± 0.2 μM (calculated using the 3σ/m criterion where
Bending test σ is the standard deviation of the intercept and m is the
slope of the calibration plot) and the sensitivity 0.0027
The measured cyclic voltammograms (Fig. 2a) did not ± 2.8 × 10⁻⁴ μA μM−1 mm−2.
show any significant horizontal shift of the redox peak A test with three independent sensors using 6 mg mL−1
position, which is the effect that allows measuring ascor- CuO showed, on one hand, that the measurable range was
bic acid in this work. The amplitude of the anodic peak constant and comparable with that obtained using
(Fig. 2b) suffered a slight decrease of 1 μA during the 16 mg mL−1 due to the fact that CuO is always in molar excess
first 300 bending events and remained constant for the (Fig. S5). However, further reduction to 1 mg mL −1
next 700 bends. The amplitude decrease for the cathodic (voltammogram at Fig. 1c, green line) led to non-
peak instead, decreased less than 0.5 μA, showing a high reproducible results with highly variable measurable range.
performance even after such high deformation. It must be We hypothesize that this is caused by the weak redox peaks520 Page 6 of 11 Microchim Acta (2020) 187: 520
Fig. 2 Results of the bending test at 5 mm-radius in imidazole buffer amplitude decrease of less than 1 μA during the first 300 bends, it
(pH 7.4, room temperature). (a) Cyclic voltammograms and (b) redox remained constant for the next 700 events. Inset in (a) shows the principle
peak current density and position before and after each bending cycle. of the test. The orange film represents the chip on polyimide material,
Peak position and current tend to remain around the same values. After an bent onto a 5-mm radius
at low CuO concentration. Therefore, we can conclude that as started. After 50 s, additional 20 μL buffer was drop casted
long as the redox peaks are clearly visible, the CuO concen- with each of the biomolecules, reaching the final concentra-
tration is not very relevant, at least starting from 6 mg mL−1, tion found in the artificial perspiration solution to be used later
concentration that can be chosen as a minimum to measure on, including various acids (lactic, uric, pyruvic, and
ascorbic acid reliably, by saving material compared with glutamic). The results are shown in Fig. 3d. No response
16 mg mL−1. With measurements of real samples in mind, was found for any other than ascorbic acid, being this
we performed an interference test by repeating the the smallest concentrated one (10 μM). Neither did the
chronoamperometry in presence of several biomolecules typ- highly concentrated species at 10 mM (lactic acid, glu-
ically found in sweat: lactic acid, uric acid, pyruvic acid, cose, urea). The response for the ascorbic acid was ob-
glutamic acid, glucose, and urea. Twenty microliters of buffer served instantaneously, showing the fast response of the
was drop casted on the sensor and the measurement was sensor.
Fig. 3 Ascorbic acid a b
determination and analysis of the 0.30
effect of the interferents in 4
0.25
E (V) vs. Au pseudo-ref.
imidazole buffer (pH 7.4, room
temperature). (a) Effect of the 2 0.20
I (μ A mm-2)
ascorbic acid on the cyclic volt-
ammogram. The peaks of the 0 0.15
CuO redox pairs are shifted to-
0.10
ward positive potential. (b) -2
Averaged calibration of the ca- 0 µM 310 µM 0.05
thodic peak potential shift of 4 -4
independent sensors (error bars as 0.00
standard deviation of n = 4 sen-
∇
-6 -0.05
sors). (c) Calibration of the -0.6 -0.4 -0.2 0.0 0.2 0.4 0.6 1 10 100
amperometry at − 5 mV vs. Au E (V) vs. Au pseudo-ref. Ascorbic acid (μ M)
pseudo-ref. electrode in a range c d
between 0 and 125 μM (smallest 0.00
detected concentration = 1.8 μM). 0.10
Inset shows the real-time mea-
-0.05
I (μ A/mm-2)
surements. Further repetitions
I (μ A mm-2)
0.00
Buffer
(n = 3) shown in Fig. S5. (d) 10 mM lactic acid
-0.05 -0.10
I (μ A mm-2)
Interference test showing no re- 0.05 60 μM uric acid
sponse with other than ascorbic -0.10 180 μM pyruvic acid
acid. The arrow indicates the 0 µM -0.15 370 μM glutamic acid
∇
-0.15 10 mM glucose
interferent injection moment 10 mM urea
0.00 -0.20
125 µM
-0.20 10 μ M ascorbic acid
0 10 20 30 40 50 60
Time (s)
-0.25
0 20 40 60 80 100 120 140 0 20 40 60 80 100
Ascorbic acid (μ M) Time (s)Microchim Acta (2020) 187: 520 Page 7 of 11 520
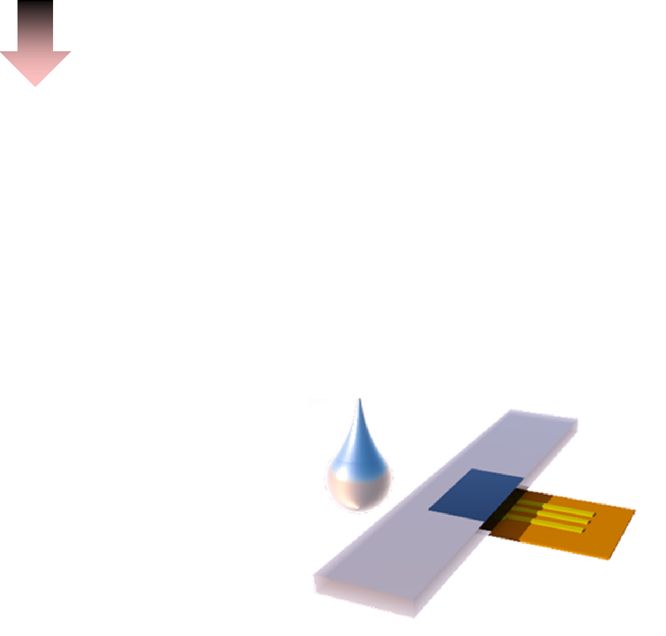
Ascorbic acid determination in artificial samples paper, VWR, Germany, de.vwr.com/store) was directly
placed on top of the sensor and 10 μL samples of artificial
Artificial perspiration solutions were prepared with increasing sweat with 100 μM ascorbic acid was dropped on one side of
ascorbic acid concentrations and the chronoamperometry was the paper (inset to Fig. 4d), which absorbed and redirected it
performed at − 5 mV vs. Au pseudo-ref. electrode. Compared toward the sensor, forming clear signal peaks while no signal
with measurements in imidazole, here the measurable range was observed for the samples without ascorbic acid (Fig. 4d).
was extended to higher concentrations, with saturation after Despite the possibility of measuring in the levels and phys-
ca. 300 μM (Fig. 4a, b), which would allow determining the iological conditions in serum or blood, incubations in fetal
levels found also in blood or a possible excess of ascorbic acid bovine serum led to gradual degradation and disappearing of
loss through sweat. The current levels were also increased, the redox peaks. A previously reported work with CuO
which is likely coming from the highly complex nature of entrapped in alginate together with glucose oxidase for glu-
the solution. The cyclic voltammograms shown in Fig. S6a, cose sensing however showed successful glucose determina-
SM, support this idea, where the redox peaks and the capac- tion without CuO degradation and ascorbic acid interference,
itive current were found to be 4-fold and 2-fold stronger than which denotes that the presence of the enzyme might play a
in imidazole respectively. In spite of that, the levels found in role in NP protection. In our case, a direct interaction between
sweat could also be detected, as seen in the real-time measure- CuO and glucose is discarded in the degradation process, as
ment of 10 μM ascorbic acid (Fig. 4c). By performing the demonstrated in the interference test and the measurements in
complete cyclic voltammetry for each ascorbate concentra- artificial perspiration solution containing solution, and consid-
tion, the quantification should also be possible by measuring ering that such interaction requires alkaline conditions [53].
the peak shift (Fig. S6b, SM). Furthermore, one hour incuba- Other nonenzymatic sensors exist with good response at
tion in sweat did not produce any degradation of the signal the required micromolar concentrations. A comparison with
(Fig. S7, SM), demonstrating good stability. our work is shown in Table 1. Although many reported works
Finally, taking into account the complexity of sweat deliv- show detection at low potential, ours remains as the one clos-
ery on a wearable device, we propose the combination of the est to zero volts, and although it was achieved using Au pseu-
sensor with a lateral flow approach [52], where a hydrophilic do-ref. electrode, it would definitely help to save battery in a
paper allows the gradual passing of a liquid sample. As pre- wearable device. The flexible nature of the sensor was also
liminary test, a rectangular piece of filter paper (413-type filter demonstrated and the fabrication was also the simplest, with
Fig. 4 Measurements in artificial a b
perspiration solution, pH 5.5, 0.0
room temperature. (a) 0.3
Chronoamperometry and (b) cali-
I (μA mm-2)
bration at − 5 mV vs. Au pseudo-
I (μ A mm-2)
-0.1
ref. electrode. Inset shows mag- 0.2 0.02
I (μA mm-2)
nification of the smallest concen-
trations. (c) Real-time measure- -0.2 0.01
ment of 10 μM ascorbic acid 0.1
∇
0 µM
∇
(AA) by direct drop casting. (d) 0.00
-0.3
Real-time measurement of sweat 0 20 40 60 80
with and without ascorbic acid by 0.0 Ascorbic acid (μ M)
sample delivery through filter 625 µM
-0.4
paper 0 20 40 60 0 200 400 600 800 100012001400
c Time (s) d Ascorbic acid (μM)
0.00
0 µM
I (μ A mm-2)
0.00
I (μ A mm-2)
-0.02
10 µM
-0.04
-0.05
-0.06
100 µM
-0.10
-0.08
0 20 40 60 80 100 0 100 200 300 400 500 600
Time (s)
Time (s)Table 1 Comparative table of ascorbic acid sensors. Fabrication simplicity is considered based on the number of processing steps, duration, temperature, and applied voltages or currents (− − = very
difficult; − = difficult; + = easy; ++ = very easy). SCE, saturated calomel electrode
Sensing material Working potential (V) LOD (μM) Sensitivity Linear range (μM) Fabrication simplicity
520 Page 8 of 11
Carbon nanoplatelets derived from 0.026 vs. Ag/AgCl 1.09 0.20863 μA μM−1 cm−2 10–3570 +
ground cherry husks [24]
3-layer sandwich of N-doped 1.2 vs. Ag/AgCl 8 28,900–280,500 μM μA−1 10–11.460 −
graphene, Ag NPs, and
polyaniline [25]
CuO nanowires derived from a 0.1 vs. Ag/AgCl 0.5 0.07857 μA μM−1 cm−2 20–400 −−
self-assembled Cu-Fe nanocube
[40]
CuO nanoflowers on 3D graphene 0.2 vs. (SCE) 0.43 2.06 μA μM1 cm−2 20–200 −−
foam [41]
0.1 vs. Ag/AgCl 0.063 24,460 μA μM−1 0.5–120 −−
Graphene/copper/phthalocyanin-
e/polyaniline nanocomposites
[54]
Redox-active molybdophosphate 0.4 vs. Ag/AgCl 0.04 0.21021 μA μM−1 cm−2 1–1500 −
film [26]
Reduced graphene oxide/Fe3O4 − 0.044 vs. SCE 5 0.01 μA μM−1 15–360 +
nanoparticles/hydroxypropyl-β--
cyclodextrin nanocomposite [37]
Graphene oxide/multi-walled carbon 0.036 vs. Ag/AgCl 0.85 7.61 μA μM−1 cm−2 0.001–0.5 and 1–8000 +
nanotubes/Au nanorods [27]
TmPO4/graphene oxide composite − 0.05 vs. SCE 39 0.0013 μA μM−1 100–1000 −
[34]
Zn-NiAl-layered double hydroxide − 0.1 vs. SCE 0.0135 Not specified 0.5–11 −−
and reduced graphene oxide
superlattices [35]
TiO2/rGO nanocomposite-modified 0.22 vs. Ag/AgCl 1.19 1.061 μA μM−1 cm−2 25–725 −
glassy carbon electrode [29]
Pt NP–modified nanoporous AuSn 0.044 vs. Ag/AgCl 5.51 0.14 μA μM−1 cm−2 200–2000 −−
alloy on Ni-buffered flexible car-
bon fiber paper [31]
Carbon paste electrode modified ≈ 0.3 vs. Ag/AgCl 0.009 0.0495 μA μM−1 0.04–240 −
with CuO-decorated reduced
graphene [30]
ZnNi bimetallic nanoalloy-modified 0.19 vs. Ag/AgCl 0.511 Not specified 300–1100 +
carbon nanotubes [28]
Enzyme-modified metalized (1 wt% − 0.5 vs. Ag/AgCl Not specified. Smallest Not specified 100–1000 (amperometry) +
rhodium) carbon ink [21] detection: 100 100–600
(square wave voltammetry)
CuO NPs in alginate (our work) − 0.005 vs. Au 1.97 (cyclic voltammetry) 0.103 V log (μM)−1 (cyclic voltammetry) log1–150 (cyclic voltammetry) ++
2.3 (amperometry) 0.27 μA μM−1 cm−2 (amperometry) 10–30 (amperometry)
Microchim Acta (2020) 187: 520Microchim Acta (2020) 187: 520 Page 9 of 11 520
other sensors requiring long processing times of several hours in the future. Moreover, integration of other catalysts or en-
(> 24 h) with multiple steps, high temperatures (> 350 °C), or zymes for the determination of additional micronutrients,
high voltage (> 17 V), for nanomaterial synthesis as well as followed by the integration on a wearable electrical device
for electrode modification. In addition, our proposed approach with a miniaturized potentiostat, would enable its implemen-
performs the measurements in both imidazole (neutral pH) tation in sports or heat-exposed working environments of
and artificial perspiration solution (acidic), convenient for di- large duration, protecting the health of the person involved
rect determination in human sweat by consuming low power. by a timely dietary ascorbic acid intake.
Alternatively, measurements by cyclic voltammetry are also
possible by analyzing the shift of the redox peaks, in order to Acknowledgments The authors thank the technical assistance of Dr. Petr
Formanek (Leibniz Institute of Polymer Research Dresden e. V.) and Dr.
choose higher current levels where the noise can be smaller.
Markus Löffler (Dresden Center for Nanoanalysis, Technical University
The main limitations of the proposed system, however, come of Dresden) in the SEM imaging and Dr. Raphael Doineau (Leibniz
from the aggregate formation of CuO and the high concentra- Institute for Solid State and Materials Research) in the membrane thick-
tion that is needed despite lower concentrations could already ness measurement.
be in molar excess. The concentration is not a major disad-
Funding information Open Access funding provided by Projekt DEAL.
vantage considering the low cost of the material, although the
This work was funded by the Arbeitsgemeinschaft industrieller
reproducibility test shows that 6 mg mL−1 is enough and Forschungsvereinigungen (AiF) project F009438.
maintains the same measurable concentration range (unlike
1 mg mL −1 , which leads to unreproducible results). Compliance with ethical standards
However, the standard deviation in the resulting current levels
makes the device more appropriate for semiquantitative anal- Conflict of interest The authors declare that there is no conflict of
ysis, which can still be used to observe increased amounts of interest.
vitamin loss, or absence of it. Regarding the issue of aggregate
Open Access This article is licensed under a Creative Commons
formation, the addition of a surfactant or solvent that provides Attribution 4.0 International License, which permits use, sharing,
a better dispersion of the nanopowder in the alginate precursor adaptation, distribution and reproduction in any medium or format, as
without affecting the membrane formation could lead to a long as you give appropriate credit to the original author(s) and the
better homogeneity of the membrane and the obtained results. source, provide a link to the Creative Commons licence, and indicate if
changes were made. The images or other third party material in this article
are included in the article's Creative Commons licence, unless indicated
otherwise in a credit line to the material. If material is not included in the
Conclusions article's Creative Commons licence and your intended use is not
permitted by statutory regulation or exceeds the permitted use, you will
need to obtain permission directly from the copyright holder. To view a
The hereby demonstrated sensor provides a very simple solu- copy of this licence, visit http://creativecommons.org/licenses/by/4.0/.
tion for ascorbic acid determination in sweat, a very conve-
nient fluid for non-invasive physiological parameter monitor-
ing via skin electronics, by combining for the first time the
oxidizing capability of CuO toward the molecule of interest
with the facile and quick alginate electrodeposition. Important References
features of wearable sensors are part of the proposed device,
including light weight, determination at ultralow potential vs. 1. Ganjali MR et al (2017) Highly sensitive voltammetric sensor for
Au pseudo-ref. electrode, and compatibility with acidic sam- determination of ascorbic acid using graphite screen printed elec-
ples as it is sweat. While both cyclic voltammetry and trode modified with ZnO/Al 2 O 3 nanocomposite. Int J
Electrochem Sci 12:3231
amperometry are possible, the second approach would allow
2. Lee H, Song C, Hong YS, Kim MS, Cho HR, Kang T, Shin K, Choi
an easier circuit integration on a wearable device. In addition, SH, Hyeon T, Kim DH (2017) Wearable/disposable sweat-based
the fabrication is done following very few steps and in short glucose monitoring device with multistage transdermal drug deliv-
time, and commercially available low-cost products are used, ery module. Sci Adv 3:e1601314
which helps to reduce the costs of each final unit. Despite the 3. Tang Y-M et al (2016) Relationships between micronutrient losses
in sweat and blood pressure among heat-exposed steelworkers. Ind
relatively high concentration of nanoparticles used and the Health 54:215–223
formation of nanoparticle aggregates on the sensing area 4. Nováková L, Solich P, Solichová D (2008) HPLC methods for
which could affect reproducibility to some extent, making simultaneous determination of ascorbic and dehydroascorbic acids.
the system qualitative, future research on the improvement TrAC Trends Anal Chem 27:942–958
of their dispersion in the precursor solution is a realistic option 5. Chang YL, Rossetti M, Vlamakis H, Casero D, Sunga G, Harre N,
Miller S, Humphries R, Stappenbeck T, Simpson KW, Sartor RB,
in order to improve the issue, as aforementioned. Together Wu G, Lewis J, Bushman F, McGovern DPB, Salzman N,
with the transfer of the technology to electrodes fabricated Borneman J, Xavier R, Huttenhower C, Braun J (2019) A screen
by screen or inkjet printing, the overall cost could be reduced of Crohn’s disease-associated microbial metabolites identifies520 Page 10 of 11 Microchim Acta (2020) 187: 520
ascorbate as a novel metabolic inhibitor of activated human T cells. 23. Zhang X, Cao Y, Yu S, Yang F, Xi P (2013) An electrochemical
Mucosal Immunol 12:457–467 biosensor for ascorbic acid based on carbon-supported PdNi nano-
6. Tortajada-Genaro LA (2012) Determination of l-ascorbic acid in particles. Biosens Bioelectron 44:183–190
tomato by capillary electrophoresis. J Chem Educ 89:1194–1197 24. Li X, Wang Y, Liu J, Sun M, Bo X, Wang HL, Zhou M (2017)
7. Kamiŝalić A, Fister I, Turkanović M, Karakatiĉ S (2018) Sensors Amperometric ascorbic acid biosensor based on carbon
and functionalities of non-invasive wrist-wearable devices: a re- nanoplatelets derived from ground cherry husks. Electrochem
view. Sensors (Switzerland) 18:1714 Commun 82:139–144
8. Ibarlucea B, Munoz-Berbel X, Ortiz P, Büttgenbach S, Fernández- 25. Salahandish R, Ghaffarinejad A, Naghib SM, Niyazi A,
Sánchez C, Llobera A (2016) Self-validating lab-on-a-chip for Majidzadeh-A K, Janmaleki M, Sanati-Nezhad A (2019)
monitoring enzyme-catalyzed biological reactions. Sensors Sandwich-structured nanoparticles-grafted functionalized
Actuators B Chem 237:16–23 graphene based 3D nanocomposites for high-performance biosen-
9. Baraban L, Ibarlucea B, Baek E, Cuniberti G (2019) Hybrid silicon sors to detect ascorbic acid biomolecule. Sci Rep 9:1226
nanowire devices and their functional diversity. Adv Sci 6(15):1- 26. Liu S, Jiang X, Yang M (2019) Electrochemical sensing of L-
31. https://doi.org/10.1002/advs.201900522 ascorbic acid by using a glassy carbon electrode modified with a
10. Karnaushenko D, Ibarlucea B, Lee S, Lin G, Baraban L, Pregl S, molybdophosphate film. Microchim Acta 186:445
Melzer M, Makarov D, Weber WM, Mikolajick T, Schmidt OG, 27. Zhao Y, Qin J, Xu H, Gao S, Jiang T, Zhang S, Jin J (2019) Gold
Cuniberti G (2015) Light weight and flexible high-performance nanorods decorated with graphene oxide and multi-walled carbon
diagnostic platform. Adv Healthc Mater 4:1517–1525 nanotubes for trace level voltammetric determination of ascorbic
11. Zhang P et al (2019) Electrochemically exfoliated high-quality 2H- acid. Microchim Acta 186:17
MoS2 for multiflake thin film flexible biosensors. Small 15: 28. Savk A, Özdil B, Demirkan B, Nas MS, Calimli MH, Alma MH,
1901265 Inamuddin, Asiri AM, Şen F (2019) Multiwalled carbon nanotube-
12. Miyamoto A, Lee S, Cooray NF, Lee S, Mori M, Matsuhisa N, Jin based nanosensor for ultrasensitive detection of uric acid, dopa-
H, Yoda L, Yokota T, Itoh A, Sekino M, Kawasaki H, Ebihara T, mine, and ascorbic acid. Mater Sci Eng C 99:248–254
Amagai M, Someya T (2017) Inflammation-free, gas-permeable, 29. Harraz FA, Faisal M, Ismail AA, al-Sayari SA, al-Salami AE, al-
lightweight, stretchable on-skin electronics with nanomeshes. Nat Hajry A, al-Assiri MS (2019) TiO2/reduced graphene oxide nano-
Nanotechnol 12:907–913 composite as efficient ascorbic acid amperometric sensor. J
13. Gao W, Emaminejad S, Nyein HYY, Challa S, Chen K, Peck A, Electroanal Chem 832:225–232
Fahad HM, Ota H, Shiraki H, Kiriya D, Lien DH, Brooks GA, 30. Karimi-Maleh H, Arotiba OA (2020) Simultaneous determination
Davis RW, Javey A (2016) Fully integrated wearable sensor arrays of cholesterol, ascorbic acid and uric acid as three essential biolog-
for multiplexed in situ perspiration analysis. Nature 529:509–514 ical compounds at a carbon paste electrode modified with copper
14. Koh A et al (2016) A soft, wearable microfluidic device for the oxide decorated reduced graphene oxide nanocomposite and ionic
capture, storage, and colorimetric sensing of sweat. Sci Transl liquid. J Colloid Interface Sci 560:208–212
Med. 8:366ra165 31. Yang H et al (2019) Hierarchical bi-continuous Pt decorated
15. Jia W, Bandodkar AJ, Valdés-Ramírez G, Windmiller JR, Yang Z, nanoporous Au-Sn alloy on carbon fiber paper for ascorbic acid,
Ramírez J, Chan G, Wang J (2013) Electrochemical tattoo biosen- dopamine and uric acid simultaneous sensing. Biosens Bioelectron
sors for real-time noninvasive lactate monitoring in human perspi- 124–125:191–198
ration. Anal Chem 85:6553–6560 32. Wang M, Cui M, Liu W, Liu X (2019) Highly dispersed conductive
16. Zamora ML, Dominguez JM, Trujillo RM, Goy CB, Sánchez MA, polypyrrole hydrogels as sensitive sensor for simultaneous determi-
Madrid RE (2018) Potentiometric textile-based pH sensor. Sensors nation of ascorbic acid, dopamine and uric acid. J Electroanal Chem
Actuators B Chem 260:601–608 832:174–181
17. Márquez A, Jiménez-Jorquera C, Domínguez C, Muñoz-Berbel X 33. Krishnan S, Tong L, Liu S, Xing R (2020) A mesoporous silver-
(2017) Electrodepositable alginate membranes for enzymatic sen- doped TiO2-SnO2 nanocomposite on g-C3N4 nanosheets and dec-
sors: an amperometric glucose biosensor for whole blood analysis. orated with a hierarchical core–shell metal-organic framework for
Biosens Bioelectron 97:136–142 simultaneous voltammetric determination of ascorbic acid, dopa-
18. Stromberg LR, Hondred JA, Sanborn D, Mendivelso-Perez D, mine and uric acid. Microchim Acta 187:82
Ramesh S, Rivero IV, Kogot J, Smith E, Gomes C, Claussen JC 34. Huang H, Yue Y, Chen Z, Chen Y, Wu S, Liao J, Liu S, Wen HR
(2019) Stamped multilayer graphene laminates for disposable in- (2019) Electrochemical sensor based on a nanocomposite prepared
field electrodes: application to electrochemical sensing of hydrogen from TmPO 4 and graphene oxide for simultaneous voltammetric
peroxide and glucose. Microchim Acta 186:533 detection of ascorbic acid, dopamine and uric acid. Microchim Acta
19. Oh SY, Hong SY, Jeong YR, Yun J, Park H, Jin SW, Lee G, Oh JH, 186:189
Lee H, Lee SS, Ha JS (2018) Skin-attachable, stretchable electro- 35. Asif M, Aziz A, Wang H, Wang Z, Wang W, Ajmal M, Xiao F,
chemical sweat sensor for glucose and pH detection. ACS Appl Chen X, Liu H (2019) Superlattice stacking by hybridizing layered
Mater Interfaces 10:13729–13740 double hydroxide nanosheets with layers of reduced graphene oxide
20. Csiffáry G, Futo P, Adányi N, Kiss A (2016) Ascorbate oxidase- for electrochemical simultaneous determination of dopamine, uric
based amperometric biosensor for L-ascorbic acid determination in acid and ascorbic acid. Microchim Acta 186:61
beverages. Food Technol Biotechnol 54:31–35 36. Zhao Y, Zhou J, Jia Z, Huo D, Liu Q, Zhong D, Hu Y, Yang M,
21. Sempionatto JR, Khorshed AA, Ahmed A, de Loyola e Silva AN, Bian M, Hou C (2019) In-situ growth of gold nanoparticles on a
Barfidokht A, Yin L, Goud KY, Mohamed MA, Bailey E, May J, 3D-network consisting of a MoS2/rGO nanocomposite for simul-
Aebischer C, Chatelle C, Wang J (2020) Epidermal enzymatic bio- taneous voltammetric determination of ascorbic acid, dopamine and
sensors for sweat vitamin C: toward personalized nutrition. ACS uric acid. Microchim Acta 186:92
Sensors 5:1804–1813 37. Liang W, Rong Y, Fan L, Zhang C, Dong W, Li J, Niu J, Yang C,
22. Gnana Kumar G, Amala G, Gowtham SM (2017) Recent advance- Shuang S, Dong C, Wong WY (2019) Simultaneous electrochem-
ments, key challenges and solutions in non-enzymatic electrochem- ical sensing of serotonin, dopamine and ascorbic acid by using a
ical glucose sensors based on graphene platforms. RSC Adv 7: nanocomposite prepared from reduced graphene oxide, Fe3O4 and
36949–36976 hydroxypropyl-β-cyclodextrin. Microchim Acta 186:751Microchim Acta (2020) 187: 520 Page 11 of 11 520
38. George JM, Antony A, Mathew B (2018) Metal oxide nanoparticles 47. Muri H, Hoang L, Hjelme D (2018) Mapping nanoparticles in
in electrochemical sensing and biosensing: a review. Microchim hydrogels: a comparison of preparation methods for electron mi-
Acta 185:358 croscopy. Appl Sci 8:2446
39. Cheng X, Zhang X, Yin H, Wang A, Xu Y (2006) Modifier effects 48. Curto VF et al (2012) Real-time sweat pH monitoring based on a
on chemical reduction synthesis of nanostructured copper. Appl wearable chemical barcode micro-fluidic platform incorporating
Surf Sci 253:2727–2732 ionic liquids. Sensors Actuators B Chem 171–172:1327–1334
40. You Q, Liu T, Pang J, Jiang D, Chu Z, Jin W (2019) In situ fabri- 49. Coyle, S. et al. (2009) Textile sensors to measure sweat pH and
cation of CuO nanowire film for high-sensitive ascorbic acid rec- sweat-rate during exercise. in Proceedings of the 3d International
ognition. Sensors Actuators B Chem 296(126617):126617 ICST Conference on Pervasive Computing Technologies for
41. Ma Y, Zhao M, Cai B, Wang W, Ye Z, Huang J (2014) 3D Healthcare. https://doi.org/10.4108/ICST.
graphene foams decorated by CuO nanoflowers for ultrasensitive PERVASIVEHEALTH2009.5957
ascorbic acid detection. Biosens Bioelectron 59:384–388 50. Wilde CP, Hu A, Rondeau CM, Wood M (1993) Cyclic voltamm-
42. Ibarlucea B, Roig AP, Belyaev D, Baraban L, Cuniberti G (2019) etry and charge accumulation at conducting organic salt enzyme
Single-step modified electrodes for vitamin C monitoring in sweat. electrodes. J Electroanal Chem 353:19–31
ChemRxiv. https://doi.org/10.26434/CHEMRXIV.11357726.V1 51. Schwartz G, Tee BCK, Mei J, Appleton AL, Kim DH, Wang H,
43. Márquez A, Aymerich J, Dei M, Rodríguez-Rodríguez R, Vázquez- Bao Z (2013) Flexible polymer transistors with high pressure sen-
Carrera M, Pizarro-Delgado J, Giménez-Gómez P, Merlos Á, Terés sitivity for application in electronic skin and health monitoring. Nat
L, Serra-Graells F, Jiménez-Jorquera C, Domínguez C, Muñoz- Commun 4:1859
Berbel X (2019) Reconfigurable multiplexed point of care system
52. Koczula KM, Gallotta A (2016) Lateral flow assays. Essays
for monitoring type 1 diabetes patients. Biosens Bioelectron 136:
Biochem 60:111–120
38–46
44. Mottet L, le Cornec D, Noël JM, Kanoufi F, Delord B, Poulin P, 53. Romeo A, Moya A, Leung TS, Gabriel G, Villa R, Sánchez S
Bibette J, Bremond N (2018) A conductive hydrogel based on (2018) Inkjet printed flexible non-enzymatic glucose sensor for tear
alginate and carbon nanotubes for probing microbial electroactivity. fluid analysis. Appl Mater Today 10:133–141
Soft Matter 14:1434–1441 54. Pakapongpan S, Mensing JP, Phokharatkul D, Lomas T,
45. Cheng Y, Luo X, Betz J, Payne GF, Bentley WE, Rubloff GW Tuantranont A (2014) Highly selective electrochemical sensor for
(2011) Mechanism of anodic electrodeposition of calcium alginate. ascorbic acid based on a novel hybrid graphene-copper phthalocy-
Soft Matter 7:5677–5684 anine-polyaniline nanocomposites. Electrochim Acta 133:294–301
46. Kilic T, Brunner V, Audoly L, Carrara S (2017) Smart e-Patch for
drugs monitoring in schizophrenia. 2016 IEEE Int Conf Electron Publisher’s note Springer Nature remains neutral with regard to jurisdic-
Circ Syst ICECS 2016:57–60. https://doi.org/10.1109/ICECS. tional claims in published maps and institutional affiliations.
2016.7841131You can also read