Enhanced metabolism and negative regulation of ER stress support higher erythropoietin production in HEK293 cells
←
→
Page content transcription
If your browser does not render page correctly, please read the page content below
Report
Enhanced metabolism and negative regulation of ER
stress support higher erythropoietin production in
HEK293 cells
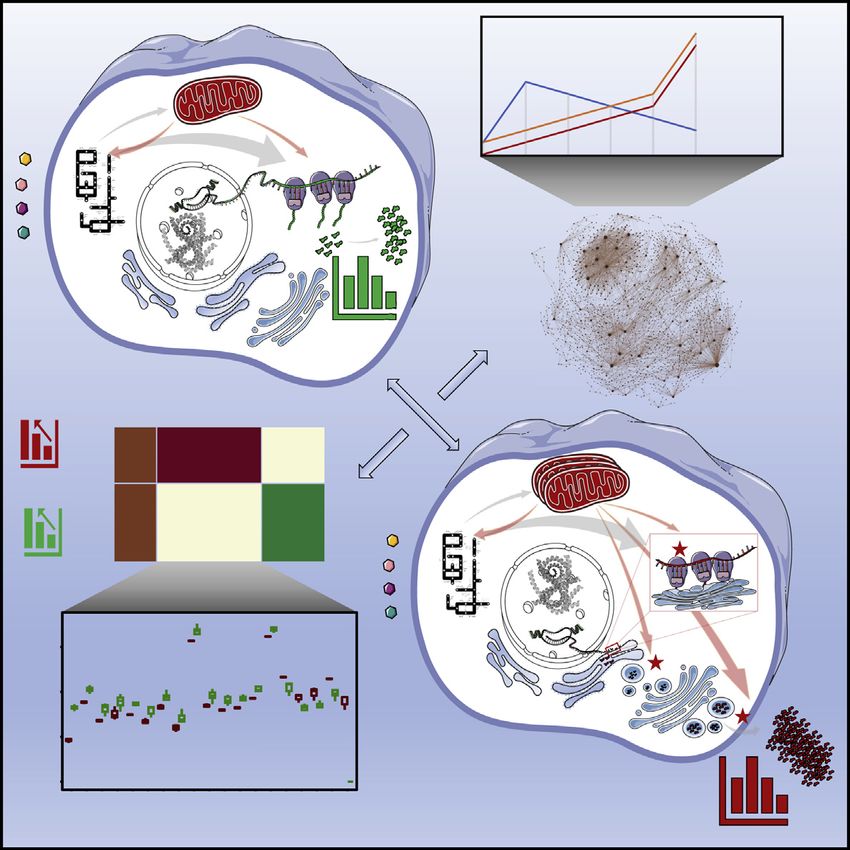
Graphical abstract Authors
Rasool Saghaleyni, Magdalena Malm,
Noah Moruzzi, ..., Jens Nielsen,
Jonathan L. Robinson, Johan Rockberg
Correspondence
jonrob@chalmers.se (J.L.R.),
johan.rockberg@biotech.kth.se (J.R.)
In brief
Finding bottlenecks in protein secretion is
necessary for improvements in
recombinant protein production. By
investigating the transcriptomic profiles
of different HEK293 clones, expressing
either erythropoietin (EPO) or GFP,
Saghaleyni et al. show that higher
metabolic rates and negative regulation
of ER stress are associated with
increased EPO production.
Highlights
d Transcriptomics analysis of HEK293 cells expressing GFP or
EPO at varying rates
d Ribosomal genes show recombinant protein-specific
patterns of expression
d Higher metabolic rates are observed in EPO-expressing cells
compared with controls
d ATF6B facilitates higher EPO production through a
moderated ER stress response
Saghaleyni et al., 2022, Cell Reports 39, 110936
June 14, 2022 ª 2022 The Authors.
https://doi.org/10.1016/j.celrep.2022.110936 ll
ll
                                                                                                                        OPEN ACCESS

Report
Enhanced metabolism and negative
regulation of ER stress support higher
erythropoietin production in HEK293 cells
Rasool Saghaleyni,1,9 Magdalena Malm,2,9 Noah Moruzzi,3 Jan Zrimec,1 Ronia Razavi,2 Num Wistbacka,2
Hannes Thorell,2 Anton Pintar,2 Andreas Hober,4 Fredrik Edfors,4 Veronique Chotteau,5 Per-Olof Berggren,3 Luigi Grassi,6
Aleksej Zelezniak,1 Thomas Svensson,1,7 Diane Hatton,6 Jens Nielsen,1,8 Jonathan L. Robinson,1,7,*
and Johan Rockberg2,10,*
1Department    of Biology and Biological Engineering, Chalmers University of Technology, 412 96 Gothenburg, Sweden
2KTH  - Royal Institute of Technology, School of Engineering Sciences in Chemistry, Biotechnology, and Health, Department of Protein
Science, 106 91 Stockholm, Sweden
3The Rolf Luft Research Center for Diabetes and Endocrinology, Department of Molecular Medicine and Surgery, Karolinska Institute, 17176

Stockholm, Sweden
4Science for Life Laboratory, KTH - Royal Institute of Technology, 171 65 Solna, Sweden
5KTH - Royal Institute of Technology, School of Engineering Sciences in Chemistry, Biotechnology, and Health, Department of Industrial

Biotechnology, 106 91 Stockholm, Sweden
6Cell Culture & Fermentation Sciences, BioPharmaceutical Development, BioPharmaceuticals R&D, AstraZeneca, Cambridge, UK
7Department of Biology and Biological Engineering, National Bioinformatics Infrastructure Sweden, Science for Life Laboratory, Chalmers

University of Technology, Kemivägen 10, 41258 Gothenburg, Sweden
8Novo Nordisk Foundation Center for Biosustainability, Technical University of Denmark, 2800 Kongens Lyngby, Denmark
9These authors contributed equally
10Lead contact

*Correspondence: jonrob@chalmers.se (J.L.R.), johan.rockberg@biotech.kth.se (J.R.)
 https://doi.org/10.1016/j.celrep.2022.110936

SUMMARY

Recombinant protein production can cause severe stress on cellular metabolism, resulting in limited titer and
product quality. To investigate cellular and metabolic characteristics associated with these limitations, we
compare HEK293 clones producing either erythropoietin (EPO) (secretory) or GFP (non-secretory) protein
at different rates. Transcriptomic and functional analyses indicate significantly higher metabolism and oxida-
tive phosphorylation in EPO producers compared with parental and GFP cells. In addition, ribosomal genes
exhibit specific expression patterns depending on the recombinant protein and the production rate. In a
clone displaying a dramatically increased EPO secretion, we detect higher gene expression related to nega-
tive regulation of endoplasmic reticulum (ER) stress, including upregulation of ATF6B, which aids EPO pro-
duction in a subset of clones by overexpression or small interfering RNA (siRNA) knockdown. Our results offer
potential target pathways and genes for further development of the secretory power in mammalian cell
factories.

INTRODUCTION                                                          incompatibility with some types of proteins negatively affects
                                                                      drug efficacy, potency, or stability (Kuriakose et al. 2016; Goh
The demand for greater efficiency and quality of protein produc-      and Ng 2017). Therefore, besides further development of the
tion in biotechnology is rapidly increasing due to substantial ad-    CHO cell line to meet the high-quality PTM requirements and
vances in drug discovery (Tambuyzer et al., 2020) and the need        increased yields (Datta et al. 2013; Koffas et al., 2018; Liang
for highly effective pharmaceutical proteins for the treatment of     et al., 2020; Tejwani et al., 2018; Fouladiha et al., 2020; Wang
severe diseases, such as cancer (Kintzing et al., 2016). Chinese      et al., 2020), a lot of focus on improving hosts for biopharmaceu-
hamster ovary (CHO) cells are the current standard host for the       tical production is on cell factories derived from human cells with
production of a wide range of recombinant proteins partly due         the natural ability of generating human PTMs, such as the human
to the ability to generate similar post-translational modifications   embryonic kidney 293 (HEK293) cells (Almo and Love 2014;
(PTMs) to those in humans, which is often a requirement for com-      Malm et al., 2020; Tegel et al., 2020).
plex therapeutic proteins (Orellana et al., 2015; Meleady 2017;          Although human-derived cell lines benefit from the ability to
Davy et al. 2017). However, the PTM pattern from CHO cells            generate human PTMs, challenges still remain, such as
is not identical to human PTMs (Dumont et al., 2016) and the          increasing the protein production titer (Chin et al., 2019; Dietmair

                                                                          Cell Reports 39, 110936, June 14, 2022 ª 2022 The Authors. 1
                                    This is an open access article under the CC BY license (http://creativecommons.org/licenses/by/4.0/).
ll
OPEN ACCESS Report
et al., 2012; Mori et al., 2020) and creating a genetic engineering ducing either EPO or GFP (EPOpoly and GFPpoly, respectively)
toolbox with specialized tools for human cells (Xu and Qi 2019). were generated by random integration of plasmid DNA into the
Recent publications have pursued some of these challenges, host genome resulting in collections of clones with various
including the aim to increase the protein production and secre- transgene integration sites and copy numbers. From these
tion power either by cell-line development approaches (Chin pools, five EPO-producing and seven GFP-producing clones
et al., 2019; Rahimpour et al., 2013) or cell culture process opti- were isolated. We observed that the growth rates of the EPO
mization (Schwarz et al., 2019), as well as to increase the quality and GFP producers were lower than those of their respective
of the secreted proteins by engineering folding and PTM path- host cell lines, but the decrease was no more than 22% and
ways (Meuris et al., 2014; Del Val et al., 2016; Liang et al., 14% compared with the hosts (Figure 1B). Recombinant pro-
2020; Behrouz et al., 2020). However, despite the current knowl- tein productivity was, however, markedly different among
edge of protein production and secretion in eukaryotic cells, clones and varied by almost 6-fold for the EPO producers
there is still notable ambiguity in understanding and predicting and up to 4-fold for the GFP producers (Figures 1C and 1D).
the production and secretion rates as well as product quality un- The most productive EPO clone (EPOF21) had a cell-specific
der different conditions (Kafri et al., 2016; Liu et al. 2016). This is productivity of 13.9 pg/cell/day, which was over 3-fold higher
due to the complexity and presence of many specific biochem- than the second highest producing clone EPO8 (4.05 pg/cell/
ical steps across multiple cell organelles that orchestrate, as well day), and, interestingly, its EPO mRNA abundance was up to
as define, the rates of production and secretion of each protein 20% lower than for EPO8 (Figures 1E and S1A). Except for
(Kaufman and Popolo 2018; Kafri et al., 2016). Accordingly, the this extraordinary production clone, we could measure signifi-
limited understanding of the biology behind the protein produc- cant correlation (Pearson’s r = 0.99, p = 0.001) between EPO
tion process, combined with the continuously increasing de- mRNA amount and the secreted EPO productivity for all clones
mands on production quantity from industry and product quality (Figures 1E and S1B). There was a similarly high correlation
from regulatory bodies, result in a high risk of production failure observed between mRNA copy number and GFP productivity
for many therapeutic proteins. (Pearson’s r = 0.88, p = 0.004; Figure S1C) for the GFP pro-
In the present study, we conducted a transcriptomic compar- ducer clones. For both EPO and GFP clones, no significant cor-
ative analysis to capture physiological differences caused by relation was found between protein productivity and gene copy
protein production and secretion in HEK293F cells. In order to number or clone growth rate (Figures S1A–S1C).
understand which differences are caused by protein production We analyzed and compared transcriptomic data (Illumina
and which arise from the secretion-related processes, we gener- HiSeq) to find how the protein producer cell lines differ from their
ated two groups of cells producing either the erythropoietin respective parental host cell lines (Table S1). Principal compo-
(EPO) or the non-secretory protein GFP and compared each of nent analysis (PCA) clustered clones in the first component
these groups with each other and with their parental cell lines. based on their respective recombinant protein (EPO or GFP
EPO is naturally produced via the conventional secretory Figures 1F and S1D). We performed pairwise differential expres-
pathway mainly in kidney cells in response to hypoxia and stim- sion analysis between each recombinant protein producer clone
ulates red blood cell production in the bone marrow (Scholz and its respective host (Figures S1E–S1G; Table S1). Results of
et al., 1990). Recombinant human EPO (rhEPO) is an important this analysis (Figures S1E and S1F) showed, while in the EPO
treatment for chronic kidney disease and anemia (Santoro and producers EPOI2 had the highest number of differentially ex-
Canova 2005). Moreover, EPO serves as a model recombinant pressed (B.H. adj. p < 0.05, |L2FC| > 1) genes (1,137 genes up-
protein with complex glycostructures and PTMs (Salgado regulated and 82 genes downregulated), in the GFP producers
et al., 2015). In our study, we identified genes whose expression the GFP26 clone was the most different compared with control
correlated with recombinant EPO or GFP production and then cell line (487 genes downregulated, 466 genes upregulated).
explored the biological functions associated with these genes. We also found 45 and 10 common differentially expressed genes
Furthermore, we detected ribosomal genes with specific pat- in EPO and GFP producers with their control cell line, respec-
terns of expression correlating with EPO and GFP production. tively (Figure S1G).
Since the generation of single clones resulted in one clone with Pathway enrichment analysis using the Ingenuity Pathway
greatly increased EPO production titer—a 3-fold increase Analysis (IPA) (Krämer et al., 2014) database (Figure 1G) showed
compared with the other clones—we set out to identify the rea- that genes associated with axonal guidance signaling and oxida-
sons behind these improved protein titers, highlighting genes tive phosphorylation exhibited consistent upregulation by most
that can potentially facilitate increased protein production and of the recombinant protein producer clones. Apart from these
secretion in future studies. two pathways, eIF2 signaling and mTOR signaling pathways
were significantly (B.H. adj. p < 0.05) altered across all EPO pro-
RESULTS ducers (Figure 1G). We observed different functional enrichment
patterns between EPO and GFP clones and also clones in each
EPO and GFP producer clones have an altered group of EPO and GFP versus their parental cell line. However,
metabolism compared with the host cell line axonal guidance signaling and oxidative phosphorylation ex-
To investigate recombinant protein production in HEK293 cells, hibited a more similar pattern of change in comparison of pro-
we transfected 293-F cell lines to generate stable clones ducer clones with their corresponding parental cell (Figure 1G).
producing either a secretory protein (EPO) or a non-secretory Mitochondrial dysfunction, regulation of eIF4, p7056K signaling,
protein (GFP) (Figure 1A). Initially, polyclonal pools of cells pro- and sirtuin signaling pathways were significantly (B.H. adj.
2 Cell Reports 39, 110936, June 14, 2022ll
Report OPEN ACCESS
A B C D E
F G
Figure 1. Isolated EPO and GFP single clones showed differences in productivity and altered gene expression related to oxidative phos-
phorylation and axonal guidance signaling
(A) Schematic diagram of the cell line development resulting in random integration and copy number of the EPO and GFP genes across the cell genomes.
(B) Boxplot of growth rates of EPO and GFP producer clones.
(C) Boxplot of specific productivity of EPO in different HEK293 clones.
(D) Scatter plot of relative productivity of GFP in the different clones in comparison to the polyclonal batch of the GFP clones (GFPpoly).
(E) Specific EPO productivity versus its mRNA expression in duplicate or triplicate in different clones.
(F) Principal component 1 in PCA analysis RNA sequencing (RNA-seq) data generated in duplicate and triplicate separates producer clones based on their
recombinant EPO or GFP.
(G) Most significantly (B.H. adj. p < 0.05) enriched pathways in pairwise comparison of EPO or GFP producers against the control hosts.
p < 0.05) altered in more than three out of five EPO producers. On of recombinant protein production. For this purpose, we first ex-
the other hand, gene enrichment analysis of GFP producers tracted genes with an average transcript per million (TPM) above
against their parental 293-F cell line did not reveal any common 10 across all cell lines in each group of EPO and GFP clones and
pathways enriched across all the cell lines. However, synapto- then considered positively and negatively correlated (|Spearman
genesis signaling and GP6 signaling pathways indicated a signif- r| > 0.5, p < 0.05) genes. Altogether, we found 67 and 126 genes
icant change (B.H. adj. p < 0.05) in at least four out of seven of the with positive and negative correlation with EPO production and
GFP producers (Figure 1G). IPA indicated some of the signifi- 18 and 130 genes revealed positive and negative correlation
cantly upregulated (B.H. adj. p < 0.05) genes related to transla- with GFP production (Figure 2A; Table S2). To find the major reg-
tional and post-translational pathways were enriched in eIF2 ulators among the genes highly correlated (mean TPM > 10, |
and mTOR signaling pathways in EPO producers compared Spearman r| > 0.5, p < 0.05) with either EPO or GFP productivity,
with the control cell line (Figures 1G and S2). An increase in the we generated interaction networks between the genes and their
expression of genes associated with translation was predicted first-order interacting partners based on experimental evidence
to activate downstream processes, including protein folding, (confidence score >900) extracted from the STRING database
ER stress, and apoptosis, as well as upstream processes, (Szklarczyk et al., 2019) (Figures 2A and Table S2). We excluded
such as amino acid biosynthesis (Figure S2). those interacting genes that are not expressed in our dataset or
have very low expression (mean TPM < 10) and then ranked the
Expression of ribosomal genes differs between EPO and genes based on their node degree (k), which measures the inter-
GFP producers activity of each gene based on the number of observed interact-
We sought to find genes that significantly correlated with EPO ing gene partners. The k of the top 10 most interactive genes
and GFP production and investigate their roles in the process (Figure 2A: network hubs) ranged from 61 to 226 and 94 to 251
Cell Reports 39, 110936, June 14, 2022 3ll
OPEN ACCESS Report
A
B
Figure 2. Translational and post-translational genes are strongly correlated with EPO production
(A) Most significantly (mean TPM >10, |Spearman’s r| > 0.5, p < 0.05) correlated genes with EPO or GFP production. Red and blue circles show positive and
negative correlated genes, respectively.
(B) Gene set enrichment analysis of positively correlated genes with EPO production highlights biological GO terms that mostly associated with ribosome
biogenesis, rRNA processing, and cytoskeleton reorganization, while negatively correlated genes with EPO production are mostly associated with ubiquitin
biosynthesis.
4 Cell Reports 39, 110936, June 14, 2022ll
Report OPEN ACCESS
in the networks of EPO- and GFP-correlating genes, respectively r = 0.95) both are subunits of oligosaccharyltransferase (OST)
(Table S2). complex that catalyzes the initial transfer of a defined glycan
Among the top 10 interacting genes in the network of EPO- from dolichol-pyrophosphate to the nascent polypeptide chains
correlating genes, three of them were directly involved in trans- (Roboti and High 2012; Dumax-Vorzet et al. 2013). MGAT4A
lation. RPL32 (r = 0.88, k = 94) and RPL35A (r = 0.88, k = 77), (p = 0.03, Pearson’s r = 0.84) also regulates the formation of multi
both components of cytosolic ribosomal subunits, were posi- antennary branching structures in the Golgi apparatus (López-
tively correlated with EPO production (Colombo et al. 1996; Orduña et al. 2007). MPDU1 (p = 0.01, Pearson’s r = 0.89),
Anger et al., 2013) (r = 0.88, k = 73). Also, SNU13, a highly ALG12 (p = 0.007, Pearson’s r = 0.92), and ALG3 (p = 0.009,
conserved nuclear protein involved in pre-mRNA splicing, Pearson’s r = 0.91) are involved in mannose transfer in the pro-
showed a positive correlation with EPO production (Bertram cess of protein glycosylation (Kranz et al., 2001). However,
et al., 2017). To investigate enriched pathways by significantly UBE2J1 (p = 0.01, Pearson’s r = 0.88) is involved in modification
correlated genes, we used biological Gene Ontology (GO) terms of proteins with ubiquitin and targeting abnormal proteins for
and performed gene enrichment analysis using detected degradation (Elangovan et al., 2017). Positive correlation of all
genes with a significant correlation with EPO production (Fig- these genes with EPO production may highlight some changes
ure 2B, HyperGSA, p < 0.05). Pathways associated with ribo- that happen in PTM processes coordinated with higher EPO
some biogenesis (p = 0.00004076) and RNA processing production.
(0.0001966 < p < 0.0005302) exhibited significant enrichment Although the individual correlated genes detected by the
by positively EPO-correlated genes. Likewise in GFP-correlated Pearson and Spearman approaches exhibited differences (Fig-
genes, nine out of the top 10 hub genes were associated with the ure S3A), pathways related to translation and ribosome biogen-
ribosomal compartment, but all indicated negative trends of esis were among the most significantly enriched (HyperGSA,
expression with increasing GFP production ( 0.88 < r < 0.78, p < 0.05) by both approaches (Figures 2B, S3F, and S3G).
93 < k < 134; Figure 2A; Table S2). Furthermore, nine out of 10 hubs of the Spearman GFP-corre-
We also performed Pearson correlation analysis to find over- lation network were ribosomal proteins (Figure 2A). This
laps and differences compared with the Spearman rank-based suggested that, in general, gene expression associated with
correlation approach (Figures S3A and S3B). Results of the Pear- translation processes is adopted in each group of EPO and
son correlation analysis revealed, altogether, 223 and 93 genes GFP producers to support their specific needs imparted by
were positively and negatively correlated with EPO production, their particular recombinant protein. To follow this observation,
respectively, and 99 and 19 genes were positively and negatively we investigated the expression of ribosomal genes in pairwise
correlated with GFP production, respectively (Figure S3C, mean comparison of each clone with its respective control
TPM >10, |Pearson’s r| > 0.5, p < 0.05). Similar to the Spearman (Figures S4A and S4B). GFP producers did not share common
analysis, we found major regulators among the genes highly differentially expressed ribosomal genes (B.H. adj. p < 0.05;
correlated (mean TPM >10, |Pearson’s r| > 0.5, p < 0.05) with Figure S4C). However, EPO producers showed 22 common
either EPO or GFP productivity by generating interaction net- differentially expressed (p < 0.05) ribosomal genes with at least
works (Figures S3D and S3E; Table S2). Four out of the top 10 50% increase in their expression in comparison with control
interacting genes in the network of EPO-correlating genes (Figure S4D). The functionality of these genes is mostly related
were involved in translation. RPL38 (r = 0.89, p = 0.01, to signal recognition particle (SRP)-dependent co-translational
k = 73) and RPS9 (r = 0.91, p = 0.01, k = 88), both components protein targeting the membrane. This suggests EPO producers
of cytosolic ribosomal subunits, were negatively correlated have increased the share of genes related to co-translational
with EPO production (Kondrashov et al., 2011), while MRPS11 protein targeting to membrane in their ribosomes to facilitate
(r = 0.9, p = 0.01, k = 71), a mitochondrial ribosomal gene, and EPO production.
EFL1 (p = 0.82, r = 0.04, k = 48), involved in 60S ribosomal sub-
unit biogenesis (Thomson et al., 2013), were positively corre- EPO production results in a restructured cellular
lated. Similarly, with GFP producers, we observed a negative metabolism
trend of expression in genes involved in translation with We sought to understand which changes in the protein pro-
increasing GFP production. Likewise, four out of the top 10 ducers were due to the production of secretory EPO and which
genes (EEF2, EEF1G, RPL3, and RPL4) with the highest number were common to all producers. PCA of the EPO and GFP tran-
of interactions in the network of GFP-correlating genes, serving scriptomics data identified marked differences between EPO
as translation factors or components of the ribosomal large sub- and GFP producers (Figure 1F), where a complete separation
unit, were negatively correlated (Pearson’s r < 0.7, p % 0.05, of EPO and GFP clones with the first principal component
94 < k < 202) with GFP production. Analysis of the corresponding (34% of variance explained) showed that the transcriptomics
biological GO terms (HyperGSA, p < 0.05; Figures S3F and S3G) data could capture differences between the secretory EPO and
for the EPO-correlating genes identified protein N-linked non-secretory GFP producers. We found 986 (922 up- and 64
glycosylation as the top enriched GO term with positively EPO- downregulated) differentially expressed genes (adj p < 0.05, |
correlated genes (HyperGSA, p = 0.01366; Figure S3F). Investi- Log2 fold change [L2FC ]| > 1) between EPO and GFP producers.
gation of associated genes with this pathway highlighted seven Gene set enrichment analysis (Figure S5A) showed that, for the
genes that are positively correlated with EPO production and EPO producers, beside gene sets specific for secretory protein
are involved in N-linked glycosylation (Figure S3F). KRTCAP2 production such as proteins targeting the ER or the cell mem-
(p = 0.02, Pearson’s r = 0.85) and OST4 (p = 0.003, Pearson’s brane, genes associated with the oxidative phosphorylation
Cell Reports 39, 110936, June 14, 2022 5ll
OPEN ACCESS Report
A
B C
(legend on next page)
6 Cell Reports 39, 110936, June 14, 2022ll
Report OPEN ACCESS
pathway were significantly (B.H. adj. p < 0.05) upregulated pathways with altered patterns of expression, we first conducted
(Figure 3A). pairwise differential expression analysis to find which genes are
To further explore the increased oxidative phosphorylation in differentially expressed between EPOF21 and other EPO pro-
gene expression among EPO producers, we investigated ducers (Figure S6A). All clones revealed a statistically significant
expression changes in genes associated with mitochondria (Fig- change (B.H. adj. p < 0.05) in EPO gene expression compared
ure 3A). All differentially expressed genes (B.H. adj. p < 0.05) with EPOF21. However, logarithmic fold changes of EPO were
involved in oxidative phosphorylation exhibited increased different in each pairwise comparison of EPO clones with
expression in EPO producers. The upregulated genes are asso- EPOF21, and only in EPOI2 did the EPO gene expression pass
ciated with all complexes in the electron transport chain except our arbitrary cutoff (L2FC > 1). The number of downregulated
for complex II, which facilitates the donation of electrons from differentially expressed genes (B.H. adj. p < 0.05, L2FC < 1)
FADH2. Higher gene expression in NADH dehydrogenase (com- varied between 186 (EPOF21 versus EPOI2) and 491 (EPOF21
plex I) followed by an increase in genes associated with complex versus EPO8), and the number of upregulated genes (B.H. adj.
III and complex V, could lead to higher ATP production (Fig- p < 0.05, L2FC > 1) showed a variation between 113 (EPOF21
ure 3A). All genes of mitochondrial origin across the electron versus EPOI2) and 792 (EPOF21 versus EPO8) genes (Fig-
transport chain (ETC) complexes exhibited at least a 2-fold ure S6A). We also found 44 common differentially expressed
increase in their expression (Figure S3A: genes with names genes in comparisons of each of the EPO producer clones
starting with MT-). Apart from upregulation of mitochondrial against EPOF21. Gene set enrichment analysis between
genes, other genes that are expressed from the nuclear genome EPOF21 and the other EPO producer cell lines (Figures S6B
and are associated with oxidative phosphorylation also had a and S6C) indicated that many common changes between
significant (B.H. adj. p < 0.05) expression increase in EPO pro- EPOF21 and the other EPO producers were related to post-
ducers (Figure 3A). To translate the findings to biological function translational pathways. To obtain extended gene sets spanning
and to investigate other possible differences in metabolism pathways related to protein secretion, we used a set of secretory
between EPO-producing cells versus GFP producers, we protein machinery genes that are defined as core genes involved
measured cellular metabolism using extracellular flux analysis in protein secretion in human cells (Feizi et al., 2017; Gutierrez
(Figures 3B, 3C, S5B, and S5C). Using this technique, we could et al., 2020), and then searched for all GO pathways (Liberzon
simultaneously monitor both metabolic branches of cellular ATP et al., 2011) that contained a significant (B.H. adj. p < 0.05) num-
production, namely mitochondria and aerobic glycolysis. Here, ber of these genes (HyperGSA). This collection of gene sets was
we found that EPO-producing cells indeed have higher basal then used to compare the different EPO producer cell lines (Fig-
and maximal oxygen consumption rate (OCR) compared with ure 4A: top altered pathways in at least one of the comparisons).
GFP-producing cells (Figures 3B and S5B). Moreover, we found Interestingly, when comparing EPOF21 with all other cell lines,
that aerobic glycolysis and pyruvate conversion to lactate (extra- we observed marked differences between the EPO8 cell line
cellular acidification rate [ECAR]) was higher in EPO-producing and the other EPO producers, which could have resulted from
clones compared with the GFP clones investigated as well as differences in EPO mRNA expression levels between EPO8
the parental cells (Figures 3C and S5C). This suggests that the and the other cell lines (Figure 1E). Furthermore, the upregulated
findings at the gene expression level regarding oxidative phos- pathways in EPOF21 compared with all other EPO producers
phorylation are translated into an increase in metabolic function except EPO8 indicated a marked increase in expression of
in EPO-producing cells and, together with an increase in aerobic gene sets related to the ER and handling of misfolded proteins
glycolysis, an increase in energy production. (Figure 4A).
To further investigate specific differences between EPOF21
Genes negatively regulating ER stress are upregulated and the other EPO producers, we analyzed which genes ex-
in EPO high-producer clone hibited a significant pattern of differential expression (B.H adj.
Besides the observations regarding differences between mRNA p < 0.05, L2FC > 1, mean TPM > 10) between EPOF21 and other
copy number and protein productivity in EPOF21 in comparison EPO clones. Of the 19 genes that displayed a consistent pattern
with other EPO producers (Figure 1E), differences in transcrip- of change, five were upregulated and 14 downregulated (Fig-
tion and translation as well as post-translational pathways might ure 4B). Among the upregulated genes, ATF6B is a transcription
have affected protein productivity. In order to find genes and factor active under ER stress conditions due to accumulation of
Figure 3. Cellular metabolism is restructured to meet the energy demands of EPO production
(A) The oxidative phosphorylation pathway was significantly (B.H. adj. p = 0.03) upregulated in EPO producers compared with GFP producers. Detailed visu-
alization of upregulated genes and their role in increasing ATP production shows, apart from upregulation of mitochondrial encoded genes, other genes like
NDUFA6, NDUFB1, and NDUFA4 in complex I; COX7B and COX7A2 in complex III; and ATP5MD and ATP5F1E in complex V have a significant (B.H. adj. p < 0.05)
expression increase in EPO producers compared with GFP producers.
(B) Comparison of oxygen consumption rate (OCR) of clones shows an increase in basal, oligomycin, and FCCP (carbonyl cyanide-p-tri-
fluoromethoxyphenylhydrazone) sensitive respiration in EPO clones versus GFP clones.
(C) Comparison of extracellular acidification rate (ECAR) highlights an increased basal and oligomycin induced aerobic metabolism of EPO versus GFP clones.
Data are represented by mean + confidence interval [CI], and statistical significance was calculated between each EPO and GFP clones and represented by using
a (significance versus GFP polyclone), b (GFP1), and c (GFP27). Each single dot represents a single technical replicate and different dot colors (white, black, and
gray) represent single experiments (n = 3).
Cell Reports 39, 110936, June 14, 2022 7ll
OPEN ACCESS Report
A B
C D
(legend on next page)
8 Cell Reports 39, 110936, June 14, 2022ll
Report OPEN ACCESS
unfolded proteins (Thuerauf et al. 2004), whereas FN1 and INA engineering targets for improved recombinant productivity in
share a role in extracellular matrix assembly (Singh et al. 2010). HEK293 cells.
The gene with the highest positive fold change between
EPOF21 and other EPO producers, AC116533.1, is a pseudo- DISCUSSION
gene of the ribosomal gene RPL36A, a ribosomal protein shown
to play a role in ribosome biogenesis in yeast (Wan et al. 2015). In the present study, we generated two groups of clones produc-
Downregulated genes covered a wider spectrum of pathways, ing either EPO or GFP at different levels (Figure 1A). EPO and
including apoptosis and growth regulation (LGALS1, G0S2, GFP were chosen due to their different characteristics (i.e., final
and EML2), nucleosome organization (HIST2H4A and SAMD1), cellular location) in order to study the pathways behind protein
metabolism of nucleotides (NME1 and NME2), protein folding production and differences caused by protein secretion. Indeed,
(HSPA1A and HSPA1B), and vesicle trafficking (EHBP1L1). analysis of the clonal transcriptomics data, where both clonal
Also, ID1 and NPAS1 play roles in transcription regulatory path- variation and the recombinant protein type were captured by
ways (Erbel-Sieler et al., 2004; Sikder et al., 2003), and TSSC2 is the most informative first principal component (Figure 1F), sug-
a pseudogene and a homologue to the Asparagine-Linked gests that the design of the experiment was appropriate for
Glycosylation 1 (ALG1) gene in yeast (Jaeken et al. 2015). exploring both the protein production and secretion stages.
As gene sets related to ER stress and/or unfolded proteins However, despite individual HEK293 clones showing different
were identified as significantly enriched among secretion GO productivities as well as different gene expression profiles
slims, we investigated the common significantly up- or down- (Figures 1C–1E and S1A), both transcription and translation
regulated (B.H adj. p < 0.05) genes within these categories were very well synced (Figure S1B). Thus, all of the clones except
(response to endoplasmic reticulum [ER] stress, cellular EPOF21, a clone with over 3-fold higher production levels
response to topologically incorrect protein. and negative regu- compared with the next highest EPO producer (Figure 1E), had
lation of response to ER stress) between EPOF21 and the an almost equal ratio of secretion of the recombinant protein
other EPO clones (Table S3). The most upregulated gene in versus transcription of the recombinant gene (Figure 1E). The
EPOF21 compared with the other clones within these gene higher ratio in EPOF21 (in relation to the other clones) indicated
sets was ATF6B, also identified as one of the top most upre- that major translational and post-translational processes were
gulated genes among all genes (Figure 4B). Interestingly, nine affected. This suggests that, although all clones were useful to
out of 10 genes belonging to the gene set of negative regula- study the effects related to non-secretory and secretory protein
tion of response to ER stress were found to be upregulated in production as well as their differences, the extraordinary
EPOF21 compared with the other EPO producers. Besides EPOF21 clone was particularly valuable in further pinpointing
ATF6B, other significantly upregulated genes in EPOF21 of major limiting parameters within secretory protein production,
this gene set included CLU, SYVN1, WFS1, HYOU1, which can in turn help to improve the general overall productivity
PPP1R15A, UBE2J1, DERL2, and TMBIM6. As ATF6B stands of cell factories.
out as one of the most differentially upregulated genes in Analysis of transcriptomic data between protein producer
EPOF21, we evaluated the effect of ATF6B on EPO production hosts and control parental cells showed upregulation of oxida-
in high and low EPO producers. Overexpression of ATF6B in tive phosphorylation in the majority of the clones regardless of
the low-producing clone EPOI2 resulted in an increased trend the transgene or level of recombinant protein production (Fig-
of specific EPO productivity (Figures 4C and S7A), whereas ure 1G), which suggests a high energy metabolism requirement
small interfering RNA (siRNA) silencing of ATF6B expression to support transgene expression. Moreover, significant upregu-
in the high producer EPOF21 showed a negative trend in volu- lation of genes linked to oxidative phosphorylation was observed
metric EPO titers with lower ATF6B expression levels when comparing EPO producers with GFP producers (Fig-
(Figures 4E and S7C). In the case of siRNA experiments, a ure S5A), suggesting that the post-translatory secretory path-
lot of cell cluster formation, regardless of siRNA, prevented ways in EPO clones may impose an even higher energy demand
reliable cell counting and hence the specific productivity was (Gutierrez et al., 2020). Simultaneous upregulation of genes en-
not possible to determine. Even though changes in EPO coded in both the mitochondria and nucleus highlight that the in-
expression were not significant (ANOVA one-way followed crease in transcription of genes involved in energy production is
by Dunnett’s test) in any of the experiments, collectively the governed by some cellular metabolic master regulator (Fig-
trends in EPO production indicates that ATF6B may play a ure 3A). The potentially increased demand for energy in EPO pro-
role in regulating the ER stress as a result of a high level of re- ducers compared with GFP producers is reflected by an in-
combinant EPO entering the ER, aiding increased EPO secre- crease in respiration and aerobic glycolytic pathway, which
tion in the EPOF21 clone. Hence, ATF6B and other genes can also increase energy production. Alternatively, the increased
negatively regulating ER stress serve as potential cell line energy production in EPO clones could be also related to the
Figure 4. Post-translational pathways are different between EPO producer clones
(A) Significantly enriched GO terms in pairwise comparisons of EPOF21 and other EPO producers using GO slim secretion.
(B) Gene expression levels of the most significant (B.H. adj. p < 0.05) consistently differentially expressed genes between EPOF21 and other EPO producers. Red
shows genes with upregulation in EPOF21 and blue genes are downregulated in EPOF21.
(C and D) EPO protein volumetric titers in supernatants (mean ± SD, n = 3) at day 3 in cultivation after transfection of the low-producer clones EPOI2 (C) and EPO7
(D) with an expression vector encoding rATF6B or an empty vector control, or (D) the high-producer EPOF21 clone with ATF6B siRNA or a negative control siRNA.
Cell Reports 39, 110936, June 14, 2022 9ll
OPEN ACCESS Report
intrinsic molecular differences between EPO and GFP or the (Figures 2 and S3) and pinpoint transgene-specific correlations
result of the general absence of secretory energy requirements between expression levels of different ribosomal genes and the
in GFP producers. For instance, there are 114 different respective recombinant protein titers (Figure S4). These results
N-linked and O-linked reported structures for EPO (Alocci could suggest that cells decrease the expression of some ribo-
et al., 2019), but the complexity of post translational processing somal components in a transgene-specific manner, in favor of
for GFP is simpler in general (Barondeau et al., 2003). Alterna- more convenient production of the specific recombinant protein.
tively, as EPO itself acts as a signaling molecule, it could poten- Focusing on the differences between high producer EPOF21
tially impart regulatory effects on EPO-producing clones, such clone and other EPO producers, we observed that the majority
as increased oxidative phosphorylation activity (Plenge et al., of differences are in the post-translational steps, including pro-
2012). However, EPO activity relies on the presence of the tein folding, PTMs, and handling of misfolded proteins (Figures 4,
EPO receptor (EPOR), which is generally restricted to erythroid S6B, and S6C). Indeed, in accordance with the increase of EPO
progenitor cells. Furthermore, a study of EPOR expression and transcripts in the EPOF21 clone, post-translational and ER-
activity by Ott et al. (2015) detected no EPOR protein in related pathways, such as negative regulation of ER stress,
HEK293 cells unless they were transfected with an EPOR over- were upregulated in EPOF21, compared with other EPO clones
expression vector. Accordingly, the EPOR expression in our da- with lower EPO transcript levels (Figure 4A). However, the
taset did not correlate with EPO production (Figure S8A), EPO8 clone, with almost 20% higher EPO transcript than
and, furthermore, there was no significant difference in the EPOF21 (Figures 1E and S1A), did not display an increased ac-
expression of this gene between EPO producers and GFP pro- tivity in some of the ER-associated pathways compared with
ducers or between EPO producers and their control cell line EPOF21. This indicates that a higher expression of the recombi-
(Figures S8A–S8D). Moreover, we did not detect any significant nant gene without the support of post-translational steps is not
difference (B.H adj. p < 0.05, L2FC > 1) in expression of down- only inefficient but can even cause problems with protein
stream genes in the EPOR signaling pathway (Figure S8E) in expression and lead to lower protein productivity. Furthermore,
comparing the transcriptomes of EPOF21 and other EPO pro- protein N-linked glycosylation was the highest enriched pathway
ducers (Figure S8F). We therefore reason that the transcriptional with positively EPO-correlating genes (Figure S3D). Since EPO is
changes observed in EPO-producing clones are likely to be a highly glycosylated protein (Falck et al., 2017) and these genes
associated primarily with differences in secreted protein produc- have a role in N-linked glocalization and also indicate a signifi-
tion rather than EPO-EPOR signaling, although an effect from cant positive correlation with EPO expression, their higher
signaling cannot be entirely ruled out. expression could support an increase in the EPO production
In EPO-clones, significant upregulation of genes belonging to level.
the eIF2 and mTOR signaling pathways could lead to activation To find the regulatory elements behind the higher activity of
of translation (Figure S2A). The eIF2 initiation complex is active in post-translational pathways in EPOF21, we investigated genes
translation initiation in eukaryotic cells and plays a role in stabi- with a consistent pattern of change between EPOF21 and other
lizing the preinitiation complexes through binding to mRNA, EPO producers. Among the top upregulated genes in EPOF21
GTP, methionine tRNA, and finally the 40S ribosomal subunit, was ATF6B (Figure 4B). ATF6B is integrated within the ER mem-
to generate the 43S preinitiation complex (Hinnebusch 2011; brane under normal conditions, but, during ER stress conditions,
Wek et al. 2006; Stolboushkina and Garber 2011; Schmitt et al. the cytoplasmic N-terminal domain is cleaved and the protein
2010). Likewise, activation of the mTORC1 module in the enters the nucleus to activate ER stress response genes (Thuer-
mTOR signaling pathway (Figure S2B) could promote protein auf et al. 2004; Iurlaro and Muñoz-Pinedo 2016). Although ATF6B
synthesis and profoundly increase cellular ATP level by control- and its isomer ATF6A both activate the ER stress response
ling mitochondrial biogenesis (Laplante and Sabatini 2009). genes (ERSRG), ATF6B represses the strong effect of ATF6A,
We detected a negative trend in the expression of some cyto- and through this regulation causes a moderated activation of
solic ribosomal genes (Figures 2A and S3E) with increasing GFP the ER stress response in comparison with ATF6A (Correll
production levels. The observed decrease in the expression of et al., 2019; Koul et al., 2017). Moreover, a previous study indi-
some ribosome-associated genes could be a result of an cated that targeting ATF6A using a microRNA (miR-1287)
induced stress due to higher levels of translation, or it could indi- enhances productivity in CHO cells producing a therapeutic anti-
cate a rearrangement in the profile of ribosomal components. body (Pieper et al., 2017), where miR-1287 had a very similar role
The latter is known as ribosome heterogeneity (Genuth and to ATF6B in competing with and suppressing ATF6A to decrease
Barna 2018b), which considers ribosomes as dynamic macro- the ER stress response. Additionally, it has previously been re-
molecular complexes that use a variation of different compo- ported that continued ER stress causes higher expression of
nents in their structure to fit with desired specialized functions genes involved in the folding process (Jäger et al., 2012).
(Genuth and Barna 2018a). It has previously been shown that Accordingly, activation of ATF6A during unfolded protein
specialized ribosomes can preferentially translate different sub- response (UPR) condition induces upregulation of heat shock
sets of mRNAs (Shi et al., 2017). Moreover, looking into associ- proteins such as HSPA1A and HSPA1B (Gargalovic et al.,
ated biological GO terms of positively correlated genes with 2006; Lee et al., 2003). Thus, downregulation of the stress-induc-
EPO production showed an enrichment of ribosome biogenesis ible chaperones HSPA1A and HSPA1B in EPOF21 (Figure 4B)
and rRNA metabolic processes (Figure 2B). Our observations could suggest a moderate level of ER stress in this clone,
highlight the presence of both upregulated and downregulated capable of supporting a high level of protein secretion, poten-
ribosome-related pathways in EPO and GFP producers tially governed by the higher expression of ATF6B. Indeed,
10 Cell Reports 39, 110936, June 14, 2022ll
Report OPEN ACCESS
ATF6B expression knockdown in the high-producer clone, and B Data and code availability
rATF6B overexpression in low producers, suggested a role for d EXPERIMENTAL MODEL AND SUBJECT DETAILS
the ATF6B transcription factor in enhancing EPO production in d METHOD DETAILS
293-F cells (Figures 4C and 4D). Other genes with negative reg- B Cell line generation and cultivation
ulatory roles during ER stress, which were upregulated in the B Protein expression analysis
high-producer clone compared with low-producers, were, for B Genome copy number estimation
instance, CLU, encoding clusterin, and SYVN1, encoding E3 B Correlation analysis
ubiquitin-protein ligase synoviolin. Clusterin is suggested to pro- B RNA sequencing and data analysis
tect cells from apoptosis during ER stress, for instance by B Ingenuity pathway analysis
inducing autophagy (Lee et al., 2019), whereas SYVN1 also pro- B Gene set analysis
tects cells from apoptosis and is involved in degradation of mis- B Extracellular flux analysis (SeaHorse)
folded proteins (Yamasaki et al., 2007; Kaneko et al., 2002). B Generating GO slim secretion
Another interesting example of an upregulated gene with nega- d QUANTIFICATION AND STATISTICAL ANALYSIS
tive regulatory effect on ER stress was PPP1R15A or GADD34,
shown to reverse eIF-2a-induced inhibition of protein translation SUPPLEMENTAL INFORMATION
upon ER stress (Brush et al. 2003). The over-representation of
Supplemental information can be found online at https://doi.org/10.1016/j.
genes involved in negative regulation of ER stress that are upre-
celrep.2022.110936.
gulated compared with downregulated in EPOF21 compared
with low producer clones, combined with the functional valida- ACKNOWLEDGMENTS
tion of the effect of ATF6B on EPO productivity, suggest that
EPOF21 may enable higher EPO production through a more This work was supported by the Knut and Alice Wallenberg Foundation;
balanced ER stress response. AstraZeneca; Swedish Foundation for Strategic Research (SSF); Swedish
In conclusion, the present study offers important insights into innovation agency Vinnova through AAVNova, CellNova, and AdBIOPRO;
and the Novo Nordisk Foundation (grant no. NNF10CC1016517). The compu-
transcriptomic changes during secretory EPO and non-secre-
tations/data handling was enabled by resources provided by the Swedish Na-
tory GFP production as well as key parameters influencing the tional Infrastructure for Computing (SNIC), partially funded by the Swedish
different rates of protein production across a variety of producer Research Council through grant agreement no. 2018-05973.
clones. The results are thus valuable for improving our under-
standing of the biology behind protein secretion in mammalian AUTHOR CONTRIBUTIONS
cells and the behavior of cells under ER stress conditions. More-
over, the key differences uncovered between high- and low-pro- Conceptualization, J.N., J.L.R., and J.R.; methodology, R.S., J.Z., N.M., M.M.,
J.L.R., and J.R.; formal analysis, R.S., J.Z., and M.M.; investigation, R.S.,
ducing EPO clones are potentially useful for future targeted
M.M., J.Z., V.C., R.R., N.M., P.-O.B., N.W., H.T., A.P., A.H., F.E., J.L.R., and
cell-line engineering to improve therapeutic protein production. J.R.; writing – original draft, R.S., J.Z., M.M., J.L.R., and J.R.; writing – review &
editing, R.S., J.Z., M.M., N.M., P.-O.B., D.H., J.N., L.G., V.C., J.L.R., and J.R.;
Limitations of the study visualization, R.S., J.Z., L.G., and J.L.R.; supervision, D.H., T.S., J.N., J.L.R.,
We report enhanced metabolism and negative regulation of ER and J.R., funding acquisition, J.N. and J.R.
stress to support higher EPO production through studies of sta-
DECLARATION OF INTERESTS
ble HEK293 clones and pools of varying production levels of EPO
and GFP. While experimentally confirming transcriptomics find- P.-O.B. is cofounder and CEO of Biocrine AB. L.G. and D.H. are employees of
ings by both upregulation and silencing of genes and functional AstraZeneca and may own AstraZeneca stock or stock options.
measurements, we believe further fine-tuning of key genes could
strengthen our claims further. As alluded to in the discussion, Received: September 28, 2020
part of the observed differences between clones could reflect Revised: January 5, 2022
Accepted: May 18, 2022
the intrinsic functionality of recombinant proteins in cell meta-
Published: June 14, 2022
bolism and might not be a direct result of the secretion properties
of the recombinant protein. Despite our reported attempts to REFERENCES
pinpoint such effects for EPO, a more complete analysis could
allow for such elucidation, which would make our conclusions Almo, S.C., and Love, J.D. (2014). Better and faster: improvements and opti-
more widely applicable for other proteins. mization for mammalian recombinant protein production. Curr. Opin. Struct.
Biol. 26, 39–43. https://doi.org/10.1016/j.sbi.2014.03.006.
Alocci, D., Mariethoz, J., Gastaldello, A., Gasteiger, E., Karlsson, N.G., Kolar-
STAR+METHODS
ich, D., Packer, N.H., and Lisacek, F. (2019). GlyConnect: glycoproteomics
goes visual, interactive, and analytical. J. Proteome Res. 18, 664–677.
Detailed methods are provided in the online version of this paper https://doi.org/10.1021/acs.jproteome.8b00766.
and include the following: Anger, A.M., Armache, J.-P., Berninghausen, O., Habeck, M., Subklewe, M.,
Wilson, D.N., and Beckmann, R. (2013). Structures of the human and
d KEY RESOURCES TABLE Drosophila 80S ribosome. Nature 497, 80–85. https://doi.org/10.1038/na-
d RESOURCE AVAILABILITY ture12104.
B Lead contact Barondeau, D.P., Putnam, C.D., Kassmann, C.J., Tainer, J.A., Getzoff, E.D.,
B Materials availability Tainer, J.A., and Getzoff, E.D. (2003). Mechanism and energetics of green
Cell Reports 39, 110936, June 14, 2022 11ll
OPEN ACCESS Report
fluorescent protein chromophore synthesis revealed by trapped intermediate Feizi, A., Gatto, F., Uhlen, M., and Nielsen, J. (2017). Human protein secretory
structures. Proc. Natl. Acad. Sci. U S A. 100, 12111–12116. https://doi.org/ pathway genes are expressed in a tissue-specific pattern to match processing
10.1073/pnas.2133463100. demands of the secretome. Npj Syst. Biol. Appl. 3, 22. https://doi.org/10.1038/
Behrouz, H., Molavi, B., Tavakoli, A., Askari, M., Maleknia, S., Mahboudi, F., and s41540-017-0021-4.
Khodadadian, M. (2020). Multivariate optimization of the refolding process of an Fouladiha, H., Marashi, S.-A., Torkashvand, F., Mahboudi, F., Lewis, N.E., and
incorrectly folded fc-fusion protein in a cell culture broth. Curr. Pharmaceut. Bio- Vaziri, B. (2020). A metabolic network-based approach for developing feeding
technol. 21, 226–235. https://doi.org/10.2174/1389201020666191002144424. strategies for CHO cells to increase monoclonal antibody production. Bioproc.
Bertram, K., Agafonov, D.E., Dybkov, O., Haselbach, D., Leelaram, M.N., Will, Biosyst. Eng. 43, 1381–1389. https://doi.org/10.1007/s00449-020-02332-6.
€hrmann, R., and Stark, H. (2017). Cryo-EM
C.L., Urlaub, H., Kastner, B., Lu Gargalovic, P.S., Imura, M., Zhang, B., Nima, M., Gharavi, M.J., Clark, J.P.,
structure of a pre-catalytic human spliceosome primed for activation. Cell Yang, W.-P., Yang, W.P., He, A., Truong, A., Patel, S., et al. (2006). Identifica-
170, 701–713.e11. https://doi.org/10.1016/j.cell.2017.07.011. tion of inflammatory gene modules based on variations of human endothelial
Bray, N.L., Pimentel, H., Melsted, P., and Pachter, L. (2016). Near-optimal cell responses to oxidized lipids. Proc. Natl. Acad. Sci. U S A 103, 12741–
probabilistic RNA-seq quantification. Nat. Biotechnol. 34, 525–527. https:// 12746. https://doi.org/10.1073/pnas.0605457103.
doi.org/10.1038/nbt.3519. Gentleman, R.C., Carey, V.J., Bates, D.M., Bolstad, B., Dettling, M., Dudoit, S.,
Brush, M.H., Weiser, D.C., and Shenolikar, S. (2003). Growth arrest and DNA Ellis, B., Gautier, L., Ge, Y., Gentry, J., et al. (2004). Bioconductor: open soft-
damage-inducible protein GADD34 targets protein phosphatase 1 alpha to the ware development for computational biology and bioinformatics. Genome
endoplasmic reticulum and promotes dephosphorylation of the alpha subunit Biol. 5, R80. https://doi.org/10.1186/gb-2004-5-10-r80.
of eukaryotic translation initiation factor 2. Mol. Cell Biol. 23, 1292–1303. Genuth, N.R., and Barna, M. (2018a). Heterogeneity and specialized functions
https://doi.org/10.1128/mcb.23.4.1292-1303.2003. of translation machinery: from genes to organisms. Nat. Rev. Genet. 19,
Chin, C.L., Goh, J.B., Srinivasan, H., Liu, K.I., Gowher, A., Shanmugam, R., 431–452. https://doi.org/10.1038/s41576-018-0008-z.
Lim, H.L., Choo, M., Tang, W.Q., Tan, A.H.M., et al. (2019). A human expres- Genuth, N.R., and Barna, M. (2018b). The discovery of ribosome heterogeneity
sion system based on HEK293 for the stable production of recombinant eryth- and its implications for gene regulation and organismal life. Mol. Cell 71,
ropoietin. Sci. Rep. 9, 16768. https://doi.org/10.1038/s41598-019-53391-z. 364–374. https://doi.org/10.1016/j.molcel.2018.07.018.
Colombo, P., Read, M., and Fried, M. (1996). The human L35a ribosomal pro- Goh, J.B., and Ng, S.K. (2017). Impact of host cell line choice on glycan profile.
tein (RPL35A) gene is located at chromosome band 3q29-Qter. Genomics 32, Crit. Rev. Biotechnol. 38, 851–867. https://doi.org/10.1080/07388551.2017.
148–150. https://doi.org/10.1006/geno.1996.0093. 1416577.
Correll, R.N., Grimes, K.M., Prasad, V., Lynch, J.M., Khalil, H., and Molkentin, Gutierrez, J.M., Feizi, A., Li, S., Kallehauge, T.B., Hefzi, H., Grav, L.M., Ley, D.,
J.D. (2019). Overlapping and differential functions of ATF6a versus ATF6b in Baycin Hizal, D., Betenbaugh, M.J., Voldborg, B., et al. (2020). Genome-scale
the mouse heart. Sci. Rep. 9, 2059. https://doi.org/10.1038/s41598-019- reconstructions of the mammalian secretory pathway predict metabolic costs
39515-5. and limitations of protein secretion. Nat. Commun. 11, 68. https://doi.org/10.
Datta, P., Linhardt, R.J., and Sharfstein, S.T. (2013). An ’omics approach to- 1038/s41467-019-13867-y.
wards CHO cell engineering. Biotechnol. Bioeng. 110, 1255–1271. https:// Hinnebusch, A.G. (2011). Molecular mechanism of scanning and start codon
doi.org/10.1002/bit.24841. selection in eukaryotes. Microbiol. Mol. Biol. Rev. 75, 434–467. https://doi.
Davy, A.M., Kildegaard, H.F., and Andersen, M.R. (2017). Cell factory engi- org/10.1128/mmbr.00008-11.
neering. Cell Syst. 4, 262–275. https://doi.org/10.1016/j.cels.2017.02.010. Iurlaro, R., and Muñoz-Pinedo, C. (2016). Cell death induced by endoplasmic
Del Val, I.J., Polizzi, K.M., and Kontoravdi, C. (2016). A theoretical estimate for reticulum stress. FEBS J. 283, 2640–2652. https://doi.org/10.1111/febs.
nucleotide sugar demand towards Chinese hamster ovary cellular glycosyla- 13598.
tion. Sci. Rep. 6, 28547. https://doi.org/10.1038/srep28547. Jaeken, J., Lefeber, D., and Matthijs, G. (2015). Clinical utility gene card for:
Dietmair, S., Hodson, M.P., Quek, L.-E., Timmins, N.E., Gray, P., and Nielsen, ALG1 defective congenital disorder of glycosylation. Eur. J. Hum. Genet. 23,
L.K. (2012). A multi-omics analysis of recombinant protein production in 1431. https://doi.org/10.1038/ejhg.2015.9.
Hek293 cells. PLoS One 7, e43394. https://doi.org/10.1371/journal.pone. Jäger, R., Bertrand, M.J.M., Gorman, A.M., Vandenabeele, P., and Samali, A.
0043394. (2012). The unfolded protein response at the crossroads of cellular life and
Dumax-Vorzet, A., Roboti, P., and High, S. (2013). OST4 is a subunit of the death during endoplasmic reticulum stress. Biol. Cell 104, 259–270. https://
mammalian oligosaccharyltransferase required for efficient N-glycosylation. doi.org/10.1111/boc.201100055.
J. Cell Sci. 126, 2595–2606. https://doi.org/10.1242/jcs.115410. Kafri, M., Metzl-Raz, E., Jona, G., and Barkai, N. (2016). The cost of protein
Dumont, J., Euwart, D., Mei, B., Estes, S., and Kshirsagar, R. (2016). Human production. Cell Rep. 14, 22–31. https://doi.org/10.1016/j.celrep.2015.12.015.
cell lines for biopharmaceutical manufacturing: history, status, and future per- Kaneko, M., Ishiguro, M., Niinuma, Y., Uesugi, M., and Nomura, Y. (2002). Hu-
spectives. Crit. Rev. Biotechnol. 36, 1110–1122. https://doi.org/10.3109/ man HRD1 protects against ER stress-induced apoptosis through ER-associ-
07388551.2015.1084266. ated degradation. FEBS (Fed. Eur. Biochem. Soc.) Lett. 532, 147–152. https://
Elangovan, M., Chong, H.K., Park, J.H., Yeo, E.J., and Yoo, Y.J. (2017). The doi.org/10.1016/s0014-5793(02)03660-8.
role of ubiquitin-conjugating enzyme Ube2j1 phosphorylation and its degrada- Kaufman, R.J., and Popolo, L. (2018). Protein synthesis, processing, and traf-
tion by proteasome during endoplasmic stress recovery. J. Cell Commun. ficking. In Hematology, Seventh Edition, R. Hoffman, E.J. Benz, L.E. Silber-
Signal. 11, 265–273. https://doi.org/10.1007/s12079-017-0386-6. stein, H.E. Heslop, I. Jeffrey, J.A. Weitz, M.E. Salama, and S.A. Abutalib,
Erbel-Sieler, C., Dudley, C., Zhou, Y., Wu, X., Estill, S.J., Han, T., Ramon Diaz- eds. (Elsevier), pp. 45–58.e1. https://doi.org/10.1016/b978-0-323-35762-3.
Arrastia, E.W.B., Steven Potter, S., Steven, L., and McKnight, S.L. (2004). 00005-6.
Behavioral and regulatory abnormalities in mice deficient in the NPAS1 and Kintzing, J.R., Filsinger Interrante, M.V., and Cochran, J.R. (2016). Emerging
NPAS3 transcription factors. Proc. Natl. Acad. Sci. U S A 101, 13648–13653. strategies for developing next-generation protein therapeutics for cancer
https://doi.org/10.1073/pnas.0405310101. treatment. Trends Pharmacol. Sci. 37, 993–1008. https://doi.org/10.1016/j.
Falck, D., Haberger, M., Plomp, R., Hook, M., Bulau, P., Wuhrer, M., and Re- tips.2016.10.005.
usch, D. (2017). Affinity purification of erythropoietin from cell culture superna- Koffas, M.A.G., Linhardt, R.J., Wang, Q., and Betenbaugh, M.J. (2018). Meta-
tant combined with MALDI-TOF-MS analysis of erythropoietin N-glycosyla- bolic engineering of CHO cells to prepare glycoproteins. Emerg. Top. Life Sci.
tion. Sci. Rep. 7, 5324. https://doi.org/10.1038/s41598-017-05641-1. 2, 433–442. https://doi.org/10.1042/etls20180056.
12 Cell Reports 39, 110936, June 14, 2022You can also read