Identification of Cell Surface Molecules That Determine the Macrophage Activation Threshold Associated With an Early Stage of Malignant ...
←
→
Page content transcription
If your browser does not render page correctly, please read the page content below
ORIGINAL RESEARCH
                                                                                                                                          published: 12 October 2021
                                                                                                                                    doi: 10.3389/fimmu.2021.749597

                                          Identification of Cell Surface
                                          Molecules That Determine the
                                          Macrophage Activation Threshold
                                          Associated With an Early Stage of
                                          Malignant Transformation
                                          Camille Jacqueline 1, Matthew Dracz 1, Sarah Boothman 2, Jonathan S. Minden 2,
                                          Rachel A. Gottschalk 1 and Olivera J. Finn 1*
                          Edited by:
               Sophia N Karagiannis,      1 Department of Immunology, University of Pittsburgh, Pittsburgh, PA, United States, 2 Department of Biological Sciences,

              King’s College London,      Carnegie Mellon University, Pittsburgh, PA, United States
                     United Kingdom

                       Reviewed by:
                     Soldano Ferrone,
                                          The ability of immune cells to sense changes associated with malignant transformation as
 Massachusetts General Hospital and       early as possible is likely to be important for the successful outcome of cancer
Harvard Medical School, United States
                                          immunosurveillance. In this process, the immune system faces a trade-off between
                     Markus Biburger,
        Friedrich-Alexander-University    elimination of cells harboring premalignant or malignant changes, and autoimmune
        Erlangen-Nürnberg, Germany        pathologies. We hypothesized that the immune system has therefore evolved a
                  *Correspondence:        threshold for the stage of transformation from normal to fully malignant cells that first
                       Olivera J. Finn
                       ojfinn@pitt.edu
                                          provides a threat (danger) signal requiring a response. We co-cultured human
                                          macrophages with a unique set of genetically related human cell lines that recapitulate
                   Specialty section:     successive stages in breast cancer development: MCF10A (immortalized, normal);
         This article was submitted to
                      Cancer Immunity
                                          MCFNeoT (benign hyperplasia); MCFT1 (atypical hyperplasia); MCFCA1 (invasive
                  and Immunotherapy,      cancer). Using cytokines-based assays, we found that macrophages were inert
               a section of the journal   towards MCF10A and MCFNeoT but were strongly activated by MCFT1 and MCFCA1
              Frontiers in Immunology
                                          to produce inflammatory cytokines, placing the threshold for recognition between two
           Received: 29 July 2021
     Accepted: 27 September 2021          premalignant stages, the earlier stage MCFNeoT and the more advanced MCFT1. The
       Published: 12 October 2021         cytokine activation threshold paralleled the threshold for enhanced phagocytosis. Using
                            Citation:     proteomic and transcriptomic approaches, we identified surface molecules, some of
Jacqueline C, Dracz M, Boothman S,
       Minden JS, Gottschalk RA and
                                          which are well-known tumor-associated antigens, that were absent or expressed at low
  Finn OJ (2021) Identification of Cell    levels in MCF10A and MCFNeoT but turned on or over-expressed in MCFT1 and
Surface Molecules That Determine the      MCFCA1. Adding antibodies specific for two of these molecules, Annexin-A1 and
    Macrophage Activation Threshold
    Associated With an Early Stage of     CEACAM1, inhibited macrophage activation, supporting their role as cancer “danger
            Malignant Transformation.     signals” recognized by macrophages.
          Front. Immunol. 12:749597.
    doi: 10.3389/fimmu.2021.749597        Keywords: breast cancer, TNF-a, 2D-DIGE, phagocytosis, annexin A1, CEACAM1

Frontiers in Immunology | www.frontiersin.org                                    1                                       October 2021 | Volume 12 | Article 749597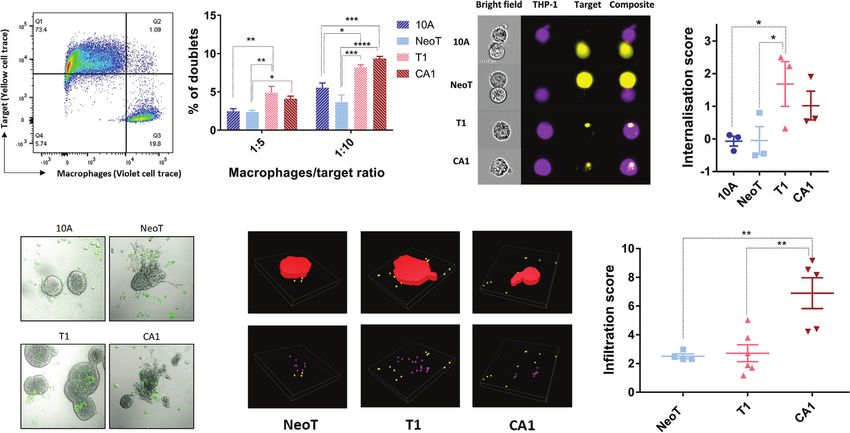
Jacqueline et al.                                                                                  Macrophages Sense Early Malignant Transformation

INTRODUCTION                                                               threshold at the premalignant stage represented by MCFT1.
                                                                           We also found that increased phagocytic activity followed the
Medical and evolutionary sciences have traditionally developed             same threshold with macrophages forming conjugates with
in relative isolation (1). In the 1970s, evolutionary and ecological       MCF10A and MCFNeoT but fully engulfing MCFT1 and
concepts began to be applied to cancer initiation and progression          MCFCA1. We measured differences in the transcriptome
(2, 3). Since this seminal work, several studies explored the              and the proteome between these cell lines and found several
processes of somatic cellular selection and evolution leading to           candidate molecules whose expression correlates with the
malignant transformation, metastasis or resistance to therapies            threshold for macrophage activation. We found expression of
(4–6). In addition to the evolution of clonal heterogeneity inside         the same molecules and macrophage infiltration in early stages of
the tumor, tumors also evolve in complex and multifaceted                  malignant transformation in breast tissue samples, recapitulating
ecological contexts. Indeed, tumors are composed of mixtures               our findings in vitro.
of cancer cells and non-cancer cells, which compose the tumor
microenvironment (TME). Tumor cells vary in their ability to
evade the immune system and the “invisible” clones present a
selective advantage and proliferate at the expense of others (7). It       MATERIALS AND METHODS
is now accepted that this co-evolutionary process, called
immunoediting, is ongoing in most cancers and involves the                 Antibodies
immune response as well as immune evasion by some tumor cells              Mouse monoclonal antibody 4H5, gift from the late Dr. Hilgers
(8). Application of evolutionary biology to the understanding              (Free University, Amsterdam), was used to stain the
of the crosstalk between cancer and immune cells is a                      hypoglycosylated form of MUC1. Her-2/neu was detected with
promising strategy to better understand the bases of cancer                Herceptin ® (Trastuzumab, Genentech Inc., San Francisco, CA,
vulnerability. The need for self-tolerance to avoid auto-                  USA) and CEACAM1 with antibody CEACAM1/CD66a (R&D
immunity and the need to eliminate cancer that arises from                 Systems, Minneapolis, MN, USA). Anti-Serpin B1 (clone 3B4)
self, may have exerted a strong selective pressure on the evolution        antibody was obtained from Novus Biologicals (Centennial, CO,
of cancer immunosurveillance (9, 10). Unlike viruses or bacteria,          USA). Anti-Annexin A1 clone EPR19342 and anti-CD68
premalignant cells may be particularly challenging for the                 (EPR20545) antibodies were purchased from Abcam
immune system because they are mostly self with initially only             (Cambridge, UK). Anti-Annexin A1 (74/3) and anti-Calregulin
a few characteristics of tumor cells (11).                                 (clone F-4) was purchased from Biolegend (San Diego, CA, USA)
    Macrophages play an important role in the initiation of                and Santa Cruz Biotechnology (Dallas, TX, USA) respectively.
immune responses that eventually lead to adaptive immunity                 Anti-PECAM1 (clone WM59) and FITC-CD47 (clone B6H12)
and immune memory. Their ability to sense “danger signals” on              were purchased from BD Biosciences (Franklin Lakes, NJ, USA).
cells undergoing malignant transformation, similarly to how they           APC-conjugated F(ab’)2 fragment specific to human IgG
sense danger signals from pathogens, may determine if and when             (Jackson Immunoresearch, West Grove, PA, USA) and FITC-
cancer immunosurveillance is initiated. In the context of                  conjugated goat anti-mouse IgG (Invitrogen, Carlsbad, CA,
microbial stimuli, an evolutionarily conserved threshold for               USA) were used as secondary antibodies. HRP-conjugated goat
“danger discrimination” controls inflammatory cytokines                     anti-rabbit (IgG) and goat anti-mouse (IgG) were purchased
production (12); MAPK were activated above a certain                       from Abcam and Jackson ImmunoResearch respectively.
concentration of microbial products, setting an inflammatory
activation threshold in both mouse and human macrophages.                  Cell Lines
Recently, it was shown that in squamous cell carcinoma of the              MCF10A cell line was purchased from ATCC (Manassas, VA,
lung, innate inflammatory responses are low in benign lesions               USA). MCFNeoT, MCFT1, and MCFCA1 cells were obtained
but increase with higher grade pre-invasive lesions, suggesting            from the Barbara Ann Karmanos Cancer Institute (Detroit, MI).
the existence of a threshold of activation of innate immune                The four cell lines were maintained as monolayers in Dulbecco’s
responses to cancer (13).                                                  Modified Eagle’s Medium-F12 (DMEM/F12) (Gibco, 11320033)
    We tested this hypothesis in a unique set of human breast cell         supplemented with 5% horse serum (Gibco, 16050122),
lines derived on the same genetic background, that recapitulate            1% penicillin/streptomycin (Lonza, 17-602E), 0.5 mg/ml
several steps in breast cancer progression: MCF10A cell line,              hydrocortisone (StemCell, 37150), 100 ng/ml cholera toxin
immortalized but not transformed; MCFNeoT and MCFT1 cell                   (Sigma, C-8052), 10 mg/ml insulin (Gibco, 1285014), and
lines, H-ras transformed, corresponding to premalignant                    20 ng/ml recombinant human EGF (Invitrogen, PHG0311).
hyperplasia and atypical hyperplasia, respectively; and MCFCA1,            THP-1 monocyte cell line was purchased from ATCC (TIB-202,
fully malignant invasive tumor cell line (14, 15). We exposed              Manassas, VI) and TNF-reporter cell line (THP1-B5) was a gift
macrophages to these cells and assessed their activation by the            from Dr. Ian Fraser (NIH/NIAID). Cells were cultured in RPMI-
secretion of several cytokines. Macrophages produced IL-10                 1640 (Life Technologies, Carslbad, CA) supplemented with 10%
upon encounter with MCF10A and MCFNeoT but switched to                     FBS, 1% Penicillin/Streptomycin and 1% Sodium Pyruvate. MCF
TNF-a and IL-1b when co-incubated with hyperplastic MCFT1                  cells were trypsinized off the plates. All cell lines were regularly
and fully transformed MCFCA1, suggesting an activation                     tested for Mycoplasma contamination by PCR.

Frontiers in Immunology | www.frontiersin.org                          2                                 October 2021 | Volume 12 | Article 749597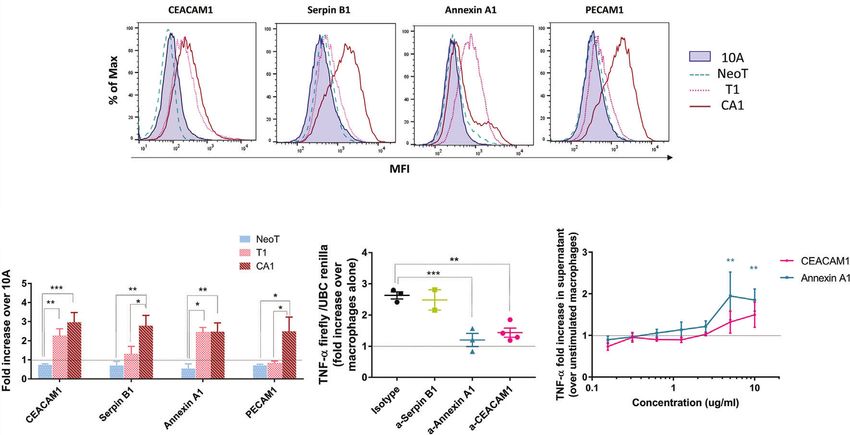
Jacqueline et al.                                                                             Macrophages Sense Early Malignant Transformation

Macrophage Generation                                                 in the supernatant of stimulated macrophages according to
Human peripheral blood mononuclear cells (PBMCs) were                 manufacturer’s protocol.
isolated from buffy coats of healthy blood donors (purchased
from Vitalant, Pittsburgh, PA) by FicollTM (Sigma-Aldrich)            Phagocytosis Assay
density gradient. Monocytes were sorted by magnetic-activated         Macrophages and MCF cells were washed twice in PBS, and labeled
cell sorting (MACS) using magnetic beads conjugated with anti-        with 1 µM CellTrace Yellow, Violet or CSFE (ThermoFisher,
human CD14 (CD14 MicroBeads, human, Miltenyi Biotech,                 Waltham, MA, USA) according to manufacturer’s protocol. After
Bergish Gladbach, Germany) and cultured for 5 days in RPMI            2 hours of co-incubation in 6-well plates, cells were stained with a
1640 culture medium and M-CSF (100 ng/mL; R&D systems) to             viability dye (1:1000 dilution in PBS, Ghost Red 780, #13-0865,
differentiate them into non-polarized (M0) monocyte-derived           TONBO Biosciences, San Diego CA, USA) for 15 min at 4°C.
macrophages. Macrophages were generated from THP-1 and                Samples were run on a Fortessa flow cytometer and gated based on
THP1-B5 monocyte cell lines by incubation for 48 hours with           negative signal for APC-Cy7 (i.e., live cells). AMNIS image
100 nM phorbol 12-myristate 13-acetate (PMA, Sigma, P8139),           cytometry was performed using an Amnis cytometer. Cells were
followed by 48 hours incubation in RPMI medium. 5mM EDTA              first visualized in a bright field and identified as macrophages
was used to detach macrophages.                                       (PacBlue) or MCF cells (FITC). The IDEAS software 6.2 was used
                                                                      to evaluate the percentage of doublets using the same gating strategy
                                                                      as for the phagocytosis assay. The images were merged to confirm
Antibody Blocking of Macrophage                                       the uptake of MCF cells by macrophages. The internalization score
Activation and Macrophage Stimulation                                 was measured using the internalization wizard of the
With Danger Signals                                                   IDEAS software.
125,000 MCF cell lines were pre-incubated with 1:10 dilution of
an mouse IgG1 isotype control antibody (0.5 mg/ml), anti-Serpin       Flow Cytometry
B1 (1 mg/ml), anti-Annexin A1 (1 mg/ml) or anti-CEACAM1               Cells were trypsinized, washed, collected and then stained with a
(0.5 mg/ml) for 30 min at 4°C before co-incubation with               viability dye (1:1000 dilution in PBS, Ghost Red 780, #13-0865,
macrophages. Macrophages were stimulated with seven 2-fold            TONBO Biosciences, San Diego CA, USA) for 15 min at 4°C.
serial dilutions of the 50 µg/ml top solution of CEACAM1 and          Cells were stained with the anti-MUC1 antibody 4H5 (1:100),
Annexin A1 protein (R&D systems) for 24 hours.                        anti-HER2 antibody trastuzumab (1:2000), anti-CEACAM1
                                                                      antibody (1:100), anti-Serpin B1 (1:100), anti-Annexin A1
Co-Cultures                                                           (1:400), anti-CRT (1:100), anti-PECAM1 (1:100) and anti-
Macrophages were always pretreated with 2% FC receptor                CD47 (100) diluted in flow cytometry buffer (PBS + 1% BSA),
binding inhibitor (ThermoFisher) for 15 min at 4°C before             for 30 min at 4°C followed by two washes with FACS buffer. Cells
co-incubation. Co-incubations were carried out in two different       were then stained with secondary goat anti-mouse IgG or F(ab’)2
step-ups: i) macrophages were plated simultaneously with              anti-human IgG (1:200 dilution in FACS buffer) for 30 min at
MCF cells to a ratio macrophages/MCF cells of 1:5 or 1:10.            4°C. Samples were run on a Fortessa flow cytometer and gated
ii) macrophages were plated in the bottom of the plate and MCF        based on negative signal for APC-Cy7 (i.e., live cells). APC
cells in a 96-well 0.4 µm transwell (Corning) with the same 1:5       (human) or FITC (mouse) mean fluorescence intensities were
and 1:10 macrophages/MCF cells ratio. All coincubation were           measured. 30,000 total events were recorded per sample.
carried out in duplicate in 96-well plates, in 150ul of MCF
medium and for 24 hours. When indicated in the legend, MCF            Dual Luciferase Assay of THP1-B5 Cell
cells were treated with neuraminidase (1:1000, Sigma-Aldrich)         TNF-a Production
for 2 hours in low-adherent plates before co-incubation.              After stimulation, the cells were washed once in PBS and lysed in
                                                                      passive lysis buffer (Promega). Firefly and renilla luciferase
Cytokine-Based Assays (CBA) and ELISA                                 activities were determined using SpectraMax i3X and the
At the end of the co-incubation supernatants were collected for       software Softmax Pro 7.0.3 with an 5s acquisition. The ratio of
the determination of cytokine production and were stored at           firefly luminescence to renilla luminescence was used to reflect
-80°C until used. Bead-based multiplex cytokine assay was used        TNF-a production in response to stimulation.
to measure the following cytokines: IL-1b, IFN-a2, IFN-g,
TNF-a, MCP-1, IL-4, IL-6, IL-8, IL-10, IL-12p70, IL-15,               Microscopy and 3-D Reconstruction
IL-17A, Il-18, IL-23, IL-33 (LEGENDplex™, Biolegend, San              3-D overlay cultures were generated following the published
Diego, CA, USA). A serial dilution of the inflammatory                 method (16). Briefly, 8-chamber slides (Falcon CultureSlides,
cytokine panel was run on the same plate according to the             #354118) were coated with 40 µl of Matrigel (Corning ® Matrigel ®
manufacturer’s instructions and read using a Fortessa flow             Matrix, #356234) and 5000 cells/well were seeded in medium
cytometer. Ten thousand total events were recorded per                containing 2% Matrigel and 5 ng/ml EGF. After 7-9 days, 3-D
sample and cytokines were considered undetectable below               cultures in Matrigel were washed twice with media before
2 pg/ml. Alternatively, human TNF-a ELISA Max kit                     seeding PMA-treated THP-1 (40,000 cells/well). THP-1 were
(Biolegend) was used to measure the concentration of TNF-a            previously labelled with CellTrace CFSE (Carboxyfluorescein

Frontiers in Immunology | www.frontiersin.org                     3                                 October 2021 | Volume 12 | Article 749597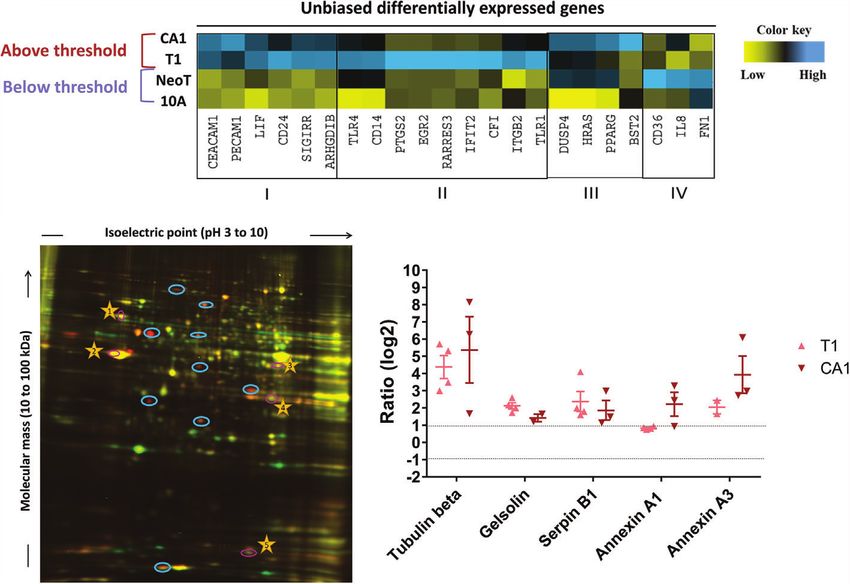
Jacqueline et al.                                                                                Macrophages Sense Early Malignant Transformation

succinimidyl ester) as described above. After 24 hours of                Technologies, Seattle, WA, USA). The protocol was carried out
incubation, bright-field and fluorescence images were taken                at the Genomics Research Core (University of Pittsburgh) using
using the Z-stack option on an Olympus Fluoview 1000                     100 ng of total RNA from each sample following their
confocal microscope at the Center for Biologic Imaging,                  commercial protocol. Data were analyzed using the NSolver
University of Pittsburgh. The pictures were taken under fixed             4.0 software, following the procedure described in the package
exposure conditions. 3-D reconstruction was performed with               instructions (19). Normalization of mRNA content, which
NIS-Elements (Nikon Instruments Inc., USA). 3-D cultures were            adjusts for positive control size factors, background noise and
delimited manually on each stack and FITC-positive                       housekeeping genes size factors, as well as differential expression,
macrophages were detected using the 3-D spot detection                   was performed.
function. The infiltration score was determined as the number
of macrophages detected inside the spheroid divided by the total         Immunohistochemistry
volume of the spheroid, multiplied by 1,000,000.                         Human tissue arrays were obtained from BioChain (Newark,
                                                                         CA, USA) and contained 18 cases of normal, premalignant, and
2D-DIGE and Liquid Chromatography/                                       malignant breast tissues (#Z7020010). DCIS slides were provided
Mass Spectrometry (LC/MS) Analysis                                       by Dr. Rohit Bhargava (Department of Pathology, UPMC,
Total cell lysates were generated from a confluent 10 cm2 culture         Pittsburgh). Slides were deparaffinized by baking overnight at
plate by scraping the cells with 100 µl of lysis buffer (7 M Urea,       59°C. Endogenous peroxidase activity was eliminated by
2 M Thiourea, 10 mM Hepes pH 8.0, 10 mM DTT, 4% CHAPS)                   treatment with 30% H2O2 for 15 min at room temperature.
followed by 30 min incubation on ice, 7 cycles of 30 s ON/30s            Antigen retrieval was performed by microwave heating in 0.1%
OFF sonicator and centrifugation for 15 min at 14,000 rpm.               citrate buffer for 10 min. Non-specific binding sites were blocked
Extracted protein were stored at -70°C. One hundred µg of                with 1% BSA. Reaction with anti-CD68 (1:100), anti-CEACAM1
untreated and treated samples were labelled with Cy3- and Cy5-           (1:50) and anti-Annexin A1 (1:100) was performed for 1 hour at
NHS minimal-labeling DIGE dyes (GE Healthcare, Uppsala,                  room temperature. Secondary antibodies were added at 1:100
Sweden) diluted in Dimethylformamide (DMF) (Sigma) for 30                dilution for 30 min. Positive signals were visualized by a DAB
min on ice. Labeling of the two samples was reversed (reciprocal         Substrate Kit (cat. #550880, BD Pharmingen) according to the
labeling) and run concurrently on a second 2D-DIGE gel to                manufacturer’s protocol. Histology sections were viewed on an
eliminate dye-dependent differences, constituting a technical            Olympus BX40 microscope. Images were acquired using Leica
replicate. First-dimension Isoelectric Point Focusing (IEF), and         DFC420 camera and Leica Application Suite version 2.7.1 R1.
second-dimension SDS-PAGE were conducted as described (17)
with the following modifications. Proteins were separated in the          Statistical Analysis
first-dimension on 18 cm pH 3-10NL IPG strips on a Protean i12            Significance analyses were performed by using GraphPad Prism
IEF Cell apparatus (Bio-Rad) for 32,000 Volt-hours. The samples          software version 7.0 (GraphPad Inc. San Diego, CA). Results
were then separated on the second-dimension SDS-PAGE in                  were represented as means ± standard error of the mean (SEM)
12% polyacrylamide gels in standard Tris-Glycine-SDS running             as specified in the legend. Statistical means and significance were
buffer. After electrophoresis, the gels were fixed in a solution of       analyzed using multiple comparison tests (One way ANOVA).
40% methanol and 10% acetic acid. The gels were imaged on a              Significance for all experiments was defined as follows: * p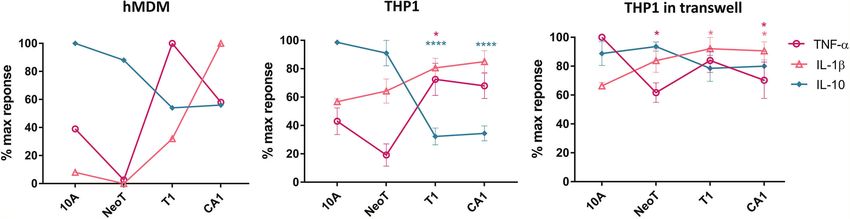
Jacqueline et al.                                                                                                Macrophages Sense Early Malignant Transformation

we selected three cytokines, TNF-a, IL-1b and IL-10. We found                        affected and remained higher in response to MCFT1 and
that co-incubation of macrophages with MCF10A induced low                            MCFCA1 compared to MCF10A.
levels of TNF-a and IL-1b and high levels of IL-10 (Figure 1A).                          Compared to unstimulated macrophages, THP-1 in contact with
IL-10 levels were lower in co-cultures with MCFNeoT, and there                       MCF10A showed similar levels of TNF-a and IL-1b but higher
was no detectable TNF-a or IL-1b. TNF-a levels dramatically                          levels of IL-10, suggesting that macrophages where inert when
rose in co-incubation with MCFT1 and decreased but remained                          sensing MCF10A (Supplementary Figure S2). In contrast, when
high with MCFCA1. While IL-1b paralleled TNF-a, increasing                           incubated with MCFT1 and MCFCA1, THP-1 macrophages
in co-cultures with MCFT1 and reaching even higher levels in                         secreted lower levels of IL-10 and a 2-fold increase in TNF-a and
response to MCFCA1, IL-10 levels continued to decrease                               IL-1b compared to unstimulated macrophages, suggesting immune
reaching their lowest levels in co-cultures with MCFT1                               activation. In co-incubations with MCFNeoT, macrophages seemed
and MCFCA1.                                                                          to be in a transitional state with similar levels of IL-10 and TNF-a
    We repeated these experiments with THP-1 monocyte cell                           but higher levels of IL-1b than resting macrophages. Therefore, an
line-derived macrophages that allow high reproducibility and for                     activation threshold depending on cell-cell contact and sensing of
which a recent study showed that they could be used as a                             surface molecules appeared to be between the two premalignant
simplified model of human macrophages even though the                                 states, MCFNeoT representing benign hyperplasia and atypical
order of magnitude in cytokine secretion after polarization was                      hyperplasia represented by MCFT1 in both primary hMDM and
lower in hMDM compared to THP-1 (20). We recapitulated the                           THP-1 derived macrophages.
results from primary macrophages: decrease in IL-10 and                                  We were also able to identify a similar activation threshold
increase in TNF-a and IL-1b occurred between MCFNeoT and                             in THP-1-derived dendritic cells (Supplementary Figure S3). In
MCFT1 (Figure 1B). The result was the same at 1:10                                   co-incubations with MCFT1 and MCFCA1, IL-1b concentration
macrophage/MCF cell ratio (Supplementary Figure S1A). The                            was increased whereas IL-10 concentration was decreased
production of these three cytokines by the MCF cell lines alone                      compared to co-incubation with MCF10A, similarly to what
was low and could not account for the difference observed in co-                     was observed in macrophages. TNF-a was however produced at
incubation (Supplementary Figure S1B). We then tested the                            very low levels by dendritic cells and instead IL-18, another
importance of cell-cell contact for establishing or maintaining                      proinflammatory cytokine primarily involved in polarized T-
the differences in cytokine patterns of expression between an                        helper 1 was increased between MCFNeoT and MCFT1.
earlier premalignant stage MCFNeoT and a later premalignant
stage MCFT1. We performed the co-incubations in transwell                            Increase in Phagocytic Activity and Tumor
plates where macrophages were seeded in the bottom section of                        Infiltration Coincides With the Macrophage
the transwell, separated from the MCF cells that were plated in                      Activation Threshold
the top of the transwell (Figure 1C). The shift in cytokine                          We wanted to know if the activation threshold that resulted in
expression patterns between MCFNeoT and MCFT1 was                                    increased pro-inflammatory cytokine production extended to
diminished in the absence of direct cell-cell contact, with                          other macrophage functions. We used flow cytometry to
higher TNF-a concentrations in response to MCF10A and                                examine the interaction of labeled macrophages (CellTrace
MCFNeoT soluble factors and increased IL-10 levels in                                Violet, Figure 2A, Q3) with the MCF cell lines (CellTrace
responses to MCFT1 and MCFCA1. IL-1b levels were not                                 Yellow, Figure 2A, Q1), and quantified the percentage of the

           A                                         B                                              C

 FIGURE 1 | The threshold of macrophage activation occurs between benign hyperplasia and atypical hyperplasia. (A) Cytokine production by human monocyte-
 derived primary macrophages (hMDM) and co-incubated with live cells from the MCF series indicated along the X-axis, at 1:5 macrophages/cell ratio. This result is
 representative of two experiments with two independent donors. (B) THP-1 monocyte cell line-derived macrophages were co-incubated as described in (A). Results
 are presented as mean values ± SEM of three experiments. (C) THP-1 macrophages were co-incubated in a transwell plate with cells plated on top of the transwell.
 Cytokines were assessed in a bead-based assay and normalized against the highest cytokine concentration observed in responses to one of the cell lines. Results
 are presented as mean values ± SEM of three experiments. Cytokine concentrations in co-incubations with MCFNeoT (NeoT), MCFT1 (T1) and MCFCA1 (CA1) were
 compared to MCF10A (10A) using Fisher LSD tests for each cytokine (represented by different color): *p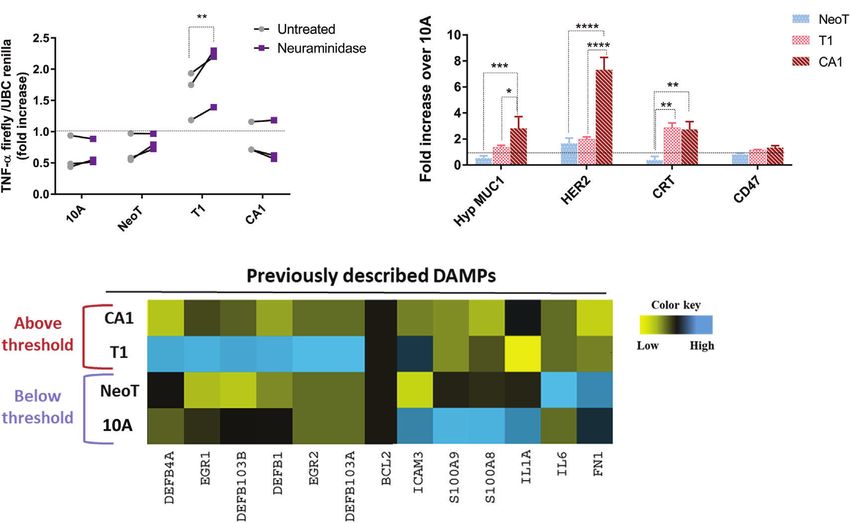
Jacqueline et al.                                                                                                 Macrophages Sense Early Malignant Transformation

    A                                 B                                                 C                                         D

    E                                           F                                                                  G

 FIGURE 2 | Defining thresholds for macrophage phagocytosis of MCF cell lines in suspension and infiltration into 3-D clusters. (A) Example of the gating strategy to
 identify macrophage-MCF cell doublets. Macrophages and MCFNeoT cells were labeled with Pacific Blue and PE cell tracers, respectively. Doublets (Q2) were
 identified as PacBlue, PE double positive cells. (B) Percentages of doublets in 1:5 and 1:10 macrophage/MCF cell ratio as indicated MCF10A (10A), MCFNeoT
 (NeoT), MCFT1 (T1) and MCFCA1 (CA1). Results are presented as mean values ± SEM of four experiments. Fisher LSD test: ****p
Jacqueline et al. Macrophages Sense Early Malignant Transformation
clusters could explain the multiple observations of cluster Thus, we focused our next analyses on the expression of well-
destructions (Figure 2E). known tumor-associated antigens and damage-associated
molecular patterns (DAMPs) to see which are associated with
Querying Well-Known Molecules Involved the transformation stages below versus above the macrophage
in Malignant Transformation, Macrophage activation threshold. We included in our analysis tumor antigens
Activation and Phagocytosis as Potential MUC1 and HER2, which have been reported to be over-
Danger Signals at the Macrophage expressed in breast cancer and to affect macrophage function
Activation Threshold (19, 23), and the “eat-me” signal CRT and the “don’t eat me”
As cell-cell contact was necessary to reveal the macrophage signal CD47 (24). We found that the hypoglycosylated form of
activation threshold, we focused our efforts on identifying cell MUC1 and Her-2/neu were significantly overexpressed on the
surface molecules that could act as danger signals in malignant surface of MCFCA1 compared to MCFNeoT but not on MCFT1,
transformation. A common mechanism in tumor progression suggesting that they were not involved in setting the macrophage
and metastasis is an alteration of glycosylation and sialylation activation threshold (Figure 3B). In contrast, MCFT1 and
(21). We investigated potential changes in the activation MCFCA1 expressed significantly higher levels of CRT which
threshold after treating the MCF cells with neuraminidase, a may contribute to enhanced phagocytosis of these cells. All three
glycoside hydrolase that removes sialic acids from the terminal cell lines expressed similar levels of CD47. Finally, we analyzed
positions of glycans and exposes the cryptic Tri/m-II, leading to mRNA expression of a panel of DAMPs such as BCL2, EGR,
an increased binding of calreticulin (CRT), the “eat me” signal, ICAM-3, IL-1a, IL-6, defensins, fibronectin 1 and the S100
and phagocytosis (22). We found that neuraminidase treatment protein (25), and found no correlation of their expression with
increased TNF-a concentration in responses to MCFT1 cells but the macrophage activation threshold (Figure 3C). Nevertheless,
did not move the threshold to the earlier premalignant stage or MCFT1 showed a specific pattern of defensin and EGR gene
impact macrophage TNF-a response to the malignant MCFCA1 expression compared to MCFCA1 that could contribute as
cells (Figure 3A). additional signals for macrophage activation.
A B
C
FIGURE 3 | Querying known DAMPs as candidate danger signals for determining macrophage activation threshold in response to transformed cells. (A) Sialic acid
removal by neuraminidase treatment of MCF cells, indicated along the X-axis, does not affect the threshold. Y-axis shows fold increase of TNF-a in THP-1 B5
macrophages after 24h incubation at 1:5 macrophage/cell ratio. Co-incubation with untreated cells is in gray and with neuraminidase-treated cells in purple. Results
are representative of three experiments. Fisher LSD test: **pJacqueline et al. Macrophages Sense Early Malignant Transformation
Unbiased Identification of Potential New the monolayer cultures and labeled them with two different
Candidates Acting as Danger Signals Cyanine-based, amine-reactive, minimal-labeling dyes and
Associated With the Macrophage resolved them by 2D-DIGE (17) as described in Materials and
Methods. Figure 4B is a representative 2D gel where proteins
Activation Threshold
from MCF10A (red) and MCFT1 (green) were resolved and
We next took an unbiased approach to identify candidate danger
visualized as spots. We quantified the difference in expression of
molecules associated with macrophage activation. We first
each protein by analyzing the pixel intensity of each spot in the
profiled the four MCF cell lines, quantifying expression of 579
images of 2D gels with Source Extractor across 2 biological and 4
immune response genes using the Nanostring nCounter Human
technical replicates (Supplementary Figure S4A). After
Immunology V2 Panel. We identified 93 genes in MCFNeoT,
normalization that accounts for differences in dye intensities,
192 in MCFT1 and 136 in MCFCA1 that had log2 fold change of
we considered that proteins were significantly differentially
expression > 1 over MCF10A. When considering genes with a
expressed when they had a log2 fold change of spot intensity
fold change of expression >5, we could identify four distinct
> 1 compared to MCF10A (Supplementary Figure S4B). Those
groups of genes associated with various stages of malignant
protein spots were excised from the gel, digested into peptides
transformation: I) genes overexpressed in both MCFT1 and
with trypsin and subjected to mass spectrometry analysis. We
MCFCA1; II) genes overexpressed in MCFT1 only; III) genes
found that five proteins were consistently over-expressed in
overexpressed in MCFCA1 only; and IV) genes overexpressed in
MCFT1 and MCFCA1 but not in MCF10A and MCFNeoT:
MCFNeoT only (Figure 4A). Of greatest interest are the genes in
Tubulin beta, Gelsolin, Annexin A1, Annexin A3 and Serpin
group I because they appear in MCFT1 and persist in MCFCA1,
B1 (Figure 4C).
corresponding to the macrophage activation that starts in
response to MCFT1 and continues in response to MCFCA1.
Because change in gene expression does not always translate The Candidate Danger Molecules Annexin
to change in protein expression, we compared the proteome of A1 and CEACAM1 Participate in the
each transformed cell line with the proteome of MCF10A and Macrophage Activation Threshold
identified molecules specifically over-expressed in the From the 11 candidate molecules identified with NanoString and
premalignant and malignant cells. We extracted proteins from 2D-DIGE methods, we decided to focus on 4 of them to further
A
B C
FIGURE 4 | Unbiased identification of genes and proteins associated with the macrophage activation threshold. (A) Heatmap representation of expression of genes
with a fold increase greater than 5 over MCF10A (10A). The color key was provided by the software and shows an expression gradient from low (log2 FC 1). I, genes upregulated in MCFT1 (T1) and MCFCA1 (CA1); II, genes upregulated in MCFT1(T1) only; III, genes upregulated in MCFCA1 (CA1) only; IV, genes
upregulated in MCFNeoT (NeoT) only. (B) Differentially expressed proteins between MCF10A labeled with Cy3-NHS (green) and MCFT1 labeled with Cy5-NHS (red);
labeled proteins were mixed and resolved on 2D-DIGE as described in Materials and Methods. Shared proteins migrate identically and appear as yellow spots. Blue
circles mark spots unique to MCFT1 that were picked for sequencing. Numbered yellow stars were used in the quantification analysis as guiding spots. (C) Changes in
expression of 2D-DIGE-identified proteins in MCFT1 and MCFCA1 relative to MCF10A. Results are presented as mean values ± SEM of 4 technical replicates.
Frontiers in Immunology | www.frontiersin.org 8 October 2021 | Volume 12 | Article 749597Jacqueline et al. Macrophages Sense Early Malignant Transformation
explore their surface expression and their impact on macrophage antibody-dose dependent (Supplementary Figure S5B).
activation. We eliminated soluble factors (LIF) and proteins with Finally, we confirmed the potential of our candidates to
structural or post-transcriptional changes (Tubulin beta) to focus activate macrophages by stimulating THP-1 macrophages with
on proteins for which antibodies were commercially available CEACAM1 and Annexin A1 individually at different
and their association with epithelial cancer progression had concentration (Figure 5D). We found that both proteins
already been documented. activate a TNF-a responses in a dose-dependent manner.
We measured protein expression on the surface of the Activation by Annexin A1 was significant at concentration
transformed cell lines by flow cytometry and expressed the results above 2.5ug/ml and while CEACAM1 followed the same
relative to MCF10A (Figure 5A). Serpin B1 and PECAM1 were trends it did not reach significance.
significantly more highly expressed on MCFCA1 compared to
MCF10A, while MCFT1 and MCFCA1 both expressed Evidence of a Threshold in Annexin A1
significantly higher levels of CEACAM1 and Annexin A1 and CEACAM1 Expression in Human
(Figure 5B). This confirmed that the transcriptomic and Breast Cancer Associated With
proteomic differences observed between the cell lines were Macrophage Activation
associated with differences in surface expression. The only We examined human breast tissue samples of normal breast
discordance between our 2D-DIGE and flow cytometry analysis ducts (MCF10A-like), preneoplastic hyperplasia (MCFNeoT-
was in the case of Serpin B1, which is largely localized to like), ductal carcinoma in situ (DCIS, MCFT1-like) and
the cytoplasm. invasive ductal carcinoma (MCFCA1-like), for evidence of a
We attempted to interfere with the macrophage threshold by macrophage infiltration threshold, which we detected by the
pre-treating MCF cell lines for 30 minutes with antibodies intensity of staining for the macrophage marker CD68. We saw
against these three molecules in order to block their no macrophages in the normal and in hyperplastic tissue sections
recognition by macrophages. Figure 5C shows that antibodies (Figure 6). The first evidence of macrophage infiltration was
against Annexin A1 and CEACAM1, but not against Serpin B1, found at the DCIS stage and it increased greatly in invasive
lowered TNF-a production in response to MCFT1 to levels ductal carcinoma (IDC). We also looked for differential
comparable to what we see in response to MCF10A and expression of the candidate danger molecules Annexin A1 and
MCFNeoT (Supplementary Figure S5A). This effect was CEACAM1 and saw, consistent with our cell line data, increased
A
B C D
FIGURE 5 | Candidate danger molecules differentially expressed above and below the macrophage activation threshold that promote inflammatory function.
(A) Representative flow plots of CEACAM1, Serpin B1, Annexin A1 and PECAM1 expression in MCF10A (10A), MCFNeoT (NeoT), MCFT1(T1) and MCFCA1
(CA1). (B) Differential expression of selected cell surface proteins by MCFNeoT (NeoT), MCFT1 (T1) and MCFCA1 (CA1) relative to MCF10A (10A, dashed line),
assessed by flow cytometry. Results are presented as mean values ± SEM of three experiments. Fisher LSD test: ***pJacqueline et al. Macrophages Sense Early Malignant Transformation
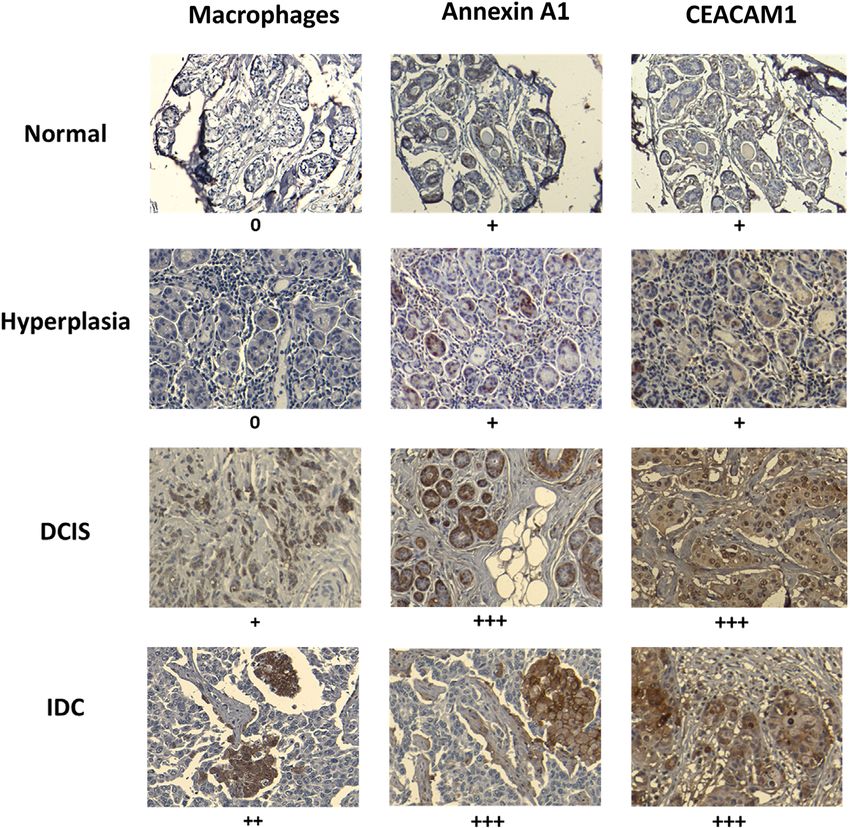
FIGURE 6 | Macrophage infiltration and expression of Annexin A1 and CEACAM1 in human breast tissues at various stages of transformation mirror the in vitro
observed activation threshold. Example of paraffin-embedded samples of breast tissues, normal (1 of 8 total), hyperplasia (1 of 5 total), ductal carcinoma in situ
(DCIS) (1 of 8 total) and invasive ductal carcinoma (IDC) (1 of 6 total), sectioned and stained with relevant antibodies (see Materials and Methods). Slides were
scanned at 10X magnification in order to select for a high-resolution image at 20X. Images were scored by measuring the percentage of IHC positively labeled cells:
+, 75%. Representative images are shown. The “+” signs refer to results from all analyzed samples in each
tissue type.
Annexin A1 and CEACAM1 expression beginning at the DCIS that were developed to recapitulate the progression of breast
(MCFT1-like) stage and continuing in invasive cancer. cancer (15). We were able to show a switch from low baseline
levels of TNF-a production in response to normal MCF10A to
high levels in response to atypical hyperplasia, a premalignant
DISCUSSION stage of disease. This activation of TNF-a production was
dependent on cell-cell contact and was contemporaneous with
Macrophages are known to be important effectors of cancer an increase in phagocytic activity of macrophages against that
immunosurveillance (26) through programmed cell removal and same premalignant stage. The difference observed between
activation of TLR pathways (27). However, because cancer cells MCFT1 and MCFCA1 in terms of 3-D cluster infiltration
closely resemble normal cells it is still unknown how early in could be explained by the difference in “find-me” signal
tumor development can macrophages sense and eliminate secretion (28). However, we demonstrated that in vivo, the
abnormal cells or initiate adaptive immunity against them. The threshold for infiltration of macrophages in malignant lesions
results described here give the first evidence in an in vitro model was similar to the activation threshold, suggesting that our 3-D
system of a threshold of activation and phagocytosis that is culture system might not reproduce all the interactions in the
observed in macrophages that interact with cells at various stages tumor microenvironment, especially those with other immune
of malignant transformation. We were able to detect such a cells. Similarly, our system did not allow to measure the
threshold by co-culturing macrophages with a series of cell lines consequences of long-term interactions between tumor cells
Frontiers in Immunology | www.frontiersin.org 10 October 2021 | Volume 12 | Article 749597Jacqueline et al. Macrophages Sense Early Malignant Transformation
and macrophages. Indeed, tumor cells can promote a pro- mammals (41). This rather late activation threshold might reflect
tumoral phenotype in macrophages, which in turn stimulate a trade-off between immunosurveillance and auto-immunity. In
angiogenesis and enhance tumor cell invasion and motility. fact, because cancer is mainly a post-reproductive disease (42),
Future studies will explore the long-term interactions between natural selection is likely to strongly select mechanisms that
early premalignant lesions and macrophages and how they increase survival in early life such as the ones that are limiting
impact their anti-tumoral activity. auto-immune responses even at the detriment of letting early
Macrophages have been shown to distinguish cancer cells premalignant lesions grow. In addition, the evolution of
from normal cells by the DAMPs they express on their surface. immunosurveillance has probably faced another trade-off
DAMPs are recognized by TLR receptors on macrophages and related to inflammation associated with cell destruction that
trigger a molecular cascade leading to pro-inflammatory can potentially lead to de novo damages in surrounding
responses. This does not appear to be the main mechanism in normal cells and tumorigenesis, a situation that has been
the setting of premalignancy. We did not find an association envisioned in responses to immune-checkpoint inhibitors (43).
between the expression of previously described DAMPs or In light of these constraints, the evolution of inflammatory
known breast tumor-associated antigens with the threshold of responses to only fitness-decreasing phenotypes of cancer (i.e.,
activation of premalignant cells. Rather our study showed the clinically malignant) seems to represent a beneficial equilibrium.
importance of other molecules still poorly investigated for their However, recent evidence suggests that this equilibrium, and
role as “danger signals” or DAMPs, that appear to distinguish therefore the threshold of activation, might change depending on
“self” from pre-cancer. Among those we found that we could the importance of particular cells and organs for survival of the
block Annexin A1 and CEACAM1 with antibodies and abrogate individual (44, 45). The eradication of non-essential cells (such as
the threshold for macrophage activation. They were also melanocytes) is affordable to the organism and therefore
individually sufficient to activate TNF-a production by malignant transformation could trigger macrophage activation
macrophage as previously described for CEA (29). We earlier than what we observed in the breast. Further studies
confirmed that they are overexpressed in vivo as early as ductal should explore the existence and characteristics of the innate
carcinoma in situ, which is represented by the premalignant immune activation threshold in different cancer types.
MCFT1 cell line. In the Human Protein Atlas, expression of The data emerging from our study suggest significant
Annexin A1 (p=0.025) and CEACAM1 (p=0.007) was associated opportunities to use the “danger signals” on premalignant
with an increased survival in breast cancer patients. Annexin A1 lesions to develop novel targeted chemoprevention and
is an immune-modulating protein with diverse functions, one of immunoprophylactic strategies. Drugs could also be developed
which is an “eat me signal,” that plays multiple roles in cancer to lower the discrimination threshold and therefore eliminate
growth and metastasis (30). Annexin A1 binds to the formyl more efficiently earlier stages of premalignancy. However, those
peptide receptor (FPR) 2, a pathogen recognition receptor that drugs will have to be carefully assessed for associated side-effects
triggers immune responses (31). CEACAM1 is well-known as a as early premalignant stages still share a lot of similarities with
tumor-associated antigen over-expressed primarily in colorectal normal cells. Tampering with the immune tolerance trade-off
cancers but also in breast cancer (32), and it has been shown to could have dangerous auto-immune consequences and thus
activate inflammatory responses and promote differentiation of identification of markers that are present in premalignant
human macrophages (29, 33). Macrophages expressed two lesions but absent or low in normal cells is crucial for the
receptors for CEA molecules, TIM3 that has been identified as development of safe drugs. In addition to supporting cancer
a receptor of CEACAM1 on innate cells, and the heterogeneous prevention, a better understanding of mechanisms selected by
nuclear ribonucleoprotein M (CEAR) that is involved in immune evolution for a decreased tolerance of the immune system to
activation signaling (34, 35). premalignant cells could have implications for the management
The origin of ancestral myeloid phagocytes is linked to the of auto-immune disorders.
appearance of vertebrates 300 million years ago (36) and
phagocytic activity was also identified in invertebrate such as
starfishes (37). Cancer probably appeared long before that with
the transition to multicellularity more than half a billion years DATA AVAILABILITY STATEMENT
ago (38). Therefore, macrophages have been under strong
selective pressure to eliminate aberrant cells in the absence of The datasets presented in this study can be found in online
adaptive effectors appearing in mammals. Our study supports repositories. The names of the repository/repositories and
that macrophages are involved in the recognition of developing accession number(s) can be found below: The Gene expression
cancer with a threshold of activation with advanced data have been deposited and can be found with the accession
premalignant stages based on highly conserved danger signals. number GSE181585 at: https://www.ncbi.nlm.nih.gov/geo/query/
Indeed, Annexin A1 is expressed from mammals to birds with a acc.cgi?acc=GSE181585. Similarly, the mass spectrometry
remarkable conservation of the intron-exon organization (39, proteomics data have been deposited to the ProteomeXchange
40), while the CEACAM1 gene family is evolving more rapidly Consortium via the PRIDE partner repository with the dataset
but several orthologous genes can be found in distantly related identifier PXD027746.
Frontiers in Immunology | www.frontiersin.org 11 October 2021 | Volume 12 | Article 749597Jacqueline et al. Macrophages Sense Early Malignant Transformation
AUTHOR CONTRIBUTIONS ACKNOWLEDGMENTS
CJ, RG, and OF contributed to conception and design of the We are highly appreciative of the help and advice from Dr. Anda
study. CJ and MD conducted the in vitro experiments. CJ, SB, Vlad and Ms. Mary Strange, Dr. Simon Watkins and Morgan
and JM performed the 2D DIGE analyses. CJ wrote the first draft Jessup, and the Flow Core. This project used the Hillman Center
of the manuscript. RG, JM, and OF wrote sections of the for Biologic Imaging and Genomics Research Core that are
manuscript. All authors contributed to manuscript revision, supported in part by award P30CA047904.
read, and approved the submitted version.
SUPPLEMENTARY MATERIAL
FUNDING
The Supplementary Material for this article can be found online
This work was supported by NIH grant R35 CA210039 to OJF at: https://www.frontiersin.org/articles/10.3389/fimmu.2021.
and Forbeck Foundation grant to CJ. 749597/full#supplementary-material
17. Minden JS. Two-Dimensional Difference Gel Electrophoresis. In: Methods in
REFERENCES Molecular Biology (Clifton, N.J.). Elsevier (2012). p. 287–304. doi: 10.1007/
1. Williams GC, Nesse RM. The Dawn of Darwinian Medicine. Q Rev Biol 978-1-61779-821-4_24
(1991) 66:1–22. doi: 10.1086/417048 18. Balasubramani M, Nakao C, Uechi GT, Cardamone J, Kamath K, Leslie KL,
2. Nowell PC. The Clonal Evolution of Tumor Cell Populations. Science (1976) et al. Characterization and Detection of Cellular and Proteomic Alterations in
194:23–8. doi: 10.1126/science.959840 Stable Stathmin-Overexpressing, Taxol-Resistant BT549 Breast Cancer Cells
3. Cairns J. The Cancer Problem. Sci Am (1975) 233:64–72. doi: 10.1038/ Using Offgel IEF/PAGE Difference Gel Electrophoresis. Mutat Res (2011)
scientificamerican1175-64 722:154–64. doi: 10.1016/j.mrgentox.2010.08.019
4. Cahill DP, Kinzler KW, Vogelstein B, Lengauer C. Genetic Instability and 19. Cascio S, Finn OJ. Intra-And Extra-Cellular Events Related to Altered
Darwinian Selection in Tumours. Trends Cell Biol (1999) 9:M57–60. Glycosylation of MUC1 Promote Chronic Inflammation, Tumor
doi: 10.1016/S0962-8924(99)01661-X Progression, Invasion, and Metastasis. Biomolecules (2016) 6:1–16.
5. Merlo LMF, Pepper JW, Reid BJ, Maley CC. Cancer as an Evolutionary doi: 10.3390/biom6040039
and Ecological Process. Nat Rev Cancer (2006) 6:924–35. doi: 10.1038/ 20. Tedesco S, De Majo F, Kim J, Trenti A, Trevisi L, Fadini GP, et al.
nrc2013 Convenience Versus Biological Significance: Are PMA-Differentiated THP-1
6. Greaves M, Maley CC. Clonal Evolution in Cancer. Nature (2012) 481:306– Cells a Reliable Substitute for Blood-Derived Macrophages When Studying in
13. doi: 10.1038/nature10762 Vitro Polarization? Front Pharmacol (2018) 0:71. doi: 10.3389/FPHAR.2018.
7. Crespi B, Summers K. Evolutionary Biology of Cancer. Trends Ecol Evol 00071
(2005) 20:545–52. doi: 10.1016/j.tree.2005.07.007 21. Kölbl AC, Andergassen U, Jeschke U. The Role of Glycosylation in Breast
8 . D un n G P , O ld L J , Sc h r ei b e r R D . T h e Th r e e E s of C an c e r Cancer Metastasis and Cancer Control. Front Oncol (2015) 5:219.
Immunoediting. Annu Rev Immunol (2004) 22:329–60. doi: 10.1146/ doi: 10.3389/fonc.2015.00219
annurev.immunol.22.012703.104803 22. Feng M, Marjon KD, Zhu F, Weissman-Tsukamoto R, Levett A, Sullivan K,
9. Mapara MY, Sykes M. Tolerance and Cancer: Mechanisms of Tumor Evasion et al. Programmed Cell Removal by Calreticulin in Tissue Homeostasis and
and Strategies for Breaking Tolerance. J Clin Oncol (2004) 22:1136–51. Cancer. Nat Commun (2018) 9:1–15. doi: 10.1038/s41467-018-05211-7
doi: 10.1200/JCO.2004.10.041 23. Walens A, Dimarco AV, Lupo R, Kroger BR, Damrauer JS, Alvarez JV. CCL5
10. Jacqueline C, Biro PA, Beckmann C, Moller AP, Renaud F, Sorci G, et al. Promotes Breast Cancer Recurrence Through Macrophage Recruitment in
Cancer: A Disease at the Crossroads of Trade-Offs. Evol Appl (2017) 10:215–25. Residual Tumors. Elife (2019) 8:e43653. doi: 10.7554/eLife.43653
doi: 10.1111/eva.12444 24. Krysko DV, Ravichandran KS, Vandenabeele P. Macrophages Regulate the
11. Hanahan D, Weinberg RA. Review Hallmarks of Cancer: The Next Clearance of Living Cells by Calreticulin. Nat Commun (2018) 9:1–3.
Generation. Cell (2011) 144:646–74. doi: 10.1016/j.cell.2011.02.013 doi: 10.1038/s41467-018-06807-9
12. Gottschalk RA, Martins AJ, Angermann BR, Dutta B, Ng CE, Uderhardt S, 25. Roh JS, Sohn DH. Damage-Associated Molecular Patterns in Inflammatory
et al. Distinct NF-kb and MAPK Activation Thresholds Uncouple Steady- Diseases. Immune Netw (2018) 18(4):e27. doi: 10.4110/in.2018.18.e27
State Microbe Sensing From Anti-Pathogen Inflammatory Responses. Cell 26. Chao MP, Majeti R, Weissman IL. Programmed Cell Removal: A New
Syst (2016) 2:378–90. doi: 10.1016/J.CELS.2016.04.016 Obstacle in the Road to Developing Cancer. Nat Rev Cancer (2012) 12:58–
13. Mascaux C, Angelova M, Vasaturo A, Beane J, Hijazi K, Anthoine G, et al. 67. doi: 10.1038/nrc3171
Immune Evasion Before Tumour Invasion in Early Lung Squamous 27. Feng M, Chen JY, Weissman-Tsukamoto R, Volkmer J-P, Ho PY, McKenna
Carcinogenesis. Nature (2019) 571:570–5. doi: 10.1038/s41586-019-1330-0 KM, et al. Macrophages Eat Cancer Cells Using Their Own Calreticulin as a
14. Mullins SR, Sameni M, Blum G, Bogyo M, Sloane BF, Moin K. Three- Guide: Roles of TLR and Btk. Proc Natl Acad Sci (2015) 112:2145–50.
Dimensional Cultures Modeling Premalignant Progression of Human doi: 10.1073/pnas.1424907112
Breast Epithelial Cells: Role of Cysteine Cathepsins. Biol Chem (2012) 28. Ravichandran KS. Find-Me and Eat-Me Signals in Apoptotic Cell Clearance:
1:233–45. doi: 10.1016/j.dcn.2011.01.002.The Progress and Conundrums. J Exp Med (2010) 207:1807. doi: 10.1084/
15. Santner SJ, Dawson PJ, Tait L, Soule HD, Eliason J, Mohamed AN, et al. JEM.20101157
Malignant MCF10CA1 Cell Lines Derived From Premalignant Human Breast 29. Aarons CB, Bajenova O, Andrews C, Heydrick S, Bushell KN, Reed KL, et al.
Epithelial MCF10AT Cells. Breast Cancer Res Treat (2001) 65:101–10. Carcinoembryonic Antigen-Stimulated THP-1 Macrophages Activate
doi: 10.1023/A:1006461422273 Endothelial Cells and Increase Cell-Cell Adhesion of Colorectal Cancer
16. Debnath J, Muthuswamy SK, Brugge JS. Morphogenesis and Oncogenesis of Cells. Clin Exp Metastasis (2007) 24:201–9. doi: 10.1007/s10585-007-9069-7
MCF-10A Mammary Epithelial Acini Grown in Three-Dimensional 30. Moraes LA, Ampomah PB, Lim LHK. Annexin A1 in Inflammation and
Basement Membrane Cultures. Methods (2003) 30:256–68. doi: 10.1016/ Breast Cancer: A New Axis in the Tumor Microenvironment. Cell Adh Migr
S1046-2023(03)00032-X (2018) 12:1–7. doi: 10.1080/19336918.2018.1486143
Frontiers in Immunology | www.frontiersin.org 12 October 2021 | Volume 12 | Article 749597Jacqueline et al. Macrophages Sense Early Malignant Transformation
31. Schloer S, Hübel N, Masemann D, Pajonczyk D, Brunotte L, Ehrhardt C, et al. Within the Rapidly Diverging Murine Cea Family. Genomics (2005) 86:566–
The Annexin A1/FPR2 Signaling Axis Expands Alveolar Macrophages, Limits 80. doi: 10.1016/j.ygeno.2005.07.008
Viral Replication, and Attenuates Pathogenesis in the Murine Influenza A 42. Rozhok AI, DeGregori J. The Evolution of Lifespan and Age-Dependent
Virus Infection Model. FASEB J (2019) 33:12188. doi: 10.1096/FJ.201901265R Cancer Risk. Trends Cancer (2016) 2:552–60. doi: 10.1016/j.trecan.2016.
32. Shao Y, Sun X, He Y, Liu C, Liu H. Elevated Levels of Serum Tumor Markers 09.004
CEA and CA15-3 Are Prognostic Parameters for Different Molecular 43. Toomer KH, Chen Z. Autoimmunity as a Double Agent in Tumor Killing and
Subtypes of Breast Cancer. PloS One (2015) 10:e0133830. doi: 10.1371/ Cancer Promotion. Front Immunol (2014) 5:116. doi: 10.3389/fimmu.2014.00116
journal.pone.0133830 44. Thomas F, Nesse RM, Gatenby R, Gidoin C, Renaud F, Roche B, et al.
33. Huang EY, Chang JC, Chen HH, Hsu CY, Hsu HC, Wu KL. Evolutionary Ecology of Organs: A Missing Link in Cancer Development?
Carcinoembryonic Antigen as a Marker of Radioresistance in Colorectal Trends Cancer (2016) 2:409–15. doi: 10.1016/j.trecan.2016.06.009
Cancer: A Potential Role of Macrophages. BMC Cancer (2018) 18(1):321. 45. Zitvogel L, Perreault C, Finn OJ, Kroemer G. Beneficial Autoimmunity
doi: 10.1186/s12885-018-4254-4 Improves Cancer Prognosis. Nat Rev Clin Oncol (2021) 18(9):591–602.
34. Wolf Y, Anderson AC, Kuchroo VK. TIM3 Comes of Age as an Inhibitory doi: 10.1038/s41571-021-00508-x
Receptor. Nat Rev Immunol 2019 203 (2019) 20:173–85. doi: 10.1038/s41577-
019-0224-6 Conflict of Interest: OF is on the External Advisory Boards of GeoVax,
35. Beauchemin N, Arabzadeh A. Carcinoembryonic Antigen-Related Cell Biovelocita, Immodulon, IASO and PDS Biotech.
Adhesion Molecules (CEACAMs) in Cancer Progression and Metastasis.
Cancer Metastasis Rev (2013) 32:643–71. doi: 10.1007/S10555-013-9444-6 The remaining authors declare that the research was conducted in the absence of
36. Barreda DR, Neely HR, Flajnik MF. Evolution of Myeloid Cells. Microbiol any commercial or financial relationships that could be construed as a potential
Spectr (2016) 4(3):10. doi: 10.1128/microbiolspec.mchd-0007-2015 conflict of interest.
37. Coteur G, DeBecker G, Warnau M, Jangoux M, Dubois P. Differentiation of
Immune Cells Challenged by Bacteria in the Common European Starfish, Publisher’s Note: All claims expressed in this article are solely those of the authors
Asterias Rubens (Echinodermata). Eur J Cell Biol (2002) 81:413–8. and do not necessarily represent those of their affiliated organizations, or those of
doi: 10.1078/0171-9335-00254 the publisher, the editors and the reviewers. Any product that may be evaluated in
38. Aktipis CA, Nesse RM. Evolutionary Foundations for Cancer Biology. Evol this article, or claim that may be made by its manufacturer, is not guaranteed or
Appl (2013) 6:144–59. doi: 10.1111/eva.12034 endorsed by the publisher.
39. Gao Y, Horseman ND. Structural and Functional Divergences of the
Columbid Annexin I-Encoding Cp37 and Cp35 Genes. Gene (1994) Copyright © 2021 Jacqueline, Dracz, Boothman, Minden, Gottschalk and Finn. This is
143:179–86. doi: 10.1016/0378-1119(94)90094-9 an open-access article distributed under the terms of the Creative Commons
40. Kovacic RT, Tizard R, Cate RL, Frey AZ, Wallner BP. Correlation of Gene and Attribution License (CC BY). The use, distribution or reproduction in other forums
Protein Structure of Rat and Human Lipocortin I. Biochemistry (1991) is permitted, provided the original author(s) and the copyright owner(s) are credited
30:9015–21. doi: 10.1021/bi00101a015 and that the original publication in this journal is cited, in accordance with accepted
41. Zebhauser R, Kammerer R, Eisenried A, McLellan A, Moore T, Zimmermann academic practice. No use, distribution or reproduction is permitted which does not
W. Identification of a Novel Group of Evolutionarily Conserved Members comply with these terms.
Frontiers in Immunology | www.frontiersin.org 13 October 2021 | Volume 12 | Article 749597You can also read