Flutamide treatment reveals a relationship between steroidogenic activity of Leydig cells and ultrastructure of their mitochondria - Nature
←
→
Page content transcription
If your browser does not render page correctly, please read the page content below
www.nature.com/scientificreports
OPEN Flutamide treatment
reveals a relationship
between steroidogenic activity
of Leydig cells and ultrastructure
of their mitochondria
Malgorzata Brzoskwinia1, Laura Pardyak2, Alicja Kaminska1, Wacław Tworzydlo3,
Anna Hejmej1, Sylwia Marek1, Szczepan M. Bilinski3 & Barbara Bilinska1*
Our present knowledge on interrelation between morphology/ultrastructure of mitochondria of the
Leydig cell and its steroidogenic function is far from satisfactory and needs additional studies. Here,
we analyzed the effects of blockade of androgen receptor, triggered by exposure to flutamide, on
the expression of steroidogenic proteins (1) and ultrastructure of Leydig cells’ constituents (2). We
demonstrated that increase in the expression level of steroidogenic (StAR, CYP11A1, 3β-HSD, and
CYP19A1) proteins (and respective mRNAs) in rat testicular tissue as well as elevation of intratesticular
sex steroid hormone (testosterone and estradiol) levels observed in treated animals correspond well
to morphological alterations of the Leydig cell ultrastructure. Most importantly, up-regulation of
steroidogenic proteins’ expression apparently correlates with considerable multiplication of Leydig
cell mitochondria and subsequent formation of local mitochondrial networks. Interestingly, we
showed also that the above-mentioned processes were associated with elevated transcription of Drp1
and Mfn2 genes, encoding proteins implicated in mitochondrial dynamics. Collectively, our studies
emphasize the importance of mitochondrial homeostasis to the steroidogenic function of Leydig cells.
Leydig cells represent main cellular constituent of the interstitial compartment of the testis and the major site of
the testosterone synthesis. The cytoplasm of Leydig cells (for characteristic features of steroid-producing cells
see1) contains an abundant smooth endoplasmic reticulum (SER), mitochondria (homogeneously distributed
throughout the cytoplasm), and lipid droplets where cholesterol esters are converted to free cholesterol. The
enzymes involved in the conversion of cholesterol to testosterone are located in either the mitochondria or the
SER2–5.
In adult males, the maintenance of testosterone secretion is controlled by the hypothalamic–pituitary–gonadal
axis (HPG) and modulated by para- and autocrine factors (for further details s ee3,6–8). Several lines of evidence
clearly indicated that for testosterone synthesis Leydig cell mitochondria should be fully functional (see below).
For instance, in a series of inquisitive experiments on MA-10 Leydig tumor cells treated with mitochondrial
disruptors Allen et al.9 demonstrated that maintenance of mitochondrial membrane potential, mitochondrial
ATP synthesis, and mitochondrial pH are crucial for acute cAMP-stimulated steroid biosynthesis. Moreover,
in vitro experiments on Leydig cells isolated from Brown Norway rats and incubated with mitochondrial toxin
myxothiazol (a blocker of electron-transport chain) evidenced an important role of mitochondria in basal and
luteinizing hormone (LH)-stimulated testosterone p roduction10.
Mitochondria contain their own genome (mitochondrial DNA, mtDNA) and protein synthesis machinery.
They are therefore regarded as semi-autonomous organelles. Mitochondria supply cells with energy (in the
form of ATP), regulate calcium signaling, and contribute to reactive oxygen species (ROS) p roduction11,12. The
latter process leads to a loss of metabolic functions, decline in mitochondrial membrane potential and, most
1
Department of Endocrinology, Faculty of Biology, Institute of Zoology and Biomedical Research, Jagiellonian
University in Krakow, 30‑387 Kraków, Poland. 2Center of Experimental and Innovative Medicine, University
of Agriculture in Krakow, 30‑248 Kraków, Poland. 3Department of Developmental Biology and Invertebrate
Morphology, Faculty of Biology, Institute of Zoology and Biomedical Research, Jagiellonian University in Krakow,
30‑387 Kraków, Poland. *email: barbara.bilinska@uj.edu.pl
Scientific Reports | (2021) 11:13772 | https://doi.org/10.1038/s41598-021-93292-8 1
Vol.:(0123456789)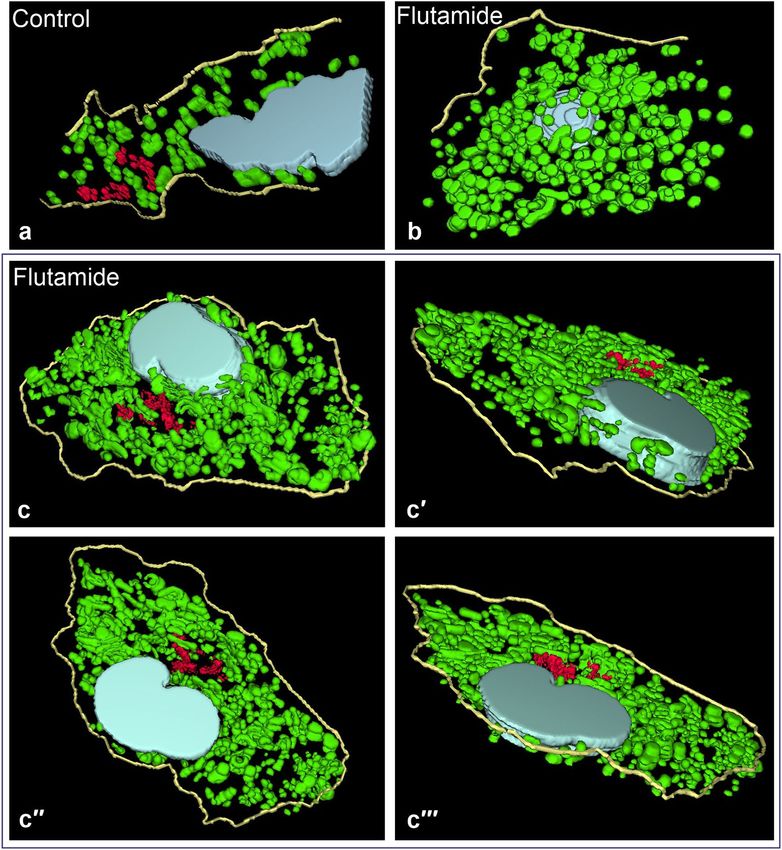
www.nature.com/scientificreports/
importantly, to gradual accumulation of mtDNA mutations. In somatic cells, the effects caused by ROS are pre-
vented by the mechanism termed “mitochondrial homeostasis” or “mitochondrial dynamics”. It includes two
opposing processes: mitochondrial fusion and mitochondrial fission (division). Disruption of mitochondrial
fission leads to the formation of extensive mitochondrial networks, whereas lowering of mitochondrial fusion
results in maintaining mitochondria in the form of small individual organelles13–16. Consequently, the actual
morphology of mitochondria in a given cell is related to a balance between above mentioned processes. The
fusion and fission are mediated by multi-domain GTPases belonging to the superfamily of dynamins ( see17 for
a review). Mitochondrial fusion requires such proteins as mitofusins, Mfn1, Mfn2 and Optic atrophy 1 (Opa1),
whereas fission involves a highly conserved dynamin-related protein 1 (Drp1)18,19. It is well established that
Drp1 exhibits an ability to self-assemble into helical structures encompassing the constriction sites of dividing
mitochondria that leads to coordinate scission of mitochondrial m embranes15,17.
It has been established that androgens, essential for normal Leydig cell development and function, mediate
their biological effects through binding to the intracellular androgen receptors (ARs). For instance, in the tes-
ticular-feminized (Tfm) mice lacking the AR, Leydig cell number and testicular androgen synthesis are markedly
reduced as a consequence of the impairment of the expression of genes required for normal steroidogenic func-
tion of Leydig cells20,21. Similarly, de Gendt et al.22 demonstrated that in mice with total AR knockout a reduction
of Leydig cell numbers was higher than in mice with Sertoli cell-specific knockout of the AR gene (SCARKO)
what evidences the significance of AR-signaling in Leydig cells per se. It should be pointed out, however, that
in SCARKO mice Leydig cells were larger, displayed increased volume of mitochondria and lipid droplets and
expressed higher levels of the proteins and transcripts crucial for the formation of steroidogenic enzymes.
Flutamide is the pure non-steroidal AR antagonist that blocks receptor binding of androgen, blocks nuclear
retention of the AR complex and slows down its transcriptional activity, disturbing the action of endogenous
testosterone23–25. Flutamide belongs to a group of anti-androgens with many applications, from basic science
to clinics; it is specifically used in the endocrine therapies and androgen-dependent diseases such as prostate
cancer and scalp hair loss in men or hirsutism in women (for review see26,27). It has been repeatedly shown that
compounds with anti-androgenic activity (including flutamide) have the potential to adversely affect human
and animal reproduction leading to several disorders of male reproductive system in a dulthood28–30. Substan-
tial increases in plasma LH and testosterone concentrations shortly after acute treatment with flutamide were
reported in studies on male rats and hamsters31,32. Several further experiments showed that anti-androgens (and
specifically flutamide) disturbing ability of testosterone receptor binding, lead not only to weakening of the
negative feedback of testosterone on the HPG axis but also induce impairment of cellular processes controlling
spermatogenesis and steroidogenesis in testes, both of humans and animals33,34 (for review see35). On the other
hand, information on a relationship between Leydig cell steroidogenic function and mitochondrial activity at
the electron microscopic (EM) level is still limited. In a series of experiments we have demonstrated that AR
blockage initiated by neonatal flutamide exposure affects testis morphology, alters the expression of intercellular
junction proteins at the blood-testis barrier, and leads to androgen–estrogen imbalance in adult boar t estes36–38.
In subsequent publications we showed that flutamide treatment leads to alterations of the intercellular junc-
tion ultrastructure and enlargement of the interstitial tissue of adult rat testis39,40. A rationale for performing
experiments reported herein comes from our latest study using the same animal model demonstrating altered
functioning of adipokines (1), increase in cholesterol availability in Leydig cells (2), sixfold increase in plasma
testosterone concentration (3) and up-regulation of the translocator protein (TSPO) gene expression level in
testes as a result of short-term flutamide e xposure41.
Based on the aforementioned data, we previously h ypothesized41 that flutamide administration (and subse-
quent blockade of the AR) leads to elevated steroidogenic activity of Leydig cells. In this context, we set out to
detect the gene expression levels of proteins required for the first two steps of testosterone synthesis pathway:
steroidogenic acute regulatory protein (StAR), involved in transferring cholesterol from the outer mitochondrial
membrane to the inner mitochondrial membrane (1), cytochrome P450 cholesterol side-chain cleavage enzyme
(CYP11A1) residing on the matrix side of the inner mitochondrial membranes and converting cholesterol to
pregnenolone (2), and 3β-hydroxysteroid dehydrogenase (3β-HSD), acting within or outside the mitochondria
and involved in sequential conversions of pregnenolone to testosterone (3). Effects of short-term androgen signal-
ing disruption caused by flutamide on (1) intratesticular steroid hormone levels (testosterone and estradiol), (2)
the expression of cytochrome P450 aromatase (CYP19A1), acting in the SER and ensuring testosterone conver-
sion to estradiol, and (3) plasma LH content, were also determined. Furthermore, we would like to stress that
we performed all above listed analyses for better understanding of alterations in the production of sex hormones
observed after flutamide treatment.
To get further insight into the functioning of Leydig cells after flutamide treatment, we investigated the
ultrastructure of Leydig cells in untreated (control) and treated rats. As the information that can be extracted
from single, often incidental and taken at different angles sections, is not sufficient for the accurate visualiza-
tion of spatial relationships of the cell constituents, we performed a computer aided 3D reconstruction of serial
ultrathin sections of Leydig cells in treated versus untreated rats. These analyses showed that ultrastructure of
Leydig cells in treated animals is substantially altered and that observed alterations correspond well to the results
of biochemical and molecular tests. This, in turn, confirms the idea that impaired androgen signaling caused by
flutamide administration results in activation of the LH axis, enhanced Leydig cell stimulation and consequent
rise of their steroidogenic activity.
Scientific Reports | (2021) 11:13772 | https://doi.org/10.1038/s41598-021-93292-8 2
Vol:.(1234567890)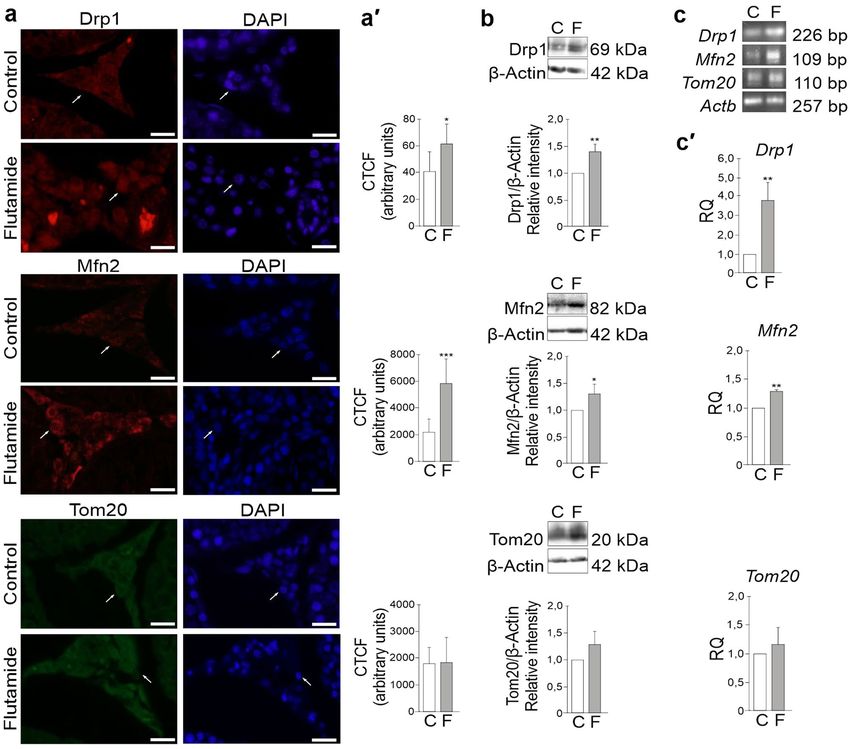
www.nature.com/scientificreports/
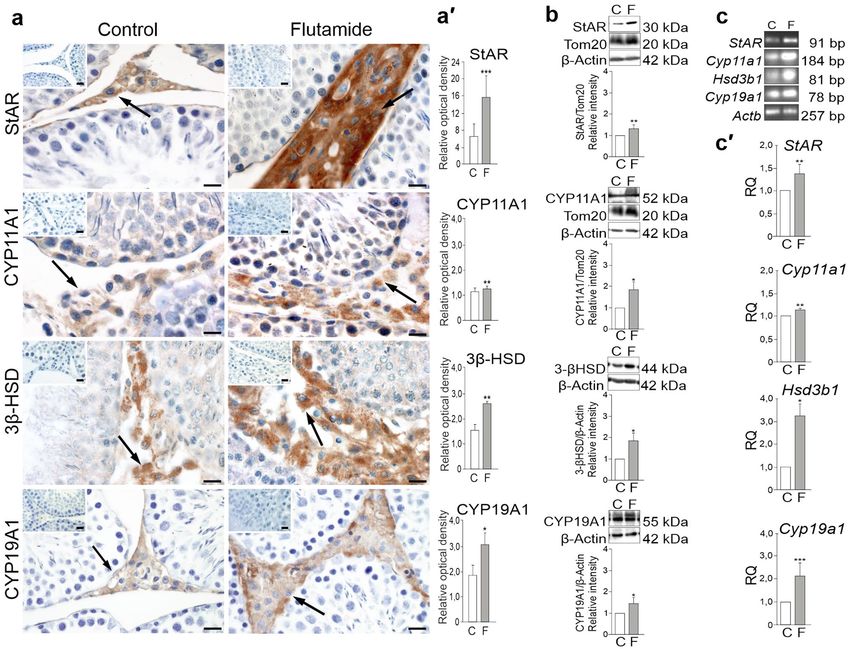
Figure 1. Immunohistochemical localization of StAR, CYP11A1, 3β-HSD, and CYP19A1 (a) and quantitative
image analyses displayed as relative optical density (a′), protein (b) and mRNA (c,c′) expression levels in testes
of control and flutamide-treated rats. Counterstaining with Mayer’s haematoxylin. Bars represent 20 μm. (a).
Representative microphotographs show the positive signal of StAR, CYP11A1, 3β-HSD, and CYP19A1 proteins
as localized to Leydig cells (arrows). Note higher intensity of the staining for StAR, CYP11A1, 3β-HSD, and
CYP19A1 in Leydig cells of flutamide-treated rats compared to respective controls (a,a′). No immunopositive
staining for StAR, CYP11A1, 3β-HSD, and CYP19A1 proteins are observed when the primary antibodies were
omitted (top view inserts in a). (b) Representative western blots and the relative levels of StAR, CYP11A1,
3β-HSD, and CYP19A1 proteins normalized to β-Actin, which served as an internal protein loading control.
The relative levels of StAR and CYP11A1 were normalized to a mitochondrial protein, Tom20, which served
as an additional control protein. Protein levels within control testes were given a value of 1. Displayed are the
cropped blots and original blots are provided in Supplementary Fig. S6. (c,c′) Representative RT-PCR and
qRT-PCR analyses of StAR, Cyp11a1, Hsd3b1, and Cyp19a1 mRNA expression levels, respectively. Relative
quantification (RQ) is expressed as mean ± SD. Statistically significant differences from control values are
denoted as *P < 0.05; **P < 0.01; ***P < 0.001). Control (n = 6) and flutamide-treated (n = 6) animals.
Results
Flutamide‑induced alterations in steroidogenic proteins’ gene expression levels. Effects of
flutamide on gene expression levels in rat testis were determined using immunohistochemistry, western blot-
ting, and real-time RT-PCR (Fig. 1a–c′). Positive immunostainings for StAR, CYP11A1, 3β-HSD, and CYP19A1
were confined to Leydig cells of both control and flutamide-treated rats. Following flutamide treatment, how-
ever, all the stainings were of higher intensity than those of the respective controls (Fig. 1a). The most appar-
ent increase in the staining intensity was observed for StAR protein, what was confirmed by quantitative den-
sitometric image analysis (P < 0.001) (Fig. 1a′). Also, qualitative results of CYP11A1, 3β-HSD, and CYP19A1
(Fig. 1a) were confirmed by quantitative analyses (P < 0.05; P < 0.01) (Fig. 1a′). β-Actin, used as an unrelated
control protein, showed unchanged immunoreactivity in flutamide-treated versus control tissues (Supplemen-
tary Figure S5). Following western blot analysis, the proteins were observed as single bands near 30 kDa (StAR),
52 kDa (CYP11A1), 44 kDa (3β-HSD), 55 kDa (CYP19A1), 42 kDa (β-Actin), and 20 kDa (Tom20). Significant
increases in the levels of StAR, CYP11A1, 3β-HSD, and CYP19A1 proteins were found in testes of flutamide-
Scientific Reports | (2021) 11:13772 | https://doi.org/10.1038/s41598-021-93292-8 3
Vol.:(0123456789)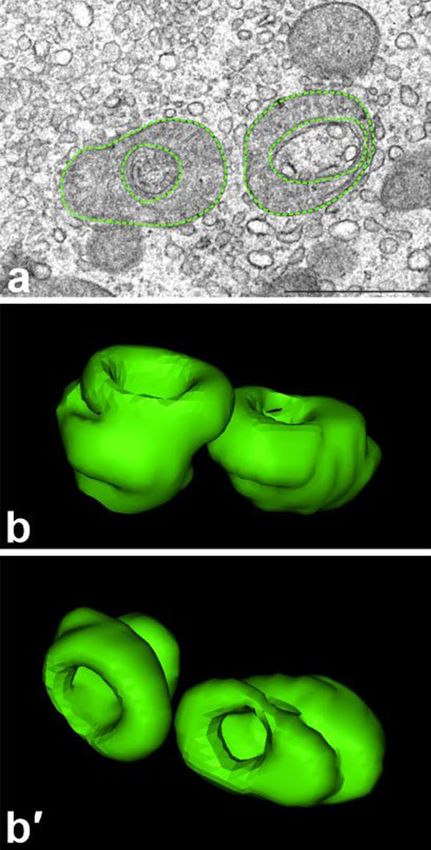
www.nature.com/scientificreports/

                                            Figure 2.  Ultrastructure of Leydig cells from control animals. (a,b) Random sections through the central
                                            (containing nucleus) cell region. Note relatively small, predominantly spherical mitochondria (m), SER elements
                                            (ser), Golgi complexes (Gc) and cell nucleus (n). Thick white arrows indicate infoldings of the nuclear envelope.
                                            (c) Gap junction (gj) between two adjacent Leydig cells. Bars represent 1 µm.

                                            treated rats (P < 0.05; P < 0.01) compared to those of controls (Fig. 1b). Of note, the expression of Tom20 (a
                                            protein of the outer mitochondrial membrane) evaluated in parallel served as an additional control for the nor-
                                            malization of signals of mitochondrial proteins StAR and CYP11A1. Electrophoresis revealed that PCR products
                                            matched with the expected sizes of 91, 184, 81, 78 bp, and 257 bp for StAR, Cyp11a1, Hsd3b1, Cyp19a1, and
                                            Actb, respectively (Fig. 1c). Up-regulation of StAR, Cyp11a1, Hsd3b1, Cyp19a1 mRNAs were detected in testes
                                            of flutamide-treated rats (P < 0.05; P < 0.01; P < 0.001) compared to those of controls (Fig. 1c′).
                                                Alterations in StAR, Cyp11a1, Hsd3b1, and Cyp19a1 gene expression levels suggest that the exposure to
                                            flutamide may increase Leydig cell steroidogenic activity.

                                            Flutamide‑induced alterations in plasma LH concentration and testosterone and estradiol lev-
                                            els in testicular homogenates. Effects of flutamide on LH and steroid hormone levels were determined
                                            using ELISA assays (see Supplementary Table S1). LH concentration in blood plasma increased significantly
                                            (P < 0.01) in flutamide-treated (33.760 ± 2.514 mIU/mL) relative to control-treated samples (24.380 ± 4.048 mIU/
                                            mL). Intratesticular testosterone (51.170 ± 2.423 ng/mL) and estradiol (45.927 ± 9.935 pg/mL) levels also sig-
                                            nificantly increased (P < 0.01 and P < 0.05, respectively) following flutamide exposure compared to the control
                                            values (32.040 ± 3.722 ng/mL and 24.380 ± 3.966 pg/mL), respectively.
                                                Elevated plasma LH content may indicate the presence of flutamide-induced effects within the HPG axis. This
                                            may lead to enhanced capacity of Leydig cells to produce and metabolize testosterone, manifested by increase in
                                            the intratesticular levels of testosterone and estradiol.

                                            Flutamide‑induced alterations in morphology and ultrastructure of Leydig cells.                    Morphology
                                            and ultrastructure of Leydig cells from control and flutamide-treated rats (experimental animals) were analyzed
                                            at the level of light (Supplementary Figure S1) and electron microscopy (TEM) (Figs. 2, 3, Supplementary Fig-
                                            ure S2–S4).

                                            Control rats. Leydig cells in testes of control rats displayed typical morphology (Supplementary Figure S1).
                                            Therefore, the following description is presented only for comparison with the next section. As a rule, Leydig
                                            cells from control rats were slightly elongated or spindle-shaped. Their nuclei were more or less centrally placed
                                            and surrounded with slightly undulating nuclear envelope (Fig. 2, Supplementary Figure S2), however, deep

          Scientific Reports |   (2021) 11:13772 |               https://doi.org/10.1038/s41598-021-93292-8                                                 4

Vol:.(1234567890)
www.nature.com/scientificreports/
Figure 3. Ultrastructure of Leydig cells from experimental animals. (a) Section through a central region of
highly altered cell. (b) Section through slightly altered cell; note the cytoplasm region overloaded with SER
elements. (c) Higher magnification of a perinuclear cytoplasm of highly active cell; note morphologically
modified mitochondria. Mitochondria (m), SER elements (ser), cell nucleus (n), arrows indicate highly
elongated mitochondria, arrowheads—u shaped and “circular” ones. Bars represent 1 µm.
and regular infoldings of the envelope were frequently found (Fig. 2a,b; white thick arrows). The cytoplasm
comprised typical organelles: Golgi complexes (predominantly in the neighborhood of the nucleus), vesicles and
short cisternae of SER as well as mitochondria (Fig. 2a,b, Supplementary Figure S2). The latter were more or less
evenly distributed. Mitochondria had regular shapes; spherical and ovoid forms were apparently predominant,
whereas elongated and/or bifurcated ones were seldom. Large, slightly bent gap junctions were often encoun-
tered between adjacent Leydig cells (Fig. 2c, gj).
Experimental animals. In treated males, the Leydig cells were larger than in the control ones (Supplementary
Figure S1, yellow asterisks) as confirmed by morphometric analysis (see the next section). The morphology and
ultrastructure of Leydig cells in treated males was also apparently altered, however, the degree of morphological
changes observed in individual cells varied substantially. These variances were especially evident in the distri-
bution and morphology of mitochondria (see the next section). In some cells, mitochondria were structurally
similar to those of control animals (Fig. 3b, Supplementary Figure S3, S4). These cells were classified as “slightly
altered”. In others, the mitochondria were not only much more numerous and tightly clustered, but exhibited
several morphological modifications (Fig. 3a,c, Supplementary Figure S3, S4). In such cells, classified as “highly
altered”, elongated, u-shaped, swollen and even “circular” (see the next section) mitochondria were often found
(Fig. 3, arrows and arrowheads, Supplementary Figure S4). In addition to changes in mitochondrial morphology,
we noticed also alterations in the organization of the SER. Namely, in Leydig cells from experimental animals
SER elements (vesicles) were not as expanded as those of control animals (compare Figs. 2, 3, Supplementary
Figure S2–S4). Additionally, in some highly altered Leydig cells “segregation” of cellular organelles was evident;
in such cells certain regions (predominantly peripheral) of cytoplasm overloaded solely with SER elements were
clearly separated from regions comprising mitochondria associated with SER (Fig. 3a, Supplementary Figure S4).
In addition to the described alterations in the morphology of cytoplasmic constituents of the Leydig cells, we
noticed also modifications in the organization of intercellular junction present between apposed cells. Namely,
the number of gap junctions encountered between Leydig cells and/or their projections was higher in treated
Scientific Reports | (2021) 11:13772 | https://doi.org/10.1038/s41598-021-93292-8 5
Vol.:(0123456789)www.nature.com/scientificreports/
Analyzed parameters Control cells Slightly altered cells Highly altered cells
Mean mitochondria perimeter (μm) 1.407 ± 0.530 1.866 ± 0.086 *** 2.009 ± 0.099***/a
Percentage of cytoplasmic area occupied by mitochondria (%) 5.256 ± 1.784 16.783 ± 2.507*** 17.499 ± 1.871***
Percentage of morphologically modified mitochondria (%) 2.750 ± 0.898 6.857 ± 2.752*** 15.291 ± 2.223***/b
Mean diameter of SER vesicles (μm) 0.286 ± 0.072 0.213 ± 0.043* 0.151 ± 0.025***/b
Table 1. Morphometric analysis of selected parameters of Leydig cells from control and flutamide-treated
animals. Data are expressed as means ± SD (n = 6 animals/each group). *P < 0.05 versus control cells;
***P < 0.001 versus control cells; aP < 0.05 versus slightly altered cells; bP < 0.01 versus slightly altered cells.
animals than in the control ones (Fig. 3b, gj). Moreover, careful analysis of appropriately oriented sections clearly
indicated that individual gap junctions are not only more numerous but also larger, more extensive (compare
Figs. 2, 3gj).
Morphometric analyses. Morphometric analysis of Leydig cells from experimental versus control animals
was performed on the semithin micrographs. The analysis revealed significantly higher (P < 0.001) mean area
of Leydig cells (40.628 ± 12.616 μm2 vs. 22.260 ± 6.504 μm2). Accordingly, the mean number of Leydig cells
per 1000 μm2 of the interstitial tissue was significantly reduced (P < 0.001) in testes of experimental animals
(12.972 ± 2.662) compared to the control (22.775 ± 5.405).
Results of morphometric analyses of selected parameters of Leydig cells from control and flutamide treated
rats are presented in Table 1. All the measurements were taken on the EM micrographs selected at random. In
accordance with above cytological description:
• the percentage of the cell area occupied by mitochondria, mean mitochondria perimeter, and the percentage
of morphologically modified mitochondria were significantly higher in Leydig cells (both slightly and highly
altered) from rat testes exposed to flutamide (P < 0.001) than from those of controls;
• mean mitochondria perimeter, and the percentage of modified mitochondria were significantly higher in
highly altered Leydig cells (P < 0.05 and P < 0.01 respectively) than in slightly altered ones.
• mean diameter of SER vesicles was significantly lower in slightly altered and highly altered cells (P < 0.05 and
P < 0.001 respectively) than in control cells;
• mean diameter of SER vesicles was significantly lower in highly altered cells (P < 0.01) than in slightly altered
ones.
Computer aided reconstruction of Leydig cell morphology. For exact visualization of mutual relationships
between cell organelles at the EM level, we performed a computer aided 3D reconstruction of serial ultrathin
sections. Between 9 and 15 ultrathin sections were used in our reconstructions. Analysis of the obtained 3D
images (Fig. 4; sample animated reconstructions are presented in Supplementary Videos S1–S4) have confirmed
that morphology of Leydig cell from treated animals is distinctly altered and that degree of observed morpho-
logical changes varies in individual cells (compare Fig. 4b,c-c‴). In some Leydig cells (termed above “slightly
altered”) mitochondria, even though more numerous than in Leydig cells of control animals, were relatively
small and more or less spherical (compare Fig. 4a,b). In other cells (termed “highly altered”) mitochondria are
not only more numerous but also interconnected forming local networks (Fig. 4c-c‴). Careful analysis of 3D
reconstructions of highly altered cells showed additionally that “circular mitochondria” often observed dur-
ing conventional EM analysis, represent in fact cross sections of specific cup- or goblet-shaped mitochondria
(Fig. 5). At the present stage of analysis, we do not know whether such shape of mitochondria is related to a
specific physiological state or not.
Flutamide‑induced alterations in Drp1 and Mfn2 gene expression. As in Leydig cells from treated
animals, the mitochondria are not only more numerous (as compared to the Leydig cells from control rats)
but also fuse and form extensive networks, we decided to test whether these morphological alterations involve
mitochondrial fission/multiplication and fusion—key processes participating in mitochondrial homeostasis (see
“Introduction” section). Therefore, we stained paraplast sections with antibodies against two proteins mediat-
ing mentioned processes in vertebrates: dynamin-related protein 1 (Drp1), a major regulator of mitochondrial
fission39,40, and mitofusin, Mfn2 participating in mitochondrial fusion53. Immunofluorescence analysis revealed
positive signals for both proteins (Drp1 and Mfn2) throughout the interstitial area of control and flutamide-
treated rats (Fig. 6a). The signals were localized to Leydig cells and its intensity increased following flutamide
exposure compared to the control (P < 0.05 and P < 0.001, respectively) as confirmed by quantitative image
analysis (Fig. 6a′). In accordance to the results of immunofluorescence analyses, significant increases in levels
of Drp1 and Mfn2 proteins (P < 0.01; P < 0.05) (Fig. 6b) and up-regulation of Drp1 and Mfn2 mRNAs (P < 0.01;
P < 0.01) were detected in testes of flutamide-treated rats compared to those of controls (Fig. 6c′). No changes in
immunofluorescence and a minor, not statistically significant increase in Tom20 protein and mRNA levels were
noticed following flutamide compared to the controls (Fig. 6a,a′,b,c,c′). Proteins (detected by western blot) were
Scientific Reports | (2021) 11:13772 | https://doi.org/10.1038/s41598-021-93292-8 6
Vol:.(1234567890)www.nature.com/scientificreports/
Figure 4. Computer aided 3D reconstructions of Leydig cells. (a) A sample 3D reconstruction of a “control”
Leydig cell. (b,c) Sample 3D reconstructions of Leydig cells treated with flutamide. (b) A slightly altered cell.
(c-c‴) A highly altered cell as seen from 4 different angles. Note mitochondria/mitochondrial networks (green),
Golgi complexes (red), cell nuclei (light blue) and the cell outline (yellow). Three-dimensional reconstructions
images were performed with the ImageJ Software (version 1.51 h), https://imagej.nih.gov/ij/.
observed as single bands near 69 kDa (Drp1), 82 kDa (Mfn2), 20 kDa (Tom20) and 42 kDa (β-Actin) (Fig. 6b),
while electrophoresis revealed PCR-amplified products of the predicted sizes; 226 bp for Drp1, 109 bp for Mfn2,
110 bp for Tom20, and 257 bp for Actb (Fig. 6c).
Our findings suggest that multiplication of mitochondria and consecutive formation of extensive mitochon-
drial networks observed in Leydig cells after flutamide treatment, being an obvious result of enhanced biogenesis
of these organelles might involve also proteins regulating mitochondrial dynamics, e. g. Drp1 and Mfn2.
Discussion
Although biosynthesis of testosterone in Leydig cells and the regulation of this process are well established and
have been discussed in several r eviews4,5,42,43, the relationship between the disruption of androgen signaling
(caused by exposure to flutamide) and consequent enhancement of the expression of proteins involved in steroid
hormone conversions on one hand, and the ultrastructure of Leydig cell constituents, including mitochondria,
on the other, is not fully understood.
Scientific Reports | (2021) 11:13772 | https://doi.org/10.1038/s41598-021-93292-8 7
Vol.:(0123456789)www.nature.com/scientificreports/
Figure 5. Goblet-shaped mitochondria. (a) Transverse section through two “circular” mitochondria; their
outlines (external and internal) are marked with green dots. Bar represents 2 µm. (b,b′) 3D reconstruction of the
same mitochondria as seen from two different angles; “circular” organelles shown in (a) appeared to represent
cross sections of goblet-shaped mitochondria. Three-dimensional reconstructions images were performed with
the ImageJ Software (version 1.51 h), https://imagej.nih.gov/ij/.
In the present paper we demonstrated that immunoexpression of three crucial steroidogenic proteins, namely
the StAR, CYP11A1 and 3β-HSD was restricted to Leydig cells, in control as well treated (with flutamide) rats.
We showed also that in our model the staining intensity of all the three proteins was quantitatively higher in
treated versus control animals. These results are in line with our biochemical and molecular analyses showing
increased level of the StAR, CYP11A1 and 3β-HSD as well as distinct up-regulation of their mRNAs in testicu-
lar homogenates of flutamide-treated rats as compared to controls. Notably, flutamide-induced changes in the
steroidogenic activity correspond well with elevated intratesticular testosterone and estradiol concentrations
(compare Fig. 1 and Supplementary Table S1). Similar results have previously been reported by Ohsako et al.33
and Sarrabay et al.34. In the first paper elevated levels of testosterone and steroidogenic enzymes in rat testes
exposed to flutamide at a dose 25 mg/kg bw/day for 6 days were reported; in the second up-regulation of the
expression of steroidogenic enzymes in testicular tissue as well as increase of plasma testosterone concentration
after administration of flutamide (1–10 mg/kg bw/day) during 28 days were documented. As in our study short
(seven day) exposure to higher concentration of flutamide (50 mg/kg bw/day) also induced distinct changes in
the steroidogenic proteins’ expression and the hormone levels, it seems likely that shorter time of exposure to
flutamide can be compensated by its higher dose. Indeed, in our latest report using the same dose and duration of
flutamide exposure as reported in the present study, a significant increase in plasma testosterone content in adult
rats was demonstrated41. All above results together with elevated plasma LH concentration (documented in the
present study) support earlier findings showing that flutamide leads to the inhibition of the negative feedback of
androgens in the HPG axis (by preventing androgen binding to the AR at the level of h ypothalamus44–46 and to
the enhancement of Leydig cell steroidogenic activity (e.g.34). Notably, besides regulating HPG axis, androgens
are involved also in autocrine control of Leydig cell steroidogenic enzymes47. This notion is in line with in vitro
studies showing that flutamide acting directly on Leydig cells, affects the expression of steroidogenic p roteins48.
As we found that the level of intratesticular estradiol was substantially elevated in treated rats versus controls,
we have decided to examine the expression of aromatase (CYP19A1), that converts testosterone to estradiol. As
expected, increased mRNA and protein expression levels of CYP19A1 were detected in testes of experimental
animals, indicating enhanced testosterone metabolism after flutamide exposure. In contrast, Ohsako and co-
workers33, using different methodology of gene expression analysis, did not reveal any changes in aromatase
expression upon flutamide treatment. In earlier study, however, Reznikov et al.49 reported alteration of testicular
metabolism of testosterone in guinea pigs treated with an anti-androgen, 4-nitro-3-trifluoromethylisobutyran-
ilide (NFBA).
In addition to flutamide-induced changes in levels of steroidogenic proteins, their mRNAs and hormones
(testosterone, estradiol), we showed also that the testicular interstitial area after flutamide treatment is apparently
Scientific Reports | (2021) 11:13772 | https://doi.org/10.1038/s41598-021-93292-8 8
Vol:.(1234567890)www.nature.com/scientificreports/
Figure 6. Immunofluorescence localization of Drp1, Mfn2, and Tom20 (control protein) (a), quantitative
image analysis displayed in corrected total cell fluorescence (CTCF) (a′), Drp1, Mfn2, and Tom20 protein levels
(b) and Drp1, Mfn2, and Tom20 mRNA (c,c′) expression levels in testes of control and flutamide-treated rats.
Bars represent 20 μm. (a) Representative microphotographs show positive signals for Drp1 and Mfn2 (red)
and for Tom20 (green) localized to Leydig cells (arrows). Cell nuclei were stained with DAPI (blue) (arrows).
Note higher signal intensity of Drp1 and Mfn2 but not of Tom20 in Leydig cells of flutamide-treated rats
compared to controls (a′). (b) Representative western blots and the relative levels of Drp1, Mfn2, and Tom20
proteins normalized to β-Actin, which served as an internal protein loading control. Drp1, Mfn2, and Tom20
protein levels within control testes were given a value of 1. Displayed are the cropped blots and original blots are
provided in Supplementary Fig. S6. (c,c′) Representative RT-PCR and qRT-PCR analyses of Drp1, Mfn2, and
Tom20 expression levels, respectively. Relative quantification (RQ) is expressed as mean ± SD. Note significant
increase in Drp1 and Mfn2 protein and mRNA levels and slight (not statistically significant) increase in Tom20
protein and mRNA levels in testes homogenates of treated rats compared to controls. Statistically significant
differences from control values are denoted as *P < 0.05; **P < 0.01. Control (n = 6) and flutamide-treated (n = 6)
animals.
enlarged (for comparison, see flutamide vs. control images in Fig. 1a) and contains hypertrophic Leydig cells.
ublications49,50 reporting enlarged Leydig cells of guinea pigs fol-
This observation is in line with the earlier p
lowing NFBA or flutamide administration. It is worth adding here that similar effect of flutamide exposure was
noticed in rats—more than 40 years a go51. Moreover, an apparent enlargement of the interstitial area containing
hypertrophic Leydig cells was also observed in testes of mature boar injected with flutamide n eonatally36 and in
transgenic mice overexpressing aromatase ( AROM+)52. It is to the point to add here that O’Hara and c oworkers47
demonstrated in a series of experiments that selective ablation of AR in adult Leydig cells leads to hypertrophy
of Leydig cells and increase in estrogen signaling. Interestingly, the same study revealed no changes in aromatase
expression, consequently suggesting that the expression of this enzyme is not controlled by Leydig cell AR. In
Scientific Reports | (2021) 11:13772 | https://doi.org/10.1038/s41598-021-93292-8 9
Vol.:(0123456789)www.nature.com/scientificreports/
the light of this results, up-regulation of aromatase in our model seems to result from increased stimulation of
Leydig cells with LH, rather than from direct blockade of Leydig cell AR by flutamide. Similar stimulatory effect
of LH on aromatase expression in Leydig cells was also documented by several earlier s tudies53–55. It is tempting
to speculate, in the context of above data that enlargement of the testicular interstitium and Leydig cell hyper-
trophy as observed in this study after flutamide treatment is associated with enhanced expression of aromatase
(CYP19A1) and consequent elevated estradiol level in testes.
As increased expression of steroidogenic proteins and a higher concentration of testosterone in testes of
experimental animals might involve higher activity of Leydig cell mitochondria, we have decided to compare
morphology and ultrastructure of Leydig cells in control versus experimental animals. The EM analysis, showed
that the Leydig cell mitochondria in treated rats were more numerous (1), morphologically modified (2) and
often tightly clustered (3). As the degree of above morphological alterations observed in individual cells varied
substantially, we classified cell from treated animals into two categories termed “slightly” and “highly” altered.
Performed 3D reconstructions of serial ultrathin sections revealed that after flutamide treatment mitochondria
are not only more numerous but fuse forming local mitochondrial networks (see Supplementary Videos S1–S4).
This effect was especially evident in highly altered Leydig cells (see Fig. 4c-c‴ and Supplementary Videos S3, S4).
The comparison of above morphological data on one side and the results of morphometric analyses (see Table 1)
on the other, leads to the conclusion that the total volume of the Leydig cell mitochondria in treated animals
apparently increases, presumably due to enhanced biogenesis of these organelles. The same data indicate addi-
tionally that the slightly altered and highly altered Leydig cells do not significantly differ in the number/ volume
of their mitochondria. The differences between these two types of cells include degree of fusion of individual
mitochondria into a network/s and percentage of morphologically modified mitochondria. Both parameters are
apparently lower in slightly altered Leydig cells. It should be stressed here that mitochondrial networks, as a rule
consist of mitochondria with higher membrane potential, and therefore highly active (see14–16 for further details).
In the light of this, we postulate that enhanced steroidogenic activity of Leydig cells from experimental animals
is correlated with multiplication of Leydig cell mitochondria and subsequent fusion of individual mitochondria,
i.e. formation of active mitochondrial networks. This idea is in line with previous results of the Hales group
showing a relationship between Leydig cell steroidogenesis and mitochondrial functionality in MA-10 Leydig
tumor cell l ine9,11. On this ground, Hales and coworkers postulated that to support Leydig cell steroidogenesis,
mitochondria should be ”energized, polarized, and actively respiring”. Furthermore, enlarged mitochondria
were also observed in Leydig cells of A ROM+ mice showing elevated estradiol c oncentration56. Interestingly, in
Leydig cells of adult guinea pig after flutamide treatment, in addition to enlarged volume occupied by organelles
required for testosterone biosynthesis (mitochondria, SER), characteristic accumulations of dense osmophilic
structures were observed50. Morphologically similar electron-dense structures were described in Leydig cells of
men treated for more than four years with anti-androgen, bicalutamide57. In our EM sections such dense struc-
tures were never observed. We believe that this “absence” might be related to different composition of fixatives
used during our EM procedure.
Finally, we tested whether multiplication of mitochondria and formation of mitochondrial networks observed
in Leydig cells after flutamide treatment involve proteins mediating mitochondrial dynamics. Our tests clearly
showed that both protein and mRNA levels of two key regulators of mitochondrial dynamics, namely Drp1 and
Mfn2 are significantly increased in Leydig cells of experimental animals as compared to the control ones. It is
tempting to speculate, in the light of these results that downstream effects of flutamide treatment, in addition to
all other mentioned above effects, comprise also up-regulation of Drp1 and Mfn2 transcription.
It should be underlined that results of discussed above EM analyses are obviously consistent with our immu-
nohistochemical, biochemical and molecular approaches. The increased levels of the steroidogenic proteins,
up-regulation of their mRNAs and quantitatively higher immunoreactivity (especially the StAR protein, residing
in the outer mitochondrial membrane and ensuring cholesterol transfer to the inner mitochondrial membrane),
correspond well to higher number of mitochondria, their multiplication and formation of fused, highly active
mitochondrial networks. This notion lends an additional support from (1) recent studies reporting that the
mitochondrial fusion is required for the correct localization of the StAR protein and expression of its mRNA in
MA-10 tumor Leydig cells after hormonal stimulation58,59 as well as (2) experimental studies showing importance
of highly active (“energized”) mitochondria for proper functioning of Leydig cells in mice60.
In addition to the discussed above alterations in the ultrastructure of the Leydig cell cytoplasm, our EM analy-
ses revealed that the number and size of gap junctions connecting neighboring Leydig cells and/or their processes
apparently increased after flutamide treatment. One possible explanation for this finding is that gap junctions’
formation is triggered by higher estradiol level in testes following flutamide treatment. Indeed, enhanced expres-
sion of connexin43 (the most prominent gap junction protein in testes, Cx43; see61 for further details) in Leydig
cells, as well as higher estradiol levels in testes of adult rat and boar were demonstrated after short- or long-term
flutamide administration36,40. Increased estradiol content and increased Cx43 expression level, reported in the
human prostate epithelial cells as a consequence of flutamide treatment, additionally support our h ypothesis62.
Conclusions
In the study presented herein, we showed that in flutamide-treated rats, distinct increase in the expression level
of important steroidogenic proteins (and respective mRNAs) in the testicular tissue as well as elevation of sex
steroid hormone (testosterone and estradiol) levels, correspond well to morphological alterations of the Leydig
cell ultrastructure. Most importantly, up-regulation of steroidogenic proteins’ expression apparently correlates
with multiplication of Leydig cell mitochondria and subsequent formation of local mitochondrial networks in
flutamide treated rats. These results suggest that flutamide administration, in addition to previously described
Scientific Reports | (2021) 11:13772 | https://doi.org/10.1038/s41598-021-93292-8 10
Vol:.(1234567890)www.nature.com/scientificreports/
effects, enhances the biogenesis of mitochondria and expression of key regulators of mitochondrial dynamics,
proteins Drp1 and Mfn2.
Materials and methods
Animals and treatment. Adult Wistar male rats were randomly assigned into experimental and control
groups (n = 6/each group). Rats from the experimental group were injected subcutaneously with flutamide
(Sigma–Aldrich) suspended in corn oil for seven consecutive days (each dose, 50 mg/kg bw), as described
previously39–41. The selected dose of flutamide was high enough to exert primary effects on cellular targets within
the testis without generating testicular germ cell loss from the seminiferous tubules (for further details see40,41).
The animals were maintained under identical conditions of 12 h light:12 h dark with access to food and fresh
water ad libitum. Animals were sacrificed by inhalation with 5% (v/v) isoflurane at 90 days of age. Testes were
dissected and blood samples were collected. Plasma were separated from blood samples and used for ELISA
analyses. Fresh tissue fragments were either snap-frozen and stored at − 80 °C for qRT-PCR, western blot and
ultrastructure examination, or fixed in 4% paraformaldehyde, and embedded in paraplast for immunohisto-
chemistry and immunofluorescence63.
The experiments were performed in accordance with Polish legal requirements and in compliance with
the Directive 2010/63/EU on the Protection of Animals Used For Scientific Purposes. The use of animals was
approved by the First Local Ethical Committee on Animal Testing at the Jagiellonian University in Krakow
(permission number: 116/2012) and the 2nd Local Institutional Animal Care and Use Committee in Krakow,
Poland (permission number 189/2018). This study was carried out in compliance with the ARRIVE guidelines64.
Immunohistochemistry. For immunohistochemistry 5-micron-thick sections of testes were deparaffi-
nized and rehydrated. Antigen retrieval, endogenous peroxidase activity and non-specific binding sites were
blocked as described previously40. The sections were incubated overnight at 4 °C with primary antibodies (for
details see Supplementary Table S2). On the next day, biotinylated secondary antibody goat anti-rabbit or horse
anti-mouse (1:400; Vector Laboratories) was applied. The staining signal was visualized by the avidin-bioti-
nylated horseradish peroxidase complex (1:100; Vectastain Elite ABC Reagent, Vector) and by 0.05% 3.3′-diam-
inobenzidine tetrachloride dissolved in TBS containing 0.01% (v/v) H 2O2 and 0.07% (wt/v) imidazole. Sub-
sequently, the sections were counterstained with Mayer’s hematoxylin (Vector), dehydrated and coverslipped
with DPX mounting medium (Sigma–Aldrich). Control sections included omission of the respective primary
antibody and/or substitution by irrelevant IgG.
β-Actin served as unrelated control protein. All procedures were performed identically, at the same time to
ensure uniformity and specificity of the staining. Sections were examined with a Leica DMR microscope (Leica
Microsystems GmBH).
Images of testicular sections obtained with a digital camera system coupled to an optical microscope (Micro-
phot, Nikon) were used for quantitative analysis by ImageJ Software (NIH). The intensities of IHC staining were
calculated as relative optical density (ROD) of reaction p roducts65.
Immunofluorescence. For immunofluorescence labeling testes sections were used. Non-specific bind-
ing sites were blocked with normal goat/horse serum. Background fluorescence was reduced by 0.1% solution
of sodium borohydride (Sigma-Aldrich). Thereafter, the sections were incubated overnight at 4 °C with anti-
Drp1, Mfn2, and Tom20 antibodies (Supplementary Table S2). On the next day, a Cy3-cojugated goat anti-
rabbit IgG (1:200; Thermo-Fischer) or Alexa Fluor 488 goat anti-mouse (1:200; Invitrogen) was applied for
60 min as described previously66. Lastly, sections were coverslipped with Vectashield mounting medium (Vec-
tor) with DAPI and examined with the Leica DMR epifluorescence microscope (FM) equipped with appropriate
filters. Mitochondrial protein, positive for the outer membrane, Tom20, served as a control protein, as described
previously67. For negative control, primary antibody was omitted and no fluorescence was observed.
The fluorescent images were analyzed using ImageJ Software. Single Leydig cell was manually outlined and
the area, integrated density and mean gray value were measured. The same outlining procedure was applied to
a background zone. The corrected total cell fluorescence (CTCF) has been calculated using following equations
CTCF = area of selected cell × mean fluorescence of background readings, as described p reviously68.
Western blotting. For protein extraction tissue samples were homogenized with cold-ice RIPA buffer
(Thermo-Fischer) supplemented with protease inhibitors (Sigma-Aldrich), as described previously37. Briefly,
tissue lysates were separated by SDS-PAGE, under reducing conditions and transferred to polyvinylidene dif-
luoride membranes (Sigma-Aldrich) through semi-dry transfer (Bio-Rad Laboratories). To prevent nonspecific
binding of antibodies, membranes were blocked with a solution of 5% (wt/v) non-fat dry milk containing 0.1%
(v/v) Tween 20 and cut at appropriate molecular weights of the prestained molecular weight marker (Thermo-
Fischer) to allow the use of different antibodies on different parts of the blot. Next, the blots were probed with the
respective primary antibodies (Supplementary Table S2) at 4 °C overnight. Next, secondary antibody conjugated
with the horseradish-peroxidase labeled goat anti-mouse or goat anti-rabbit IgG was added (1:3000, Vector)
for 60 min at room temperature40. The immunocomplexes were detected by chemiluminescence captured with
a ChemiDoc XRS + System (Bio-Rad). All blots were stripped and reprobed with an antibody against β-Actin,
which was used as a loading control. Mitochondrial protein, Tom20 served as an additional control for the nor-
malization of signals of mitochondrial proteins StAR and CYP11A1. The molecular weights of target proteins
were estimated by reference to protein molecular weight marker (Thermo-Fischer). The bands were analyzed
and quantified with ImageLab software (Bio-Rad).
Scientific Reports | (2021) 11:13772 | https://doi.org/10.1038/s41598-021-93292-8 11
Vol.:(0123456789)www.nature.com/scientificreports/
RNA isolation, reverse transcription and real‑time quantitative RT‑PCR. Total RNA was isolated
from the testes with TRIzol reagent (Life Technologies)66,69. To minimize DNA contamination TURBO DNase
free Kit (Ambion) was used, according to the manufacturer’s protocols. The yield and purity of the collected RNA
were evaluated by determining the A260:A280 ratio (NanoDrop ND2000 Spectrophotometer (Thermo-Fischer)
and by electrophoresis37,41. Only RNA with A260:280 ratios higher than 1.9 was used for cDNA synthesis66. RNA
was transcribed into cDNA using High-Capacity cDNA Reverse Transcription Kit (Applied Biosystems) accord-
ing to the manufacturer’s instructions. Parallel reactions for each RNA sample were run in the absence of RT to
assess genomic DNA contamination41. RNase-free water was added in place of the RT product.
Real-time RT-PCR analyses was carried out using StepOne Real-Time PCR system (Applied Biosystems) as
described previously66,69. Specific primer pairs (Institute of Biochemistry and Biophysics, Polish Academy of
Sciences) were detailed in Supplementary Table S3. Amplification efficiency was calculated as described by Svec
et al.70 and displayed between 94 and 104%. The specificity and purity of amplification was tested at the end of
the PCR by melting curve analysis, and subsequent agarose gel electrophoresis. In qRT-PCR analyses, a negative
control corresponding to RT reaction without the reverse transcriptase enzyme and a blank sample were carried
out. All experiments were performed in triplicate and repeated in independent experiments three times. mRNA
expressions were normalized to the mean expression of reference genes Rpl13a, Actb, and Gapdh mRNA (relative
quantification, RQ = 1) with the use of the 2−ΔΔCt method71. In Figs. 1 and 6, as an internal control, representative
Actb transcript level was shown.
ELISA analysis. Commercially available ELISA kits (DRG International) were used to quantify total testos-
terone (Cat. No. EIA-1559) and estradiol (Cat. No. EIA-2693) concentrations in testicular homogenates. Addi-
tionally, the concentration of LH in plasma was measured (cat.no.: EIA-1289). For all measurements, samples
of control and flutamide-treated rats were used according to manufacturer’s protocols. Samples were run in
triplicate within the same experiment and measured using a microplate reader (Labtech LT-4500).
Light and electron microscopy. Dissected testes from both groups were cut into small pieces and
immersed in ice-cold pre-fixative containing 2% formaldehyde and 2.5% glutaraldehyde in 0.1 M phosphate
buffer, pH 7.3 as described p reviously40,63. Next, fragments of the tissues were washed in the same buffer and
post-fixed in a mixture of 2% osmium tetroxide and 0.8% potassium ferrocyanide in 0.1 M phosphate buffer, pH
7.3 for 30 min (4 °C)40,63. After dehydration in the graded series of ethanol and acetone the material was infil-
trated in a freshly prepared mixture of acetone and epoxy resin (Epoxy Embedding Medium kit, Sigma-Aldrich)
and embedded in epoxy resin. Semithin sections (0.7–1 μm thick) were stained with 1% methylene blue in 1%
borax and examined under a Leica DMR light microscope40,63. Ultrathin sections (80 nm thick) were contrasted
with uranyl acetate and lead citrate and analyzed with a JEOL 2100 HT (Japan) TEM40,63. Both, semithin and
ultrathin sections were used for morphometric analyses of Leydig cells and mitochondria, respectively.
The area of all Leydig cells on each micrograph was measured as a pixel value, using a freehand selection tool
in the ImageJ window. Measured pixel values were converted to μm according to the measured pixel value of the
scale bar on the corresponding micrographs. The Leydig cells were counted and presented as a mean number
of cells per 1000 μm2 of the interstitial tissue. Over 36 measurements were made for each animal from control
and flutamide-treated animals.
The cell area occupied by mitochondria, mitochondria perimeter, the percentage of morphologically modified
mitochondria, and diameter of SER vesicles on each electron micrograph were measured using ImageJ Software
(as described above). For each cell, the area occupied by mitochondria was compared to the total cell area and
presented as a percentage value. At least six electron micrographs from 6 animals per group were analyzed.
3D organization of Leydig cells and morphometric analyses of TEM images. Three-dimensional
reconstructions and morphometric analyses of TEM images were performed with the ImageJ Software version
1.51 h72. To reconstruct the 3D organization of Leydig cells, serial ultrathin sections of testes were used. Micro-
graphs were aligned to form virtual stack and selected structures (mitochondria, nucleus, Golgi apparatus, cell
membrane) were contoured using TrakEM2 plugin. For 3D visualization 3D viewer and Z-projection plugins
were used.
Statistics. The raw data were processed using Statistica 10 software (StatSoft Inc.). Shapiro–Wilk W-test was
used to test normality of data distribution and Levene’s test to assessed homogeneity of variance as described
previously41. Statistical differences in protein and mRNA expression levels were determined using the non-par-
ametric Mann–Whitney U-test. Data were presented as mean ± SD and considered statistically significant at
*P < 0.05; **P < 0.01; ***P < 0.001.
Received: 30 November 2020; Accepted: 23 June 2021
References
1. Russell, L. D. Mammalian Leydig cell structure. In The Leydig Cell (eds Payne, A. H., Hardy, M. P. & Russell, L. D.) 44–96 (Cache
River Press, 1996).
2. Haider, S. G. Cell biology of Leydig cells in the testis. Int. Rev. Cytol. 233, 181–241 (2004).
Scientific Reports | (2021) 11:13772 | https://doi.org/10.1038/s41598-021-93292-8 12
Vol:.(1234567890)www.nature.com/scientificreports/
3. Payne, A. H. & Hales, D. B. Overview of steroidogenic enzymes in the pathway from cholesterol to active steroid hormones. Endocr.
Rev. 25, 947–970 (2004).
4. Teerds, K. J. & Huhtaniemi, I. T. Morphological and functional maturation of Leydig cells: From rodent models to primates. Hum.
Reprod. Update 21, 310–328 (2015).
5. Wang, Y., Chen, F., Ye, L., Zirkin, B. & Chen, H. Steroidogenesis in Leydig cells: Effects of aging and environmental factors. Repro-
duction 154, R111–R122 (2017).
6. Saez, J. M. Leydig cells: Endocrine, paracrine, and autocrine regulation. Endocr. Rev. 15, 574–626 (1994).
7. Stocco, D. M. StAR protein and the regulation of steroid hormone biosynthesis. Annu. Rev. Physiol. 63, 193–213 (2001).
8. Kaprara, A. & Huhtaniemi, I. T. The hypothalamus–pituitary–gonad axis: Tales of mice and men. Metabolism 86, 3–17 (2018).
9. Allen, J. A. et al. Energized, polarized, and actively respiring mitochondria are required for acute Leydig cell steroidogenesis.
Endocrinology 147, 3924–3935 (2006).
10. Midzak, A. S., Liu, J., Zirkin, B. R. & Chen, H. Effect of myxothiazol on Leydig cell steroidogenesis: Inhibition of luteinizing
hormone-mediated testosterone synthesis but stimulation of basal steroidogenesis. Endocrinology 148, 2583–2590 (2007).
11. Hales, D. B. et al. Mitochondrial function in Leydig cell steroidogenesis. Ann. N. Y. Acad. Sci. 1061, 120–134 (2005).
12. Bartolák-Suki, E., Imsirovic, J., Nishibori, Y., Krishnan, R. & Suki, B. Regulation of mitochondrial structure and dynamics by the
cytoskeleton and mechanical factors. Int. J. Mol. Sci. 18, 1812 (2017).
13. Youle, R. J. & van der Bliek, A. M. Mitochondrial fission, fusion, and stress. Science 337, 1062–1065 (2012).
14. Mitra, K. Mitochondrial fission–fusion as an emerging key regulator of cell proliferation and differentiation. BioEssays 35, 955–964
(2013).
15. Friedman, J. R. & Nunnari, J. Mitochondrial form and function. Nature 505, 335–343 (2014).
16. Mattie, S., Krols, M. & McBride, H. M. The enigma of an interconnected mitochondrial reticulum: New insights into mitochondrial
fusion. Curr. Opin. Cell Biol. 59, 159–166 (2019).
17. Ramachandran, R. & Schmid, S. L. The dynamin superfamily. Curr. Biol. 28, R411–R416 (2018).
18. Smirnova, E., Griparic, L., Shurland, D. L. & van der Bliek, A. M. Dynamin-related protein Drp1 is required for mitochondrial
division in mammalian cells. Mol. Biol. Cell 12, 2245–2256 (2001).
19. Reddy, P. H. et al. Dynamin-related protein 1 and mitochondrial fragmentation in neurodegenerative diseases. Brain Res. Rev. 67,
103–118 (2011).
20. Murphy, L., Jeffcoate, I. A. & O’Shaughnessy, P. J. Abnormal Leydig cell development at puberty in the androgen-resistant Tfm
mouse. Endocrinology 135, 1372–1377 (1994).
21. O’Shaughnessy, P. J., Johnston, H., Willerton, L. & Baker, P. J. Failure of normal adult Leydig cell development in androgen receptor-
deficient mice. J. Cell Sci. 115, 3491–3496 (2002).
22. De Gendt, K. et al. Development and function of the adult generation of Leydig cells in mice with Sertoli cell-selective or total
ablation of the androgen receptor. Endocrinology 146, 4117–4126 (2005).
23. Labrie, F. Mechanism of action and pure antiandrogenic properties of flutamide. Cancer 72, 3816–3827 (1993).
24. Ashby, J., Owens, E. & Lefevre, P. A. Concept evaluation: Androgen-stimulated immature intact male rats as an assay for antian-
drogens. Reprod. Toxicol. Pharmacol. 35, 280–285 (2002).
25. Farla, P., Hersmus, R., Trapman, J. & Houtsmuller, A. B. Antiandrogens prevent stable DNA-binding of the androgen receptor. J.
Cell Sci. 118, 4187–4198 (2005).
26. Diamanti-Kandarakis, E. Endocrine-disrupting chemicals: An endocrine society scientific statement. Endocr. Rev. 30, 293–342
(2009).
27. Hejmej, A. & Bilinska, B. The effects of flutamide on cellular junctions in the testis and epididymis and prostate. Reprod. Toxicol.
304, 1–16 (2018).
28. Skakkebaek, N. E., Rajpert-De Meyts, E. & Main, K. M. Testicular dysgenesis syndrome: An increasingly common developmental
disorder with environmental aspects. Hum. Reprod. 16, 972–978 (2001).
29. Anway, M. D., Rekow, S. S. & Skinner, M. Comparative antiandrogenic actions of vinclozolin and flutamide on transgenerational
adult onset disease and spermatogenesis. Reprod. Toxicol. 26, 100–106 (2005).
30. Culty, M. et al. In utero exposure to di-(2-ethylhexyl) phthalate exerts both short term and long-lasting suppressive effects on
testosterone production in the rat. Biol. Reprod. 78, 1018–1028 (2008).
31. Viguier-Martinez, M.-C., Hochereau-de Reviers, M.-T. & Perreau, C. Effects of flutamide or of supplementation with testosterone
in prepubertal male rats prenatally treated with busulfan. Eur. J. Endocrinol. 109, 550–557 (1985).
32. Balbontín, J. B. Flutamide as a tool to study the hormonal regulation of the reproductive tract in the golden hamster. Andrologia
26, 27–32 (1994).
33. Ohsako, S. et al. Alterations of gene expression in adult male rat testis and pituitary shortly after subacute administration of the
antiandrogen flutamide. J. Reprod. Dev. 49, 275–290 (2003).
34. Sarrabay, A. et al. Low dose evaluation of the antiandrogen flutamide following a mode of action approach. Toxicol. Appl. Pharmacol.
289, 515–524 (2015).
35. Luccio-Camelo, D. C. & Prins, G. S. Disruption of androgen receptor signaling in males by environmental chemicals. J. Steroid
Biochem. Mol. Biol. 127, 74–82 (2011).
36. Kopera, I. et al. Differential expression of connexin 43 in adult pig testes during normal spermatogenic cycle and after flutamide
treatment. Reprod. Domest. Anim. 46, 1050–1060 (2011).
37. Hejmej, A. et al. Are expression and localization of tight and adherens junction proteins in testes of adult boar affected by foetal
and neonatal exposure to flutamide?. Int. J. Androl. 35, 340–352 (2012).
38. Kotula-Balak, M., Hejmej, A., Kopera, I., Lydka, M. & Bilinska, B. Prenatal and neonatal exposure to flutamide affects function of
Leydig cells in adult boar. Domest. Anim. Endocrinol. 42, 152–164 (2012).
39. Zarzycka, M. et al. Flutamide alters the distribution of c-Src and affects N-cadherin–β-catenin complex in the seminiferous epi-
thelium of adult rat. Andrology 3, 569–581 (2015).
40. Chojnacka, K. et al. Flutamide induces alterations in the cell–cell junction ultrastructure and reduces the expression of Cx43 at
the blood-testis barrier with no disturbance in the rat seminiferous tubule histology. Reprod. Biol. Endocrinol. 14, 14. https://doi.
org/10.1186/s12958-016-0144-2 (2016).
41. Brzoskwinia, M. et al. Altered expression of apelin, chemerin, and vaspin and their receptors in testes of adult rats treated with
flutamide. Int. J. Mol. Sci. 21, 4439. https://doi.org/10.3390/ijms21124439 (2020).
42. Haider, S. G., Servos, G. & Tran, N. Structural and histological analysis of Leydig cell steroidogenic function. In The Leydig Cell in
Health and Disease (eds Payne, A. H. & Hardy, M. P.) 33–45 (Humana Press Inc., 2007).
43. Zirkin, B. R. & Papadopoulos, V. Leydig cells: Formation, function, and regulation. Biol. Reprod. 99, 101–111 (2018).
44. Balzano, S. et al. The effect of androgen blockade on pulsatile gonadotrophin release and LH response to naloxone. Clin. Endocrinol.
(Oxf) 27, 491–419 (1987).
45. Kerrigan, J. R., Veldhuis, J. D. & Rogol, A. D. Androgen-receptor blockade enhances pulsatile luteinizing hormone production in
late pubertal males: Evidence for a hypothalamic site of physiologic androgen feedback action. Pediatr. Res. 35, 102–106 (1994).
46. O’Hara, L. et al. Pituitary androgen receptor signalling regulates prolactin but not gonadotrophins in the male mouse. PLoS ONE
10, e0121657. https://doi.org/10.1371/journal.pone.0121657 (2015).
Scientific Reports | (2021) 11:13772 | https://doi.org/10.1038/s41598-021-93292-8 13
Vol.:(0123456789)You can also read