In biomass burning plumes in rural Idaho
←
→
Page content transcription
If your browser does not render page correctly, please read the page content below

Research article
Atmos. Chem. Phys., 22, 4909–4928, 2022
https://doi.org/10.5194/acp-22-4909-2022
© Author(s) 2022. This work is distributed under
the Creative Commons Attribution 4.0 License.

       Ground-based investigation of HOx and ozone chemistry
             in biomass burning plumes in rural Idaho
                  Andrew J. Lindsay1 , Daniel C. Anderson1,a,b , Rebecca A. Wernis2,3 , Yutong Liang3 ,
          Allen H. Goldstein2,3 , Scott C. Herndon4 , Joseph R. Roscioli4 , Christoph Dyroff4 , Ed C. Fortner4 ,
        Philip L. Croteau4 , Francesca Majluf4 , Jordan E. Krechmer4 , Tara I. Yacovitch4 , Walter B. Knighton5 ,
                                                   and Ezra C. Wood1
                            1 Department   of Chemistry, Drexel University, Philadelphia, PA, USA
        2 Department of Civil and Environmental Engineering, University of California Berkeley, Berkeley, CA, USA
                               3 Department of Environmental Science, Policy and Management,

                                     University of California Berkeley, Berkeley, CA, USA
                                        4 Aerodyne Research Inc., Billerica, MA, USA
                5 Department of Chemistry and Biochemistry, Montana State University, Bozeman, MT, USA
                         a now at: University of Maryland, Baltimore County, Baltimore, MD, USA
                             b now at: NASA Goddard Space Flight Center, Greenbelt, MD, USA

                                   Correspondence: Ezra C. Wood (ew456@drexel.edu)

                                 Received: 20 August 2021 – Discussion started: 28 September 2021
                            Revised: 8 March 2022 – Accepted: 9 March 2022 – Published: 13 April 2022

       Abstract. Ozone (O3 ), a potent greenhouse gas that is detrimental to human health, is typically found in el-
       evated concentrations within biomass burning (BB) smoke plumes. The radical species OH, HO2 , and RO2
       (known collectively as ROx ) have central roles in the formation of secondary pollutants including O3 but
       are poorly characterized for BB plumes. We present measurements of total peroxy radical concentrations
       ([XO2 ] ≡ [HO2 ] + [RO2 ]) and additional trace-gas and particulate matter measurements from McCall, Idaho,
       during August 2018. There were five distinct periods in which BB smoke impacted this site. During BB
       events, O3 concentrations were enhanced, evident by ozone enhancement ratios (1O3 /1CO) that ranged up
       to 0.06 ppbv ppbv−1 . [XO2 ] was similarly elevated during some BB events. Overall, instantaneous ozone pro-
       duction rates (P (O3 )) were minimally impacted by the presence of smoke as [NOx ] enhancements were minimal.
       Measured XO2 concentrations were compared to zero-dimensional box modeling results to evaluate the Master
       Chemical Mechanism (MCM) and GEOS-Chem mechanisms overall and during periods of BB influence. The
       models consistently overestimated XO2 with the base MCM and GEOS-Chem XO2 predictions high by an aver-
       age of 28 % and 20 %, respectively. One period of BB influence had distinct measured enhancements of 15 pptv
       XO2 that were not reflected in the model output, likely due to the presence of unmeasured HOx sources. To the
       best of our knowledge, this is the first BB study featuring peroxy radical measurements.

1   Introduction                                                   served several staggering wildfire seasons characterized by
                                                                   hundreds of fatalities and tens of thousands of homes de-
                                                                   stroyed. For example, the 2018 season included California’s
Unprecedented wildfire activity has been observed in recent        deadliest fire ever (the Camp Fire), which was responsible for
years. For example, Brazil’s Amazon rainforest wildfires in        85 deaths (CAL-FIRE, 2021), burned a total of 3.5 × 10⁶ ha
2019 (Cardil et al., 2020) and Australia’s bush fires in 2019–     of land, and elicited government spending of USD 3.1 billion
2020 (Yu et al., 2020) were both marked by historically            for fire suppression (NIFC, 2019). Due to climate change,
high amounts of land burned. The United States has also ob-

Published by Copernicus Publications on behalf of the European Geosciences Union.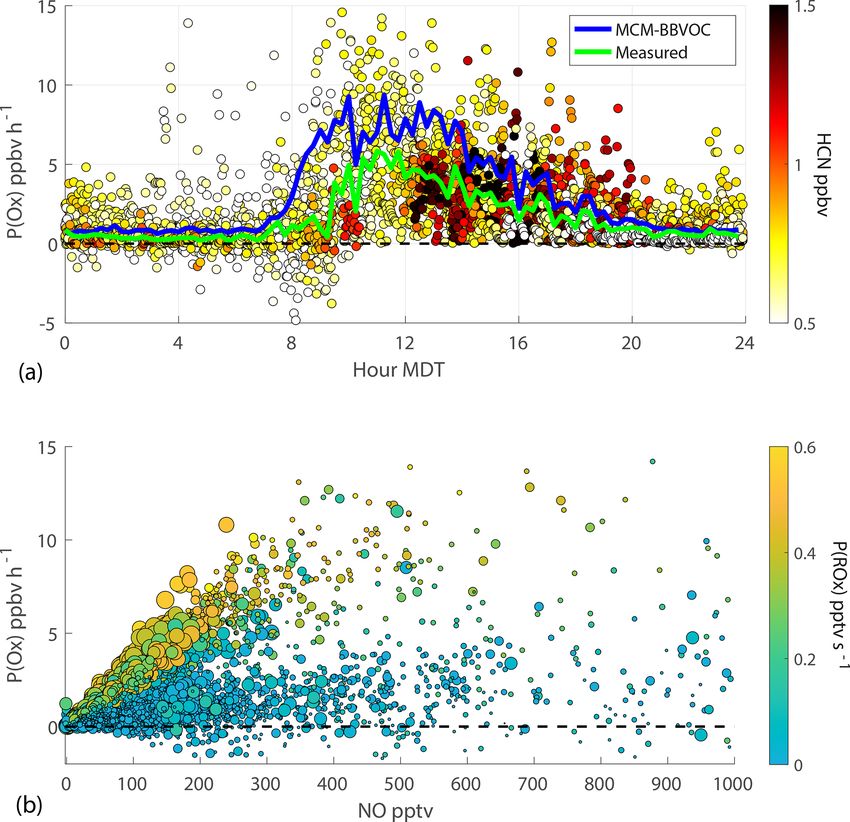
4910                                              A. J. Lindsay et al.: Ground-based investigation of HOx and ozone chemistry

the impacts associated with wildfire are projected to worsen.         fire smoke to correlate with 19 % of exceedances to the pre-
Many regions, including much of the western United States,            vious 75 ppbv O3 NAAQS (National Ambient Air Quality
are becoming warmer and drier, causing increases in fuel              Standard) standard despite smoke only being present 4.1 %
aridity. These conditions are conducive to increases in land          of the total days studied between May and the end of Septem-
area burned, extended fire seasons, and frequent extreme fires        ber (Gong et al., 2017). This NAAQS O3 standard is in terms
(Spracklen et al., 2009; Yue et al., 2014, 2013; Goss et al.,         of maximum 8 h daily concentration and has been set to a
2020). As a result, the amount of land area burned in the             more stringent standard of 70 ppbv since 2015.
western United States is expected to increase by 24 %–124 %              The correlation between O3 concentrations and BB smoke
by the mid-21st century (Yue et al., 2014, 2013).                     is not completely straightforward. Depleted O3 concentra-
   Wildfire smoke degrades air quality both locally and far           tions can be found in freshly emitted smoke plumes due to
downwind. Wildfire smoke is associated with respiratory and           NO emissions reacting with background O3 . Aged plumes
cardiovascular health risks (Liu et al., 2015; Reid et al., 2016;     have also been observed with depleted O3 . This has been
DeFlorio-Barker et al., 2019; Stowell et al., 2019). These            attributed to meteorological conditions (Wentworth et al.,
health risks will result in modest increases of respiratory ill-      2018), NOx sequestration via peroxy acetyl nitrate (PAN)
ness hospitalizations as wildfire smoke will more frequently          formation (Alvarado et al., 2010), and significant PM emis-
impact densely populated areas (J. C. Liu et al., 2016).              sions that attenuate sunlight and limit photochemistry (Xu
Smoke from biomass burning (BB), a term that includes                 et al., 2021). Ozone depletion is further exemplified by
wildfires, changes in composition as it is transported down-          the wide variation in reported ozone enhancement ratios
wind. The initial composition is based on direct BB emis-             (1O3 /1CO). While most reported ratios are positive, in-
sions: particulate matter (PM), NOx , and organic compounds           dicating net O3 formation, negative 1O3 /1CO values have
spanning a wide range of volatilities. These emissions then           also been reported and indicate depletion. 1O3 /1CO ratios
transform through photochemical reactions that form sec-              in temperate and boreal forest (those typical of the United
ondary pollutants such as ozone (O3 ) and secondary organic           States) are on average 0.018, 0.15, and 0.22 ppbv ppbv−1 for
aerosol (SOA). The formation of O3 within BB smoke is of              smoke plumes aged < 2, 2–5, and > 5 d, respectively (Jaffe
concern because O3 poses additional health concerns and is a          and Wigder, 2012). The wide variation in net O3 production
prominent greenhouse gas. While the large quantities of PM            within BB smoke is related to several factors, including fire
within BB smoke are primarily responsible for BB smoke                dynamics, the extent of emissions, and meteorological con-
health concerns (Liu et al., 2015; DeFlorio-Barker et al.,            ditions. Each of these factors influence the underlying ROx
2019; Reid et al., 2016), health risks from O3 exposure in-           (“ROx ” = OH, HO2 , and RO2 ) chemistry that controls oxi-
clude lung irritation, decreases in lung and cardiac function,        dation processes and secondary pollutant formation.
higher susceptibility to respiratory infection, and early mor-           ROx chemistry has rarely been studied within BB plumes.
tality (Bell et al., 2006; Park et al., 2004; Jerrett et al., 2009;   The peroxy radicals HO2 and RO2 (R = organic group) oxi-
Turner et al., 2016; Silva et al., 2013). Tropospheric ozone is       dize nitric oxide (NO) to form NO2 (Reactions R1 and R2).
the third most important anthropogenic greenhouse gas after           During the day, the resulting NO2 is converted to O3 by pho-
CO2 and CH4 . Increases in tropospheric ozone between the             tolysis (Reactions R3 and R4).
pre-industrial era and the present, from 1750 to 2011, have
                                                                      HO2 + NO → OH + NO2                                     (R1)
accounted for 0.40 W m−2 of radiative forcing. For perspec-
tive, CH4 and CO2 increases are responsible for 0.48 and              RO2 + NO → RO + NO2                                     (R2)
1.82 W m−2 of radiative forcing, respectively (Stocker et al.,        NO2 + hv → NO + O( P) 3
                                                                                                                              (R3)
2013).                                                                  3
                                                                      O( P) + O2 + M → O3 + M                                 (R4)
   Mitigating O3 pollution will be increasingly challenging
as background O3 concentrations are increasing in some                Here, M represents a collision partner such as N2 or O2 .
regions. Long-term aircraft observations across the North-            Within these smoke plumes, the concentration and compo-
ern Hemisphere indicate average increases of tropospheric             sition of ROx species depend on fire emissions, photochem-
O3 of 5 % per decade (Gaudel et al., 2020). More specif-              ical conditions, and smoke age. BB emissions include di-
ically, western US O3 concentrations have been increasing             rect HOx precursors, but individual emission factors and ra-
0.41 ppbv yr−1 despite declining concentrations in the east-          tios are highly variable between fires. Fire dynamics alone
ern United States (Cooper et al., 2012). As biomass burn-             have a significant effect on emissions. Flaming conditions
ing accounts for an estimated 3.5 % of global tropospheric            have greater combustion efficiencies and are characterized
O3 formation (Jaffe and Wigder, 2012), this source of O3              by smaller emission factors of volatile organic compounds
will be more important with projected wildfire activity (Ja-          (VOCs) and PM, while reactive nitrogen emissions are domi-
cob and Winner, 2009; Yue et al., 2015). Cities in the western        nated by HONO, NO, and NO2 (Burling et al., 2010; Roberts
US, which often have existing O3 pollution issues, have their         et al., 2020). Smoldering fire conditions have greater VOC
air quality degraded by BB smoke. For example, a study fo-            emission ratios and PM emissions but lower NOx emis-
cused on eight predominantly western US cities found wild-            sions (Yokelson et al., 1996). Different fuel sources, such

Atmos. Chem. Phys., 22, 4909–4928, 2022                                               https://doi.org/10.5194/acp-22-4909-2022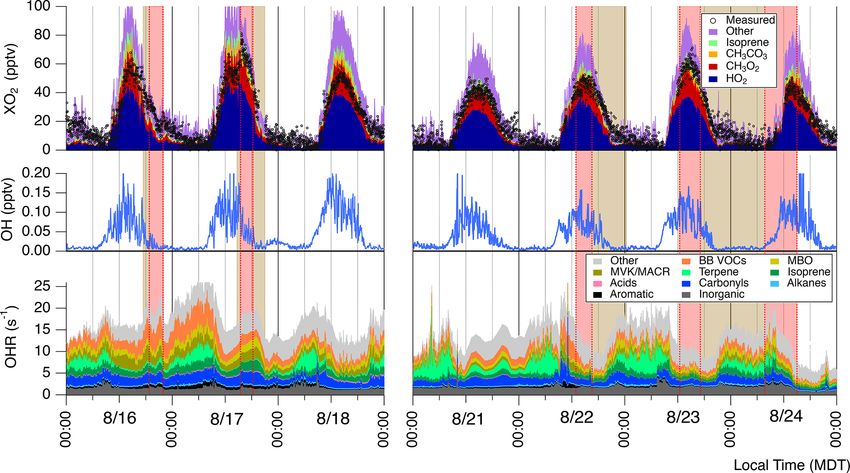
A. J. Lindsay et al.: Ground-based investigation of HOx and ozone chemistry                                                 4911

as specific tree species, shrubs, grasses, and crops, have         CAN (Western Wildfire Experiment for Cloud Chemistry,
unique emission profiles (Koss et al., 2018). Direct HOx           Aerosol Absorption, and Nitrogen) and NOAA FIREX (Fire
precursor emissions of formaldehyde (HCHO), acetaldehyde           Influence on Regional to Global Environments Experiment)
(CH3 CHO), and nitrous acid (HONO) are greater than those          study. Increases in wildfire activity are anticipated for parts
from more typical urban combustion sources. HONO within            of this region, including much of Idaho, because of climate
BB plumes is short-lived, with a chemical lifetime ranging         change (Halofsky et al., 2020). Presented are possibly the
10 to 30 min due to photolysis. This rapid photolysis yields       first measurements of total peroxy radicals in biomass burn-
OH and NO and has caused HONO to act as the dominant               ing plumes, enabling a unique investigation into the impacts
ROx source in some freshly emitted smoke plumes (Peng et           of biomass burning on photochemistry and ozone production
al., 2020; Yokelson et al., 2009). Ozone formation in young        and the accuracy of commonly used atmospheric chemistry
BB plumes is, in almost all cases, initially NOx -saturated        models.
(VOC-limited) but transitions to being NOx -limited as the
NOx is photochemically processed to nitric acid and organic
                                                                   2     Methods
nitrates (Xu et al., 2021; Alvarado et al., 2015; Müller et al.,
2016; Folkins et al., 1997). In particular, NO2 can be effi-       2.1    Campaign description
ciently sequestered in the form of peroxyacetyl nitrate (PAN)
due to the importance of the acetaldehyde emissions and the        Measurements were collected in McCall, Idaho, during
relative importance of the CH3 C(O)OO radical (Peng et al.,        the WE-CAN/FIREX 2018 campaign. McCall (elevation ∼
2021). The subsequent thermal decomposition of PAN into            1.5 km) is a rural town in Valley County, Idaho, approxi-
air masses in which ozone production is NOx -limited can           mately 160 km north of Boise, Idaho (Fig. 1), within the West
potentially lead to sustained O3 formation far downwind of         Mountains of Idaho. While much of the local area is used for
a fire. BB emissions also include unique VOCs that are typi-       cattle grazing, the town attracts tourists year-round for out-
cally unaccounted for by chemical mechanisms employed by           door recreation due to the presence of mountains, surround-
models. For instance, the importance of furanoids for model        ing forests, and a large lake.
predictions of secondary pollution formation has only re-             The McCall field site included two mobile laboratories and
cently been studied (Müller et al., 2016; Coggon et al., 2019;     one building. Each were outfitted with instrumentation for
Decker et al., 2019; Salvador et al., 2021; Robinson et al.,       gas- and particle-phase measurements. The largest mobile
2021).                                                             lab was the Aerodyne Mobile Laboratory (AML) (Herndon
   For the best understanding of the composition and con-          et al., 2005). The AML split its time between stationary sam-
centration of radicals, direct measurements and improved           pling in McCall and mobile measurements in other parts of
models are necessary. Measurements of any ROx compounds            Idaho and surrounding states. Unlike the AML, the second
within BB plumes are rare. Only one study has reported di-         mobile lab, known as the Miniature Aerodyne Mobile Lab
rect measurements of OH in a BB smoke plume, which found           (minAML), was permanently stationed at the McCall site.
that freshly emitted BB plumes (22–43 min aged) had OH             Our analyses focus on the date ranges 16–18 and 21–24 Au-
concentrations 5 times greater than those of background air        gust when the AML was stationed at the McCall site.
(Yokelson et al., 2009). Our understanding of ROx chem-
istry in BB smoke has historically relied on calculations and      2.2    ECHAMP
models (Mason et al., 2001; Hobbs et al., 2003; de Gouw et
al., 2006; Akagi et al., 2012; X. Liu et al., 2016; Müller et      ECHAMP (Ethane CHemical AMPlifier) is a chemical
al., 2016; Parrington et al., 2013). Elevated OH concentra-        amplification-based instrument that was used to measure to-
tions have been suggested for freshly emitted smoke (Hobbs         tal peroxy radical concentrations ([HO2 ] + [RO2 ], or simply
et al., 2003; Akagi et al., 2012), while low OH concentra-         [XO2 ]). ECHAMP was stationed within the minAML and
tions were calculated for aged plumes of ∼ 4 d in western          sampled on a 2 min time base. The sampling and calibration
Canada (de Gouw et al., 2006). There are few studies that          methods have been described in detail elsewhere (Anderson
have focused on peroxy radical chemistry within BB stud-           et al., 2019; Wood et al., 2017), and only a brief summary
ies, and it appears there have been no direct measurements         including details specific to the McCall deployment is de-
in BB smoke. Model-suggested peroxy radical concentra-             scribed here.
tions have exhibited a wide range of values (Mason et al.,            ECHAMP “amplifies” each sampled XO2 molecule into
2001; Parrington et al., 2013; X. Liu et al., 2016; Baylon et      a greater number of NO2 molecules. The enhancement in
al., 2018), in some cases reaching unrealistically high val-       NO2 concentration from “amplification” is then divided by
ues ([HO2 + RO2 ]  200 pptv for wildfires in Nova Scotia,         an amplification factor to determine [XO2 ]. Amplification is
Canada, as presented in Parrington et al., 2013).                  achieved by mixing sampled air with elevated concentrations
   This paper focuses on smoke observations collected in           of NO and C2 H6 to take advantage of a radical propagation
McCall, Idaho, in the Pacific Northwest – a region partic-         scheme (Reactions 1–2 and 5–8). Since these reactions can
ularly prone to wildfire – as part of the joint NCAR WE-           proceed multiple times, each XO2 produces up to 20 NO2

https://doi.org/10.5194/acp-22-4909-2022                                           Atmos. Chem. Phys., 22, 4909–4928, 2022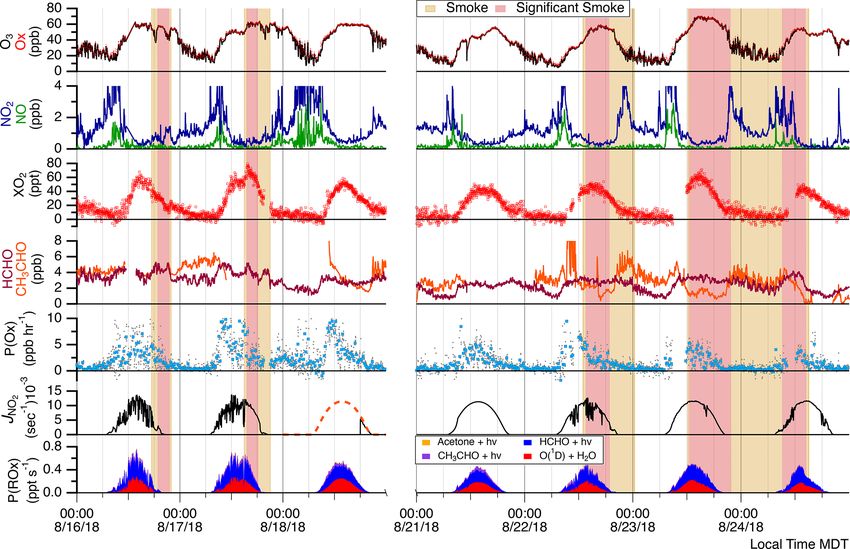
4912                                                A. J. Lindsay et al.: Ground-based investigation of HOx and ozone chemistry

Figure 1. The McCall, Idaho, site is indicated by the red star, and wildfire locations are indicated by orange circles. Panel (a) shows detected
wildfires between 15 and 24 August 2018. Panel (b) includes bihourly HYSPLIT back trajectories for the representative smoke impacted
day of 17 August. Shown here are active wildfires of 15 through 17 August, as back trajectories end 24 h back. Fire locations were retrieved
using the NOAA Hazard Mapping System (HMS) (NOAA, 2021).

molecules. There are two sampling channels: in the amplifi-               amplification mode, 20 sccm of 39.3 ppmv NO in N2 and
cation channel there is an immediate addition of C2 H6 and                50 sccm of 25 % C2 H6 in N2 were added at the beginning
NO, whereas in the background channel the C2 H6 addition                  of the reaction chamber, while 50 sccm of N2 is added in a
is delayed to avoid Reaction (5), and all peroxy radicals are             downstream position. In the background mode, the locations
converted into HONO (Wood et al., 2017). The NO2 within                   for the N2 and C2 H6 additions are reversed. The final con-
the two channels is transported to and measured by respec-                centrations of NO and C2 H6 in the reaction chambers were
tive cavity attenuated phase shift (CAPS) NO2 monitors (Ke-               0.827 ppmv and 1.32 %, respectively. These reaction cham-
babian et al., 2008).                                                     bers alternate in 1 min intervals between background and am-
                                                                          plification modes leading to the overall 2 min sampling time.
OH + C2 H6 → H2 O + C2 H5                                      (R5)       The resulting mixtures from both channels were transported
C2 H5 + O2 + M → C2 H5 O2 + M                                  (R6)       in approximately 23 m of their respective tubing to the mi-
C2 H5 O2 + NO → C2 H5 O + NO2                                  (R7)       nAML that housed both CAPS monitors.
                                                                             Dilution of sampled air with O2 is a new addi-
C2 H5 O + O2 → CH3 CHO + HO2                                   (R8)
                                                                          tion to ECHAMP and is similar in some ways to its
Ambient air is first sampled at 2.5 SLPM into a 0.635 cm                  use by the perCIMS method (Hornbrook et al., 2011).
PFA tee and immediately diluted with 0.8 SLPM O2 . The                    The elevated O2 concentration (40 %) increases the ra-
sampled air then flows through 10 cm of 0.476 cm i.d. PFA                 tio of the rate of the propagation reaction (Reaction R8;
tubing protruding out of an inlet box. This ECHAMP in-                    C2 H5 O + O2 → CH3 CHO + HO2 ) to the rate of ethyl nitrite
let box is a weatherproof container with dimensions of                    formation (C2 H5 O + NO + M → C2 H5 ONO + M), which is
39 cm × 44 cm × 16 cm and was mounted 3 m a.g.l. on scaf-                 a termination reaction. Dilution also dries the sampled air,
folding. The sampled air then entered a glass cross that                  leading to lower and less variable relative humidity. This
was internally coated with halocarbon wax. Connected or-                  is beneficial as the amplification factor decreases with in-
thogonally from the sampling lines were two 15.2 cm long                  creasing RH (Anderson et al., 2019; Wood et al., 2017).
(0.476 cm i.d) reaction chambers. The reaction chambers                   The humidity dependence of the amplification factor is due
each subsampled at a flow rate of 0.83 L min−1 . The remain-              to humidity-dependent reactions of HO2 and the HO2 –H2 O
ing flow rate of 1.64 SLPM traveled by a Vaisala HMP60                    adduct reacting with NO to form HNO3 (Reichert et al.,
probe that measured temperature and humidity. The reac-                   2003; Butkovskaya et al., 2009) and HO2 wall losses (Mi-
tion chambers included additions of NO, C2 H6 , and N2 . In               hele and Hastie, 1998; Reichert et al., 2003).

Atmos. Chem. Phys., 22, 4909–4928, 2022                                                       https://doi.org/10.5194/acp-22-4909-2022
A. J. Lindsay et al.: Ground-based investigation of HOx and ozone chemistry                                             4913

   ECHAMP was calibrated to the methyl peroxy radical           ciation monitor (ACSM), permanently stationed at the Mc-
CH3 O2 over a range of relative humidities (RHs) using          Call site building (Ng et al., 2011).
the CH3 I photolysis method as described in Anderson et            On board the minAML, NO2 was measured with a
al. (2019) six times at McCall. The calibrant was prepared by   CAPS monitor and VOCs with the Berkeley Compre-
mixing humidified zero air (ZA) with trace amounts of CH3 I     hensive Thermal Desorption Aerosol Gas Chromatograph
from a permeation source. The resulting mixture flows to a      (cTAG) (Wernis et al., 2021). The cTAG measures con-
quartz tube, where CH3 I is photolyzed at 254 nm by an O3 -     centrations of VOCs, intermediate volatility organic com-
free Hg lamp. The resulting CH3 O2 calibrant is then added      pounds, and semi-volatile organic compounds, spanning an
in excess flow to the ECHAMP inlet. To quantify the CH3 O2      alkane-equivalent volatility range from C5 to C30 every hour
produced, both reaction chambers were initially operated in     via pre-concentration followed by thermal desorption and
background mode and the CH3 O2 source modulated on and          gas chromatography–time-of-flight mass spectrometry (GC-
off by alternating the flow between a UV photolysis cell and    TOF-MS). This paper uses isoprene, speciated monoter-
a bypass chamber. An improvement over the prior version         penes, 2-methyl-3-buten-2-ol (MBO), styrene, benzene, and
of this calibration method was the elimination of dead vol-     toluene measurements taken by cTAG.
ume in the chamber. Further details regarding this calibra-        Meteorological measurements were made both on the
tion technique including recent improvements are provided       AML and permanently at the McCall site. Temperature, wind
in the Supplement. Calibrations were also conducted using       speed, and wind direction were collected by a 3D R.M.
the H2 O photolysis method (Anderson et al., 2019). Unfor-      Young (Model 81000RE) sonic anemometer stationed per-
tunately, inconsistent results were obtained, and at the end    manently at the McCall site at a height of 10 m. Addi-
of the project we discovered that the quartz photolysis cell    tional wind was measured with a 3D R.M. Young (Model
was broken. Therefore, calibrations using the H2 O photoly-     81000RE) sonic anemometer mounted to the AML rooftop
sis method were disregarded, and only the CH3 I calibrations    and corrected for speed and truck orientation with data from
were used. Based on the uncertainties in the individual cal-    a Hemisphere GPS compass (model Vector V103). Tem-
ibration points, the variability among individual calibration   perature, RH, and wind data are shared in the Supplement
points, and uncertainties regarding sampling losses, we as-     (Fig. S3). Daily maximum temperatures ranged 22 to 28 ◦ C,
cribe an uncertainty of 34 % (2σ ) to the measurements. See     while minimum temperatures ranged 4 to 13 ◦ C. Solar irra-
Sect. S1 for more information.                                  diance was measured by a permanently stationed ARISense
                                                                air quality sensor system (Cross et al., 2017). This was used
                                                                to derive photolysis frequencies of interest, such as JNO2 ,
2.3   Additional measurements                                   by scaling measured irradiance to outputs from the National
                                                                Center for Atmospheric Research (NCAR) Tropospheric Ul-
On board the AML, quantum cascade tunable infrared laser        traviolet and Visible (TUV) radiation model. This process for
direct absorption spectrometers (QC-TILDAS; Aerodyne            deriving photolysis frequencies is described in greater detail
Research Inc.) (McManus et al., 2015) were used to mea-         in the Supplement.
sure (1) NO and NO2 ; (2) CO, N2 O, and H2 O; (3) HCHO             For most calculations and chemistry analyses, measured
and HCOOH; (4) CH4 and C2 H6 ; and (5) HCN. Ozone was           concentrations of other compounds were synchronized to the
measured by a 2B-Tech UV absorption instrument (model           2 min ECHAMP timescale. This was achieved by averaging
205). While particulate matter and VOCs can positively in-      greater frequency measurements and linearly interpolating
terfere with photometric O3 measurements (Huntzicker and        lower frequency measurements. Most measurements fall in
Johnson, 1979; Long et al., 2021), comparison to a sepa-        the former category and were measured at a 1 Hz sampling
rate Ox measurement revealed minimal interferences in the       rate. VOCs from cTAG were obtained at an hourly rate and
2B-Tech O3 observations (see Sect. S2). VOC measurements        were therefore linearly interpolated.
were made by an ARI Vocus (proton-transfer-reaction high-
resolution time-of-flight (PTR-HR-ToF) mass spectrome-          2.4   Smoke events
ter) (Krechmer et al., 2018). Measured VOCs include iso-
prene, acetaldehyde, acetone, acetic acid, benzene, toluene,    Time periods impacted by smoke were identified with ob-
C2 benzenes, C3 benzenes, methanol, total monoterpenes,         servations of the biomass burning tracers HCN, CH3 CN,
and the sum of methyl vinyl ketone (MVK) and methacrolein       organic aerosol (OA), and CO. HCN was used as the pri-
(MACR). BB-related VOCs measured with the Vocus in-             mary tracer for BB smoke. Nitriles are commonly used as
clude furan, methyl furan, furfural, the sum of methyl fur-     tracers for BB, and HCN is particularly useful in the ab-
fural and catechol, and guaiacol. Chemically resolved mea-      sence of nearby vehicle sources. Emissions of HCN are es-
surements of particulate matter mass concentrations were        sentially inert within BB plumes with an atmospheric life-
made by an ARI soot particle aerosol mass spectrometer (SP-     time of 2 to 4 months (Li et al., 2000). HCN emission ra-
AMS) (Canagaratna et al., 2007). Additional particle-phase      tios are dependent on the biomass burning fuel type (Koss
measurements were made with an ARI aerosol chemical spe-        et al., 2018; Coggon et al., 2016) and can vary with fire

https://doi.org/10.5194/acp-22-4909-2022                                       Atmos. Chem. Phys., 22, 4909–4928, 2022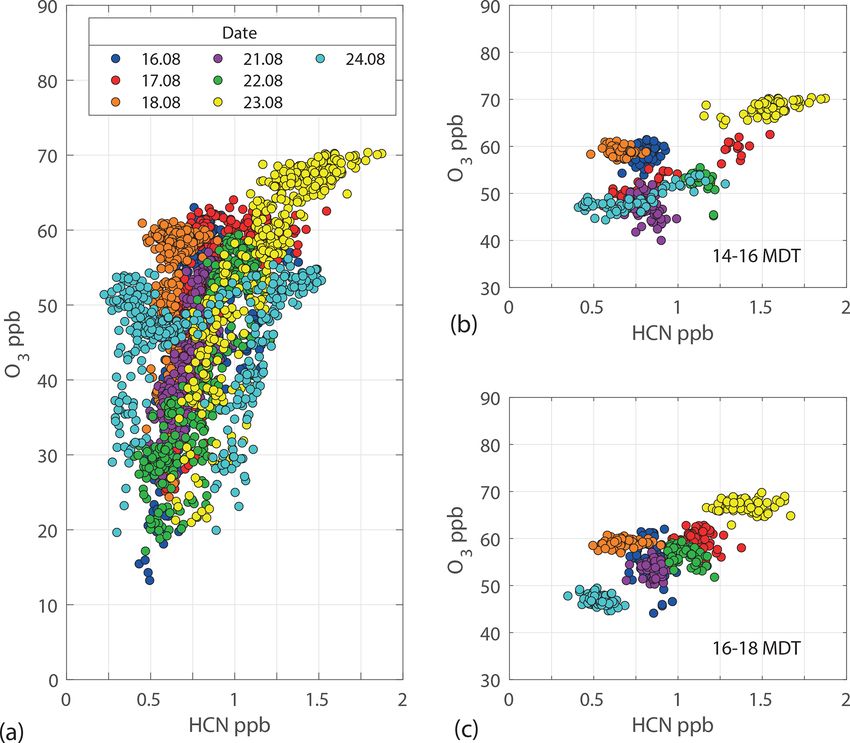
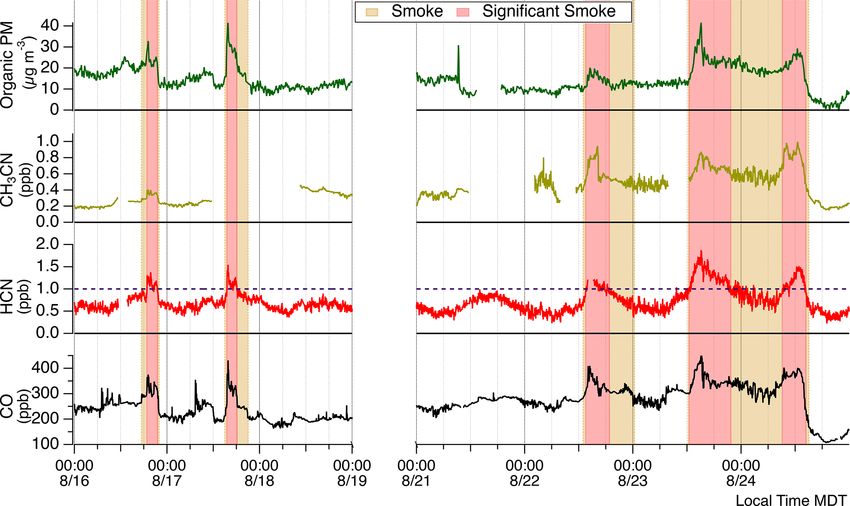
4914                                              A. J. Lindsay et al.: Ground-based investigation of HOx and ozone chemistry

Figure 2. Time series of smoke tracers. Tan shading represents smoke presence, while red shading signifies significant smoke periods.
Significant smoke periods are defined by HCN concentrations greater than 1 ppbv. This smoke-defining concentration is indicated by the
dashed purple line.

Figure 3. Time series of O3 , NO, NO2 , total peroxy radicals (XO2 ), and aldehydes (HCHO and CH3 CHO). Modeled JNO2 frequencies
and calculated parameters of P (Ox ) and P (ROx ) are also provided. The red shading indicates periods of smoke influence, while somewhat
smoky periods are shaded tan. P (Ox ) is shown in both 16 min averages (blue circles) and 2 min data (gray points). The dashed JNO2 trace is
entirely simulated by NCAR TUV model, whereas the rest of the data are derived from ARISense solar irradiance measurements.

Atmos. Chem. Phys., 22, 4909–4928, 2022                                                    https://doi.org/10.5194/acp-22-4909-2022
A. J. Lindsay et al.: Ground-based investigation of HOx and ozone chemistry                                                4915

dynamics (Roberts et al., 2020). Figure 2 presents McCall          started at ∼ 15:30 MDT and persisted until 18:15 MDT. This
site observations and indicates smoke-impacted time periods        is consistent with the 16:00 and 18:00 MDT back trajectories
when ECHAMP was actively sampling and the AML was                  that show that air sampled during that period was transported
present. The lowest concentrations of HCN, CH3 CN, CO,             past an active fire approximately 60 km southwest of the Mc-
and OA were all observed on 24 August, suggesting the air          Call, Idaho, site. Though an uncontrolled portion of the Mesa
sampled up until then was always somewhat affected by BB           Fire may have also contributed to these smoky conditions, the
emissions. We experienced five distinct smoke-impacted pe-         HYSPLIT trajectories would suggest earlier smoke influence
riods evident by clear enhancements of HCN along with or-          possibly starting near 14:00 MDT. The smoke likely traveled
ganic PM and CO. The periods of greatest smoke influence           between 3–5 h to get to the McCall site from the unspeci-
(red shaded regions in Fig. 2) were identified by sustained        fied active fire for the 17 August example shown. Figures
periods of HCN concentrations greater than 1 ppbv. General         showing HYSPLIT trajectories for other smoke-influenced
smoke presence (tan shaded regions in Fig. 2) was identified       days are included (Sect. S4). The likely sources and smoke
before and after each significant smoke period when back-          ages for other events are detailed here. The 16 August smoke
ground smoke tracer concentrations remained elevated com-          event was likely sourced from the same unspecified wildfire
pared to stable background air. There were distinct smoke          ranging in age between 4–10 h. The smoke on 22 August
periods in the early evenings of 16 and 17 August. These oc-       was likely 12–18 h or longer and sourced from an unspeci-
curred from 18:48 to 21:55 MDT on 16 August and 15:27 to           fied fire located east between the McCall site and the Rabbit
18:15 MDT on 17 August. While appreciable enhancements             Foot Fire. The 23 August smoke was likely sourced from
in CO were observed during both of these periods, a signif-        the southwest from another unspecified fire at an age of 12–
icant OA enhancement of ∼ 20 µg m−3 was only observed              18 h, though the Mesa Fire may have contributed here. The
during 17 August. For the period 21 to 24 August, smoke            smoky conditions of the morning of 24 August were likely
events occurred at earlier times. Periods of significant smoke     from wildfires in central Oregon aged 18–30 h until espe-
influence on 22, 23, and 24 August were from 12:55 to 16:34,       cially clean air was sourced from northern Oregon beginning
12:26 to 17:07, and 07:42 to 15:00 MDT, respectively. The 22       at approximately 12:00 MDT.
August smoke event had minimal enhancement of OA. The
smoke event on 23 August was quite distinct with the great-        2.5   Calculations
est HCN concentrations observed for the entire campaign.
After this 23 August significant smoke period highlighted in       Ozone enhancement ratios 1O3 /1CO from smoke influence
Fig. 2, concentrations of HCN, CO, and OA decreased but re-        were determined for the most distinct BB events of 16, 17,
mained at levels above background concentrations until the         and 24 August. For the 17 and 24 August events, the ozone
24 August event. Following the 24 August significant smoke         enhancement ratio was determined using the York bivariate
period, CO and OA decreased to their lowest observed con-          linear regression method (York et al., 2004) using a continu-
centrations indicating that we were sampling an air mass with      ous section of O3 and CO data that includes 60 min of back-
minimal smoke influence.                                           ground air, a transitional smoke period (tan shaded regions
   We identify the sources of the observed smoke by pair-          in Fig. 2), and 60 min of significant smoke period data (red
ing NOAA Air Resources Laboratory HYbrid Single Particle           shaded regions in Fig. 2). Enhancements in NO2 were typi-
Lagrangian Integrated Trajectory (HYSPLIT) (Stein et al.,          cally under 0.2 ppbv, and so the difference between consid-
2015) model back trajectories with satellite-detected wild-        ering 1Ox (Ox = O3 + NO2 ) and 1O3 was negligible. The
fire locations (Lindaas et al., 2017; Rogers et al., 2020). Fig-   linear regressions are included in the Supplement (Fig. S8).
ure 1a shows all wildfires detected for the date range we          1O3 /1CO for the 16 August event was determined using
focus our analyses on. Three well-documented fires are in-         Eq. (1) with O3 and CO data collected during a stable pe-
dicated: the Mesa Fire, the Rattlesnake Creek Fire, and the        riod at the start of the significant smoke period and a stable
Rabbit Foot Fire. The Mesa Fire, located 38.3 km south-            background prior to smoke presence.
west of McCall, was responsible for burning 34 700 acres           1O3 /1CO =([O3 ]Smoke − [O3 ]Background )/ ([CO]Smoke
(∼ 14 000 ha) and started on 26 July 2018 (FWAC, 2021b).
                                                                               −[CO]Background )                              (1)
The Rattlesnake Creek Fire started on 23 July 2018 and
burned over 8000 acres (> 3300 ha) (FWAC, 2021c). The              This event had a temporary depletion in O3 by ∼ 20 ppbv
Rabbit Foot Fire began on 2 August 2018, burned 36 000             for the start of smoke significance and then returned to near-
acres (∼ 15 000 ha), and was not contained until November          background levels of O3 . 1O3 /1CO values were not cal-
(FWAC, 2021a). Figure 1b shows 17 August as a represen-            culated for the remaining 22 and 23 August smoke events.
tative smoke-impacted day. Shown are bihourly HYSPLIT              These events had less distinct O3 enhancements and occurred
48 h long back trajectories initialized from the McCall site at    at times when O3 also increased during non-smoky time pe-
10 m a.g.l. using archived Global Data Assimilation System         riods.
(GDAS) 1◦ meteorological data. Based on fire tracer obser-            The gross instantaneous OX production rate P (OX ), of-
vations (see Fig. 2), the 17 August significant smoke period       ten referred to as P (O3 ), is the rate at which NO is con-

https://doi.org/10.5194/acp-22-4909-2022                                          Atmos. Chem. Phys., 22, 4909–4928, 2022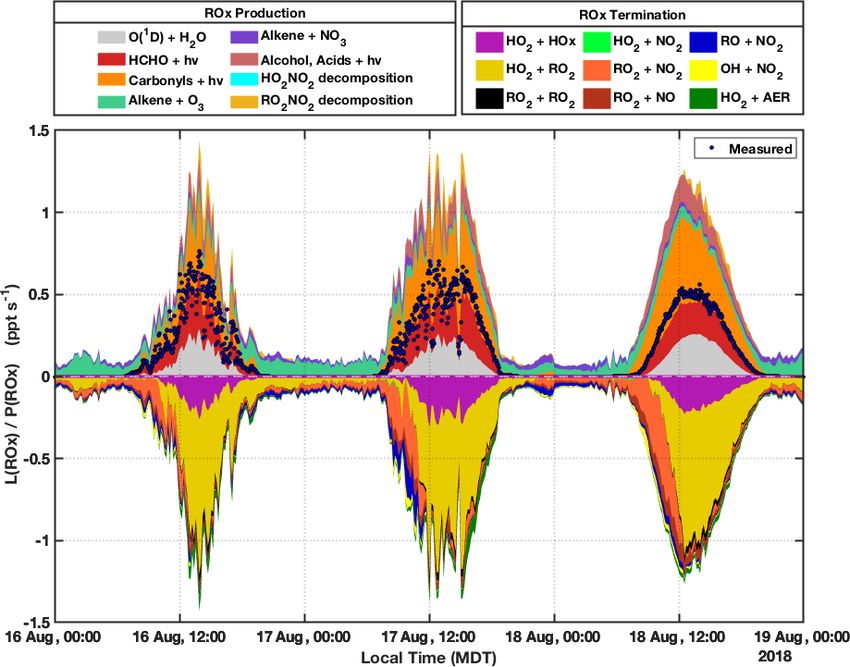
4916                                              A. J. Lindsay et al.: Ground-based investigation of HOx and ozone chemistry

verted to NO2 by reaction with HO2 or RO2 (Eq. 2). Since              acetone, isoprene, speciated monoterpenes, MVK, MACR,
we measure the sum of HO2 and RO2 , we calculate P (Ox )              and MBO. While F0AM allows for total NOx to be con-
with Eq. (3) using ECHAMP XO2 and AML-based QC-                       strained, we instead constrained NO and NO2 individually.
TILDAS NO measurements. Noting that the differences be-               Model results obtained using total NOx constraints led to
tween kHO2 +NO and most kRO2 +NO rate constants are small             nearly identical daytime XO2 predictions but with unrealis-
(Anderson et al., 2019), we use an effective rate constant            tic nighttime XO2 values. The base MCM mechanism, re-
(keff ) equal to kHO2 +NO . P (Ox ) from box model results were       ferred to as “MCM-base” from here on, was augmented for
calculated using Eq. (2) and the model HO2 and speciated              two additional F0AM simulations. First, the MCM-base was
RO2 concentrations.                                                   expanded by including additional chemistry for BB-related
                                                                      VOCs (referred to as “MCM-BBVOC”) of furan, methyl
P (Ox ) =kHO2 +NO [HO2 ][NO]                                          furan, furfural, methyl furfural, and guaiacol by manually
          X
        +   kRO2(i)+NO [RO2(i) ][NO]                            (2)   adding the relevant chemical reactions to the MCM as de-
                                                                      tailed by Coggon et al. (2019). Second, a mechanism re-
P (Ox ) = keff [XO2 ][NO]                                       (3)   ferred to as “MCM-BBVOC-het” included heterogeneous
Instantaneous ROx production rates P (ROx ) from measured             chemistry for HO2 loss on organic aerosols in addition to
compounds were calculated using Eq. (4). Each term repre-             the previously detailed BB VOC chemistry. The heteroge-
sents a compound that undergoes photolysis to produce two             neous loss rates are dependent on the predicted [HO2 ] values,
ROx radicals, with compound-specific photolysis rate con-             organic aerosol surface area concentration, an uptake coef-
stants (frequencies) indicated by the J variables. Our cal-           ficient (γ ), and mean molecular speed (Tang et al., 2014).
culated values for P (ROx ) are limited by the lack of mea-           Aerosol surface area concentrations were not measured and
surements for HONO, which is the dominant HOx source in               were instead calculated from mass concentration measure-
freshly emitted BB smoke (Peng et al., 2020; Robinson et al.,         ments by applying a specific surface area. The default spe-
2021). While HONO has a lifetime of ∼ 20 min during day-              cific surface area was set to 4 m2 g−1 . This setting falls
light hours, dark plume conditions and possible photochem-            slightly below the typical values measured for an urban en-
ical formation on aerosol particles may lead to sustained             vironment of Tokyo, Japan (Hatoya et al., 2016). The de-
HONO concentrations. Ozonolysis of measured alkenes had               fault uptake coefficient was 0.20, as recommended by Jacob
minimal contribution to daytime P (ROx ) values and was               (2000). We explored the sensitivity of model results to both
therefore omitted from this calculation but is included in            the specific surface area and uptake coefficient parameters by
model predictions.                                                    varying settings. We also share F0AM results acquired us-
                                                                      ing the GEOS-Chem chemical mechanism. This version of
P (ROx ) =                                                            the GEOS-Chem mechanism uses version 9-02 (Mao et al.,
               2JO1 D [O3 ] k(O1 D+H2 O) [H2 O]                       2013) with isoprene chemistry updates (Marais et al., 2016;
                                                                      Fisher et al., 2016; Travis et al., 2016; Kim et al., 2015). A
  k(O1 D+H2 O) [H2 O] + k(O1 D+N2 ) [N2 ] + k(O1 D+O2 ) [O2 ]         small first-order dilution was implemented for all model ex-
  + 2JHCHO [HCHO] + 2JCH3 CHO [CH3 CHO]                               periments so that all compounds would have 24 h lifetimes
  + 2JCH3 COCH3 [CH3 COCH3 ]                                    (4)   in order to prevent unreasonable accumulation of secondary
                                                                      species with background concentrations for all unmeasured
                                                                      compounds set to 0 ppbv (Wolfe et al., 2016). Initial concen-
2.6    Zero-dimensional modeling
                                                                      trations of unmeasured species were also set to 0 ppbv for
The Framework for 0-D Atmospheric Modeling (F0AM)                     the model results presented in this paper. Minimal changes
box model (v3.2) (Wolfe et al., 2016) was used to evalu-              in model results were observed for additional simulations
ate ECHAMP XO2 measurements and further investigate BB                that included a “spin-up” period in order to determine ini-
impacts on instantaneous chemistry. F0AM simulations were             tial concentrations of unmeasured compounds. As mentioned
conducted for the ECHAMP 2 min time basis for dates on                earlier, HONO is a particularly important ROx precursor in
which AML concomitant measurements were present. Mod-                 BB plumes. In addition to it not being measured during this
eling was conducted separately for the two date ranges of             study, the zero-dimensional models utilized cannot be ex-
interest of 16 to 18 and 21 to 24 August and then com-                pected to accurately predict HONO concentrations since a
bined for analysis. We primarily focus on results acquired            portion of the HONO in the sampled air masses was undoubt-
by employing a subset of the Master Chemical Mechanism                edly emitted directly by the smoke. Furthermore, there are
(MCM) version 3.3.1 (Saunders et al., 2003; Jenkin et al.,            no HONO formation processes in the chemical mechanisms
2003, 2015) that included only the relevant chemical species          besides its homogenous formation from the reaction of OH
in order to avoid unnecessary reactions and improve model             with NO (i.e., there are no heterogeneous formation mecha-
time consumption. The model was constrained with all avail-           nisms). A complete description of our model setup, including
able measurements (see Supplement for full list), includ-             observational constraints and uncertainties, is provided in the
ing concentrations of ozone, formaldehyde, acetaldehyde,              Supplement (see Sect. S7).

Atmos. Chem. Phys., 22, 4909–4928, 2022                                                https://doi.org/10.5194/acp-22-4909-2022
A. J. Lindsay et al.: Ground-based investigation of HOx and ozone chemistry 4917
3 Results and discussion parisons remain impacted by day-to-day variability in O3
from changes in background O3 values, meteorology, and BB
3.1 Smoke influence on ozone and its precursors HCN and O3 precursor emissions. Smoke age also plays a
role in this correlation plot. Based on literature trends where
Figure 3 shows site observations of O3 and relevant measure- 1O3 /1CO values increase with smoke age until an eventual
ments of NOx , total peroxy radicals, and aldehydes. Typ- plateau (Jaffe and Wigder, 2012; Baker et al., 2016; Xu et al.,
ically O3 increased from ∼ 20 ppbv overnight up to daily 2021), young smoke plumes are likely to have smaller O3 en-
maximum concentrations between 50 and 60 ppbv, with the hancements relative to smoke tracers like HCN compared to
greatest O3 concentrations of near 70 ppbv observed on 23 aged plumes. Clusters of data points at HCN concentrations
August. NOx concentrations were consistently low, with typ- below 0.75 ppbv are observed for the 18 and 24 August data
ical daytime [NO] and [NO2 ] values below 0.1 and 1.0 ppbv, sets. For 18 August, there was no distinct BB-influenced pe-
respectively, suggesting O3 production in the NOx -limited riod and little variability in [HCN]. This led to the cluster of
regime (Sillman et al., 1990). Ozone production is further 18 August data points with [O3 ] near 60 ppbv. The 24 Au-
discussed in Sect. 3.2. XO2 typically reached daily maximum gust data cluster near 50 pbbv [O3 ] captures the stable period
concentrations between 40 and 60 pptv. Distinct increases in after [O3 ] is depleted by ∼ 7 ppbv upon smoke departure fol-
[O3 ] and [XO2 ] were observed during some BB events. The lowed by a slow build in concentration. A similar figure with
17 August event had the clearest impact, with [O3 ] increas- O3 plotted against CO but for times specific to the arrival or
ing ∼ 10 ppbv and [XO2 ] increasing ∼ 15 pptv over 45 min, departure of smoke is shown in the Supplement (Fig. S8).
resulting in the maximum [XO2 ] observed of near 70 pptv Daily maximum P (ROx ) values calculated from mea-
for the entire campaign. The 16 and 24 August smoke events sured compounds ranged from 0.45 to 0.65 pptv s−1 (Fig. 3).
had distinct [O3 ] increases but with less notable change in P (ROx ) was dominated by HCHO photolysis and the reac-
[XO2 ]. For 24 August, smoke impacted the site throughout tion of O(1 D) (from O3 photolysis) with water vapor. ROx
the morning and persisted into the afternoon. Ozone concen- production from photolysis of acetaldehyde and acetone was
trations were ∼ 53 ppbv for over an hour until smoky con- of minor importance. Aldehydes were enhanced for some of
ditions dispersed. Ozone concentrations then decreased and the BB events. Typically, HCHO ranged between 1.5 and
remained near 46 ppbv, demonstrating a 7 ppbv elevation as- 4.5 ppbv, and BB events led to enhancements of near 2 ppbv
sociated with the presence of smoke. No distinct impact on for the 16, 17, and 24 August events. This led to distinct
XO2 was observed for this event. The smoke impact on 16 impacts on P (ROx ) and is most evident for the 24 August
August was unique as [O3 ] was depleted by ∼ 10 ppbv upon event. Distinct enhancements in O3 for the 17 and 24 August
smoke arrival, returned to near-background concentrations, events similarly affected P (ROx ). While measurements of
then was again depleted by ∼ 10 ppbv as smoke exited. En- [XO2 ] generally reflect P (ROx ) trends, this was not the case
hancements in [NO2 ] during these periods of depleted O3 for the 17 August event. As XO2 increased by ∼ 27 % upon
were small – only 0.5 and 1.0 ppbv – thus [Ox ] was depleted the arrival of the smoke-affected air mass, P (ROx ) from
as well. This variation in [O3 ] and smoke tracers was likely measured compounds increased by at most 5 %. Changes in
due to different regions of this smoke plume impacting the NOx were mostly negligible during this period, though [NO]
site at different times. The edges of the plume may have been remained below 0.1 ppbv, indicating that small changes in
sampled at the beginning and end of the smoke period and the [NO] could have had a large impact on [XO2 ]. Increases in
plume center sampled during the period with the greatest O3 both [O3 ] and [HCHO] of ∼ 20 % did not contribute to a
concentrations. XO2 responded similarly to O3 and was de- significant increase in P (ROx ) due to a ∼ 30 % decrease in
pleted by ∼ 10 pptv upon the arrival and departure of smoke. [H2 O] (see Fig. S16) and a ∼ 10 % decrease in photolysis
The 23 August event was particularly smoky, with the great- frequencies. The sudden increase in measured [XO2 ] when
est smoke tracer concentrations of HCN, CO, and organic there were only small changes in P (ROx ), NOx , and VOCs
PM, as well as the highest concentrations of O3 for the entire suggests the prominence of unmeasured ROx sources such
campaign. as HONO. Peng et al. (2020) suggested HONO enhancement
For the entire campaign, there is a positive correlation be- ratios (1HONO/1CO) of ∼ 0.1 pptv ppbv−1 for western US
tween daytime O3 (and Ox ) concentrations and smoke tracer wildfire BB plumes aged 3 h, the likely age of our smoke
HCN (Fig. 4a), with the highest values for both observed on plume sampled here, causing HONO photolysis to remain a
23 August. Most periods of elevated HCN occurred during significant ROx source even after 3 h of aging. On average,
the times of day when [O3 ] was usually high, even in the HONO accounted for > 90 % and 50 % of P (ROx ) in 30 min
absence of smoke (afternoon or early evening), so the over- aged plumes and 3 h aged plumes, respectively (Peng et al.,
all positive correlation between O3 and HCN may be par- 2020).
tially coincidental. The positive correlation remains, how-
ever, when the analysis is restricted to 2 h periods of after-
noon and early evening data to limit the time-of-day depen-
dence (Fig. 4b and c). These more specific O3 –HCN com-
https://doi.org/10.5194/acp-22-4909-2022 Atmos. Chem. Phys., 22, 4909–4928, 20224918 A. J. Lindsay et al.: Ground-based investigation of HOx and ozone chemistry
Figure 4. Correlation between O3 and smoke tracer HCN for all observations between 09:00 and 22:00 MDT (a), 14:00 and 16:00 MDT (b),
and 16:00 and 18:00 MDT (c). Data points are colored by date collected.
3.2 Ozone production Instantaneous O3 production rates are calculated using NO
and XO2 concentrations (Fig. 3). Gaps in P (Ox ) are due
We describe the extent of ozone formation for the 16, 17, and
to measurement gaps in XO2 when ECHAMP was offline
24 August BB-influenced periods using the commonly used
for calibrations and diagnostic tests. The highest P (Ox ) val-
1O3 /1CO metric. These values depict the O3 produced in
ues occurred on 17 and 18 August during non-smoky peri-
transit to the McCall site while accounting for plume di-
ods between 10:00 and 12:00 MDT, reaching formation rates
lution or overall smoke influence of the site air sampled.
slightly greater than 8 ppbv h−1 . For the entire campaign, me-
1O3 /1CO values were −0.02, 0.06, and 0.03 ppb ppbv−1
dian P (Ox ) peaked at 11:00 MDT at 5.8 ppbv h−1 . As NO
for the 16, 17, and 24 August smoke events, respectively.
concentrations were low and rarely exceeded 1 ppbv, changes
These calculated values fall within the wide variability and
in [NO] had a near-linear impact on P (Ox ). Noisy P (Ox ) pe-
range of literature 1O3 /1CO values for boreal and temper-
riods, such as the entire afternoon of 16 August, are mainly
ate forest fire smoke plumes aged less than 2 d, including nu-
attributed to the atmospheric variability of and measurement
merous examples of ozone depletion for aged plumes (Jaffe
precision for NO. Overall, there is little correlation between
and Wigder, 2012). Though the smoke was likely sourced
P (Ox ) and smoke tracers. However, elevated P (Ox ) during
from the same wildfire for the 16 and 17 August events
the 17 August event is somewhat evident. The ∼ 27 % in-
(Sect. 2.4), we observe O3 depletion on 16 August and O3
crease in XO2 and near-constant value for NO led to this
enhancement on 17 August. 1O3 /1CO values were not cal-
temporary increase in P (Ox ). P (Ox ) increased from ∼ 2.5
culated for the 22 and 23 August smoke events as we were
to 8.9 ppb h−1 during the transition from background air to
unable to attribute the observed increases of O3 to smoke
significant smoke, remained elevated for 34 min, and then re-
influence as they occurred at the same time that O3 usually
turned to near-background P (Ox ) rates. The overall lack of
increased during non-smoky time periods, as mentioned in
impact of BB influence on P (Ox ) is further depicted in the
Sect. 2.5. Ox enhancement ratios are not presented but dif-
P (Ox ) diurnal cycle of Fig. 5. Modeled P (Ox ) results for
fered insignificantly from O3 enhancement ratios as NO2
the same time period are also presented in Fig. 5a with the
concentrations were much lower than O3 concentrations (see
green median trend. These model results were acquired using
Fig. 3).
F0AM with the MCM-BBVOC mechanism. Modeled P (Ox )
Atmos. Chem. Phys., 22, 4909–4928, 2022 https://doi.org/10.5194/acp-22-4909-2022A. J. Lindsay et al.: Ground-based investigation of HOx and ozone chemistry 4919
is consistently greater than measured values, with the great- tured under any model conditions. As discussed in Sect. 3.1,
est discrepancy occurring in the 07:45 to 08:15 MDT period. this discrepancy from 17 August is likely at least partially
This difference is due to modeled [XO2 ] being greater than due to the impact of HONO, which was not measured and un-
measured [XO2 ]. While we present results acquired using likely properly accounted for by the zero-dimensional model.
four unique chemical mechanisms, model-predicted P (Ox ) Observed XO2 on 23 August was high compared to all other
was always greater than measurements, though within the days observed, while modeled XO2 is only somewhat greater
combined uncertainties. than other days. Comparison between daytime XO2 observa-
Figure 5b shows the relationship between P (Ox ), [NO], tions and model results (Fig. 7) was determined using the
and P (ROx ). For P (ROx ) values above 0.4 ppt s−1 , P (Ox ) York bivariate linear regression method (York et al., 2004).
increases almost linearly with [NO] up until at least 400 ppt, Both measured and modeled [XO2 ] are low at night (below
consistent with ozone formation being NOx -limited. The vast 10 pptv). Model XO2 predictions with all chemical mecha-
majority of NO concentrations are below 400 pptv. P (Ox ) at nisms agreed within 10 %.
lower P (ROx ) values (less than 0.2 ppt s−1 ) exhibits much The OH reactivities from the MCM-BBVOC mechanism
more noise and are typically below 2 ppb h−1 . ranged from 5 to 25 s−1 (Fig. 6). These OH reactivities are
divided into several categories based on direct measurements
3.3 Model evaluation
and an “other” category for non-measured model outputs.
The “other” category was often the greatest category, con-
To investigate our understanding of photochemistry in tributing as much as 40 % of the total reactivity at times.
biomass burning plumes we conducted zero-dimensional Incorporating heterogeneous losses to the BB VOC mecha-
modeling constrained by our available measurements exclud- nism (MCM-BBVOC-het results) had nearly no effect on OH
ing ECHAMP XO2 observations. Figure 6 shows a time se- reactivity, and removing BB chemistry (MCM-base results)
ries of model-predicted HO2 , speciated RO2 , OH, and OH re- led to a smaller range in OH reactivity – from 5 to 20 s−1 .
activity acquired using the MCM 3.3.1 with added BB VOC The GEOS-CHEM OH reactivities were lowest, ranging 3
chemistry (“MCM-BBVOC”). Additional results included in to 14 s−1 , due to this mechanism having a limited num-
the Supplement were acquired using the three other mecha- ber of reactions, causing fewer measured compounds to be
nisms: MCM-base, MCM-BBVOC-het, and the base GEOS- constrained. The BB VOC category shown (catechol, furan,
Chem mechanism (Figs. S11–S13). Model [OH] (Fig. 6) methyl furan, furfural, methyl furfural, and guaiacol) was of-
had daily peak values ranging from 0.10 to 0.15 pptv (2– ten the greatest contributor to the portion of OH reactivity at-
3×10⁶ molec. cm−3 ). The MCM-base [OH] results were typ- tributed to measured compounds. BB VOC values were typi-
ically higher but generally agreed within 5 % of the other two cally 2 to 5 s−1 , accounting for 10 % to 30 % of measured re-
altered MCM mechanisms. Daytime GEOS-Chem OH con- activity. This category played a lesser role in the MCM-base
centrations were typically ∼ 75 % higher than the base MCM mechanism as only one measured compound was included
prediction. OH predictions were generally unaffected by – catechol – leading to at most 10 % of measured reactivity.
smoke influence for all mechanisms though upon smoke ar- Reactivity from carbonyls (HCHO, CH3 CHO, acetone, and
rival on 17 August [OH] decreased from ∼ 0.12 to 0.05 pptv methyl ethyl ketone (MEK)) typically contributed 15 % to
for the MCM-BBVOC mechanism, with similar results ob- 20 % of the measured reactivity. The inorganic category typi-
served with the other mechanisms. Modeled XO2 comprises cally accounted for 10 % of measured reactivity, or 1 to 3 s−1 ,
HO2 (typically ∼ 45 %–50 %) and CH3 O2 (∼ 20 %–25 %) and was dominated by CO. The four biogenic categories
and the remaining portion a combination of CH3 CO3 , RO2 included were isoprene, monoterpenes (measured monoter-
derived from isoprene oxidation, and other organic peroxy penes sorted into α-pinene, β-pinene, and limonene), MVK/-
radicals. Measured XO2 , as included in Fig. 3, is over- MACR (methyl vinyl ketone and methacrolein), and MBO
laid on Fig. 6. Daytime modeled [XO2 ] (between 09:00 to (2-methyl-3-buten-2-ol). These categories typically account
21:00 MDT), using the MCM-base, MCM-BBVOC, MCM- for between 30 % to 50 % of the OH reactivity attributed
BBVOC-het, and GEOS-chem mechanisms, is consistently to measured species. Other measured reactivity categories
greater than measured [XO2 ] on average by 28 %, 34 %, were minor and included aromatics (benzene, toluene, C2
27 %, and 20 %, respectively (Fig. 7), all of which are within benzenes, C3 benzenes, and phenol), alkanes (CH4 , C2 H6 ,
the combined 2σ measurement uncertainty (34 %) and pre- and ethyne), and acids (formic acid and acetic acid). The
dicted model uncertainty (25 %), though there are periods “other” category had greatest contributions from carbonyl
in which model values are greater than measured XO2 by compounds. Changes in OH reactivity were observed for
nearly a factor of 2 (i.e., the afternoon of 18 August). The some smoke periods. Subtle changes were noted during the
inclusion of BB chemistry (MCM-BBVOC) increased XO2 16 and 17 August events due to changes in the inorganic,
predictions (compared to MCM-base results), and the inclu- carbonyl, biogenic, and BB VOC portions. A noticeable de-
sion of heterogeneous HO2 uptake (MCM-BBVOC-het) led crease in reactivity from 10 to < 5 s−1 occurred on 24 Au-
to slight decreases (compared to MCM-BBVOC results). The gust upon smoke departure. Decreases in nearly all reactiv-
rapid increase in [XO2 ] observed on 17 August was not cap- ity categories contributed with notable contributions due to
https://doi.org/10.5194/acp-22-4909-2022 Atmos. Chem. Phys., 22, 4909–4928, 20224920 A. J. Lindsay et al.: Ground-based investigation of HOx and ozone chemistry Figure 5. P (Ox ) results derived from 2 min XO2 observations. Panel (a) shows the diurnal profile of all calculated P (Ox ) values. The data points are colored by smoke tracer HCN. The green and blue traces represent 15 min median values of P (Ox ) as determined using measurements and model results, respectively. The provided model results were acquired with F0AM using the MCM-BBVOC mechanism. Panel (b) shows the variation of P (Ox ) with NO. Data are colored by P (ROx ) and sized by [HCN]. depletion in aldehyde concentrations and [CO]. This period colaldehyde accounting for 26 % and 8 %, respectively. Pre- sustained the lowest reactivities for the entire data set while dicted methylglyoxal concentrations were typically between also having the lowest concentrations of smoke tracers. 0.4 and 0.6 ppbv. These concentrations are about an order of Figure 8 shows modeled ROx production and termina- magnitude greater than those measured at mountaintop sites tion acquired using MCM-BBVOC-het mechanism for the (Mitsuishi et al., 2018; Kawamura et al., 2013) but lower period of 16 through 18 August. ROx production is sorted than those observed at a suburban site in China (Liu et al., into several categories, and only net rates are provided for 2020) and in biomass burning plumes observed in the Ama- reversible processes (e.g., net decomposition of peroxy ni- zon (Kluge et al., 2020). Methylglyoxal is largely formed trates). The sum of measurement-based P (ROx ), compris- from the oxidation of MVK and MACR, themselves oxida- ing the reaction of O(1 D) with H2 O and the photolysis tion products of isoprene. A BB-VOC-related dicarbonyl, 4- of HCHO, CH3 CHO, and acetone, is overlaid in Fig. 8 oxo-2-pentenal (listed as C5DICARB within MCM), which (shown speciated in Fig. 3) and typically accounts for be- is formed from methyl furan oxidation, accounted for 13 % of tween 50 %–60 % of total modeled values. For modeled P (ROx ) from carbonyl photolysis. Photolysis of acids and al- P (ROx ), O(1 D) + H2 O and HCHO photolysis both con- cohols contributes up to ∼ 10 % of modeled P (ROx ). Night- tribute ∼ 25 % of predicted ROx production during mid- time P (ROx ) is typically ∼ 0.1 pptv s−1 and is primarily day. Photolysis of carbonyls accounts for most of the re- from alkene ozonolysis (> 80 %) and the reaction of alkenes maining modeled daytime P (ROx ), though only a fraction with NO3 . Net formation of peroxy nitrates RO2 NO2 , mainly (less than 15 %) of this category is from the measured car- PAN, was the dominant modeled ROx sink from the morn- bonyl compounds acetaldehyde and acetone. Unmeasured ing until ∼12:00 MDT most days. Given that neither PAN carbonyls account for the rest, with methylglyoxal and gly- nor the acetyl peroxy radical (CH3 CO3 ) was directly mea- Atmos. Chem. Phys., 22, 4909–4928, 2022 https://doi.org/10.5194/acp-22-4909-2022
A. J. Lindsay et al.: Ground-based investigation of HOx and ozone chemistry                                                     4921

Figure 6. Time series of modeled OH, HO2 , speciated RO2 , and OH reactivity (OHR). These results were acquired using the MCM-BBVOC
mechanism. Periods of smoke are shaded as per Fig. 2. Measured XO2 is included as black markers for comparison. Note that the isoprene
XO2 category includes several RO2 species produced from isoprene oxidation.

sured and that a zero-dimensional model cannot be expected           of these compounds which depend on the history of the air
to accurately model PAN concentrations due to its long life-         mass. XO2 predictions are sensitive to several model inputs.
time, this result is highly uncertain. Midday ROx termi-             Since some secondary compounds’ concentrations build up
nation was dominated by ROx self-reactions, with ∼ 75 %              in the model and can drive significant ROx production, we
of L(ROx ) from HO2 + RO2 and the remainder of L(ROx )               explore the sensitivity of model XO2 predictions to the first-
almost entirely from HO2 + HO2 . Reactions between RO2               order dilution rate constant applied to all compounds. Short-
and other RO2 played a comparatively minor role (< 5 %               ening the dilution lifetime from 24 to 6 h (the minimum value
L(ROx )). Other L(ROx ) categories consisted of reactions of         suggested by Wolfe et al., 2016) decreases model XO2 pre-
RO2 + NO, RO + NO2 , and OH + NO2 . Heterogeneous up-                dictions and reduces the GEOS-Chem XO2 overprediction
take of HO2 generally had small contributions to L(ROx )             from 20 % to 2 % (Fig. S15). The most important unmea-
but at times of elevated PM concentrations such as the BB-           sured radical precursors that are affected by this dilution are
influenced periods 17, 23, and 24 August accounted for up            methylglyoxal, glycolaldehyde, and 4-oxo-2-pentenal due to
to ∼ 10 % of total ROx termination (see Sect. 3.4 for further        their collective contribution to P (ROx ). We also investigate
discussion). Results from the 21 through 24 August period            model XO2 sensitivity to NOx . Increasing NOx inputs by
(see Fig. S17) are similar to the results presented above for        50 % decreases peak daily XO2 predictions by roughly 10 %.
16–18 August, though the unmeasured portion of P (ROx ) is              As the 15 pptv increase in [XO2 ] observed on 17 August is
smaller for the former. This resulted from the considerably          not captured by model simulations, we include HONO as an
smaller concentrations of MVK, MACR, isoprene, and BB                additional model constraint in additional GEOS-Chem sim-
VOCs measured during this period. The smaller portions for           ulations (see Sect. S8). Constrained HONO concentrations
the carbonyls and “alcohols, acids” categories led to smaller        were determined by the product of selected 1HONO/1CO
P (ROx ) totals that peaked near 0.7 pptv s−1 rather than the        values to the measured CO mixing ratios during BB periods.
calculated 1.2 pptv s−1 for the period shown in Fig. 8.              To achieve a similar ∼ 15 pptv XO2 enhancement as mea-
                                                                     sured during the 17 August BB event, a HONO enhancement
                                                                     ratio of near 3 pptv ppbv−1 is required, which provides an
3.4   Model sensitivity                                              additional 0.15–0.60 ppbv HONO throughout the BB period.
                                                                     This 1HONO/1CO value is 30 times larger than observed
There are important fundamental limitations to how well
                                                                     by Peng et al. (2020) for similarly aged plumes. While this
a zero-dimensional model can describe the McCall mea-
                                                                     value is likely unrealistic, larger 1HONO/1CO ratios have
surements. Concentrations of several radical precursors such
                                                                     been reported by Peng et al. (2020). Other unmeasured ROx
as nitrous acid, glycolaldehyde, methylglyoxal, and glyoxal
                                                                     precursors were likely present and at least partially responsi-
were not constrained by measurements and were instead de-
                                                                     ble for the elevated XO2 concentrations observed.
termined by the model. For days on which dilute biomass
                                                                        Model sensitivity to heterogeneous HO2 uptake was
burning plumes arrived suddenly, it is unrealistic to expect
                                                                     also investigated. The introduction of heterogeneous losses
that the model can accurately determine the concentrations

https://doi.org/10.5194/acp-22-4909-2022                                             Atmos. Chem. Phys., 22, 4909–4928, 2022
You can also read