Inferring light responses of primate retinal ganglion cells using intrinsic electrical signatures
←
→
Page content transcription
If your browser does not render page correctly, please read the page content below
bioRxiv preprint doi: https://doi.org/10.1101/2022.05.29.493858; this version posted May 30, 2022. The copyright holder for this preprint (which
 was not certified by peer review) is the author/funder. All rights reserved. No reuse allowed without permission.

 1

 Inferring light responses of primate retinal ganglion cells
 using intrinsic electrical signatures

 Moosa Zaidi1,2,*, Gorish Aggarwal 2,6, Nishal P. Shah2, Orren Karniol-Tambour3,
 Georges Goetz2, Sasi Madugula1,4, Alex R. Gogliettino 4, Eric G. Wu6, Alexandra Kling 2,
 Nora Brackbill7, Alexander Sher 5, Alan M. Litke 5, and E.J. Chichilnisky2,8

 1 Stanford University School of Medicine, Stanford University.
 2 Neurosurgery, Stanford University
 3 Princeton Neuroscience Institute, Princeton University
 4 Neurosciences, Stanford University
 5 Santa Cruz Institute for Particle Physics, University of California Santa Cruz
 6 Electrical Engineering, Stanford University
 7 Physics, Stanford University
 8. Ophthalmology, Stanford University

 *Correspondence: mzaidi@stanford.edu

 Summary

 Reproducing high-acuity vision with an epiretinal implant will likely require inferring the natural
 light responses of diverse RGC types in the implanted retina, without measuring them directly.
 Here we demonstrate an approach that exploits intrinsic electrical features of primate RGCs.
 First, ON-parasol and OFF-parasol RGCs were identified with 95% accuracy using electrical
 features. Then, the somatic electrical footprint, predicted cell type, and average
 linear-nonlinear-Poisson model parameters of each cell type were used to infer a light response
 model for each cell. Across five retinas, these models achieved an average correlation with
 measured firing rates of 0.49 for white noise visual stimuli and 0.50 for natural scenes stimuli,
 compared to 0.65 and 0.58 respectively for models fitted to recorded light responses, an upper
 bound. This finding, and linear decoding of images from predicted RGC activity, suggested that
 the inference approach may be useful for high-fidelity sight restoration.

 Keywords: neural interfaces, neural implants, neural prostheses, retinal interfaces, retinal
 implants, retinal prostheses, brain computer interface, brain machine interface, artificial vision,
 vision, retina, cell type
bioRxiv preprint doi: https://doi.org/10.1101/2022.05.29.493858; this version posted May 30, 2022. The copyright holder for this preprint (which
 was not certified by peer review) is the author/funder. All rights reserved. No reuse allowed without permission.

 2

 Introduction
 Epiretinal implants are designed to provide artificial vision to patients blinded by degenerative
 photoreceptor disease, by electrically stimulating retinal ganglion cells (RGCs) in a way that
 transmits useful visual information to the brain.1,2 However, the primate RGC population consists
 of over 20 distinct, intermixed cell types, each of which conveys distinct visual information to
 distinct targets in the brain.3,4 In contrast with this diverse and specific neural circuitry, current
 epiretinal implants indiscriminately stimulate collections of nearby RGCs without regard to cell
 type, resulting in unnatural activation patterns (e.g. simultaneous activation ON and OFF cells)
 and limited vision restoration. No device has been developed that harnesses the accumulated
 scientific knowledge of the distinct functions of the diverse RGC types to reproduce the neural
 code of the retina. The development of such a device could improve artificial vision, and could
 pave the way for leveraging scientific understanding in neural implants of many kinds.

 An ideal device that replicates the neural code would first infer, for any given incident visual
 image, how each RGC would have fired in the healthy retina, and would then electrically
 stimulate each cell to fire in this predicted pattern. Recently, electrical stimulation of RGCs at
 single-spike, single-cell resolution has been achieved in the isolated retinas of macaques,5–7 and
 humans,8 supporting the possibility of this kind of precise RGC activation. However, inference of
 the desired RGC activity remains a challenge. While several accurate RGC light response
 models have been developed (e.g. 9,10), these models have always been fitted using measured
 RGC light responses, which is not possible in the retina of a blind person. Thus, a means of
 inferring normal RGC light responses in a degenerated retina is needed. One possible approach
 is to build a model of light response for each cell from intrinsic features of its recorded electrical
 activity. Indeed, the feasibility of deducing the cell type, a crucial determinant of a cell’s light
 response properties, from electrical features alone has recently been demonstrated.11 However,
 the reliability of this cell type inference remains a challenge, and the feasibility of inferring a full
 light response model using only information extracted from intrinsic electrical features has not
 been tested.

 This paper represents the first effort to infer from intrinsic RGC electrical features a full
 end-to-end quantitative light response model, and to test the results using measured light
 responses in the same retina. First, a cell type classifier was designed to identify two major
 RGC types in the macaque retina from electrical features measured on a multi-electrode array,
 without access to light responses. Then, the electrical footprint of each cell's action potential on
 the array was used to infer the receptive field location of each cell. Next, the predicted cell type
 and predicted receptive field location were combined to infer a full light response model for each
 cell. Finally, the accuracy of the inferred light response models was assessed by comparing
 their predictions to the measured light responses of each cell, and also by decoding images
 from predicted and observed light responses of the full RGC population. The results suggest
 that the approach produces predictions that largely preserve visually meaningful information and
 thus may be useful in future high-fidelity retinal implants.
bioRxiv preprint doi: https://doi.org/10.1101/2022.05.29.493858; this version posted May 30, 2022. The copyright holder for this preprint (which
 was not certified by peer review) is the author/funder. All rights reserved. No reuse allowed without permission.

 3

 Results

 To infer and test RGC light response models, electrical recordings from isolated macaque retina
 were performed ex vivo using a 512-electrode array system.12,13 For each cell, intrinsic features
 of the recorded electrical activity were used to infer first its type and then a light response
 model. The accuracy of the inferred model was then assessed by comparing its predictions to
 observed responses to visual stimuli, and also by reconstruction of visual stimuli from recorded
 responses.

 Separating ON-parasol and OFF-parasol cells from other cell types

 An epiretinal implant targeting certain cell types for stimulation must be able to distinguish them
 from all other recorded cells. Therefore, the feasibility of separating ON-parasol and
 OFF-parasol cells, two of the numerically dominant cell types in the primate retina,14 from all
 other recorded types using only intrinsic features of electrical activity was tested. The axon
 conduction velocity of each cell, estimated from the propagation of spikes along the axon over
 the multi-electrode array, was effective for this purpose (Fig. 1): parasol cells exhibited a
 relatively higher axon conduction velocity, while ON-midget, OFF-midget, small bistratified cells,
 and unidentified cell types, had lower axon conduction velocities,15,16 with nearly
 non-overlapping distributions. The remaining analysis focuses on the ON-parasol and
 OFF-parasol cells.

 Figure 1, Distinguishing parasol cells by axon conduction velocity. Histograms show axon conduction velocity
 estimates for 216 of the 946 cells in a single recording, including: 59 OFF-parasol and 40 ON-parasol cells (top); 83
 OFF-midget and 18 ON-midget cells (middle); and 2 small bistratified cells and 14 cells of other types (bottom). The
 remaining 730 cells were excluded on the basis of too few axonal electrodes for an accurate estimate, or a spatial
 pattern of axonal electrode locations suggestive of a polyaxonal cell.17 ON-parasol cells and OFF-parasol cells tend to
 have higher axon conduction velocities than other cell types.15,16
bioRxiv preprint doi: https://doi.org/10.1101/2022.05.29.493858; this version posted May 30, 2022. The copyright holder for this preprint (which
 was not certified by peer review) is the author/funder. All rights reserved. No reuse allowed without permission.

 4

 Cell type classification
 Accurately inferring light response models for the ON-parasol and OFF-parasol cells requires
 separating the cells of the two types using only features of intrinsic electrical activity (i.e., no
 light response data). Two such features were examined.

 The first feature was the autocorrelation function (ACF) of the recorded spikes from each cell.
 The ACF indicates the firing probability of a cell as a function of time after the occurrence of a
 previous spike; its form reveals temporal patterns of spiking behavior and tends to be distinct in
 different RGC types (see Methods).18,19 In any given retina, the ACFs of ON-parasol and
 OFF-parasol cells were usually distinct from one another (Fig. 2A, 2B). When each retina was
 analyzed individually, k-means (k=2) clustering of the top two principal components of the ACFs
 resulted in an average 94% separation of ON-parasol and OFF-parasol cells (see Methods),
 with 100% separation achieved for 5 of the 29 recordings. However, due to inter-retina variability
 in the form of the ACFs, ACFs were less useful for identification of the two cell types across
 retinas (Fig. 2C). For example, cell type classification using machine learning based on ACFs
 (see Methods) yielded cross-validated classification accuracy of only 65% across 29 retinas. In
 sum, ACFs alone can be used to separate, but not reliably identify, ON-parasol vs. OFF-parasol
 cells.

 The second feature of intrinsic electrical activity considered for distinguishing cell types was the
 recorded voltage waveform associated with the action potential, obtained on the electrode
 recording the largest amplitude spikes from the cell (Fig. 2D). Several features of this spike
 waveform were examined; among these, the maximum negative voltage of the waveform
 provided the most accurate segregation of ON-parasol and OFF-parasol cells. Although there
 was considerable inter-retinal variation in this quantity, ON-parasol cells had consistently higher
 mean waveform maximum than OFF-parasol cells from the same retina (Fig. 2E, 2F, 2G). The
 inter-retinal variation was accounted for by normalizing the waveform maxima of all parasol cells
 in each retina to have zero mean and unit variance. After training on data from 246 recordings
 from 148 retinas with rapidly generated (imperfect) cell type labels and testing on data from 29
 recordings from 29 retinas with carefully curated cell type labels, classification with normalized
 spike waveform maxima alone achieved a mean accuracy of 63%. Inclusion of spike waveform
 features recorded from other electrodes did not significantly improve classification accuracy (see
 Methods). Classification using logistic regression on normalized waveform maximum and 10
 additional, similarly normalized features of the waveform (see Methods) increased mean
 accuracy to 68% (Fig. 2H). Use of neural network based classifiers, applied either to these
 normalized features or to the waveforms on multiple electrodes, increased accuracy (76%), but
 not in a way that influenced subsequent inference stages (see below). In sum, features of the
 spike waveform alone imperfectly identify ON-parasol vs. OFF-parasol cells.
bioRxiv preprint doi: https://doi.org/10.1101/2022.05.29.493858; this version posted May 30, 2022. The copyright holder for this preprint (which
 was not certified by peer review) is the author/funder. All rights reserved. No reuse allowed without permission.

 5

 These results suggest a combined approach to cell type identification: separate the ON-parasol
 and OFF-parasol cells of each retina using their ACFs, and then identify the clusters using
 features of the spike waveform. Using k-means clustering on the top two principal components
 of the ACF and then identifying clusters by “voting” using the spike waveform classifier
 predictions achieved 80% mean (93% median) accuracy on the training retinas and 93% mean
 (97% median) accuracy across the 29 test retinas (Fig. 2J). In sum, a combination of ACF and
 spike waveform information can reliably identify ON-parasol and OFF-parasol cells.

 To further improve the accuracy of cell type classification, ACF based clustering was optimized.
 While k-means clustering on the first two principal components (PCs) of ACFs was more
 accurate than any other fixed number of PCs, using a different number of top PCs for different
 retinas was more accurate. Furthermore, despite inter-retina variability, the clustering accuracy
 of some retinas improved with including as clustering features projections onto the top PCs of
 the pooled ACFs of all retinas, termed global ACF PCs, in addition to projections onto the top
 PCs from the same retina, termed local ACF PCs. Therefore, in the optimized approach, varying
 numbers of top local ACF PCs and global ACF PCs were used to generate 100 candidate
 clusterings per retina. Without knowledge of true cell types, the optimal choice among the
 candidate clusterings was taken to be the clustering that maximized agreement with the initial
 spike waveform classifier predictions while avoiding excessive imbalance in the predicted ratio
 of cell types (see Methods). With selected candidate clusters labeled according to spike
 waveform classifier votes as before, this optimized approach increased overall cell type
 prediction accuracy to 83% mean (95% median) accuracy on the rapidly labeled training data
 and to 95% mean (97% median) accuracy on the carefully labeled testing data (Fig. 2K).
 Substituting a neural network based classifier utilizing the waveforms of multiple electrodes did
 not increase this final accuracy: 79% mean (94% median) accuracy on training data and 93%
 mean (98% median) accuracy on test data.
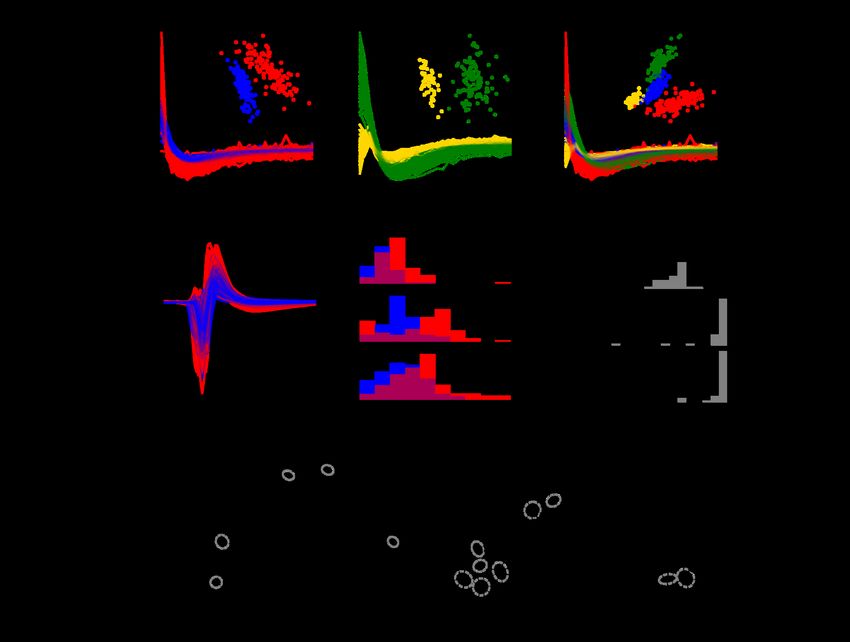
bioRxiv preprint doi: https://doi.org/10.1101/2022.05.29.493858; this version posted May 30, 2022. The copyright holder for this preprint (which
 was not certified by peer review) is the author/funder. All rights reserved. No reuse allowed without permission.

 6

 Figure 2: Cell-type Identification among ON and OFF parasol cells. A and B: Comparison of the autocorrelation
 functions (ACFs) of ON-parasol cells (red in A, yellow in B) and those of OFF-parasol cells (blue in A, green in B), for
 two retinas (A and B). Insets show projection of each ACF onto the top two principal components across all ON and
 OFF parasol cells within that retina. C: ACFs from A and B plotted together and projected onto common principal
 components (inset). D: Main somatic spike waveforms extracted from ON (red) and OFF (blue) parasol cells in one
 retina. E, F, G: Overlaid histograms of the maximum negative value (the strongest electrode waveform feature, shown
 here as an example), for ON (red) and OFF (blue) parasol cells within a retina, shown for three separate retinas. H:
 Histogram of classification accuracy across retinas achieved with spike waveform features alone. J: histogram of
 classification accuracy achieved using combined approach of ACF-based clustering using the top two principal
 components and spike waveform based labeling. K: histogram of classification accuracy achieved using an extension
 of the approach shown in J in which multiple candidate clusterings are considered. L: Mosaic of receptive fields (1SD
 contours of Gaussian fits) of the OFF-parasol cells of an example retina. Cells incorrectly labeled by the approach
 shown in K are indicated with gray dashed ovals. M: same as L, but the mosaic of ON-parasol cells for the same
 retina.
bioRxiv preprint doi: https://doi.org/10.1101/2022.05.29.493858; this version posted May 30, 2022. The copyright holder for this preprint (which
 was not certified by peer review) is the author/funder. All rights reserved. No reuse allowed without permission.

 7

 Inferring a light response model for each cell
 To infer the light response properties of each RGC, the inferred cell type was used to construct
 a linear-nonlinear Poisson (LNP) cascade light response model, and the accuracy of model
 predictions was assessed.20 In the LNP model, the visual stimulus passes first through a linear
 spatiotemporal filter, which integrates across nearby space and recent time to produce a
 univariate generator signal over time. This generator signal passes through a scalar nonlinear
 function to determine the time-varying firing probability, and spikes are generated from this
 probability according to an inhomogeneous Poisson process.

 To estimate the model parameters for each cell using only its inferred type and intrinsic features
 of its electrical activity, a two-step procedure was used. First, the nonlinearity function of each
 RGC was assumed to be the average nonlinearity function for all cells of its inferred type within
 that retina. Second, the linear spatiotemporal filter of each RGC was assumed to have the
 average shape for its inferred type, but translated in space to an inferred receptive field center
 location. To infer the receptive field center of a cell, first its soma center was inferred from its
 electrical image (EI), the spatiotemporal electrical footprint of the action potential on the array.
 The soma center was computed as the weighted average of the locations of the maximum spike
 amplitude electrode and its neighboring electrodes, with weight equal to the spike amplitude of
 that electrode. Exploiting the fact that the receptive field of a cell tends to lie over its soma,21,22
 soma locations were then mapped to visual input space to obtain estimates of receptive field
 centers (Fig. 3; Fig. 4 center). Taken together, these inferred model parameters constituted an
 inferred LNP model for each RGC.

 Figure 3: Inferring receptive field centers from electrical images (EIs). Example EIs with color indicating the timing of
 propagation of the spike from the soma down the axon, and circle size indicating the spike amplitude, at each
 electrode. Receptive fields obtained using light responses (green ellipses with triangle centers) mapped into the plane
 of the electrode array demonstrate the tendency of receptive fields to lie over the soma.
bioRxiv preprint doi: https://doi.org/10.1101/2022.05.29.493858; this version posted May 30, 2022. The copyright holder for this preprint (which
 was not certified by peer review) is the author/funder. All rights reserved. No reuse allowed without permission.

 8

 Testing light response models
 To assess the accuracy of the inferred light response model for each RGC, the response to a
 visual stimulus predicted by the inferred model was compared to a measured response to that
 stimulus. Both natural scenes and white noise stimuli were tested. To control for the stochasticity
 inherent in RGC responses, each visual stimulus was repeated 30 to 60 times. The inferred and
 true responses were similar for most cells (Fig. 4), with an average Pearson correlation
 coefficient of 0.50 for white noise stimuli and 0.53 for natural scenes stimuli across five retinas
 (Fig. 4, bottom, blue).

 To distinguish errors in model predictions attributable to imperfectly inferring model parameters
 from errors attributable to limitations of the LNP model itself, for each RGC, observed light
 responses were also compared to the predictions of a model that was fitted to held-out data.
 Across the same five retinas as above, the true firing rate and fitted model prediction firing rate
 had an average Pearson correlation coefficient of 0.65 and 0.58, for white noise and natural
 scenes stimuli respectively (Fig. 4, bottom). These fitted model predictions establish an upper
 bound on the accuracy that can be achieved by inferring the LNP model as above.

 To test the effect of inter-retina variability on prediction of light responses, the above analysis
 was repeated with the average spatiotemporal filter shape and nonlinearity per cell type
 averaged across multiple retinas, rather than across cells within the retina being tested. Across
 the same five retinas, the models produced a mean correlation between inferred and true
 responses of 0.49 for white noise stimuli and 0.50 for natural scene stimuli (Fig. 4, bottom,
 orange). Overall, these results indicate that cell type is highly predictive of light response
 properties, but that retina-specific information is also significant,23 a potential challenge for the
 development of high-fidelity implants (see Discussion).
bioRxiv preprint doi: https://doi.org/10.1101/2022.05.29.493858; this version posted May 30, 2022. The copyright holder for this preprint (which
 was not certified by peer review) is the author/funder. All rights reserved. No reuse allowed without permission.

 9

 Figure 4: Encoding model inference. Top center: mosaic of true receptive fields (RFs), obtained by fitting to
 responses to white noise visual stimuli (fitted, green), overlaid with the mosaic of receptive fields inferred from
 electrical features (inferred, blue), for the OFF-parasol cells in one retina. Each receptive field is shown as 1 SD
 contour of the Gaussian fit to the corresponding linear spatial filter. For each cell, a gray bar connects its true and
 inferred receptive field center. Top left and Top right: sample firing rate and spike raster across trials for observed
 responses (data), fitted model predictions (fitted), and inferred model predictions (inferred) for two example cells.
 Bottom: average performance (correlation between predicted and observed firing rates) across parasol cells for white
 noise (left) and natural scene stimuli (right) for five retinas, using either the retina-specific cell type averages of RF
 shape, time course, and response nonlinearity for model inference (blue), or the across-retinas cell type averages
 (orange)

 Testing for preservation of visual information

 To test further how effectively the inference of light response models captures visual signaling
 by the retina, linear decoding of simulated natural scene stimuli was performed, using the RGC
 activity predicted by both fitted and inferred encoding models. The linear decoder can be
 interpreted as a simple model of downstream visual processing by the brain, which must make
 inferences about the visual scene to drive behavior (see Discussion). The stimuli consisted of
 natural images (ImageNet database), presented for 100 ms, interleaved with a uniform gray
 background with intensity equal to the mean across images. The interval between image
 presentations was 400 ms, to ensure independence of the evoked responses to each image
 (see Methods). A collection of images and responses was designated as training data for the
 decoder, and other images and responses were designated as test data. The training data were
 used to learn a linear transformation that decoded the images from the combined responses of
 all recorded ON-parasol and OFF-parasol cells, with least squared error (see Methods and
 Brackbill et al.24). This linear decoder was then applied to the test responses, and the resulting
 decoded images were compared to the original images. The similarity between each original
bioRxiv preprint doi: https://doi.org/10.1101/2022.05.29.493858; this version posted May 30, 2022. The copyright holder for this preprint (which
 was not certified by peer review) is the author/funder. All rights reserved. No reuse allowed without permission.

 10

 image and its decoded version was measured by the correlation coefficient. Next, the light
 response model inference method presented above was used to infer RGC responses to the
 images, and the same linear decoder was applied to inferred model predictions.

 Across 150 test images, the mean correlation between true images and images decoded from
 the fitted model RGC responses was 0.81, and the mean correlation between the true images
 and the images decoded from inferred RGC responses was 0.55. This 0.55 mean correlation
 increased to 0.69 if the true rather than inferred cell types were used in inferring RGC
 responses. For comparison, the correlations obtained with randomly permuted true images was
bioRxiv preprint doi: https://doi.org/10.1101/2022.05.29.493858; this version posted May 30, 2022. The copyright holder for this preprint (which
 was not certified by peer review) is the author/funder. All rights reserved. No reuse allowed without permission.

 11

 Discussion
 A two-step approach was used to infer RGC light response models using only intrinsic features
 of electrical activity: first, electrical features were used to infer cell types, and second, cell type
 information was combined with additional information from electrical features to infer a light
 response model for each cell. Although the first step, cell type inference, has been attempted
 previously,11 the 95% accuracy on ON-parasol versus OFF-parasol cell discrimination achieved
 here using a new and more interpretable classification approach and much larger data set
 represent a substantial improvement. The second step, light response model inference, has not
 been attempted previously. The predictions made by the inferred light response models closely
 matched the predictions of models fitted to measured light responses, validating the approach.
 Decoding of stimuli from responses further indicated that the inferred models tend to capture the
 essential properties of normal visual signaling by the retina. More generally, these findings
 indicate that there is enough information present in the intrinsic electrical features of a neuron to
 understand its cell type and detailed function within a circuit, a conclusion with potential
 implications for many brain-machine interfaces.

 In the retina, the findings support the feasibility of a new generation of high-fidelity implants that
 replicate the neural code. Such devices would first use recorded spontaneous activity to infer
 the RGC firing that would have occurred in the intact retina, and then would precisely evoke that
 normal firing pattern using electrical stimulation. Nevertheless, there are several caveats, both
 for light response inference and for its application to the design of retinal implants.

 Caveats to inferring light responses from electrical features

 The present approach is limited by inter-retina variability in RGC encoding properties. The
 analysis focused first on the inference problem in a single retina, by using the average spatial
 filter, temporal filter, and nonlinearity function of cells of that type in the same retina in order to
 model light responses. However, this is unrealistic in the clinical setting. A more realistic
 approach – using these features averaged across multiple retinas – resulted in less accurate
 model inference. However, recent work suggests a third approach. Specifically, it may be
 possible to infer retina-specific encoding properties using psychophysical measurements in the
 implant recipient. In these measurements, the visual percepts generated by electrical
 stimulation designed to emulate different light response models could be compared.23 Notably,
 the proposed psychophysical approach also requires cell type classification, highlighting the
 importance of the cell type inference developed here.

 Most of the present analysis was limited to ON-parasol and OFF-parasol cells, two of the
 numerically dominant cell types in the primate retina. A more complete approach will require
 expanding cell type classification and light response model inference to other cell types. In
 particular, ON and OFF midget cells will be important, given their high density25 and consequent
 importance for high-acuity vision. Identifying and targeting additional cell types may be more
 challenging.
bioRxiv preprint doi: https://doi.org/10.1101/2022.05.29.493858; this version posted May 30, 2022. The copyright holder for this preprint (which
 was not certified by peer review) is the author/funder. All rights reserved. No reuse allowed without permission.

 12

 Errors in identifying the receptive field location of each cell from its electrical image contributed
 substantially to errors in light response inference (not shown). Therefore, future work will
 prioritize techniques to more accurately infer the receptive field location. For example, inferring
 the dendritic field extent of a cell from its EI, in addition to inferring the somatic center, may
 improve inference.22

 The current approach is also limited by the assumption that cells of the same type all have the
 same light response properties, except for receptive field location. Future work will explore
 whether light response model inference can be more tailored to individual cells. For example,
 the electrical image of a cell may contain cell-specific information about the shape or orientation
 of the receptive field. This may be particularly important for cell types with receptive fields that
 are not smooth and circularly symmetric.19

 Finally, the present analysis is limited by the exclusive use of the linear-nonlinear-Poisson model
 of light responses. The choice of encoding model places an upper bound on the accuracy of
 inferred model predictions, and the performance of LNP models fitted to measured responses
 was thus included for comparison. More complex models, such as those that incorporate the
 temporal structure of spike trains,9 cross-correlations in cell firing,10 or nonlinear subunit
 structure in receptive fields,26 could potentially offer higher performance,27–29 but inferring the
 parameters of such models would require developing new methods that do not require access
 to light responses.

 Caveats for application to a future bi-directional retinal implant

 One caveat for applying this approach to the design of a retinal implant is that visually-driven
 electrical activity was used to measure electrical features: in a blind retina, this would have to be
 accomplished with spontaneous firing, which occurs at a lower rate30 and could produce slightly
 different electrical features. Specifically, differences in the ACFs or EIs could complicate cell
 type classification or model inference. The higher firing rate observed during visual stimulation
 indicates that the ACFs must differ to some degree, but further work is needed to fully
 characterize these differences. A smaller difference is expected between the EIs obtained from
 spontaneous and visually-driven activity, since the action potential of a cell is generally highly
 stereotyped. Nevertheless, small variations in recorded EIs with varying visual stimuli have been
 observed in certain RGC types in macaque19 and other species.31,32

 In addition, the electrical features of spontaneous recordings in the healthy retina may not
 accurately represent the electrical features of cells in the degenerated retina, the target for
 retinal implants. Fortunately, the present approach to cell type classification only requires that
 the ACFs of different cell types in a given retina be distinct from each other; the exact nature of
 the ACFs does not affect inference because the EIs provide the final step of cell type
 identification. Interestingly, in a rat model of retinitis pigmentosa, the ACFs of ON and OFF cells
 become more distinct during retinal degeneration (unpublished data). On the other hand, the
 present cell type classification approach does depend on the exact nature of EIs relative to the
 EIs on which the classifier has been trained. Since the EI of a RGC largely reflects its intrinsic
 properties, such as location and density of ion channels, it may be relatively preserved in
bioRxiv preprint doi: https://doi.org/10.1101/2022.05.29.493858; this version posted May 30, 2022. The copyright holder for this preprint (which
 was not certified by peer review) is the author/funder. All rights reserved. No reuse allowed without permission.

 13

 diseases of photoreceptor degeneration, although there is some evidence to suggest
 otherwise.33–35

 An additional caveat to applying these findings to a future human implant is that they were
 obtained in macaque retina. Promising recent results obtained from human retina recordings ex
 vivo, and comparison to hundreds of macaque ex vivo recordings made in a similar
 experimental setting, reveal remarkable functional similarity between human and macaque
 retina, including in responses to light23,36,37 and to electrical stimulation.8

 Finally, realization of the envisioned high-fidelity retinal implant will require development of novel
 hardware that can perform high-density, large-scale recording and stimulation, while maintaining
 the electrodes in close apposition with the retina, and communicating with an external controller,
 all in an encapsulated device that operates within a strict power budget to prevent overheating
 the retina. No present-day hardware can exploit the analytical methods presented here, but
 efforts are underway to develop such a device.38,39

 Future work

 One exciting possibility for improving cell type classification in a future implant is to employ
 psychophysical measurements. Psychophysical methods have previously been used to
 understand phosphenes elicited by axonal and somatic stimulation with the coarse electrode
 arrays of present-day epiretinal implants.40 For cell type classification, an individual cell could be
 electrically stimulated using a high-fidelity implant, and the implanted person could report
 aspects of their perception to help determine the cell type. Alternatively, a group of unidentified
 cells that are believed to be of the same type based on ACF clustering could be simultaneously
 stimulated, generating a stronger visual percept for classification. This ACF-based clustering
 and psychophysics-based cluster labeling approach would be particularly useful if EIs change
 during degeneration but ACFs of different cell types remain distinct (see above).

 The retina is an ideal first application of the present approach, because its neural code is well
 characterized and its accessibility permits electrical stimulation at cellular resolution. Even so,
 the overall approach -- inferring the natural function of neurons from intrinsic electrical features,
 and then reproducing their natural function through electrical stimulation -- could be applicable
 to other parts of the nervous system. For example, recent work41 used the spike waveforms of
 cortical neurons to reveal greater cell type diversity than had previously been appreciated,42–44 a
 finding that could lead to more precise cell type targeting in cortical implants. These and related
 approaches could contribute to a new generation of high-performance neural interfaces.
bioRxiv preprint doi: https://doi.org/10.1101/2022.05.29.493858; this version posted May 30, 2022. The copyright holder for this preprint (which
 was not certified by peer review) is the author/funder. All rights reserved. No reuse allowed without permission.

 14

 Acknowledgements

 We thank J. Carmena, K. Bankiewicz, T. Moore, W. Newsome, M. Taffe, T. Albright, E. Callaway, H. Fox,
 R. Krauzlis, S. Morairty, and the California National Primate Research Center for access to macaque
 retinas. We thank Kristy Berry, K. Williams, B. Morsey, J. Frohlich, and M. Kitano for accumulating and
 providing macaque retina metadata. We thank R. Vilkhu, P. Vasireddy, M. Hays, A.J. Phillips, S. Cooler,
 F. Rieke and the entire Stanford Artificial Retina team for helpful discussions. We thank Stanford Medical
 Scholars Fellowship Program (MZ), Pew Charitable Trusts (AS), Google internship and Student
 Researcher programs (NPS), Research to Prevent Blindness Stein Innovation Award, Wu Tsai
 Neurosciences Institute Big Ideas, NIH NEI R01-EY021271, NIH NEI R01-EY029247, and NIH NEI
 P30-EY019005 (EJC), NIH NEI F30-EY030776-03 (SM), NSF IGERT Grant 0801700 (NB) and NIH NEI
 F31EY027166 and NSF GRFP DGE-114747 (NB) for funding this work.

 Methods

 Experimental overview

 Multielectrode array recordings from isolated macaque retina were obtained using
 previously-described procedures.6,45–48 Briefly, eyes were taken from macaques terminally
 anesthetized by other laboratories in the course of their experiments. The extracted eyes were
 hemisected and the vitreous removed in room lighting. The posterior portion of the eye was then
 kept in darkness in oxygenated Ames’ solution (Sigma) at 33°C. Small (~3 mm) segments of
 retina were then isolated under infrared illumination and mounted on a custom multielectrode
 array, RGC side down. The array consisted of 512 electrodes, 8-10 μm diameter, arranged in an
 isosceles triangular lattice with 60 μm spacing between electrodes in each row and between
 rows. During a recording, voltages were simultaneously recorded from all 512 electrodes,
 bandpass filtered (43-5000 Hz), and digitized (20 kHz). During recording the retina was
 superfused with oxygenated Ames’ solution at 33-35°C.

 Visual stimulation and ground truth cell type determination

 During recordings, visual stimuli were presented on a computer display refreshing at 120 Hz, as
 described previously.24 The mean image intensity was low photopic (~500-1000
 photoisomerizations/photoreceptor/sec). The image was focused on the retina using a
 microscope objective. White noise visual stimuli consisted of a grid of pixels, each 44x44 or
 88x88 μm at the retina, updating at 30 or 60 Hz. At each spatial location, the intensity of each
 monitor primary was selected from a binary distribution (minimum or maximum intensity) over
 time, and these were either yoked (producing black-and-white spatial noise patterns) or
 independent (producing colored spatial noise patterns). Analysis of spatial, chromatic, and
 temporal light response properties of RGCs with these stimuli were used to determine the
 ground truth cell types, as previously described.13,19,20,49 Natural scenes visual stimuli consisted
 of images from the ImageNet database50 converted to grayscale and downsampled to either
 320x160 pixels, with each pixel 11x11 μm on the retina, or to 160x80 pixels, with each pixel
 22x22 μm on the retina. For assessment of preservation of visually significant information (Fig.
bioRxiv preprint doi: https://doi.org/10.1101/2022.05.29.493858; this version posted May 30, 2022. The copyright holder for this preprint (which
 was not certified by peer review) is the author/funder. All rights reserved. No reuse allowed without permission.

 15

 5), each natural scenes image was shown for 100 ms, followed by a uniform gray display at
 mean image intensity for 400 ms, for a total of 500 ms per image.24 For direct comparison of
 predicted and observed responses (Fig. 4), natural scenes images were shown for varying
 duration, without interposing gray display, and with intermittent small translations intended to
 simulate eye movements.24

 Extraction of autocorrelation functions and electrical images

 Spikes from distinct cells were identified and separated using techniques previously described.12
 The spiking behavior of each RGC under white noise stimulation was summarized by its
 autocorrelation function (ACF). The ACF of a cell was computed by counting the total number of
 spike pairs separated by a given time interval, for each of 30 evenly spaced intervals between
 0-300 ms. This vector of spike counts was then normalized (L2). This normalization accentuated
 cell type differences in the ACFs. The spikes from each cell were also used to compute its
 electrical image (EI). The EI consists of the average voltage waveform recorded on each
 electrode during the spikes of a given cell.12

 Distinguishing parasol cells from other cells by axon conduction velocity

 Axon conduction velocity was used to demonstrate the feasibility of distinguishing ON and OFF
 parasol cells from all other recorded cell types without access to light responses.8,15 To estimate
 the axon conduction velocity of a cell, the time of maximum negative voltage within the EI
 waveform was determined for each electrode, after upsampling tenfold in time. Then, for all
 pairs of electrodes recording an axonal signal, a conduction velocity estimate was computed by
 dividing the distance between the electrodes by the time difference. Axonal electrode pairs with
 negative peaks less than one original sample apart (0.05 ms) were excluded. The overall
 conduction velocity for the cell was computed as a weighted average of the conduction velocity
 estimates of all axonal electrode pairs, with the weighting given by the product of maximum
 amplitudes. The top ten weighted pairs were used in the average, and cells with fewer than six
 axonal electrodes were excluded from analysis. Cells with axonal electrodes more than 90
 degrees apart relative to the soma center were also excluded from axon conduction velocity
 estimation because they likely were polyaxonal amacrine cells.17 Subsequent analysis focused
 only on ON-parasol and OFF-parasol cells.

 Classification of parasol cells as ON or OFF using electrical features

 The first step in classifying ON-parasol vs. OFF-parasol cells in each recording using only their
 electrical features was to assign a preliminary label to each using a classifier operating on the EI
 waveform on the maximum amplitude electrode. The classifier used logistic regression applied
 to selected features of the main spike waveform. To extract these features, first the main spike
 waveform was upsampled in time by a factor of ten to obtain a waveform ( ), where ( ) is the
 voltage at time . Given that somatic waveforms tend to consist of a negative deflection followed
 by a positive deflection, temporal information was summarized by six time points: , time of
 minimum voltage, the time of maximum voltage, , first time point before with voltage
bioRxiv preprint doi: https://doi.org/10.1101/2022.05.29.493858; this version posted May 30, 2022. The copyright holder for this preprint (which
 was not certified by peer review) is the author/funder. All rights reserved. No reuse allowed without permission.

 16

 amplitude less than half that at , , ℎ first time point after with voltage amplitude less than
 half that at , and analogously defined , and , ℎ . Then, using these six time points, the
 11 hand-crafted features were then computed as follows: | ( )|, | ( )|, | ( )/ ( )|,
 , ℎ

 , ℎ − , , , ℎ − , , ∑ ( ), ∑ ( ), | ( ) · ( − , )|,
 = = ,

 | ( ) · ( , ℎ − )|,| ( )/( , ℎ − , )|, | ( )/( , ℎ − , )|. To reduce the effect of
 inter-retinal variability, values for each feature were normalized to zero mean and unit variance
 across all the parasol cells within each retina. Feature weights were learned by training on 246
 recordings from 148 retinas with rapidly generated (imperfect) cell type labels, and the classifier
 was tested on 29 recordings from 29 retinas with carefully curated cell type labels. Inclusion of
 the waveform on apparent dendritic electrodes was also considered as a potential feature but
 was found to not significantly improve performance (69% accuracy with these additional
 features and 68% without), therefore only the 11 handcrafted features of the main spike
 waveform described above were used as features for EI-based classification.

 The moderately high accuracy obtained by EI-based classification was significantly improved by
 using the predictions of EI-based classification to label ACF based clusterings. Two approaches
 were considered. In the simpler approach, cells of each recording were clustered using k-means
 (k=2) clustering on projections onto the top two principal components of ACFs for each
 recording. The clusters were then labeled in the way that maximized agreement with the
 preliminary labels. In the second approach, projections of ACF onto a variable number of top
 principal components (1 to 10) of the ACFs of that recording along with a variable number of top
 principal components (1 to 10) of ACFs pooled across recordings were considered as possible
 clustering features. K-means (k=2) was performed on each possible combination to generate a
 total of 100 candidate clusters per recording. Each candidate cluster was assigned cell type
 labels in the way that maximized agreement with the preliminary labels as with the first
 approach. The final clustering was chosen among the candidate clusterings, without knowledge
 of the true labels, as the candidate clustering that maximized agreement with the preliminary
 labels and that did not predict a cell type imbalance of greater than 0.05 and 0.95. This cutoff
 value (5%) and the relative weight of the penalty for violating this cutoff value were learned as
 hyperparameters from the training data.

 Inferring receptive field centers from electrical images

 To aid in inferring light response models from electrical features, receptive field centers were
 inferred from EIs. The soma center location of each cell was taken to be at the electrode with
 the most negative voltage in the EI. Assuming that the receptive field of a cell tends to lie over
 its soma,51,52 these soma centers were then mapped onto visual stimulus space to estimate the
 receptive field centers. Such a mapping was necessary because the soma centers were defined
 in terms of a physical location on the electrode array, whereas receptive field center locations
 were defined in the coordinate space of the visual stimulus. The mapping from electrode space
 to visual stimulus space was the least squares affine mapping from the inferred soma centers to
 the true receptive field centers. In principle, this mapping could have been estimated using the
 measured relationship between the visual stimulus image and retina. In practice, precise
bioRxiv preprint doi: https://doi.org/10.1101/2022.05.29.493858; this version posted May 30, 2022. The copyright holder for this preprint (which
 was not certified by peer review) is the author/funder. All rights reserved. No reuse allowed without permission.

 17

 estimation of the mapping using this approach is difficult, particularly due to slight deformations
 of the photoreceptor layer when the retina is pressed against the electrode array. Determining
 the mapping from electrode space to visual stimulus space without access to the true receptive
 field centers presents a challenge for a future retinal implant. However, a simple constant offset
 in the receptive field centers would likely be more tolerable in the setting of an implant.

 Inferring an encoding model

 The cell type and the inferred receptive field center were combined to infer a
 Linear-Nonlinear-Poisson (LNP) light response model for each parasol cell in five test retinas.20
 The linear portion of the model was decomposed into separate spatial and temporal
 components. The overall model thus consisted of the following sequential components: a linear
 spatial filter, a linear temporal filter, a scalar nonlinearity, and an inhomogeneous Poisson
 process with an instantaneous spike rate given by the output of the nonlinearity. The nonlinearity
 was of the form ( ) = * ( − ), where a, b, and c were parameters of the model, and
 is the cumulative normal function. To infer the model parameters for a cell, the cell was assumed
 to have the average linear spatial filter shape, temporal filter, and nonlinearity for its cell type.
 Both the retina-specific cell type averages and the cell type averages across five retinas were
 considered for these components. The ground truth model parameters used for these averages
 were the parameters obtained by fitting the model to the white noise light responses of each cell
 independently as previously described.20 The spatial filter was centered on the inferred receptive
 field center.

 To test the accuracy of the inferred encoding models, model predictions were compared to the
 observed responses for both white noise and natural scenes visual stimuli. The visual stimuli
 were of the form described above. Each test visual stimulus was repeated 30 to 60 times to
 capture stochasticity in firing across trials. The similarity between the true and predicted
 responses was assessed using the correlation coefficient between the average true and
 predicted firing rate across trials. For comparison, the similarity between the true response and
 the predictions of an encoding model fitted to a separate white noise visual stimulus was
 assessed in the same way.

 Natural scenes decoding

 To assess the effectiveness of inferred models for conveying visual information, linear decoding
 from fitted model-predicted and inferred model-predicted natural scenes light responses was
 performed, utilizing previously described methods24 as summarized below.

 First, a linear decoder was trained using the simulated light responses to 10,000 natural images
 as predicted by the white noise fitted encoding model of a retina. The predicted light response to
 each image was summarized by the expected number of spikes within 150 ms of when the
 image was displayed, for each parasol cell. The linear decoding mapped the expected spike
 counts from all cells to each pixel of the visual stimulus. The weights of the linear mapping were
 selected to minimize the squared error between the decoded images and the images presented.
 The linear decoder was then applied to a distinct set of 150 test images. Both the predicted
bioRxiv preprint doi: https://doi.org/10.1101/2022.05.29.493858; this version posted May 30, 2022. The copyright holder for this preprint (which
 was not certified by peer review) is the author/funder. All rights reserved. No reuse allowed without permission.

 18

 responses of an encoding model inferred from electrical features and the predicted responses of
 the fitted encoding model applied to the training images were considered. Similarity between
 images decoded from inferred model responses and images decoded from fitted model
 responses was assessed visually and by the correlation with the test images.

 Data and Code Availability

 The data/code that support the findings of this study are available from the corresponding
 author upon reasonable request.

 Author Contributions

 NPS, GG, SM, ARG, AK, NB, and EJC collected the experimental data; AS
 and AM. developed and supported the MEA hardware and software; MZ, GA, NPS, OKT, GG,
 and EJC conceived the analysis; MZ, GA, NPS, OKT, and EGW performed the analysis; MZ
 and EJC wrote the manuscript; all authors reviewed and edited the manuscript; and EJC
 supervised the project.

 References

 1. Dagnelie G. Retinal implants: emergence of a multidisciplinary field. Curr Opin Neurol. 2012
 Feb;25(1):67–75.

 2. Palanker D, Goetz G. Restoring Sight with Retinal Prostheses. Phys Today. 2018
 Jul;71(7):26–32.

 3. Dacey DM, Petersen MR. Dendritic field size and morphology of midget and parasol
 ganglion cells of the human retina. Proc Natl Acad Sci U S A. 1992 Oct 15;89(20):9666–70.

 4. Roska B, Meister M. 13 The Retina Dissects the Visual Scene. The new visual
 neurosciences. 2014;163.

 5. Fan VH, Grosberg LE, Madugula SS, Hottowy P, Dabrowski W, Sher A, et al. Epiretinal
 stimulation with local returns enhances selectivity at cellular resolution. J Neural Eng. 2019
 Apr;16(2):025001.

 6. Jepson LH, Hottowy P, Weiner GA, Dabrowski W, Litke AM, Chichilnisky EJ. High-fidelity
 reproduction of spatiotemporal visual signals for retinal prosthesis. Neuron. 2014 Jul
 2;83(1):87–92.

 7. Grosberg LE, Ganesan K, Goetz GA, Madugula SS, Bhaskhar N, Fan V, et al. Activation of
 ganglion cells and axon bundles using epiretinal electrical stimulation. J Neurophysiol. 2017
 Sep 1;118(3):1457–71.

 8. Madugula S, Gogliettino AR, Zaidi M, Aggarwal G, Kling A, Shah NP, et al. Focal Electrical
 Stimulation of Human Retinal Ganglion Cells [Internet]. bioRxiv. 2020 [cited 2021 Jun 25].
 p. 2020.08.23.263608. Available from:
 https://www.biorxiv.org/content/10.1101/2020.08.23.263608v1.abstract
bioRxiv preprint doi: https://doi.org/10.1101/2022.05.29.493858; this version posted May 30, 2022. The copyright holder for this preprint (which
 was not certified by peer review) is the author/funder. All rights reserved. No reuse allowed without permission.

 19

 9. Keat J, Reinagel P, Reid RC, Meister M. Predicting every spike: a model for the responses
 of visual neurons. Neuron. 2001 Jun;30(3):803–17.

 10. Pillow JW, Shlens J, Paninski L, Sher A, Litke AM, Chichilnisky EJ, et al. Spatio-temporal
 correlations and visual signalling in a complete neuronal population. Nature. 2008 Aug
 21;454(7207):995–9.

 11. Richard E, Goetz GA, Chichilnisky EJ. Recognizing retinal ganglion cells in the dark. Adv
 Neural Inf Process Syst. 2015;28:2476–84.

 12. Litke AM, Bezayiff N, Chichilnisky EJ, Cunningham W, Dabrowski W, Grillo AA, et al. What
 does the eye tell the brain?: Development of a system for the large-scale recording of
 retinal output activity. IEEE Trans Nucl Sci. 2004 Aug;51(4):1434–40.

 13. Frechette ES, Sher A, Grivich MI, Petrusca D, Litke AM, Chichilnisky EJ. Fidelity of the
 ensemble code for visual motion in primate retina. J Neurophysiol. 2005 Jul;94(1):119–35.

 14. Dacey DM, Peterson BB, Robinson FR, Gamlin PD. Fireworks in the primate retina: in vitro
 photodynamics reveals diverse LGN-projecting ganglion cell types. Neuron. 2003 Jan
 9;37(1):15–27.

 15. Li PH, Gauthier JL, Schiff M, Sher A, Ahn D, Field GD, et al. Anatomical identification of
 extracellularly recorded cells in large-scale multielectrode recordings. J Neurosci. 2015 Mar
 18;35(11):4663–75.

 16. Dreher B, Fukada Y, Rodieck RW. Identification, classification and anatomical segregation
 of cells with X-like and Y-like properties in the lateral geniculate nucleus of old-world
 primates. J Physiol. 1976 Jun;258(2):433–52.

 17. Greschner M, Field GD, Li PH, Schiff ML, Gauthier JL, Ahn D, et al. A polyaxonal amacrine
 cell population in the primate retina. J Neurosci. 2014 Mar 5;34(10):3597–606.

 18. Devries SH, Baylor DA. Mosaic arrangement of ganglion cell receptive fields in rabbit retina.
 J Neurophysiol. 1997 Oct;78(4):2048–60.

 19. Rhoades CE, Shah NP, Manookin MB, Brackbill N, Kling A, Goetz G, et al. Unusual
 Physiological Properties of Smooth Monostratified Ganglion Cell Types in Primate Retina.
 Neuron. 2019 Aug 21;103(4):658–72.e6.

 20. Chichilnisky EJ. A simple white noise analysis of neuronal light responses. Network. 2001
 May;12(2):199–213.

 21. Creutzfeldt OD, Sakmann B, Scheich H, Korn A. Sensitivity distribution and spatial
 summation within receptive-field center of retinal on-center ganglion cells and transfer
 function of the retina. J Neurophysiol. 1970 Sep;33(5):654–71.

 22. Brown SP, He S, Masland RH. Receptive field microstructure and dendritic geometry of
 retinal ganglion cells. Neuron. 2000 Aug;27(2):371–83.

 23. Shah NP, Brackbill N, Samarakoon R, Rhoades C, Kling A, Sher A, et al. Individual
 variability of neural computations in the primate retina. Neuron [Internet]. 2021 Dec 16;
 Available from: http://dx.doi.org/10.1016/j.neuron.2021.11.026
bioRxiv preprint doi: https://doi.org/10.1101/2022.05.29.493858; this version posted May 30, 2022. The copyright holder for this preprint (which
 was not certified by peer review) is the author/funder. All rights reserved. No reuse allowed without permission.

 20

 24. Brackbill N, Rhoades C, Kling A, Shah NP, Sher A, Litke AM, et al. Reconstruction of
 natural images from responses of primate retinal ganglion cells. Elife [Internet]. 2020 Nov
 4;9. Available from: http://dx.doi.org/10.7554/eLife.58516

 25. Curcio CA, Allen KA. Topography of ganglion cells in human retina. J Comp Neurol. 1990
 Oct 1;300(1):5–25.

 26. Hochstein S, Shapley RM. Linear and nonlinear spatial subunits in Y cat retinal ganglion
 cells. J Physiol. 1976 Nov;262(2):265–84.

 27. Shah NP, Brackbill N, Rhoades C, Kling A, Goetz G, Litke AM, et al. Inference of nonlinear
 receptive field subunits with spike-triggered clustering. Elife [Internet]. 2020 Mar 9;9.
 Available from: http://dx.doi.org/10.7554/eLife.45743

 28. Shi Q, Gupta P, Boukhvalova AK, Singer JH, Butts DA. Functional characterization of retinal
 ganglion cells using tailored nonlinear modeling. Sci Rep. 2019 Jun 18;9(1):8713.

 29. McIntosh LT, Maheswaranathan N, Nayebi A, Ganguli S, Baccus SA. Deep Learning
 Models of the Retinal Response to Natural Scenes. Adv Neural Inf Process Syst.
 2016;29:1369–77.

 30. Troy JB, Lee BB. Steady discharges of macaque retinal ganglion cells. Vis Neurosci. 1994
 Jan;11(1):111–8.

 31. Oesch N, Euler T, Taylor WR. Direction-selective dendritic action potentials in rabbit retina.
 Neuron. 2005 Sep 1;47(5):739–50.

 32. Velte TJ, Masland RH. Action potentials in the dendrites of retinal ganglion cells. J
 Neurophysiol. 1999 Mar;81(3):1412–7.

 33. Chen ZS, Yin ZQ, Chen S, Wang SJ. Electrophysiological changes of retinal ganglion cells
 in Royal College of Surgeons rats during retinal degeneration. Neuroreport. 2005 Jun
 21;16(9):971–5.

 34. Chen Z, Song Y, Yao J, Weng C, Yin ZQ. Alterations of sodium and potassium channels of
 RGCs in RCS rat with the development of retinal degeneration. J Mol Neurosci. 2013
 Nov;51(3):976–85.

 35. Walston S, Lee EJ, Humayun M, Weiland J. Comparison of Ankyrin-G Labeling of Axon
 Initial Segments on Ganglion Cells in Normal and Degenerate Rat Retina. Invest
 Ophthalmol Vis Sci. 2013 Jun 16;54(15):1055–1055.

 36. Soto F, Hsiang JC, Rajagopal R, Piggott K, Harocopos GJ, Couch SM, et al. Efficient
 Coding by Midget and Parasol Ganglion Cells in the Human Retina. Neuron. 2020 Aug
 19;107(4):656–66.e5.

 37. Kling A, Gogliettino AR, Shah NP, Wu EG, Brackbill N. Functional organization of midget
 and parasol ganglion cells in the human retina. BioRxiv [Internet]. 2020; Available from:
 https://www.biorxiv.org/content/10.1101/2020.08.07.240762v1.abstract

 38. Muratore DG, Chichilnisky EJ. Artificial Retina: A Future Cellular-Resolution Brain-Machine
 Interface. NANO-CHIPS 2030 [Internet]. 2020; Available from:
 https://link.springer.com/chapter/10.1007/978-3-030-18338-7_24
You can also read