JOURNAL OF CAVE AND KARST STUDIES - DEDICATED TO THE ADVANCEMENT OF SCIENCE, EDUCATION, EXPLORATION, AND CONSERVATION - National ...
←
→
Page content transcription
If your browser does not render page correctly, please read the page content below
JOURNAL OF                   March 2021
                             Volume 83, Number 1
                             ISSN 1090-6924

CAVE AND KARST
                             A Publication of the National
                             Speleological Society

STUDIES

 DEDICATED TO THE ADVANCEMENT OF SCIENCE,
 EDUCATION, EXPLORATION, AND CONSERVATION
Published By                                                       BOARD OF EDITORS
          The National Speleological Society
                                                                                            Anthropology
                                                                                           George Crothers
              http://caves.org/pub/journal                                               University of Kentucky
                                                                                             Lexington, KY
                            Office                                                      george.crothers@utk.edu
                   6001 Pulaski Pike NW
                  Huntsville, AL 35810 USA                                         Conservation-Life Sciences
                                                                                    Julian J. Lewis & Salisa L. Lewis
                     Tel:256-852-1300                                                    Lewis & Associates, LLC.
                      nss@caves.org                                                             Borden, IN
                                                                                         lewisbioconsult@aol.com

                       Editor-in-Chief                                                     Earth Sciences
                                                                                           Benjamin Schwartz
                     Malcolm S. Field                                                     Texas State University
              National Center of Environmental                                               San Marcos, TX
                     Assessment (8623P)                                                     bs37@txstate.edu
            Office of Research and Development
            U.S. Environmental Protection Agency                                            Leslie A. North
                                                                                       Western Kentucky University
               1200 Pennsylvania Avenue NW
                                                                                           Bowling Green, KY
                Washington, DC 20460-0001                                                leslie.north@wku.edu
           703-347-8601 Voice 703-347-8692 Fax
                   field.malcolm@epa.gov                                                      Mario Parise
                                                                                          University Aldo Moro
                                                                                                Bari, Italy
                     Production Editor
                                                                                          mario.parise@uniba.it
                      Scott A. Engel
                       Knoxville, TN                                                           Carol Wicks
                       225-281-3914                                                     Louisiana State University
                    saecaver@gmail.com                                                      Baton Rouge, LA
                                                                                             cwicks@lsu.edu
                   Journal Copy Editor
                                                                                             Exploration
                                                                                              Paul Burger
                                                                                          National Park Service
                                                                                           Eagle River, Alaska
                                                                                          paul_burger@nps.gov

                                                                                            Microbiology
                                                                                           Kathleen H. Lavoie
                                                                                       State University of New York
                                                                                             Plattsburgh, NY
                                                                                        lavoiekh@plattsburgh.edu

                                                                                            Paleontology
                                                                                            Greg McDonald
                                                                                          National Park Service
                                                                                            Fort Collins, CO
The Journal of Cave and Karst Studies , ISSN 1090-6924, CPM
                                                                                        greg_mcdonald@nps.gov
Number #40065056, is a multi-disciplinary, refereed journal pub-
lished four times a year by the National Speleological Society.
The Journal is available by open access on its website, or check                          Social Sciences
the website for current print subscription rates. Back issues are                         Joseph C. Douglas
available from the NSS office.                                                     Volunteer State Community College
                                                                                              Gallatin, TN
POSTMASTER: send address changes to the National Speleo-                                     615-230-3241
logical Society Office listed above.                                                   joe.douglas@volstate.edu

                                                                                             Book Reviews
The Journal of Cave and Karst Studies is covered by the follow-
                                                                                 Arthur N. Palmer & Margaret V Palmer
ing ISI Thomson Services Science Citation Index Expanded, ISI
                                                                                      State University of New York
Alerting Services, and Current Contents/Physical, Chemical, and
Earth Sciences.                                                                               Oneonta, NY
                                                                                        palmeran@oneonta.edu
                   Copyright © 2021                                 Front cover: Capshaw Cave main passage showing cave stream
       by the National Speleological Society, Inc.                  and location of flood-deposited sediments. See Hart in this issue.
Chris L. Waring, Stuart I. Hankin, Stephen B. Solomon, Stephen Long, Andrew Yule, Robert Blackley, Sylvester Werczynski, and Andrew C.
Baker. Cave radon exposure, dose, dynamics and mitigation. Journal of Cave and Karst Studies, v. 83, no. 1, p. 1-19. DOI:10.4311/2019ES0124
CAVE RADON EXPOSURE, DOSE, DYNAMICS AND MITIGATION
Chris L. Waring1, C, Stuart I. Hankin1, Stephen B. Solomon2, Stephen Long2, Andrew Yule2, Robert
Blackley1, Sylvester Werczynski1, and Andrew C. Baker3
Abstract
Many caves around the world have very high concentrations of naturally occurring 222Rn that may vary dramatically
with seasonal and diurnal patterns. For most caves with a variable seasonal or diurnal pattern, 222Rn concentration is
driven by bi-directional convective ventilation, which responds to external temperature contrast with cave temperature.
Cavers and cave workers exposed to high 222Rn have an increased risk of contracting lung cancer. The International
Commission on Radiological Protection (ICRP) has re-evaluated its estimates of lung cancer risk from inhalation of
radon progeny (ICRP 115) and for cave workers the risk may now (ICRP 137) be 4–6 times higher than previously
recognized. Cave Guides working underground in caves with annual average 222Rn activity 1,000 Bq m3 and default
ICRP assumptions (2,000 workplace hours per year, equilibrium factor F 0.4, dose conversion factor DCF 14 µSv
(kBq h m3)1 could now receive a dose of 20 mSv y1. Using multiple gas tracers (d13CCO2, Rn and N2O), linked
weather, source gas flux chambers, and convective air flow measurements a previous study unequivocally identified
the external soil above Chifley Cave as the source of cave 222Rn. If the source of 222Rn is external to the cave, a strategy
to lower cave 222Rn by passively decreasing summer pattern convective ventilation, which draws 222Rn into caves, is
possible without harming the cave environment. A small net annual average temperature difference (warmer cave air)
due to geothermal heat flux produces a large net annual volumetric air flow bias (2–5:1) favoring a winter ventilation
pattern that flushes Rn from caves with ambient air. Rapid anthropogenic climate change over decades may heat the
average annual external temperature relative to the cave temperature that is stabilized by the thermal inertia of the
large rock mass. Relative external temperature increases due to climate change (Jenolan Caves, 2008–2018, 0.17°C)
reduces the winter pattern air flow bias and increases Rn concentration in caves.
INTRODUCTION
222
Rn is an inert radioactive gas with a half-life of 3.8 days formed from 226Ra as part of the 238U decay series. 220Rn
formed from 232Th decay may be measurable in trace concentrations in caves without adding significantly to total radon
concentration. Further reference to radon in this paper refers to the more abundant isotope 222Rn.
Many of the early cave Rn studies reported high, but variable, Rn concentration, with most expressing a strong sea-
sonal and possible diurnal variation patterns (Gunn et al., 1991; Hakl et al., 1997; Hyland and Gunn, 1994; Middleton et
al., 1991; Solomon et al., 1996; Szerbin, 1996). In the absence of further environmental data, the seasonal pattern with
high Rn in summer was often assumed to be due to greater winter air flow diluting underground Rn accumulation (Tana-
hara et al., 1997; Tremaine et al., 2011). Studies using continuous Rn monitoring in conjunction with environmental mon-
itoring provided greater time resolution to the seasonal patterns, with the addition of caves with the reverse seasonal
pattern (Lario et al., 2005) or no annual variation. The divergence in cave Rn patterns appeared to be associated with
different cave configurations and consequent ventilation patterns leading to cave classification based on 3D configu-
ration influencing ventilation. Addition of gas tracers such as CO2 that may closely correlate with Rn activity (Gregorič
et al., 2013; Kowalczk and Froelich, 2010), and detailed cave temperature measurements also helped constrain the
conceptual model of Rn in caves. However, for many studies, measurement of air flow through the cave is absent and
the source of Rn in caves remains unresolved. To explain fully Rn dynamics in caves, a challenge remains to classify
correctly the 3D void shape and dimensions, consequent ventilation regime and Rn source for the many complex cave
variants. In this paper, we describe a typical chimney effect ventilated cave at Jenolan Caves, Australia and what are
the causes that affect Rn activity in Chifley Cave (Waring et al., 2017). We also infer mechanisms to explain other cave
Rn patterns from selected well described examples.
A cave worker may be exposed to elevated radon concentrations while working underground. The average of the
variable radon concentration while working underground is expressed in units Bq m23 (Becquerels per cubic metre)
and is multiplied by the total time spent underground to estimate cumulative radon exposure, expressed as Bq h m23
(Equation (1)). The International Commission on Radiological Protection (ICRP) advises (ICRP, 2019a) calculating the
effective dose from inhaling radon involves multiplying the average radon level by the time exposed (Rn exposure) and
by the dose coefficient (Equation (2)). Radon level may also be expressed as a radon activity or concentration.
1
Australian Nuclear Science and Technology Organisation, Environmental Research, Sydney NSW 2234, Australia.
2
Australian Radiation Protection and Nuclear Safety Agency, Melbourne VIC 3095, Australia
3
National Parks and Wildlife Service, Bathurst, NSW 2795, Australia
C
Corresponding author: clw@ansto.gov.au, chris.waring2@gmail.com
Journal of Cave and Karst Studies, March 2021 • 1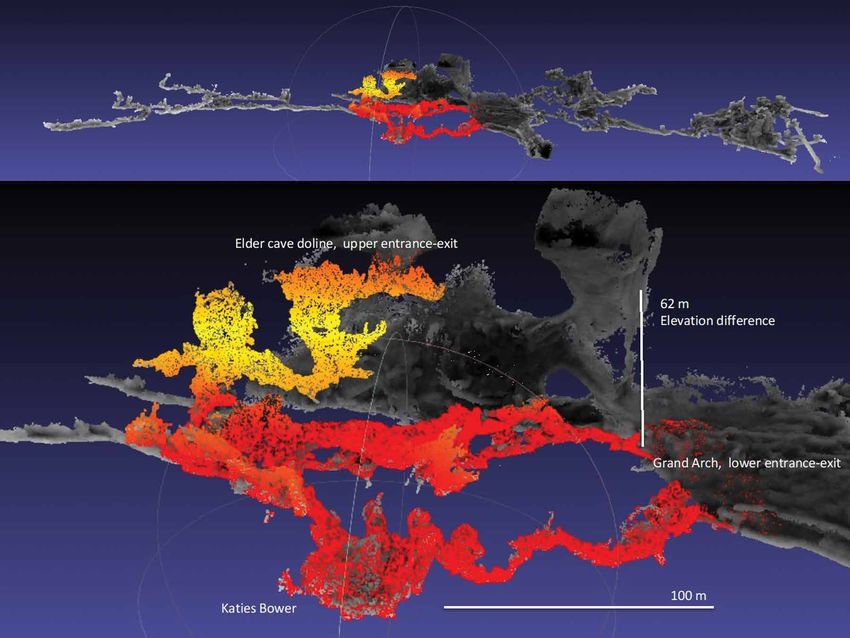
Waring, Hankin, Solomon, Long, Yule, Blackley, Werczynski, and Baker
Radon exposure radon level time exposed (1)
Effective dose radon level time exposed dose coefficient (2)
The dose coefficient may be expressed as the dose conversion factor (DCF) in units µSv per kBq h m3 for simple
calculation of dose, incorporating assumptions of a default equilibrium factor F 0.4. The recommended dose limit for
occupationally exposed workers is 20 mSv y1, averaged over a defined period of 5 years, with no single year exceeding
50 mSv (ICRP, 2007). For cave visitors and the general public, the dose limit is 1 mSv y1 (ICRP, 2007).
A comprehensive review of the health risk to cavers and cave workers (Field, 2007) is based on the known radio-
logical health risk in 2007, ICRP 65 (ICRP, 1993; UNSCEAR, 2000) and dose estimates using the model software
Lungdose 90 (Nikezic and Yu, 2001). The dose estimates for professional cavers (600 h y1) and full-time cave workers
with an assumed time in caves of 2,000 h y1 is calculated based on a dose conversion factor (DCF) of 12.92 µSv
(kBq h m3)1 or 20.75 mSv per WLM (Table 7, Field, 2007). This dose conversion factor is similar to the DCF (15 µSv
(kBq h m3)1 tabulated in ICRP 137 for physically active cave workers, assumed to spend ⅔ time in exercise and the
recommended more general DCF of 14 µSv (kBq h m3)1 for physically active indoor and cave workers in (ICRP, 2017).
Many cave managers will need to consider different strategies for mitigating cave worker exposure to high Rn con-
centrations in caves. We consider the merits and detriments for approaches based on limiting the time exposure of
cave workers, passive modifications to cave ventilation and technologies available to reduce cave Rn concentration.
RADON EXPOSURE AND HEALTH EFFECTS
When radon gas undergoes radioactive decay, a series of radioactive elements, called radon decay products (RDP),
are produced. Some of these RDPs have very short half-lives, and therefore, a significant probability of undergoing ra-
dioactive decay during their time in the lung. The energy deposited by the alpha-radiation emitted during these decays
can damage cells, leading to an increased risk of lung cancer.
The ICRP has estimated that the cumulative risk of lung cancer up to 75 years of age for lifelong non-smokers is
0.4%, 0.5% and 0.7% radon activity of 0 (no radon exposure), 100 and 400 Bq m3, respectively (ICRP, 2010). It should
be noted that the baseline risk of lung cancer for lifelong cigarette smokers is about 25 times that for non-smokers.
Consequently, the corresponding cumulative risk for lifelong smokers is 10%, 12% and 15% radon activity.
The ICRP uses Effective Dose, usually measured in mSv, as a radiation protection quantity. The main uses of effec-
tive dose are the prospective dose assessment for planning and optimization in radiological protection, and demonstra-
tion of compliance with dose limits for regulatory purposes. The ICRP has evaluated the probability of the occurrence
of a stochastic effect, such as cancer, after exposure to radiation at low dose rates of 4.2 × 1025 per mSv for workers
and 5.7 × 1025 per mSv for the general public (ICRP, 1991). To calculate the effective dose due to exposure to radon,
several key quantities must be known or estimated.
The airborne concentration of RDPs is usually quantified in terms of potential alpha energy concentration (PAEC),
measured in units, J m23. The PAEC of RDPs in complete equilibrium with radon is 5.4 × 1029 J Bq21. However, radon
and its progeny are rarely in equilibrium because the RDPs readily plate out onto the surrounding surfaces, removing
them from the atmosphere. The ratio between the actual PAEC and the equilibrium equivalent value is known as the
equilibrium factor. Equilibrium factors from 33 caves (Cigna, 2005) show a wide variation from 0.19 to 0.94. The mea-
surement weighted average equilibrium factor is F 5 0.57, n 5 880 (Table 6, Cigna, 2005). The Jenolan Caves equilib-
rium factor F 5 0.55 (Zahorowski et al., 1998) is very close to the global average (Cigna, 2005).
Exposure to RDPs is measured in terms of the product of PAEC, the breathing rate and the duration of the exposure.
While the SI unit for RDP exposure is J h m23, an historical unit still used in some countries is the Working Level Month,
where 1 WLM 5 3.54 mJ h m23. The unit of Working Level, popular in the U.S., is derived from mine literature for Rn
exposure. 1 WL 5 101.3 pCi L21 or 3,746 Bq m23 of 222Rn in equilibrium with its short-lived decay products.
Historic ICRP Guidelines and Reference Levels
In 1993, the ICRP recommended that dosimetric models should not be used for the assessment and control of radon
exposure (ICRP, 1993). At that time, the ICRP concluded that the epidemiology of radon in mines was a more appropri-
ate indicator of detriment than the more uncertain dosimetric models. The epidemiology led to the so-called conversion
conventions wherein the recommended dose conversion factors (DCFs) were 1.43 mSv (mJ h m23)21 for workers and
1.1 mSv (mJ h m23)21 for members of the public. Using the standard value of 0.4 for the equilibrium factor yields a DCF
in terms of radon concentration of 3.1 µSv (kBq h m23)21 for workers (Table 1). If instead, the equilibrium factor for the
average cave (F 5 0.57) developed by Cigna (2005) or the average for Jenolan Caves (F 5 0.55) Zahorowski et al.
(1998) is used, the DCF is 4.4 µSv (kBq h m23)21 or 4.2 µSv (kBq h m23)21, respectively.
Based on these DCFs, the ICRP recommended that remedial measures should be instituted or its system of radio-
logical protection adopted where radon concentration in workplaces exceeds an action level between 500 and 1,500
Bq m23.
2 • Journal of Cave and Karst Studies, March 2021
Table 1. Summary of changes to International Commission on Radiological Protection; situation
specific tabulation and recommendations for radon.
Radon Progeny Radon
International Rn Exposure Coefficients DCF Factor
Commission Action Radon Dose Increase
on Radiological Level ICRP Assumed Equilibrium Conversion Factors (mSv (mJ h (mSv from ICRP
Protection Year Location (Bq m−3) Factor F (µSv (kBq h m−3)−1) m−3)−1) (WLM)−1) 65
ICRP 65 1993 Home 200 − 600 0.4 ∙∙∙ 1.1 4 ∙∙∙
Workplace 500 − 1,500 0.4 3.1 1.4 5 ∙∙∙
Cave ∙∙∙ 0.4 ∙∙∙ ∙∙∙ ∙∙∙ ∙∙∙
ICRP 115c 2010 Home 200 − 300 0.4 ∙∙∙ 1.4 5 ∙∙∙
Workplace 1,000 0.4 ∙∙∙ ∙∙∙ ∙∙∙ ∙∙∙
Cave ∙∙∙ 0.4 ∙∙∙ ∙∙∙ ∙∙∙ ∙∙∙
ICRP 126d 2014 Home 200 − 300 0.4 ∙∙∙ 3.0 10 ∙∙∙
Indoor Workplace 1,000 0.4 ∙∙∙ 3.0 10 ∙∙∙
Physically Active 1,000 0.4 ∙∙∙ ∙∙∙ ∙∙∙ ∙∙∙
Workplace Including Cave
ICRP 137 para (667) 2017 Most Situations ∙∙∙ 0.4 6.9 3.0 10 2.2
Recommendation
ICRP 137 para (665) ∙∙∙ Homea 200 − 300 0.4 8.5 3.7 13 2.7
Specified Situation
ICRP 137 para (665) ∙∙∙ Sedentary Indoor 1,000 0.4 9.2 4.0 ∙∙∙ 3.0
Specified Situation Workplacea
ICRP 137 para (665) ∙∙∙ Minesa 1,000 0.2 7.6 3.3 12 2.4
Specified Situation
ICRP 137 para (665) ∙∙∙ Physically Active 1,000 0.4 13.1 5.7 20 4.2
Specified Situation Indoor Workplacea
ICRP 137 para (665) ⅔ ∙∙∙ Physically Active 1,000 0.4 15.4 6.7 24 5.0
Time in Exercise Cave Workera
ICRP 137 para (668) ∙∙∙ Physically Active Indoor 1,000 0.4 14.0 6.0 20 4.5
Recommendation Workplace and Cave worker
ICRP 137 para (669) ∙∙∙ Site Specific Cave known 1,000 0.55 19.3 ∙∙∙ ∙∙∙ 6.2
Annex A mJh m−3 Jenolan Caves
Hypothetical Global ∙∙∙ Cigna 2005b equilibrium ∙∙∙ 0.57 20.0 ∙∙∙ ∙∙∙ 6.4
Average Cave factor F global average
a
Estimated dose conversion factors from ICRP specific situation Rn decay product dose coefficients.
b
Global average equilibrium factor 0.57, from 33 caves (Cigna, 2005).
c
ICRP 115 is based fundamentally on epidemiological evidence of risk factors.
d
ICRP 126 dose coefficients use ICRP reference biokinetic and dosimetric models with specified radiation and tissue weighting factors.
Journal of Cave and Karst Studies, March 2021 • 3
Waring, Hankin, Solomon, Long, Yule, Blackley, Werczynski, and Baker
Waring, Hankin, Solomon, Long, Yule, Blackley, Werczynski, and Baker
Other Dose Conversion Factors
Prior to adopting the conversion convention, the ICRP had recommended (ICRP, 1987) a DCF of 10 µSv (kBq h
m23)21 equilibrium equivalent radon concentration, based on a dosimetric model. Using the conversion factors given in
ICRP Publication 50, this DCF is equal to 1.8 mSv (mJ h m−3)21.
The United Nations Committee on the Effects of Atomic Radiation (UNSCEAR) calculated a DCF of 1.6 mSv
(mJ h m−3)21, also based on a dosimetric model (UNSCEAR, 1982). In its 2000 report, UNSCEAR recognized that
more recent calculations with new dosimetric models resulted in higher values of dose conversion factor. However,
UNSCEAR concluded that its calculated value was well within the range of possible dose conversion factors, and there-
fore, should continue to be used in dose evaluations (UNSCEAR, 2000, 2009). An equation in UNSCEAR (Annex B:
p107, 2000) explicitly states the applied equilibrium factor separately from the dose conversion factor. For the equivalent
equation, the ICRP incorporates the default equilibrium factor (F 5 0.4) into published dose conversion factors, omitting
explicit equilibrium factors to calculate dose from Rn exposure (ICRP, 2019a).
Field (2007) applied a dosimetric model from Nikezic and Yu (2001) to calculate doses to workers in caves. This
model was based on the respiratory system model in ICRP Publication 66, “Human Respiratory Tract Model for Radio-
logical Protection” (ICRP, 1994) and results in a dose conversion factor (DCF) of 9.5 µSv (kBq h m23)21 (Field, 2007),
significantly higher than the conversion convention in use by the ICRP in 2007 and different from DCF 5 12.92 µSv
(kBq h m23)21 applied in Field (2007, Table 7). An equilibrium factor of 0.366 is explicitly applied (Equation (9), Field,
2007) in addition to an assumed equilibrium factor of F 5 0.4 incorporated in the DCF. Effectively equilibrium factor is
applied twice for calculation of received dose (Field, 2007, Table 7, reproduced Table 2).
Current ICRP Guidelines and Reference Levels
In 2010, the ICRP published a review of more recent epidemiological studies (ICRP, 2010) and concluded that a
lifetime excess absolute risk of 14 1025 per (mJ h m23) should now be used as the nominal probability coefficient for
radon and radon-progeny-induced lung cancer, replacing the previous value of 8 × 1025 per (mJ h m23) (ICRP, 1993).
Furthermore, the ICRP stated that radon and radon progeny should be treated in the same way as other radionuclides
within the ICRP system of protection, that is doses from radon and its progeny should be calculated using ICRP bioki-
netic and dosimetric models.
RDPs are charged ions that rapidly combine with gasses and vapors in the atmosphere to form particles of a few
nanometers in size. These particles may continue to combine with other sub-micron aerosol particles. When inhaled, the
size of the particles to which the RDPs are attached determines the cells that are exposed to the alpha-radiation emit-
ted by the RDPs. There-
fore, the size distribution
of the aerosols to which
the RDPs are attached is
a critical factor when cal-
culating dose using the
ICRP biokinetic and do-
simetric models. Figure 1
indicates that the most im-
portant size range is those
aerosols with diameters
between 0.1 and 500 nm.
Mines tend to have atmo-
spheres with a greater pro-
portion of larger particles
compared with the much
cleaner atmospheres of
caves. A counter-intuitive
consequence is that mines
tend to have a lower equi-
librium factor (F 5 0.2,
ICRP 137) and DCF than
caves (F 5 0.57, Cigna,
2005) resulting in a 3 times
Figure 1. Effective dose per potential alpha energy exposure as a function of particle size of a monodis- lower dose to mine workers
persed aerosol for a reference worker with an average breathing rate of 1.2 m3 h21 following exposure to
radon (222Rn) progeny. Unit density and a unit shape factor were assumed and hygroscopic growth was than cave workers for the
not taken into account (fitted values from Figure A5 in ICRP 137 (ICRP, 2017). same Rn exposure.
4 • Journal of Cave and Karst Studies, March 2021
Waring, Hankin, Solomon, Long, Yule, Blackley, Werczynski, and Baker
In 2017, the ICRP published new DCFs for the inhalation of radon and its progeny (ICRP, 2017). A tabulation of situ-
ation specific DCFs in ICRP 137 (Table 12.7) lists indoor workplaces as 5.7 mSv (mJ h m23)21 (20 mSv WLM21) and for
the specific case of tourist caves 6.7 mSv (mJ h m23)21 (24 mSv WLM21, 15.4 µSv (kBq h m23)21). In these calculations,
the reference worker is assumed to spend two-thirds of the time in exercise. The ICRP now recommends a DCF of 3
mSv (mJ h m23)21 for miners and sedentary workers and 6 mSv (mJ h m23)21 (14.0 µSv (kBq h m23)21) for active indoor
workers and workers in tourist caves, over four times greater than that previously recommended. These recommen-
dations assume standard particle distributions and an equilibrium factor of 0.4, which differs from the global average
cave equilibrium factor of 0.57 (Cigna, 2005). The ICRP does note that in cases where aerosol characteristics are sig-
nificantly different from typical conditions, sufficient, reliable aerosol data are available, and estimated doses warrant
more detailed consideration, site-specific DCFs could be calculated.
The use of a site specific DCF in caves is challenging due to the high variability of parameters within a cave sys-
tem. Jenolan Caves is one of a few cave systems where a site specific DCF may be calculated from known aerosol
characteristics (Solomon, 2019) for a DCF of 13.27 mSv (mJ h m23) 21 for Temple of Baal cave or 5.67 mSv (mJ h m23)
21
for Katies Bower chamber in Chifley Cave. These same two caves, Chifley and Temple of Baal, were selected for
their different ventilation patterns to provide site-specific continuous measurements of Rn, Rn progeny, condensation
nuclei, and equilibrium factor (Zahorowski et al., 1998) to estimate an annual average equilibrium factor of F 5 0.55,
and therefore DCF 5 19.3 µSv (kBq h m23)21.
RADON MEASUREMENT METHODS
Active measurement of Rn implies an active flow of air past the Rn detector, which typically requires a solid-state
electronic detector to achieve accurate equilibrated measurements in 5 minutes. Passive measurement of Rn relies on
Rn diffusing through a filter or into a chamber to reduce sensor sampling anomalies. A common passive Rn sensor is
polyallyl di-glycol carbonate (PADC) plaque, also known as CR-39 or a nuclear track etch detector, which is capable
of recording cumulative a particle decay from Rn in the chamber leaving a microscopic track that can be made visible
by etching. The number of a particle tracks in the exposed plaque is proportional to the average Rn concentration
multiplied by the exposure time, reported as a cumulative exposure (Bq h m−3) typically over some months. Each track
etch detector has a characteristic diffusion time of up to 1−2 days (Tate and Long, 2016) to establish a Rn concentration
diffusion gradient between external and chamber. The track etch detector is calibrated for a linear response to Rn, after
establishing a diffusion gradient and above a threshold of counted tracks, the minimum reporting level (MRL). When
track etch detectors are deployed as a static cave Rn monitor (Solomon et al., 1996), the time required to establish an
equilibrium diffusion gradient is small (1−2 days) compared to the total exposure time (90 days), resulting in a small
error. Passive Rn detectors are not suitable for use as personal dosimeters for walk-through cave workers where the
dosimeter diffusion time is large (up to 1−2 days) compared to the exposure time (1−2 hours) typical for a cave tour.
There are also many passive digital Rn monitors designed for static indoor household use with an unknown time lag
to establish a Rn diffusion gradient for accurate measurement. These monitors may be deployed for static real-time
Rn measurements within caves. There are a few active digital Rn monitors with a continuous air-flow rate (Rn sniffer)
suitable for the mobile monitoring of walk-through cave workers in a highly dynamic cave environment (10 Rn con-
centration in 4 hours, Figs. 4 and 5). If air flow direction is changed by the usual ventilation change driven by the diurnal
temperature cycle, the equilibrium factor changes independently of Rn concentration because of different aerosol and
condensation nuclei characteristics for different air sources.
In this study, radon activity was measured by recording at 1-hour integrated intervals using a Saphymo Alphaguard
PQ2000 Pro radon monitor. Environmental sensors were placed above the 2.0 m high 0.5 m wide passageway at
Flitch of Bacon (FoB) drip water site near Chifley Cave exit to Grand Arch. Data was recorded at 15-minute intervals
on a Datataker DT80 Series 2 data logger. Air flow direction and velocity data were obtained using a Gill Instruments
Windsonic 2D sonic anemometer.
For Australian show caves including Jenolan Caves, Solomon et al. (1996) measured cave Rn exposure by placing
passive track etch CR-39 detectors throughout the cave system, collected quarterly and calculated cave worker Rn
exposure from time spent on particular cave tours to give seasonal, as well as cave specific, assessments. After 2001,
subsequent Jenolan Caves Rn studies used active measurement techniques and targeted representative sites with
differing ventilation characteristics in Chifley and Temple of Baal Caves (Barnes et al., 2001; Waring et al., 2017; Whit-
tlestone et al., 2003; Zahorowski et al., 1998).
Average annual Rn concentration in Jenolan Caves, 1,021 Bq m−3 (Solomon et al., 1996) is low to moderate in
comparison with the Australian average 610 Bq m−3 and other caves worldwide, 11 Bq m−3 to 47,419 Bq m−3 (Table 2).
Average annual cave Rn concentration may mask the extreme variation from maximum to minimum of approximately
two orders of magnitude (Field, 2007) and differ significantly from the actual average Rn exposure of cave workers.
Journal of Cave and Karst Studies, March 2021 • 5
Waring, Hankin, Solomon, Long, Yule, Blackley, Werczynski, and Baker
Table 2. Summary of international 222Rn literature (modified from Hyland and Gunn (1994) and Field (2007)) for average
annual 222Rn in caves and calculated dose to cave workers assuming hours worked underground (2,000 or 600 hours),
equilibrium factor (0.4 or 0.57) and dose conversion factors. Figures for estimated dose reproduced from Field (2007) Table
7a. Many of the national references include 222Rn measurements from several sourcesb.
DCF DCF
International Summary Cave 222Rn µSv (kBq h µSv (kBq h m3)1
Concentration and Received Dose Table 7a m3)1 14 20
UG hours = UG hours
Mean Annual 2,000 2,000 UG hours 600
222
Rn Conc. Field 2007 ICRP 137 F 0.4 ICRP 137 F
Country Cave (Bq m−3) (mSv y−1) (mSv y1) 0.57c (mSv y1) References
Australia 610 6 (16) 17 7 Solomon et al. (1996)
Jenolan Caves 1,021 ∙∙∙ 29 12 Solomon et al. (1996)
Jenolan Caves 2,146 ∙∙∙ 60 26 this study
Jenolan Caves, Chifley 838 ∙∙∙ 23 10 Solomon et al. (1996)
Jenolan Caves, Chifley 4,578 ∙∙∙ 128 55 this study
China 141 1 (4) 4 2 Wiegand et al. (2000)
Shawan Cave, China 47,419 ∙∙∙ 1,328 569 Wang et al. (2019)
Czech Republic 1,235 12 (32) 35 15 Burian and Stelcl (1990)
Great Britain 2,907 27 (75) 81 35 Hyland and Gunn (1994)
Great Britain 35,890 339 (927) 1,005 431 Gunn et al. (1991)
Great Britain 9,306 88 (240) 261 112 Gillmore et al. (2000)
Great Britain 365 3 (9) 10 4 Gillmore et al. (2002)
Great Britain 315 3 (8) 9 4 Gillmore et al. (2002)
Greece 25,179 238 (650) 705 302 Papastefanou et al. (1986)
Hungary 3,300 31 (85) 92 40 Somogyi et al. (1989)
Hungary 2,468 23 (64) 69 30 Lenart et al. (1990)
Ireland 4,127 39 (107) 116 50 Duffy et al. (1996)
Japan 11 0 (0) 0 0 Miki and Iauthora (1980)
Malaysia 596 6 (15) 17 7 Gillmore et al. (2005)
Poland 1,166 11 (30) 33 14 Przylibski (1999)
Russia 2,390 23 (62) 67 29 Gunn (1991)
Slovenia 1,412 13 (36) 40 17 Kobal et al. (1988)
Slovenia 965 9 (25) 27 12 Kobal et al. (1987)
Postojna Cave LP, 3,255 ∙∙∙ 91 39 Gregorič et al. (2014)
Slovenia
Postojna Cave BC, 2,315 ∙∙∙ 65 28 Gregorič et al. (2014)
Slovenia
Postojna Cave GC, 25,020 ∙∙∙ 701 300 Gregorič et al. (2014)
Slovenia
Spain 108 1 (3) 3 1 Dueñas et al. (1998)
Spain 3,564 34 (92) 100 43 Lario et al. (2005)
Altamira Cave, Hall, Spain 3,041 ∙∙∙ 85 36 Sainz et al. (2018)
Altamira Cave, PC room, 3,286 ∙∙∙ 92 39 Sainz et al. (2018)
Spain
Rull Cave, Spain 1,762 ∙∙∙ 49 21 Pla et al. (2016)
South Africa 267 3 (7) 7 3 Gamble (1981)
Switzerland 25,000 236 (646) 700 300 Surbeck (1990)
United States 1,927 18 (50) 54 23 Yarborough (1976)
United States 2,589 24 (67) 72 31 Eheman et al. (1991)
United States 1,475 14 (38) 41 18 Ahlstrand (1980)
United States 11,678 110 (302) 327 140 Bashor (2004)
Carlsbad Cavern, USA 1,821 ∙∙∙ 51 22 Cheng et al. (2007)
Hollow Ridge #2, Florida 4,733 ∙∙∙ 133 57 Kowalczk and Froelich
(2010)
Global average, Hakl et al. 2,800 ∙∙∙ 78 34 Hakl et al. (1997)
Global average, this study 6,160 ∙∙∙ 172 74 this study
total # of cavesb in Table 2 39 ∙∙∙ ∙∙∙ ∙∙∙ ∙∙∙
# of caves 1,000 Bq m3 29 ∙∙∙ ∙∙∙ ∙∙∙ ∙∙∙
# of caves 20 mSv y1 ∙∙∙ ∙∙∙ 31 24 ∙∙∙
a
Doses of Table 7 in Field (2007) are derived by application of Eqn 9 (Field, 2007, DCF 12.92 µSv per kBq·h·m -3, F 0.366) citing Wiegand et al. (2000) where DCF was applied twice,
contrary to (ICRP, 2019a). DCF assumes an equilibrium factor F 0.4. Divide figures in Table 7, Field (2007) by 0.366 to correct values in parentheses and compare with adjacent dose
estimates.
b
Data quality control likely varies for each study conducted for each country which should be regarded as problematic.
c
Global average equilibrium factor F 0.57 (Cigna, 2005) is applied.
6 • Journal of Cave and Karst Studies, March 2021
Waring, Hankin, Solomon, Long, Yule, Blackley, Werczynski, and Baker
Annual average cave worker Rn exposure is a useful measure when converted to received dose for that individual to
comply with workplace health standards. However, individual cave worker Rn cumulative exposure does not measure
Rn concentration variations in different parts of the cave system, during different seasons or time of day to inform cave
monitoring and mitigation measures.
Average annual Rn activity in a significant majority of caves from all countries, 28 from a total of 38 exceed the
ICRP recommended action level of 1,000 Bq m−3 to reduce Rn exposure in the workplace (Table 2). Cave Rn activity
and the ICRP recommended action level of 1,000 Bq m−3 have remained the same since 1994. However, the calculated
received dose to cave workers has changed markedly from 1994 with a significant majority of full-time cave workers
now expected to receive a radiation dose from Rn in excess of 20 mSv y−1, whether calculated with an ICRP assumed
2,000 workplace hours and equilibrium factor of 0.4 or a more likely 600 hours underground and equilibrium factor of
0.57. Table 2 is a guide to Rn exposure and consequent dose using available annual averages. Actual Rn exposure and
dose to cave workers need to be assessed for each cave and cave worker.
SOURCE OF RADON IN CAVES
Radon is known to accumulate in some homes or poorly ventilated basements where the underlying rock has an el-
evated concentration of U necessary to maintain a high Rn flux to sustain elevated Rn concentrations in enclosed spac-
es. The short half-life of Rn (3.8 days) and short diffusion length through solid rock (Cigna, 2005) dictate that high Rn in
an enclosed space must be replenished by direct diffusion from a high U host rock with permeability (micro-cracking) or
air flow from a relatively high U or Ra source. Some granites and sandstones may have relatively high U concentrations
due to magmatic fractionation or hydrothermal concentration effects. In contrast, unaltered marine limestone typically
has low U concentration, yet may host cave chambers with very high Rn concentrations. The simple mechanism of
direct diffusion or seepage from a high U host rock applicable to enclosed poorly ventilated spaces in homes is unlikely
to apply to the common high Rn found in limestone caves. The implicit direct Rn accumulation from cave host-rocks
(Rn source) assumption in many studies (Fairchild and Baker, 2012; Fernandez-Cortes et al., 2015; Sainz et al., 2018;
Wang et al., 2019) is not supported.
Soil Source of Rn
Cigna (2005) points to three fundamental mechanisms that favor a soil or cave sediment source of Rn compared
with emanation from limestone hosting the cave void:
1. Low concentration of 238U and 226Ra in limestone host rock and relatively high concentration of 238U and 226Ra
in clays,
2. Inability of Rn to escape the CaCO3 mineral lattice, unless very close to the surface (0.02–0.07 µm), and
3. The effective diffusion length of Rn in soil via inter-granular pore space to open cracks and fissures is large
enough to effectively transport Rn to the cave void with convective air transport.
A further uranium concentration mechanism favoring residual soils above karst is the concentration effect by dis-
solution of CaCO3 leaving the less soluble oxides and silicates including clays, effectively concentrating U. Cave sed-
iments may also form in-situ from limestone dissolution, however, an unknown proportion of the less soluble clays,
oxides, and silicates may be transported to the cave and deposited by streamflow. Uranium concentration in seven
cave sediment profiles from the UK (Bottrell, 1991) were found to be generally low (2–4 mg kg21) with one exception at
15−16 mg kg21 compared to external detrital sediments (16−24 mg kg21).
Discriminating Between Cave Accumulation and Soil Source of Rn
The most likely sources of Rn in caves are (1) an external soil source requiring transport of Rn to the cave or (2) the
in-situ accumulation of Rn from internal cave sediments, limestone, drip-waters, or (3) from connected cracks, faults or
open fissures to a high U source rock. All sources of cave Rn are influenced by cave-air convective ventilation that may
produce very similar seasonal cave Rn activity patterns. Cave Rn alone is not a good source discriminant. Time series
correlation of Rn and CO2 showing a strong seasonal pattern (summer high) is used (Pla et al., 2016) to infer a common
accumulation of Rn (513–3,500 Bq m23) and CO2 (565–4,065 ppm) from a cave source, assuming CO2 outgassing
from speleothem growth air-flow Rn emanation from cave walls or sediments. An alternate soil source for CO2 and
Rn transported to the cave by top-down dominant cave ventilation in summer is also possible. Isotopic measurement
of δ13C–CO2 is used (Waring et al., 2017) to discriminate between CO2 derived from speleothem outgassing in a cave
(δ13C 5 19 ‰ VPDB) and CO2 transported from soil (δ13C 5 25 ‰ VPDB) by summer chimney effect convective
ventilation. In addition to δ13CCO2, another conservative gas tracer N2O is relatively abundant in soil gases and not
formed or destroyed in caves. Together these gas tracers unequivocally attributes the source of Rn in Chifley Cave to
the soil above (Waring et al., 2017). Synchronous measurement of Rn source flux, external and cave temperature, cave
air flows, and multiple gas tracers can discriminate between Rn sources and Rn air-flow transport or dilution function.
Journal of Cave and Karst Studies, March 2021 • 7
Waring, Hankin, Solomon, Long, Yule, Blackley, Werczynski, and Baker

Drip-Water Source of Rn
    Radon may also be transported from surface soils to the cave void by dissolved groundwater flow through joints,
fissures and faults (Surbeck, 2005). For this mechanism to be effective groundwater flow to the cave must be rapid
compared to the Rn half-life of 3.8 days. A further constraint on groundwater transport is the requirement for Rn solu-
bility to change causing the outgassing of Rn, potentially by a temperature increase of groundwater along the flow path.
CAVE VENTILATION
Models of Cave Ventilation Patterns
    Cave physiography and temperature contrasts between cave air and external air temperature have a major influence
over cave ventilation, particularly for caves with an upper and lower entrance separated by an elevation difference
(Fig. 2). This configuration may be described as a chimney effect cave with the physics driving cave ventilation de-
scribed in detail in the literature (Atkinson et al., 1983; Badino, 2010; Covington and Perne, 2016; Wigley and Brown,
1971; Wigley and Brown, 1976). In winter, cave air temperature is typically warmer than external air causing the less
dense and relatively warm cave air to rise and expel to the external atmosphere. The converse summer air flow is in the
opposite direction due to relatively cool cave air sinking to expel through the lower cave opening. Bi-directional convec-
                                                             tive air flow through the cave is proportional to the elevation differ-
                                                             ence between upper and lower openings, as well as the magnitude
                                                             of the temperature contrast. On any single day air flow through the
                                                             cave may be in both directions due to relative temperature being
                                                             both higher and lower than cave temperature. Diurnal bi-directional
                                                             cave air flow is most likely in spring and autumn where external
                                                             temperature contrast is both positive and negative with respect to
                                                             cave temperature. A chimney effect summer ventilation pattern
                                                             from top to bottom along the major cave void path also induces a
                                                             slight suction in the cave to draw air slowly into the cave through
                                                             minor openings, cracks, and fissures.
                                                                 Covington and Perne (2016) extends the cave morphology—
Figure 2. Illustration of chimney effect ventilation pattern cave ventilation link to include an additional five variants where
where ventilation through a cave with 2 unequal elevation multiple entrances or exits are considered, relative position of the
openings to the external atmosphere. A relatively con-
stant cool cave temperature implies a dominant down- cave void to entrance or the connection to a large cave chamber
ward air flow in summer, when the external temperature via a small surface opening. A simple classification (Fig. 3) is based
is normally hotter than the cave temperature, driving on geometries described in Covington and Perne (2016), number
convective ventilation through the cave. The converse of entrances or exits (1EE or 2EE), relative position of cave void
pattern holds in winter. On any day, the temperature dif-
ference between cave and the external atmosphere may compared to those equal elevation entrances as either > shape
drive convective cave ventilation in either or both direc- or < shape or the cave chamber elevation relative to a single cave
tions.                                                       entrance. Relative position of the cave chamber to entrance may
be described as either a summer cold air trap (SCAT), if the entrance is higher, or a winter warm air trap (WWAT), if the
entrance is lower. Another mechanism to induce cave airflow is barometric pumping (Barometric), where a large cave
chamber or network is connected to the surface via a single opening.
    For single opening caves where the air mass is warmer than the external temperature, typically in winter, warm air
may exit the cave through a major upper opening with replacement dense cool air seepage into the cave through soil,
restricted openings, or fissures. The term seepage, or air seep, is used to describe slow air flow caused by air density
contrast along a temperature gradient between different temperature air masses, not as a substitute term for diffusion.
In winter, relatively dense cold air on the ground surface and in soil with high Rn may seep into near surface caves along
small cracks and fissures if cave temperature is greater than external temperature, typical for a SCAT configuration.
    A summer cold air trap type cave may be close to the surface with a single entrance or exit above the main chamber,
as shown in Figure 3. Having less air exchange in summer for a SCAT configuration is likely because of a stable tem-
perature profile. The stable temperature profile through a SCAT cave in summer is from relatively cold air at the base
of the isolated SCAT chamber to relatively warm on the surface above. This stable temperature profile does not induce
Rn transport from the soil above a SCAT cave in summer. In winter, the surface temperature is often colder than the
relatively warm cave below. This winter temperature profile is unstable causing cold, dense (soil) surface air to seep
into the cave below through minor cracks and fissures, transporting Rn from soil to SCAT type cave in winter, resulting
in a summer low, winter high seasonal Rn pattern for SCAT type cave morphologies.
    Temperature contrast between cave and external air drives convective cave ventilation on different physical and
temporal scales. The magnitude of air mass flow under chimney effect ventilation is much greater and ubiquitous than

8 • Journal of Cave and Karst Studies, March 2021
Waring, Hankin, Solomon, Long, Yule, Blackley, Werczynski, and Baker
net air exchange via other ventilation patterns
due to through flow (Badino, 2010; Luetscher
and Jeannin, 2004; Wigley and Brown, 1976).
For caves with large entrances or on exposed
hillsides, prevailing wind effects may also con-
tribute to cave ventilation.
The complexity of natural cave systems sug-
gests that in different parts of an extended cave
network air flow may be behaving in hybrid or
complex patterns that only direct measurement
can reveal. Combining knowledge of likely cave
air flow patterns and the probable source of cave
Rn permits first pass estimation of cave radon
patterns.
Chifley Cave Example of Chimney Effect
Ventilation Pattern
Chifley Cave is part of an interconnected group
of show caves including Imperial, River, Jubilee
and Elder Cave on the northern side of the large
Grand Arch at Jenolan Caves, Australia. Another
Figure 3. A modification of cave classification from Covington and Perne (2016) group of interconnected caves on the southern
with morphology affecting ventilation pattern. side of the Grand Arch includes Temple of Baal
Cave. Chifley Cave has a lower opening in a cleft
coming off the Grand Arch and an upper opening on the ridge in a surface doline (Elder Cave) 62 m above the lower open-
ing. The minimum path length between openings is 536 m and cave volume 9,587 m3 along this path (Zlot and Bosse, 2015).
Radon and CO2 measurements shown in Figures 4 and 5 are from a cave chamber, Katies Bower, 120 m from the lower
cave entrance, in the Grand Arch and one quarter of the total path length (536 m). Measurements of air flow, cave tempera-
ture, and pressure are from an instrument site in a 2 m high × 0.5 m wide passage called the Flitch of Bacon, 75 m from the
Grand Arch (Figs. 4, 5, and 6). There are many extended side passages including Jubilee Cave without a direct opening to
the surface. An al-
ternate lower pas-
sage connection
to the Grand Arch
through Imperial
cave has a sealed
door except for
tour groups to
pass, approxi-
mately three visits
per day.
The Jenolan
Caves complex
has been mapped
at high resolution
(3 cm) using mo-
bile LIDAR (Zlot
and Bosse, 2014)
with the full 3D
dataset available
Figure 4. Radon and CO2 annual cycle. Synchronous seasonal variation at Lower Katies Bower, in Chifley Cave (Zlot and Bosse,
from September 2014 to September 2015. Rn continuous active integrated air sample recorded at 1-hour intervals, 2015). An excerpt
CO2, and temperature at 15-minute intervals. Winter air-flow pattern (blue) reduces Rn concentration and summer
pattern (red) increases Rn. The air-flow magnitude and direction is determined by the temperature contrast be-
from the 3D data
tween cave temperature (red line) and external temperature (yellow line). The diurnal temperature range is often (Zlot and Bosse,
greater and less than cave temperature in a single day, causing a diurnal reversal of air flow. A 24-hour moving 2015) shows the
average of external temperature (black) removes the diurnal temperature variation to reveal a synoptic temperature north side cave
pattern.
Journal of Cave and Karst Studies, March 2021 • 9Waring, Hankin, Solomon, Long, Yule, Blackley, Werczynski, and Baker
complex and the
L shape geome-
try between Elder
and Chifley Cave
(Fig. 7) with an
upper and lower
entrance or exit
(2EE) necessary
to achieve strong
chimney effect
cave ventilation.
R A D O N
SEASONAL
PATTERN IN
CAVES
A summary of
key findings from
international liter-
Figure 5. Radon and CO2 diurnal cycle. Synchronous variation over 20 days for Rn and CO2 at Lower Katies Bow- ature shows ra-
er, in Chifley Cave from January 20, 2015 to February 10, 2015. Rn continuous integrated air sample recorded at don in caves var-
1-hour intervals, CO2, air flow, temperature, pressure at 15-minute intervals. An unusual 3-day period of cold ex-
ternal temperatures in summer causes air flow to reverse direction (blue) reducing Rn concentration then returning ies widely (Table
to a diurnal pattern of bi-directional air flow. The air-flow magnitude and direction is determined by the temperature 2) between years
contrast between cave temperature (red line) and external temperature (yellow line). The diurnal temperature range and also season-
is often greater and less than cave temperature in a single day, causing a diurnal reversal of air flow. A 24-hour
moving average of external temperature (black) removes the diurnal temperature variation to reveal a synoptic
ally within a cave
temperature pattern. system, favoring
high Rn in sum-
mer and low Rn in winter as a result of chimney effect ventilation (Table 3). The common summer-high pattern of cave Rn
activity is also represented in common summer-high estimated doses to Guides (Solomon et al., 1996). The alternate win-
ter-high pattern of cave Rn is observed in Shawan (Wang et al., 2019) and Altimira Caves (Sainz et al., 2018). Both caves
are very close to the surface with a single entrance-exit. Seasonal preferential seepage of cold air in soil through the epi-
karst above the
cave due to tem-
perature contrast
in winter may
explain the winter
high Rn pattern
for these shallow
caves (Table 3).
Both seasonal
patterns show a
strong correlation
between cave Rn
and CO2, sug-
gesting a com-
mon external soil
source of both
gases.
Links between
cave Rn activity
and temperature Figure 6. Temperature difference, cave airflow, and CO2 multi-year comparison. Synchronous variation (15 min)
contrast (exter- over 8 years for CO2 at Flitch of Bacon (FoB) and Lower Katies Bower (LKB) sites with 45-meter separation in
nal T−cave T) are Chifley Cave from 1 July 2009 to 20 August 2017. Cave temperature measured at FoB (purple) has a seasonal vari-
ation of < 3 °C compared to the external seasonal variation of around 30 °C. Cave temperature recorded between
well known and February 2012 and July 2013 may be unreliable due to water saturation of co-hosted humidity sensor. Short data
widely attribut- gaps < 2 months due to sensor failure are interpolated by modeling with adjacent years for construction of Table 4.
10 • Journal of Cave and Karst Studies, March 2021Waring, Hankin, Solomon, Long, Yule, Blackley, Werczynski, and Baker
able to cave ven-
tilation (Gregorič
et al., 2014; Kow-
alczk and Froe-
lich, 2010; Wig-
ley and Brown,
1976). However,
the source of Rn
is often assumed
to be by accu-
mulation inside
the cave with
seasonal cave
Rn concentration
patterns caused
by dilution with
winter dominant
cave ventilation
of external low
Rn air.
Lower Katies
Bower chamber
(Chifley Cave)
Rn activity has a
very strong sea-
sonal bias with
high Rn in sum-
Figure 7. Oblique view of air-flow path between Elder cave doline upper entrance-exit and the lower Grand Arch mer and low Rn
entrance-exit. in winter (Fig. 4).
Rn concentration
closely correlates with CO2 concentration on a time scale of 1 hour (Fig. 5) for a 20-day period in summer 2015
suggesting a common source (Waring et al., 2017). Both Rn and CO2 cave concentrations are a function of soil source
concentration and chimney effect ventilation. The 1 month delay in CO2 rise in the cave is likely caused by a delayed
soil CO2 respiration response to an increase in soil biological primary productivity from spring soil warming compared
to inorganic constant rate production of Rn in the soil.
Temperature Difference and Air Flow Influence on Cave CO2 and Rn
Rn activity in Chifley Cave is dependent upon the temperature difference between cave and external air to drive
cave ventilation measured as bi-directional air mass transfer, shown as weekly integration increments in Figure 8.
When measured at the ‘Flitch of Bacon’ (FoB) passage, the weekly integrated seasonal temperature pattern is sym-
metrically distributed with external temperature in excess of FoB cave temperature in summer and similarly in deficit in
winter (Fig. 8). If integrated over a year from July 1st to June 30th inter-annual comparisons of temperature difference are
very close to evenly balanced with a very small bias to warmer cave temperatures (Table 4).
Air velocity into or out of Chifley Cave is also measured at ‘Flitch of Bacon’ passage. The orthogonal hewn passage
at FoB is 2.0 m high by 0.5 m wide simplifying calculation of air mass transfer from the Grand Arch entrance and exit.
In stark contrast to the even temperature distribution, air flow driven by temperature difference is highly biased favoring
winter air flow (Fig. 8). The ratio of volume of air moving into Chifley Cave from the Grand Arch (winter pattern) ranges
from 2–5 times greater (Table 4) than the volume of air flowing out of Chifley Cave (summer pattern). The seasonal
asymmetrical airflow bias implies cave temperature is approximately 5°C warmer than the average external tempera-
ture (Fig. 8).
Karst rock mass temperature is balanced by a geothermal heat flux from below and heat loss (winter) from above that
approximates surface temperature. Caves provide air flow, water, and heat transfer pathways for temperature equilibra-
tion to extend the depth of average surface temperature influence to the depth of the cave system (Luetscher and Jeannin,
2004). In karst, a negative geothermal gradient close to the surface where temperature decreases with depth, has a deeper
inflection point before resumption of a positive geothermal gradient to the Earth’s interior. Air flow through caves and karst
aquifers provide heat transfer mechanisms to establish a long-term stable near surface geothermal gradient as a bal-
Journal of Cave and Karst Studies, March 2021 • 11Table 3. Summary of selected cave literature for average annual Rn activity association with assumed Rn source, known cave geometry, diurnal and seasonal
patterns, correlation with CO2 and winter biased airflow.
Cave Geometry
Interpreted # Entrance – Exit Cave
Mean Annual or Shape 2EE L U n Cave Rn Ventilation Winter
222
Rn Activity Measurement Assumeda Shape 1EE Baro SCT Seasonal Diurnal Correlation Air-Flow
Cave, Country (Bq m−3) Method Rn Source WWT Pattern Pattern with CO2 Bias Reference
Jenolan Caves all 1,021 Passive Etch Track ∙∙∙ ∙∙∙ ∙∙∙ ∙∙∙ ∙∙∙ ∙∙∙ Solomon et al.
(1996)
Jenolan Caves all 2,146 Passive Etch Track ∙∙∙ ∙∙∙ ∙∙∙ ∙∙∙ ∙∙∙ ∙∙∙ this study
Jenolan Caves, Temple 2,850 Active Si SSD ∙∙∙ 1EE WWAT Summer low none no Whittlestone et al.
of Baal Autumn high (2003)
Jenolan Caves, Chifley 838 Passive Etch Track ∙∙∙ 2EE L Summer high ∙∙∙ ∙∙∙ ∙∙∙ Solomon et al.
12 • Journal of Cave and Karst Studies, March 2021
Cave Winter low (1996)
Jenolan Caves, Chifley 4,578 Active Si AlphaGuard Soil 2EE L Summer high strong yes yes this study
Cave Winter low
Waring, Hankin, Solomon, Long, Yule, Blackley, Werczynski, and Baker
Postojna Cave LP, 3,255 Passive Si Cave 2EE L Summer high strong yes Gregorič et al.
Slovenia Winter low (2014)
Postojna Cave BC, 2,315 Passive Si ∙∙∙ 2EE L Summer high ∙∙∙ ∙∙∙ ∙∙∙ Gregorič et al.
Slovenia Winter low (2014)
Postojna Cave GC, 25,020 Passive Si Cave 2EE L Summer high strong yes yes Gregorič et al.
Slovenia Winter low (2014)
Hollow Ridge #2, 4,733 Active Si RAD 7 Cave 4EE L Summer high yes yes yes Kowalczk and
Floridab Winter low Froelich (2010)
Shawan Cave, China 47,419 Active Si RAD 7 Cave 1EE SCAT Summer low weak unknown unknown Wang et al. (2019)
Autumn high
Altamira Cave, Hall, 3,041 Passive Si Scout Cave 1EE Summer low yes yes no Sainz et al. (2018)
Spainc Winter high
Altamira Cave, PC 3,286 Passive Si Scout Cave 1EE WWAT Summer low no yes no Sainz et al. (2018)
room, Spain Winter high
Rull Cave, Spain 1,762 Active Si Radim 5WP Cave 1EE Summer high no yes yes Pla et al. (2016)
Winter low
a
Cave Rn source is assumed to be by cave accumulation with winter air-flow dilution.
b
Hollow Ridge #2 annual average calculated from seasonal averages.
c
Altimira annual average calculated from monthly averages Dec 13−16.Waring, Hankin, Solomon, Long, Yule, Blackley, Werczynski, and Baker
ance between av-
erage surface
temperature and
the geothermal
heat flux from be-
low.
The annual
average surface
temperature is
therefore expect-
ed to be the same
as the annual av-
erage cave air
temperature, plus
a component
due to heat flux
from the Earth’s
interior. Cave air
temperature var-
Figure 8. Weekly aggregates of 15 minute and hourly sensor data illustrates a balanced seasonal temperature ies depending
difference (external temperature—cave temperature) compared to a biased seasonal airflow through Chifley Cave. on position within
The strong winter pattern airflow bias from the bottom up flushes Rn and CO2 from Chifley Cave. A warmer cave the cave and the
temperature of approximately 5 °C is implied by the biased seasonal airflow. Rn and CO2 are drawn into Chifley
Cave from the soil above during top down summer pattern airflow. Average weekly CO2 measured at Flitch of geothermal gra-
Bacon passage during summer has a maximum close to 2,000 ppm whereas CO2 measurements at Lower Katies dient. For Jeno-
Bower, 45m further into Chifley Cave has a maximum that ranges between 7,000–10,000 ppm. lan Caves, cave
air temperature
vertical profile varies from 12°C at the lowest elevation in Chifley Cave (FoB) to a 16°C soil temperature above Chifley
Cave (Table 4). The average temperature for a column of air through Chifley Cave is 2–5 °C warmer than temperature at
FoB due to geothermal heating. Similarly, external temperature varies depending on position of the weather station with
respect to local topography, potentially creating a temperature offset from the true average temperature of the column
of air in a cave or externally due to thermometer location.
The small net annual average temperature difference between a column of air inside the cave and an external col-
umn of air produces a large net annual volumetric air flow bias (2−5:1) favoring the winter ventilation pattern that flush-
es Rn from caves with ambient air (Fig. 8). A model (Greene et al., 2019) of external temperature variation at Jenolan
Caves shows a small temperature increase (0.17°C) from 2008 to 2018 consistent with an increase in temperature from
global warming. Cave temperature from Flitch of Bacon increases by a smaller amount (0.1°C) over the same period,
though with less certainty due to cave temperature data record gaps (Fig. 6).
Comparison of average annual CO2 concentration measured at Lower Katies Bower (Table 4) from 2013−2014
(1,812 ppm) to 2014−2015 (2,909 ppm) shows an inter annual increase of 60% before reducing by 30% in 2015−2016
(2,195 ppm). A small variation in annual average external temperature, amplifies net air flow causing a large impact on
cave CO2 concentration (Table 4). Inter-annual variations in Rn activity of approximately 60% may also be expected
from a small ~0.5 °C change in average external temperature. Warming external temperature due to climate change
over decades will decrease the cave minus external temperature difference causing a decrease in winter pattern airflow
and an increase in cave Rn activity.
Cave CO2 as a Proxy for Rn
Chifley Cave Rn and CO2 concentration closely correlates (Fig. 9, R2 5 0.94) within a measurement timescale of
1 hour, over 20 days because of a mutual soil source. Over a longer seasonal time frame, the soil source CO2/Rn
ratio changes slightly due to primary biological productivity only affecting CO2 from bacterial and root respiration and
not Rn. Individual rain events and longer low rainfall periods may also affect soil moisture, and consequently, soil CO2
concentration and the CO2/Rn source ratio (Waring et al., 2017). In caves where there may not be a mutual source of
Rn and CO2 or where chimney effect ventilation is not evident, a Rn−CO2 correlation is unlikely to apply (e.g., Temple
of Baal, Jenolan Caves). CO2 in caves may also have an inorganic source from limestone dissolution in the epikarst,
speleothem growth, or from the breath from high numbers of cave visitors to change the cave CO2/Rn ratio.
With the exception of the Temple of Baal, increases in CO2 associated with visitation at Jenolan are typically relative-
ly short-lived and quickly return to the pre-tour level (Baker, 2014). Consequently, the CO2 from cave visitors would not
Journal of Cave and Karst Studies, March 2021 • 13You can also read