Ketogenic diet restrains aging-induced exacerbation of coronavirus infection in mice - eLife
←
→
Page content transcription
If your browser does not render page correctly, please read the page content below
RESEARCH ARTICLE

                                    Ketogenic diet restrains aging-induced
                                    exacerbation of coronavirus infection in
                                    mice
                                    Seungjin Ryu1,2, Irina Shchukina3, Yun-Hee Youm1,2, Hua Qing4, Brandon Hilliard4,
                                    Tamara Dlugos1,2, Xinbo Zhang1, Yuki Yasumoto1, Carmen J Booth1,
                                    Carlos Fernández-Hernando1,5, Yajaira Suárez1,5, Kamal Khanna6,
                                    Tamas L Horvath1,5,7, Marcelo O Dietrich1,5, Maxim Artyomov3, Andrew Wang2,4*,
                                    Vishwa Deep Dixit1,2,5,7*
                                    1
                                     Department of Comparative Medicine, Yale School of Medicine, New Haven,
                                    United States; 2Department of Immunobiology, Yale School of Medicine, New
                                    Haven, United States; 3Department of Pathology and Immunology, Washington
                                    University School of Medicine, St. Louis, United States; 4Department of Internal
                                    Medicine, Yale School of Medicine, New Haven, United States; 5Program in
                                    Integrative Cell Signaling and Neurobiology of Metabolism, Yale School of
                                    Medicine, New Haven, United States; 6Department of Microbiology, New York
                                    University Langone Health, New York, United States; 7Yale Center for Research on
                                    Aging, New Haven, United States

                                    Abstract Increasing age is the strongest predictor of risk of COVID-19 severity and mortality.
                                    Immunometabolic switch from glycolysis to ketolysis protects against inflammatory damage and
                                    influenza infection in adults. To investigate how age compromises defense against coronavirus
                                    infection, and whether a pro-longevity ketogenic diet (KD) impacts immune surveillance, we
                                    developed an aging model of natural murine beta coronavirus (mCoV) infection with mouse
*For correspondence:                hepatitis virus strain-A59 (MHV-A59). When inoculated intranasally, mCoV is pneumotropic and
andrew.wang@yale.edu (AW);          recapitulates several clinical hallmarks of COVID-19 infection. Aged mCoV-A59-infected mice have
vishwa.dixit@yale.edu (VDD)         increased mortality and higher systemic inflammation in the heart, adipose tissue, and
Competing interests: The            hypothalamus, including neutrophilia and loss of gd T cells in lungs. Activation of ketogenesis in
authors declare that no             aged mice expands tissue protective gd T cells, deactivates the NLRP3 inflammasome, and
competing interests exist.          decreases pathogenic monocytes in lungs of infected aged mice. These data establish harnessing
Funding: See page 21
                                    of the ketogenic immunometabolic checkpoint as a potential treatment against coronavirus
                                    infection in the aged.
Received: 13 January 2021
Accepted: 15 June 2021
Published: 21 June 2021

Reviewing editor: Chyung-Ru
Wang, Northwestern University,
                                    Introduction
United States                       Aging-driven reduced resilience to infections is dependent in part on the restricted T cell repertoire
                                    diversity together with impaired T and B cell activation as well as inflammasome-driven low-grade
   Copyright Ryu et al. This
                                    systemic inflammation that compromises innate immune function (Akbar and Gilroy, 2020;
article is distributed under the
                                    Camell et al., 2017; Youm et al., 2013). Consequently, 80% of deaths due to COVID-19 in USA are
terms of the Creative Commons
Attribution License, which          in adults >65 years old (https://www.cdc.gov/), and aging is the strongest factor to increase infection
permits unrestricted use and        fatality (Pastor-Barriuso et al., 2020; Perez-Saez et al., 2021; Ward et al., 2020). Lack of an aging
redistribution provided that the    animal model that mimics SARS-CoV-2 immunopathology has been a major limitation in the effort to
original author and source are      determine the mechanism of disease and to develop effective therapeutics for the elderly. Inability
credited.                           of mouse ACE2 to bind SARS-CoV-2 is a significant hurdle in understanding the basic mechanism of

Ryu et al. eLife 2021;10:e66522. DOI: https://doi.org/10.7554/eLife.66522                                                           1 of 25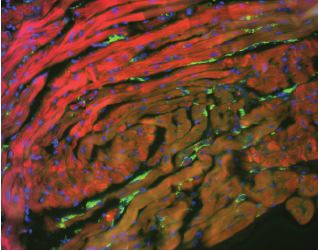
Research article                                                                                 Immunology and Inflammation

                                    COVID-19. Accordingly, several approaches have been employed to develop models including intro-
                                    duction of human-ACE2 in mice and transient induction of hACE2 through adenoviral-associated
                                    vectors. These models have begun to yield important information on the mechanism of disease
                                    development. For example, epithelial cell-specific induction of hACE2 (K18-hACE2) as a model of
                                    SARS-CoV-2 infection demonstrated that post-intranasal inoculation, animals develop lung inflamma-
                                    tion and pneumonia driven by infiltration of monocytes, neutrophils, and T cells (Winkler et al.,
                                    2020). Also, initial studies that employ lung-ciliated epithelial cell-specific HFH4/FOXJ1 promoter-
                                    driven hACE2 transgenic mice show that SARS-CoV-2 infection induces weight loss, lung
                                    inflammation, and approximately 50% mortality rate, suggesting the usefulness of this model to
                                    understand the mechanism of immune dysregulation (Jiang et al., 2020). However, significant hur-
                                    dles remain to understand the mechanism and test therapeutic interventions that are relevant to dis-
                                    ease severity in elderly, as complicated breeding and specific mutations need to be introduced in
                                    hACE2 transgenic strains in addition to the time required to age these models. The mouse model of
                                    SARS-CoV-2 based on adeno-associated virus (AAV)–mediated expression of hACE2 may allow cir-
                                    cumvention of the above constrains. The delivery of hACE2 into the respiratory tract of C57BL/6
                                    mice with AAV9 causes a productive infection as revealed by >200-fold increase in SARS-CoV-2 RNA
                                    and shows similar interferon gene expression signatures as COVID-19 patients (Israelow et al.,
                                    2020). However, in young wild-type mice, this model induces mild acute respiratory distress syn-
                                    drome (ARDS) and does not cause neutrophilia, weight loss, or lethality (Israelow et al., 2020).
                                    Other studies using replication-deficient adenovirus-mediated transduction of hACE in mice and
                                    infection with SARS-CoV-2 produced 20% weight loss including lung inflammation (Hassan et al.,
                                    2020; Sun et al., 2020). Furthermore, genetic remodeling of the SARS-CoV-2 spike receptor binding
                                    domain that allow interaction with mACE demonstrated peribronchiolar lymphocytic inflammatory
                                    infiltrates and epithelial damage but no weight loss in infected mice (Dinnon et al., 2020). More-
                                    over, middle-aged female mice that are 1 year old, (analogous to approximately 43 year old human),
                                    display greater lung pathology and loss of function post-infection with 10% weight loss followed by
                                    spontaneous recovery 7 days post-infection (Dinnon et al., 2020).
                                        The mouse hepatitis virus (MHV) and SARS-CoV-2 are both ARDS-related beta coronaviruses with
                                    a high degree of homology (Gorbalenya et al., 2020). Importantly, mCoV-A59 utilizes the entry
                                    receptor CEACAM1, which is expressed not only on respiratory epithelium, but also on enterocytes,
                                    endothelial cells, and neurons, much like ACE2 (Godfraind et al., 1995), thus allowing the study of
                                    wide-ranging systemic impacts of infection. The MHV infection is known to cause hepatitis and
                                    encephalomyelitis (Lavi et al., 1984). Importantly, however, the intranasal infection with mCoV-A59
                                    is pneumotropic and causes ARDS in C57BL/6J animals, while all other MHV strains require the A/J
                                    or type-I interferon-deficient background, for the development of severe disease (De Albuquerque
                                    et al., 2006; Khanolkar et al., 2009; Yang et al., 2014) limiting their use.
                                        Aging-induced chronic inflammation in the absence of overt infections is predominantly driven by
                                    the NLRP3 inflammasome (Bauernfeind et al., 2016; Camell et al., 2017; Youm et al., 2013), a
                                    myeloid cell-expressed multiprotein complex that senses pathogen-associated molecular patterns
                                    (PAMPs) and danger-associated molecular patterns (DAMPs) to cause the processing and secretion
                                    of IL-1b and IL-18. There is increasing evidence that SARS-CoV-2 infection activates the NLRP3
                                    inflammasome with increased levels of IL-18 and lactate dehydrogenase (LDH) levels due to inflam-
                                    masome-mediated pyroptotic cell death (Lucas et al., 2020; Zhou et al., 2020). It is now known
                                    that increased glycolysis, which activates inflammasome, is associated with worsened COVID-19 out-
                                    come (Codo et al., 2020). This raises the question whether the substrate switch from glycolysis-to-
                                    ketogenesis can be employed to stave off COVID-19 in high-risk elderly population. Here, we estab-
                                    lish that intranasal infection with mCoV-A59 recapitulates clinical features of COVID-19 seen in
                                    elderly and demonstrate that ketone metabolites protect against disease through inhibition of
                                    NLRP3 inflammasome and expansion of protective gd T cells in lungs.

                                    Results
                                    mCoV-A59 infection in aged mice mimics COVID-19 severity
                                    To determine the underlying deficits in immune and inflammatory response in aging, we investigated
                                    the impact of mCoV-A59 intranasal inoculation on adult (2–6 months) and old male mice (20–24

Ryu et al. eLife 2021;10:e66522. DOI: https://doi.org/10.7554/eLife.66522                                                        2 of 25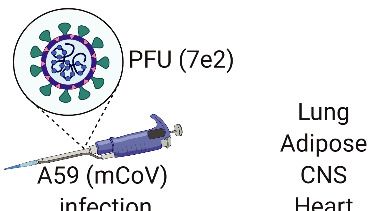
Research article                                                                                       Immunology and Inflammation

              A                                               B                                        C
                                                                          PFU (7e3)

                                                                                                             F
                     D                                         E

               G                                                   H                              I
              Lung

          J                                               K                                             L
   Lung

Figure 1. Aging exacerbates A59 (mCoV) infection. (A) Schematic of A59 (mCoV) infection experiment with young (2–6 months) and old mice (20–24
months). (B) Probability of survival of young (n = 6) and old (n = 6) infected mice. Survival of mice was examined after infection with high dose of virus
(PFU 7e3) up to 14 days. (C–E) Young (n = 8) and old mice (n = 8) were infected with low dose of virus (PFU 7e2), and weight change (%) (C), O2
saturation (D), and daily food intake (E) were recorded. (F) Plaque assay of lung from uninfected, infected young and old mice. (G–L) Flow cytometry
analysis of CD4 T cell (G), CD4/CD8 T cell ratio (H), gd T cell (I), neutrophil (J), Ly6Chi cell (K), and CD64+ MerTK+ cell (L) on day 8 post (PFU 7e2)
infection. Error bars represent the mean ± S.E.M. Two-tailed unpaired t-tests were performed for statistical analysis. *p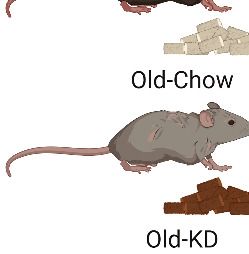
Research article Immunology and Inflammation
Figure 1 continued
Figure supplement 1. Characterization of immune cell population in young and old mice infected with A59 (mCoV).
months) (Figure 1A). The LD-0 infectious dose of mCoV-A59 in adult (PFU 7e3) caused 100% lethal-
ity in aged mice (Figure 1B). Aged mice displayed greater weight loss (Figure 1C), hypoxemia
(Figure 1D), and anorexia (Figure 1E), without a significant difference in viral load in lungs
(Figure 1F) after infection (PFU 7e2) when compared to adults.
Immune profiling of the lung revealed that aged mice had significant reductions both in the per-
centage of CD4 cells and in the CD4:CD8 ratio in the lung compared to adult controls at steady
state and after infection (Figure 1G,H, Figure 1—figure supplement 1A). Interestingly, while ϒd T
cell numbers in the lung were significantly increased at steady state in aged mice compared to adult
mice, both the proportion and number of ϒd T cells in the lung were dramatically reduced only in
aged mice after infection compared to adult mice (Figure 1I, Figure 1—figure supplement 1A). In
the spleen, ϒd T cells were found to be reduced at steady state in aged mice (Figure 1—figure sup-
plement 1B).
Analyses of the myeloid compartment revealed that aged mice had significantly increased neutro-
phils in the lung post-infection with a trend toward increase in neutrophils at steady state
(Figure 1J). We did not detect age-associated changes in eosinophils in lungs (Figure 1—figure
supplement 1C). Aging increased Ly6Chi monocytes, which rose further post-infection (Figure 1K,
Figure 1—figure supplement 1D). Moreover, the frequency and number of CD64+MerTK+ cells
were highest in infected aged mice (Figure 1L, Figure 1—figure supplement 1D), while no signifi-
cant differences were observed in the total population of alveolar or interstitial macrophages (Fig-
ure 1—figure supplement 1E,F) in lungs. These data suggest that post-sub-lethal infection, when
young animals recover, aging is associated with delayed resolution of infection with prolonged infil-
tration of inflammatory myeloid cells and a dramatic reduction in gd T cells in the lung.
Transmission electron microscopy confirmed the dissemination of the viral particles in pneumo-
cytes in lungs (Figure 2A). The pneumotropism of mCoV-A59 was also validated by demonstration
of viable mCoV-A59 in lungs using plaque assays, and aged mice did not show significant differences
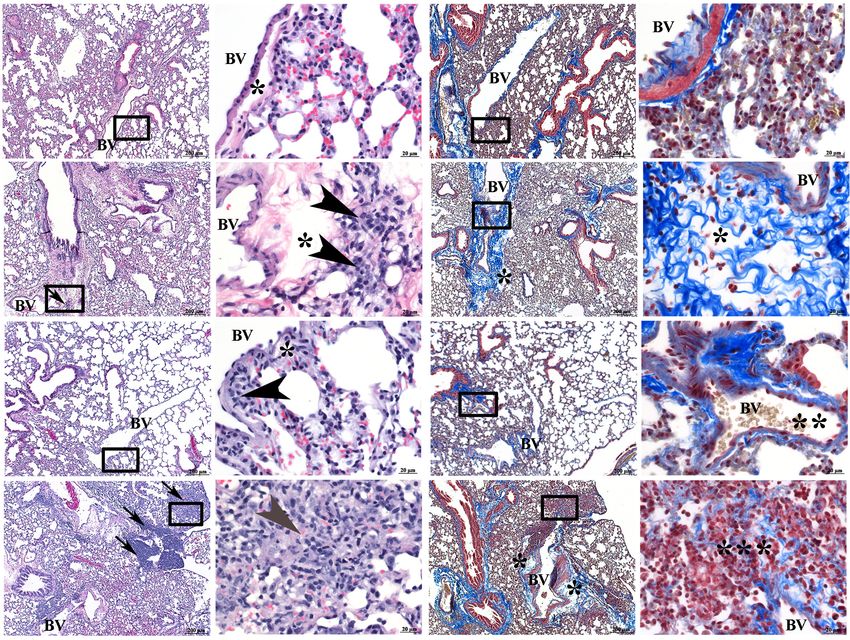
in viral load in lungs (Figure 1F). Interestingly, following mCoV-A59 inoculation, pathology analyses
by hematoxylin and eosin (H and E) and MSB staining, in both 6 month and 20–24 month old mice,
revealed perivascular inflammation (arrows, arrowhead) as well as perivascular edema (*) and
increased perivascular collagen/fibrosis (MSB, blue) that is more severe in the 20–24 month mCoV-
A59 infected mice (Figure 2B). Furthermore, 20–24 month old mice intranasally inoculated with
mCoV-A59 have dense foci visible at low power (box) and amphophilic material (fibrosis) with few
scattered brightly eosinophilic erythrocytes (gray arrowhead) admixed with lymphocytes and plasma
cells. By MSB stain, at higher power, this same focus (***) in the 20–24 month infected mice revealed
that the end of a small blood vessel (BV) terminates into a mass of collapsed alveoli, without obvious
septa admixed with inflammatory cells, disorganized fibrin/collagen fibers (blue) suggestive of ante
mortem pulmonary thrombosis in contrast with post-mortem blood clots where erythrocytes are yel-
low (** MSB, yellow) (Figure 2B). Taken together, consistent with ARDS, the lungs of aged mice
infected with mCoV-A59 had increased foci of inflammation, immune cell infiltration, perivascular
edema, hyaline membrane formation and type II pneumocyte hyperplasia, organizing pneumonia,
interstitial pneumonitis, and occasional hemorrhage and microthrombi, affecting approximately 75%
of the lungs (Figure 2B).
Aging enhances systemic inflammatory response in mCoV-A59 infected
mice
We next investigated whether mCoV-A59 infection in aged mice mimics the hyperinflammatory sys-
temic response seen in elderly patients infected with COVID-19. Compared to young animals, old
mice infected with equivalent doses of mCoV-A59 displayed significant increase in circulating IL-1b,
TNFa, IL-6, and MCP-1 (Figure 3A–C, Figure 3—figure supplement 1A–D), without affecting MIP-
1b (Figure 3—figure supplement 1E). Similar to COVID-19, infection with mCoV-A59 caused
increased cardiac inflammation in old mice as evaluated by greater number of infiltrating CD68+
myeloid cells (Figure 3D, Figure 3—figure supplement 1F).
Ryu et al. eLife 2021;10:e66522. DOI: https://doi.org/10.7554/eLife.66522 4 of 25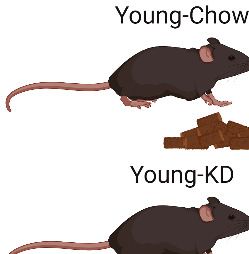
Research article                                                                               Immunology and Inflammation

   A
                                             Young-A59 (mCoV)                                           Old-A59 (mCoV)

   B
                                                   H&E                                                         MSB
       Young-uninfected
       Young-A59 (mCoV)
       Old-uninfected
       Old-A59 (mCoV)

                                  Lower Power                   Higher Power              Lower Power                        Higher Power

Figure 2. A59 (mCoV) infection significantly affects lung phenotype in old mice. (A) Transmission electron microscopic images of A59 (mCoV) particles
in pneumocytes. Left panels show pneumocyte of an infected young (left) and old (right) mice. Bar scale represents 500 nm. Right panels show zoomed-
in images of boxed areas of left panels. Pneumocyte with budding viral particles was indicated by red arrowheads. Bar scale represents 100 nm.
Apoptotic pneumocyte of an infected old mouse showed the shrunken and degraded nucleus (white arrow) and chromatin condensation (white
asterisk). (B) Representative photomicrographs of hematoxylin and eosin (H and E)-stained (left) and Martius scarlet blue trichrome (MSB)-stained (right)
sections of lung from young and old mice 8 days post infection with A59 (mCoV), along with lung from uninfected young and old mice. There are foci
of inflammation (arrow), perivascular edema (*), and perivascular lymphocytes and plasma cells (arrow head). Boxed areas in low power images were
used for high power imaging. BV indicates small blood vessel.

Ryu et al. eLife 2021;10:e66522. DOI: https://doi.org/10.7554/eLife.66522                                                                         5 of 25
Research article                                                                                                     Immunology and Inflammation

                 A                                              B                        C                D
                                                                                                                   Young                       Old
   Serum (A59)

                                                                                                                        DAPI/CD68/Phalloidin

                                                      E                          F                            G                         H
                                          VAT (A59)

                                          I                                                  J                                          K
                                                            Uninfected                                     A59 (mCoV)
                                                          Young     Old                                   Young   Old

                                          50kDa─                                                 50kDa─                 ProCasp1
                                                                              ProCasp1
                                          40kDa─                                                 40kDa─
                 VAT

                                                                                                                                       VAT
                                          30kDa─                                                 30kDa─
                                          20kDa─                              ◄ p20              20kDa─                 ◄ p20
                                          15kDa─                                                 15kDa─

                                          45kDa─                              Actin              45kDa─                 Actin

                                           L                              M                       N                     O                        P
                     Hypothalamus (A59)

Figure 3. Aging induces systemic hyperinflammatory response in A59 (mCoV) infection. (A–C) Serum levels of inflammatory cytokines IL-1b (A), TNFa
(B), and IL-6 (C) of young (6 months old) and old (24 months old) infected mice on day 8 post (PFU 7e2) infection. (D) Representative
immunofluorescence analysis of CD68 expression, phalloidin, and DAPI in hearts isolated from young and old mice. CD68+ cells/heart area analysis was
shown in right panel. (E) Quantification of MHV-A59 (mCoV) in visceral adipose tissue (VAT) of young and old infected mice by quantitative PCR (qPCR)
of a gene expressing A59 M protein. (F–H) qPCR analysis of Il1b (F), Tnf (G), and Il6 (H) in VAT of young and old infected mice. (I) Western blot analysis
of caspase-1 inflammasome activation in VAT of uninfected young and old mice. (J) Immunoblot analysis of caspase-1 cleavage showing higher
inflammasome activation in VAT in aged mice post-infection. (K) Quantification of gene expression of Casp1 in VAT by qPCR. (L) Quantification of MHV-
A59 (mCoV) in hypothalamus of young and old infected mice by qPCR. (M–P) Gene expression analysis of Tnf (M), Casp1 (N), Il1b (O), and Il6 (P) in
hypothalamus of young and old mice 8 days post-infection. Error bars represent the mean ± S.E.M. Two-tailed unpaired t-tests were performed for
statistical analysis. *p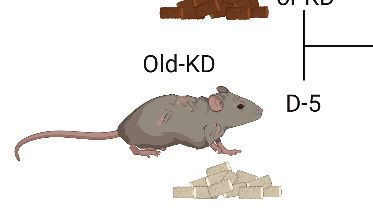
Research article                                                                                     Immunology and Inflammation

Figure 3 continued
The online version of this article includes the following figure supplement(s) for figure 3:
Figure supplement 1. Inflammatory response in young and old mice infected with A59 (mCoV).

                                          Given that increased visceral adiposity is a risk factor for COVID-19 severity and expression of
                                      ACE2 is upregulated in adipocytes of obese and diabetic patients infected with SARS-CoV-2
                                      (Kruglikov and Scherer, 2020), we next studied whether mCoV-A59 infection affects adipose tissue.
                                      Given the prevalence of obesity is 10% among younger adults aged 20–39, 45% among adults aged
                                      40–59 years, and 43% among older adults aged 60 and over (Hales et al., 2020), we investigated
                                      adipose tissue inflammation as a potential mechanism that contributes to infection severity in the
                                      aged. Interestingly, consistent with the prior findings that adipose tissue can harbor several viruses
                                      (Damouche et al., 2015), the mCoV-A59 RNA was detectable in visceral adipose tissue (VAT)
                                      (Figure 3E, Figure 3—figure supplement 1G). Despite similar viral loads, VAT of aged infected
                                      mice had significantly higher mRNA levels of the pro-inflammatory cytokines IL-1b, TNFa, and IL-6
                                      (Figure 3F–H, Figure 3—figure supplement 1H–J). Moreover, consistent with prior work, aging is
                                      associated with increases in inflammasome activation (Figure 3I). Infection with mCoV-A59 further
                                      enhanced caspase-1 cleavage (p20 active heterodimer) as well as expression of inflammasome com-
                                      ponents, Casp1 and Nlrp3, in old mice (Figure 3I–K, Figure 3—figure supplement 1K). In addition,
                                      similar to SARS-CoV-2 invasiveness in central nervous system (CNS), the mCoV-A59 was detectable
                                      in the hypothalamus (Figure 3L, Figure 3—figure supplement 1L). Compared to adults, the hypo-
                                      thalamus of aged infected mice showed increased mRNA expression of TNFa and caspase-1
                                      (Figure 3M,N, Figure 3—figure supplement 1M,N) with no significant differences in IL-1b, IL-6
                                      (Figure 3O,P, Figure 3—figure supplement 1O,P), and NLRP3 (Figure 3—figure supplement 1Q).
                                      Infection in both young and aged mice caused significant increases in markers of astrogliosis and
                                      microglia activation (Figure 3—figure supplement 1R,S). Interestingly, mCoV-A59 reduced the
                                      mRNA expression of orexigenic neuropeptide-Y (Figure 3—figure supplement 1R,S), consistent
                                      with the fact that infected mice display anorexia (Figure 1C,E). However, mCoV-A59 infection
                                      completely abolished the expression of pre-opiomelanocortin (POMC) in the hypothalamus, a tran-
                                      script expressed by POMC neurons, which is involved in the control of the autonomic nervous sys-
                                      tem and integrative physiology. Further investigation will be necessary to test the involvement of the
                                      hypothalamus in the pathogenesis of COVID-19 and organ failure due to alterations in the auto-
                                      nomic nervous system.

                                      Ketogenic diet-mediated protection against mCoV-A59 infection in
                                      aging is coupled with inflammasome deactivation
                                      Given the switch from glycolysis to fatty acid oxidation reprograms the myeloid cell from pro-inflam-
                                      matory to tissue reparative phenotype during infections (Ayres, 2020; Buck et al., 2017; Galván-
                                      Peña and O’Neill, 2014), we next investigated whether mCoV-A59-driven hyperinflammatory
                                      response in aging can be targeted through immunometabolic approaches. Hepatic ketogenesis, a
                                      process downstream of lipolysis that converts long-chain fatty acids into short chain b-hydroxybuty-
                                      rate (BHB) as a preferential fatty acid fuel during starvation or glucoprivic states, inhibits the NLRP3
                                      inflammasome activation (Youm et al., 2015) and protects against influenza infection-induced mor-
                                      tality in mice (Goldberg et al., 2019). We infected bone marrow-derived macrophages (BMDMs)
                                      with mCoV-A59 in vitro in TLR4 (Figure 4A, Figure 4—figure supplement 1A) and TLR1/2 primed
                                      cells (Figure 4B, Figure 4—figure supplement 1B). Infection with mCoV-A59 caused robust activa-
                                      tion of inflammasome as measured by cleavage of active IL-1b (p17) in BMDM supernatants
                                      (Figure 4A,B) as well as in cell lysates (Figure 4—figure supplement 1A,B). Given our prior findings
                                      that ketone metabolites specifically inhibit the NLRP3 inflammasome in response to sterile DAMPs
                                      such as ATP, ceramides, silica, and urate crystals (Youm et al., 2015), we next tested whether BHB
                                      impacts inflammasome activation caused by mCoV-A59.
                                          Interestingly, BHB treatment reduced pro and active cleaved IL-1b (p17) in both conditions when
                                      protein level was measured in the supernatant (Figure 4A,B) and cell lysate (Figure 4—figure sup-
                                      plement 1A,B). Mechanistically, post-mCoV-A59 infection, the BHB reduced the oligomerization of
                                      ASC, which is an adaptor protein required for the assembly of the inflammasome complex

Ryu et al. eLife 2021;10:e66522. DOI: https://doi.org/10.7554/eLife.66522                                                              7 of 25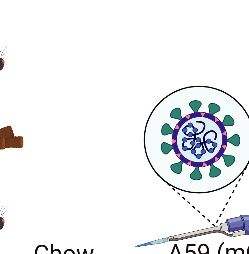
Research article                                                                                                Immunology and Inflammation

                     A                                                      B
                          BHB (mM)     -   -   -   1 5 10                        BHB (mM)      -   -   -   1   5   10
                         A59 (mCoV)    -   -   +   + + +                        A59 (mCoV)     -   -   +   +   +   +
                               ATP     -   +   -   - - -                              ATP      -   +   -   -   -    -
                               LPS     +   +   +   + + +                        Pam3CSK4       +   +   +   +   +   +

                              40kDa─                                                40kDa─
                              30kDa─                        Pro IL-1β               30kDa─                              Pro IL-1β
                              20kDa─                                                20kDa─
                                                            ◄   p17                                                     ◄ p17
                              15kDa─                                                15kDa─

                     C                                                      D
                          BHB (mM)     -   -   -   1 5 10                        BHB (mM) -        -   -   1   5   10
                         A59 (mCoV)    -   -   +   + + +                        A59 (mCoV) -       -   +   +   +   +
                               ATP     -   +   -   - - -                              ATP -        +   -   -   -    -
                               LPS     +   +   +   + + +                        Pam3CSK4 +         +   +   +   +   +
                              80kDa─                        ◄ ASC                   80kDa─                              ◄ ASC
                              60kDa─                        ◄ oligomers             60kDa─                              ◄ oligomers

                              40kDa─                        ◄ ASC                   40kDa─                              ◄ ASC
                                                              dimer                                                       dimer
                              30kDa─                                                30kDa─
                              20kDa─                        ◄ ASC                   20kDa─                              ◄ ASC
                                                              monomer                                                     monomer

    E
                                                        F                                              G

   H

                                                       I                                               J

Figure 4. Ketogenic diet reduces the severity of A59 (mCoV) infection in old mice. (A, B) Western blot analysis about pro and active cleaved p17 form
of IL-1b from supernatant of A59 (mCoV)-infected BMDMs co-treated with priming reagents such as LPS (A) and Pam3CSK4 (B), and BHB with indicated
concentration. (C, D) Western blot analysis of ASC monomer, dimer, and oligomers from insoluble pellet of A59 (mCoV) infected BMDMs co-treated
with priming reagents such as LPS (C) and Pam3CSK4 (D), and BHB with indicated concentration. (E) Schematic of non-lethal dose (PFU 7e2) of A59
Figure 4 continued on next page

Ryu et al. eLife 2021;10:e66522. DOI: https://doi.org/10.7554/eLife.66522                                                                      8 of 25
Research article                                                                                                 Immunology and Inflammation

Figure 4 continued
(mCoV) infection experiment with old mice (20–21 month) fed chow (Old-Chow, n = 6) or ketogenic diet (Old-KD, n = 5). The mice were provided with
diet from 5 days before infection. (F, G) After infection, the phenotype was evaluated until 7 days post-infection. Weight change (%) (F), and % O2
saturation (G) in old mice fed chow or KD. (H) Schematic of lethal dose (PFU 1e6) of A59 (mCov) infection experiment with young (4 months) and old (24
months) mice fed chow (Young-Chow, n = 11; Old-Chow, n = 7) or KD (Young-KD, n = 11; Old-KD, n = 6). The mice were provided with diet from 5
days before infection. After infection, the survival was evaluated until 7 days post-infection. (I) Probability of survival of lethal dose A59 (mCoV)-infected
young mice fed chow or KD. (J) Probability of survival of lethal dose A59 (mCoV)-infected old mice fed chow or KD. Error bars represent the mean ± S.
E.M. Two-tailed unpaired t-tests were performed for statistical analysis. Gehan–Breslow–Wilcoxon tests were performed for survival analysis. *p

Research article                                                                                            Immunology and Inflammation

         A                                               B                                                C

    D                                     E                                   F
                                                                                                    VAT
                                                                                                                           G
                                                                                            Old-          Old-
                                                                                            Chow          KD

                                                                                  50kDa─                         ProCasp1
                                                                                  40kDa─
                                                                                  30kDa─
                                                                                  20kDa─                         ◄ p20
                                                                                  15kDa─

                                                                                  45kDa─                         Actin

    H                                                                                          I
               Old-Chow                       Old-KD
                                                                                             Lung

                        DAPI/CD68/Phalloidin

Figure 5. Ketogenic diet protects old mice from A59 (mCoV) infection by alleviation of inflammation. (A–E) Gene expression analysis of inflammatory
cytokines (A–C) and components of inflammasome (D, E) in lung, VAT, and hypothalamus of A59 (mCoV)-infected old mice fed chow (Old-Chow, 20–21
months, n = 6) or KD (Old-KD, 20–21 months, n = 5). (F, G) Western blot analysis of caspase-1 inflammasome activation (F) in VAT of infected Old-Chow
and Old-KD mice with quantification (G). (H) Representative immunofluorescence images of CD68 expression, phalloidin, and DAPI in hearts isolated
from Old-Chow and Old-KD mice (left) and CD68+ cells/heart area analysis in heart of infected Old-Chow and Old-KD mice (right). (I) Flow cytometry
analysis of gd T cell in lung of infected Old-Chow and Old-KD mice. Error bars represent the mean ± S.E.M. Two-tailed unpaired t-tests were performed
for statistical analysis. *p
Research article Immunology and Inflammation
hypothalamus (Figure 5D,E), inflammasome activation in VAT (Figure 5F,G), and decreased myeloid
cell infiltration in heart (Figure 5H). The ketogenesis in infected old mice did not affect the fre-
quency of CD4, CD8 effector memory or macrophage subsets in lungs, suggesting that reduction in
pro-inflammatory cytokines was not a reflection of reduced infiltration of these cell types (Figure 5—
figure supplements 1A–L and 2A–H). Interestingly, we found that KD feeding rescued mCoV-A59-
induced depletion of ϒd T cell in lungs of aged mice (Figure 5I, Figure 5—figure supplement 1A).
Ketogenesis induces protective gd T cells and decreases myeloid cell
subset in mCoV-A59-infected old mice
To determine the mechanism of ketogenesis-induced protection from mCoV-A59-driven inflamma-
tory damage in aging, we next investigated the transcriptional changes in lung at the single-cell
level. The scRNA-sequencing of whole-lung tissues (Figure 6A, Figure 6—figure supplement 2A)
found that KD feeding in old infected mice caused significant increase in goblet cells (Figure 6B),
expansion of ϒd T cells (Figure 6B) and significant decrease in proliferative cell subsets and mono-
cyte populations (Figure 6B). When differential gene expression analyses were performed with the
clusters, we observed only very modest changes within few clusters and no shared signature (Fig-
ure 6—figure supplement 2B). Comparison with scRNA-seq of the lungs from young and old
infected animals highlighted the largest increase in B cells and club cells and reduction of proliferat-
ing myeloid cells, including Trem2+ macrophages and NK cells (Figure 6—figure supplement 1A–
D). The fraction of Foxp3-positive Treg cells were not different between young infected and old
infected mice (Figure 6—figure supplement 1E–G). Notably, when differential gene expression and
pathway analyses were performed (Figure 6—figure supplement 1H–K), the old infected mice
showed a reduced interferon signature, suggesting increased vulnerability to the viral infection (Fig-
ure 6—figure supplement 1I,J). Interestingly, some of the most striking changes occurred in T cells,
where ketogenesis led to a substantial increase in ϒd but not ab T cells (Figure 6C, Figure 6—figure
supplement 2C). To understand whether expansion of ϒd T cells was also accompanied by the
changes in their regulatory programs, we sorted the lung ϒd T cells from aged mice fed chow diet
and KD and conducted bulk RNA-sequencing to determine the mechanism of potential tissue pro-
tective effects of these cells in mCoV-A59 infection. We found that KD in aging significantly
increased the genes associated with reduced inflammation (Figure 6D), increased lipoprotein
remodeling and downregulation of TLR signaling, Plk1 and aurora B signaling pathways in ϒd T cells
(Figure 6E). However, there was no difference in mRNA expression levels of Vg chain subtypes, IL-
17, or IFN-g (Figure 6—figure supplement 2D–F). Furthermore, RNA-sequencing revealed that lung
ϒd T cells from ketogenic mCoV-A59-infected old mice displayed elevated respiratory electron
transport and complex I biogenesis (Figure 6E). In addition, Golgi to ER retrograde transport and
cell cycle are downregulated, suggesting the reduced activation status of ϒd T cell (Figure 6E).
These data suggest that ϒd T cells expanded with KD are functionally more homeostatic and
immune protective against mCoV-A59 infection.
Zooming in into monocyte sub-population, we observed three distinct monocyte clusters
(Figure 6F), characterized by Ifi44, Lmna, and Cd300e, respectively (Figure 6G). Strikingly, ketogen-
esis-induced change in the monocyte compartment was driven by a loss of cluster 1 (characterized
by high levels of Chil3, Lmna, Il1r2, Lcn2, Cd33, Cd24a, Figure 6H, Figure 6—figure supplement
2G,H). The same clusters were identified in scRNA-sequencing with young and old infected mice
and aging was only associated with reduction of the cluster 0 (Figure 6—figure supplement 2I–K).
In addition, the loss of monocyte sub-population was observed in cells with low interferon response,
further suggesting the immune protective response induction post-ketogenesis in infected mice.
This is an intriguing finding that is consistent with recent observations that dietary interventions can
impact plasticity of the monocyte pool in both mouse and human (Collins et al., 2019;
Jordan et al., 2019).
Discussion
Immune-senescence exemplified by inflammasome-mediated basal activation of myeloid cells,
expansion of pro-inflammatory aged B cells, impaired germinal center, and antibody responses
together with thymic demise and restriction of T cell repertoire diversity all contribute to increased
risk of infections and vaccination failures in elderly (Akbar and Gilroy, 2020; Frasca et al., 2020;
Ryu et al. eLife 2021;10:e66522. DOI: https://doi.org/10.7554/eLife.66522 11 of 25Research article Immunology and Inflammation
A B 12: Goblet cells
Infected Old-KD (3,426 cells) vs Old-Chow (5,194 cell) 2_2: γδ T cells
9: mesothelial
6: Trem2+ macs
5: endothelial
12: Goblet cells 1: Ccr2- monocytes
8: fibroblasts
4: NK cells
3: Club cells & ATII cells
10: B cells & DCs
14: lymphatic endothelial cells
10 3: Club cells 7: Ear2+ alveolar macs
& ATII cells 2_1: αβ T cells
8: fibroblasts 13: proliferating lymphoid cells
0: Ccr2+ monocytes
11: proliferating myeloid cells
2_2: γδ T cells
4: NK cells −2 −1 0 1 2
UMAP 2
2_1: 5: endothelial Fraction change: log2(Old-KD / Old-Chow)
9: mesothelial
αβ T cells
13: proliferating 14: lymphatic
C T cell (cluster 1) subsets: Trdc
0 lymphoid cells 10: B cells endothelial cells Old-Chow Old-KD
& DCs 7: Ear2+ 5
11: proliferating alveolar macs expression
myeloid cells 4
4
6: Trem2+ macs 3
UMAP 2
0: Ccr2+ 2
3
monocytes 1
1: Ccr2- 0
−10
monocytes 2
−10 0 10 20 1
UMAP 1 −6 −5 −4 −3 −6 −5 −4 −3
UMAP 1
E
D Reactome: plasma
lipoprotein remodeling
PID: Aurora B
pathway
PID: Plk1
pathway
KEGG: Toll-like receptor
signaling pathway
12500 12500
γδ T cells bulk RNA-seq 12500
NES = 2.13
12500
Down in Old-KD
padj = 0.047
Down in Old-KD Up in Old-KD 10000 10000 10000 10000
padj < 0.05 Slc15a2 7500 7500 7500 7500
FALSE
rank
rank
rank
rank
TRUE 5000 5000 5000 5000
Sparcl1
Up in Old-KD
3
Pon3 2500 2500
2500 2500
NES = -1.95 NES = -2.31 NES = -1.94
padj = 0.047 padj = 0.047 0 padj = 0.047
−1 * log10(padj)
0 0 0
−0.6 −0.4 −0.2 0.0 −0.4 −0.3 −0.2 −0.1 0.0
Cyp39a1 0.0 0.2
enrichment score
0.4 0.6 −0.4 −0.2
enrichment score
0.0
enrichment score enrichment score
2 Lrat
Msln Ecscr Reactome: complex I Reactome: respiratory Reactome: Golgi to ER Reactome: cell cycle
biogenesis electron transport retrograde transport mitotic
Ndrg1 Fbxo39 Mpl Thada
12500 12500 12500 12500
NES = 2.13 NES = 1.78
Down in Old-KD
padj = 0.047 padj = 0.047
C1s1 Pf4
Nos2 Angptl4 10000 10000 10000 10000
Fmo1
1 Crebzf
7500 7500 7500 7500
rank
rank
rank
rank
5000 5000 5000 5000
Up in Old-KD
0 2500 2500 2500 2500
−0.5 0.0 0.5 1.0 NES = -1.79 NES = -1.47
0 0 0 padj = 0.047 0 padj = 0.047
log2FoldChange 0.0 0.2 0.4 −0.1 0.0 0.1 0.2 0.3 0.4 −0.4 −0.3 −0.2 −0.1 0.0 −0.2 −0.1 0.0
enrichment score enrichment score enrichment score enrichment score
F G H
Fn1 Il1r2
Monocyte (clusters 0 & 1) subsets Ifi44
Old-Chow Old-KD
Ifi205
Ly86 z-score 2
Oas1a 3
0
2 2 2 Ccr2 2
Lmna expression
1 −2
Chil3 4
1 1
UMAP 2
UMAP 2
Il1r2 0
3
0 Wfdc21 −1 Ccr2 Cd33
Lcn2 −2
2
0 0 Fn1 −3 2
1
Eno3 0
−2 Ace 0
Cd300e
Ly6i −2
Cst3
−5.0 −2.5 0.0 2.5 5.0 −5.0 −2.5 0.0 2.5 5.0
0 1 2
−5.0 −2.5 0.0 2.5 5.0 −5.0 −2.5 0.0 2.5 5.0
UMAP 1
UMAP 1
Figure 6. Ketogenesis induces protective gd T cell expansion and inhibits myeloid cell activation in aged mice with mCoV infection. (A) Uniform
Manifold Approximation and Projection (UMAP) plot of lung cells from Old-KD and Old-Chow samples as described in Figure 4E. (B) Bar chart shows
population fold-changes in relative abundance of each cluster. (C) Zoom into UMAP plot from A showing T cells (cluster 1) split by sample. Color
represents expression of Trdc. (D) Volcano plot identifying significantly regulated genes (5% FDR) within sorted gs T cells from lungs of Old-KD and
Figure 6 continued on next page
Ryu et al. eLife 2021;10:e66522. DOI: https://doi.org/10.7554/eLife.66522 12 of 25Research article Immunology and Inflammation
Figure 6 continued
Old-Chow mice. Increase in expression corresponds to ketogenic diet-induced genes. (E) GSEA enrichment curve based on differential expression
analysis results shown in (D). (F) Monocyte cluster 0 and 1 from (A) were subset and analyzed separately. UMAP plot of monocytes split by samples. (G)
Heatmap of normalized within row gene expression values of selected markers of three monocyte subsets. (H) UMAP as in (F). Color represents
expression of selected genes. For (A–C, F–H), expression values were obtained by pooling data from Old-Chow and Old-KD samples (each containing
n = 6 chow and n = 5 KD pooled biological samples into one technical sample for each diet).
The online version of this article includes the following figure supplement(s) for figure 6:
Figure supplement 1. Single-cell RNA-sequencing analysis of lung from young and old A59 (mCoV)-infected mice.
Figure supplement 2. The lung RNA-sequencing analysis of old infected mice fed chow or ketogenic diet.
Goldberg and Dixit, 2015; Goronzy and Weyand, 2019). It is likely that multiple mechanisms par-
take in aging-induced mortality and morbidity to SARS-CoV-2. However, study of immunometabolic
mechanisms that control aberrant inflammatory response in elderly COVID-19 patients is incom-
pletely understood. Epidemiological data strongly support that elderly and aged individuals with
late-onset chronic diseases – including diabetes, obesity, heart conditions, pulmonary dysfunctions,
and cancer – present a much higher disease severity compared to young healthy adults (Cai et al.,
2020; Chen et al., 2020). These observations suggest that it is the vulnerability of the various tissues
that occur in these chronic conditions that predispose elderly to develop severe forms of COVID-19.
Rodent CoVs are natural, highly contagious pathogens of mice and rats (Compton et al., 2003;
Compton et al., 1993). These viruses also offer the possibility of efficient and safe platforms for
modeling COVID-19 and examining immunometabolic mechanisms and interventions that impact
disease. Of particular interest for COVID-19 are the strains of MHV that are respiratory tropic
(Yang et al., 2014). Given, these advantages, MHV mCoV-A59 infection in C57BL/6 mice can be a
powerful tool to rapidly study the disease as well as test therapeutic interventions. We demonstrate
that MHV mCoV-A59 infection in aged mice recapitulates severe features of COVID-19 that includes
up to 30% weight loss, sickness behavior exemplified by anorexia, loss of oxygen saturation, lung
pathology including neutrophilia, monocytosis, loss of gd T cells, lymphopenia, increase in circulating
pro-inflammatory cytokines, hypothalamic, adipose and cardiac inflammation, and inflammasome
activation. Importantly, LD-0 dose of MHV mCoV-A59 induces 100% lethality in 2 year old male
mice, suggesting that this model allows investigation of COVID-19-relevant immunometabolic mech-
anisms that control disease development and severity with aging.
Mechanistically, NLRP3 inflammasome has been demonstrated to be an important driver of
aging-induced chronic inflammation and organ damage (Bauernfeind et al., 2016; Camell et al.,
2017; Youm et al., 2013). COVID-19 patients have inflammasome-dependent pyroptosis and
increase in IL-18 (Lucas et al., 2020; Zhou et al., 2020). Consistent with the hypothesis that aging
may exacerbate inflammasome activation in SARS-CoV-2 infection, our data demonstrates that in
vivo, mCoV infection increases NLRP3 inflammasome-mediated inflammation. Recent study shows
that MHV-A59 also activates the NLRP3 inflammasome in vitro BMDM (Zheng et al., 2020). In addi-
tion, severe cases of COVID-19 are accompanied with dysregulation of monocyte populations with
increased level of S100A8/A9 or calprotectin (Schulte-Schrepping et al., 2020; Silvin et al., 2020),
which can prime and induce the inflammasome activation (Goldberg et al., 2017). Interestingly, the
KD feeding blocked infiltration of pathogenic monocyte subset in lungs that has high S100A8/9 and
low interferon expression. These data underscore that enhanced innate immune tolerance mediated
by inflammasome deactivation maybe an important strategy against COVID-19.
The integrated immunometabolic response (IIMR) is critical in regulating the setpoint of protec-
tive versus pathogenic inflammatory response (Lee and Dixit, 2020). The IIMR involves sensing of
nutrient balance by neuronal (sympathetic and sensory innervation) and humoral signals (e.g. hor-
mones and cytokines) between the CNS and peripheral tissues that allow the host to prioritize stor-
age and/or utilize substrates for tissue growth, maintenance, and protective inflammatory responses.
Peripheral immune cells, both in circulation and those residing within tissues, are subject to regula-
tion by the metabolic status of the host. Ketone bodies, BHB, and acetoacetate are produced during
starvation to support the survival of host by serving as an alternative energy substrate when glyco-
gen reserves are depleted (Newman and Verdin, 2017). Classically, ketone bodies are considered
essential metabolic fuels for key tissues such as the brain and heart (Puchalska and Crawford, 2017;
Veech et al., 2017). However, there is increasing evidence that immune cells can also be profoundly
Ryu et al. eLife 2021;10:e66522. DOI: https://doi.org/10.7554/eLife.66522 13 of 25Research article Immunology and Inflammation
regulated by ketone bodies (Goldberg et al., 2020; Youm et al., 2015). For example, stable iso-
tope tracing revealed that macrophage oxidation of liver-derived AcAc was essential for protection
against liver fibrosis (Puchalska et al., 2019). Given our past findings that ketone bodies inhibit
NLRP3 inflammasome activation induced by sterile DAMPs, we next hypothesized that coronavirus
mediated inflammasome activation and disease severity in aging could be improved by BHB driven
improved metabolic efficiency and NLRP3 deactivation. In support of this hypothesis, we found that
BHB inhibits the mCoV-A59-induced NLRP3 inflammasome assembly and KD reduces caspase-1
cleavage as well as decreases gene expression of inflammasome components. We next investigated
the mechanism of protection elicited by KD that is relevant to aging. Interestingly, scRNA-sequenc-
ing analyses of lung homogenates of old mice fed KD revealed robust expansion of immunoprotec-
tive gd T cells, which are reported to decline in COVID-19 patients (Lei et al., 2020; Rijkers et al.,
2020). The KD activated the mitochondrial function as evidenced by enhanced complex-1 biogenesis
and upregulation of ETC in immunoprotective gd T cells. These results are consistent with a previous
study reporting that KD-mediated enhancement of mitochondrial fatty acid oxidation is required for
protection against flu infection. In the study, increasing BHB by feeding ketone esters could not
mimic the effect of KD (Goldberg et al., 2019). This suggests an important role for mitochondrial
fatty acid oxidation and hepatic ketogenesis in protection against viral infections.
Our findings assume strong clinical significance as recent studies demonstrate that gd T cells were
severely depleted in COVID-19 patients in two highly variable cohorts, and disease progression was
correlated with near ablation of Vg9Vd2 cells that are dominant subtype of circulating gd T cells
(Laing et al., 2020). Taken together these data demonstrate that a ketogenic immunometabolic
switch protects against mCoV-A59-driven infection in mice and this involves anti-inflammatory
response in lung which is coupled with reduction of NLRP3 inflammasome, restoration of protective
ϒd T cells, and remodeling of the pool of the inflammatory monocytes. Finally, our results suggest
that acutely switching infected or at-risk elderly patients to a KD may ameliorate COVID-19 and,
therefore, is a relatively accessible and affordable intervention that can be promptly applied in most
clinical settings.
Materials and methods
Key resources table
Reagent type
(species) or Source or Additional
resource Designation reference Identifiers information
Strain, strain C57BL/6 NIA
background
(mouse,
male)
Strain, strain MHV-A59 Bei resources NR-43000
background (Murine
Coronavirus)
Cell line L2 ATCC CCL-149
(Rattus norvegicus)
Cell line L929 ATCC CCL1
(Mus musculus)
Biological Primary BMDM This paper Freshly isolated from mouse
sample
(Mus musculus)
Antibody Rat anti- Genentech N/A WB (1:250)
Caspase-1
Antibody Rabbit polyclonal Cell Signaling Cat#4967L; RRID:AB_330288 WB (1:1000)
anti-b actin Technology
Antibody Rabbit GeneTex Cat#GTX74034; RRID:AB_378141 WB (1:1000)
polyclonal
anti-IL-1b
Continued on next page
Ryu et al. eLife 2021;10:e66522. DOI: https://doi.org/10.7554/eLife.66522 14 of 25Research article Immunology and Inflammation
Continued
Reagent type
(species) or Source or Additional
resource Designation reference Identifiers information
Antibody Rabbit AdipoGen Cat#AG-25B-0006; RRID:AB_2490440 WB (1:1000)
polyclonal
anti-ASC
Antibody BV711 Rat BioLegend Cat#103147; RRID:AB_2564383 FACS (1:100)
monoclonal
anti-CD45
Antibody FITC Rat BioLegend Cat#151504; RRID:AB_2617035 FACS (1:100)
monoclonal
anti-MERTK
Antibody BV605 Mouse BioLegend Cat#139323; RRID:AB_2629778 FACS (1:100)
monoclonal
anti-CD64
Antibody eFluor 450 Thermo Cat#48-4801-82; RRID:AB_1548747 FACS (1:100)
Rat monoclonal Fisher Scientific
anti-F4/80
Antibody PerCP-Cy5.5 Thermo Cat#45-5932-82; RRID:AB_2723343 FACS (1:100)
Rat monoclonal Fisher Scientific
anti-Ly-6C
Antibody APC Hamster BioLegend Cat#117310; RRID:AB_313779 FACS (1:100)
monoclonal
anti-CD11c
Antibody PE Rat Thermo Cat#12-5755-82; RRID:AB_2572625 FACS (1:100)
monoclonal Fisher Scientific
anti-CD169
Antibody PE/Cy7 Rat BioLegend Cat#105014; RRID:AB_439783 FACS (1:100)
monoclonal
anti-CD86
Antibody BV605 Rat BioLegend Cat#100237; RRID:AB_2562039 FACS (1:100)
monoclonal
anti-CD3
Antibody PE-Cy7 Rat Thermo Cat#25-0042-82; RRID:AB_469578 FACS (1:100)
monoclonal Fisher Scientific
anti-CD4
Antibody eFluor 450 Rat Thermo Cat#48-0081-82; RRID:AB_1272198 FACS (1:100)
monoclonal Fisher Scientific
anti-CD8a
Antibody PE Hamster BioLegend Cat#118108; RRID:AB_313832 FACS (1:100)
monoclonal
anti-TCR g/d
Antibody APC Rat Thermo Cat#17-9668-82; RRID:AB_2573307 FACS (1:100)
monoclonal Fisher Scientific
anti-Ly-6G
Antibody PerCP-Cy5.5 BD Biosciences Cat#565526; RRID:AB_2739281 FACS (1:100)
Rat monoclonal
anti-Siglec-F
Antibody PerCP-Cy5.5 BioLegend Cat#104432; RRID:AB_2285839 FACS (1:100)
Rat monoclonal
anti-CD62L
Antibody APC/Cy7 BioLegend Cat#103028; RRID:AB_830785 FACS (1:100)
Rat monoclonal
anti-CD44
Antibody Rat monoclonal Bio-Rad Cat#MCA1957; RRID:AB_322219 IF (1:100)
anti-CD68
Peptide, Recombinant Mouse R and D Systems Cat#416 ML-050
recombinant M-CSF Protein
protein
Continued on next page
Ryu et al. eLife 2021;10:e66522. DOI: https://doi.org/10.7554/eLife.66522 15 of 25Research article Immunology and Inflammation
Continued
Reagent type
(species) or Source or Additional
resource Designation reference Identifiers information
Commercial RNeasy Plus Qiagen Cat#74034
assay or kit micro kit
Commercial Direct-zol RNA Zymo Research Cat#R2072
assay or kit Miniprep Plus kit
Commercial iScript cDNA Bio-Rad Cat#1708891
assay or kit synthesis kit
Commercial Power SYBR Thermo Cat#4367659
assay or kit Green PCR Fisher Scientific
Master Mix
Commercial ProcartaPlex Thermo Cat#PPX
assay or kit multiplex Fisher Scientific
assay
Chemical Alexa Fluor Thermo Cat#A12381, RRID:AB_2315633
compound, 594 Phalloidin Fisher Scientific
drug
Chemical LPS Sigma Cat#L3024
compound,
drug
Chemical Pam3CSK4 Invivogen Cat#tlrl-pms
compound,
drug
Chemical (R)-Hydroxybutyric Acid (BHB) Sigma Cat#54920–1 G-F
compound,
drug
Chemical Disuccinimidyl suberate (DSS) Thermo Fisher Scientific Cat#21655
compound,
drug
Software, Image J NIH https://imagej.
algorithm nih.gov/ij/
Software, Prism 7 Graphpad https://www.
algorithm graphpad.com/
Software, FlowJo Treestar https://www.
algorithm flowjo.com/
Software, Cell Ranger 10x genomics https://support.
algorithm Single-Cell Software 10xgenomics.com
Suite (v3.0.2)
Software, R (v3.5.0) Butler et al., 2018 https://cran.r-project.
algorithm package org/web/packages/
Seurat (v3.1.1) Seurat/index.html
Software, MAST Finak et al., 2015 https://github.
algorithm com/RGLab/MAST
Software, clusterProfiler Yu et al., 2012 http://bioconductor.
algorithm package (v3.12.0) org/packages/release/
bioc/html/cluster
Profiler.html
Software, STAR (v2.7.3a) Dobin et al., 2013 http://code.google.
algorithm com/p/rna-star/
Software, MultiQC (v1.9) Ewels et al., 2016 http://multiqc.info
algorithm
Software, HTSeq Anders et al., 2015 http://www-huber.
algorithm framework (v0.11.2) embl.de/HTSeq
Continued on next page
Ryu et al. eLife 2021;10:e66522. DOI: https://doi.org/10.7554/eLife.66522 16 of 25Research article Immunology and Inflammation
Continued
Reagent type
(species) or Source or Additional
resource Designation reference Identifiers information
Software, DeSeq2 Love et al., 2014 http://www.
algorithm package bioconductor.
(v1.24.0) org/packages/release/
bioc/html/
DESeq2.html
Software, fgsea R Sergushichev, 2016 https://github.
algorithm package com/ctlab/fgsea
(v1.10.0)
Study design
The object of this study was to investigate whether KD affects defense response of mice against
MHV-A59 along with identification of underlying mechanism. Mice were randomized for all experi-
ments groups. For experiments with mice provided with different diets, mice were fed with chow
diet or KD for 5 days before infection following phenotype observation. It was not possible that
investigators were blinded for KD experiments because appearance of KD was different from chow
diet, while investigators were blinded for experiments and data analysis. Number of samples are
indicated in each figure legend. Sample size for experiments was decided based on power calcula-
tion from previous experiments and experiences. No data points were excluded in this study. All
experiments were repeated independently at least two times. Bulk RNA-sequencing experiment was
performed once with biologically independent samples. Single-cell RNA-sequencing experiment was
done once with pooling biologically independent samples per group.
Animal models
All mice used in this study were C57BL/6 mice. Old mice (20–24 month old) were received from NIA,
maintained in our laboratory. Young mice (2–6 months old) were from NIA or purchased from Jack-
son Laboratories or bred in our laboratory. The mice were housed in specific pathogen-free facilities
with free access to sterile water through Yale Animal Resources Center. Mice were fed a standard
vivarium chow (Harlan 2018s) or a ketogenic diet (Envigo, TD.190049) for indicated time. The mice
were housed under 12 hr light/dark cycles. All experiments and animal use were conducted in com-
pliance with the National Institute of Health Guide for the Care and Use of Laboratory Animals and
were approved by the Institutional Animal Care and Use Committee (IACUC) at Yale University.
Viral infection
MHV-A59 was purchased from Bei resources (NR-43000) and grown in BV2 cells. Mice were anesthe-
tized by intraperitoneal injection of ketamine/xylazine. 700, 7000, or 106 PFU of MHV-A59 was deliv-
ered in 40 ml PBS via intranasal inoculation. Vital signs were measured before and after infection.
Arterial oxygen saturation, breath rate, heart rate, and pulse distention were measured in conscious,
unrestrained mice via pulse oximetry using the MouseOx Plus (Starr Life Sciences Corp.).
Electron microscopy
Lungs were fixed in 10% formaldehyde, osmicated in 1% osmium tetroxide, and dehydrated in etha-
nol. During dehydration, 1% uranyl acetate was added to the 70% ethanol to enhance ultrastructural
membrane contrast. After dehydration, the lungs were embedded in Durcupan, and ultrathin sec-
tions were cut on a Leica Ultra-Microtome, collected on Formvar-coated single-slot grids, and ana-
lyzed with a Tecnai 12 Biotwin electron microscope (FEI).
Histology and immunohistochemistry
H and E and MSB staining of lung tissues were performed on sections of formalin-fixed paraffin-
embedded at the Comparative Pathology Research core at Yale School of Medicine. For immunohis-
tochemistry, the hearts were harvested from MHV-A59-infected mice, fixed in 4% PFA overnight,
and embedded in OCT after dehydration with 30% sucrose, and serial sections of aortic root were
cut at 6 mm thickness using a cryostat. Sections were incubated at 4˚C overnight with CD68 (Serotec;
Ryu et al. eLife 2021;10:e66522. DOI: https://doi.org/10.7554/eLife.66522 17 of 25Research article Immunology and Inflammation
#MCA1957) and Alexa Fluor 594 Phalloidin (ThermoFisher, A12381) after blocking with blocker
buffer (5% Donkey Serum, 0.5% BSA, 0.3% Triton X-100 in PBS) for 1 hr at RT, followed by incuba-
tion with Alexa Fluor secondary antibody (Invitrogen, Carlsbad, CA) for 1 hr at RT. The stained sec-
tions were captured using a Carl Zeiss scanning microscope Axiovert 200M imaging system, and
images were digitized under constant exposure time, gain, and offset. Results are expressed as the
percent of the total plaque area stained measured with the Image J software (ImageJ version 1.51).
Plaque assay
L2 cell (1.5 ml of 6 105 cells/ml) were seeded on six-well plates (Corning, 3516) in supplemented
DMEM and allowed to adhere overnight. Tissue samples were homogenized in unsupplemented
DMEM and spun down at 2000 rpm for 5 min. Supernatant was serially diluted and 200 mL of each
sample was added to aspirated L2 cells in six-well plates. Plates were agitated regularly for 1 hr
before adding overlay media consisting of 1 part 1.2% Avicel and 1 part 2 DMEM (Thermo Fisher,
12800) supplemented with 4% FBS (Thermo Fisher, A3840301), penicillin-streptomycin (Gibco,
15140122), MEM Non-Essential Amino Acids Solution (Gibco, 11140050), and HEPES (Gibco,
15630080). After a 4-day incubation, cells were fixed in 10% formaldehyde (Sigma-Aldrich,
8187081000) diluted with PBS for 1 hr. Cells were then stained in 1% (w/v) crystal violet (Sigma
Aldrich, C0775) for 1 hr, washed once in distilled water, and then quantified for plaque formations.
Multiplex cytokine analyses
Serum cytokine and chemokine level was measured by ProcartaPlex multiplex assay (Thermo Fisher
Scientific). Assay was prepared following manufacture’s instruction. Twenty-five microliters of col-
lected serum from each mice in this study was used. Customized assay including IL-1b, TNFa, IL-6,
MCP-1, and MIP-1b was used. Luminex xPONENT system was used to perform the assay.
Quantitative PCR
To extract and purify RNA from tissues, RNeasy Plus micro kit (Qiagen) and Direct-zol RNA Miniprep
Plus kit (Zymo Research) were used according to manufacturer’s instructions. cDNA was synthesized
with isolated RNA using iScript cDNA synthesis kit (Bio-Rad). To quantify amount of mRNA, real-
time quantitative PCR was done with the synthesized cDNA, gene-specific primers, and Power SYBR
Green detection reagent (Thermo Fischer Scientific) using the LightCycler 480 II (Roche). Analysis
was done by DDCt method with measured values from specific genes, the values were normalized
with Gaphd gene as an endogenous control. Primer information is described in Supplementary file
1.
BMDM culture and in vitro viral infection
BMDM was cultured by collecting mouse femurs and tibias in complete collecting media containing
RPMI (Thermo Fischer Scientific), 10% FBS (Omega Scientific), and 1% antibiotics/antimycotic
(Thermo Fischer Scientific). Using needle and syringe, bone marrow was flushed into new complete
media, followed by red blood cells lysis by ACK lyses buffer (Quality Biological). In six-well plate, the
collected cells were seeded to be differentiated into macrophages incubated with 10 ng/ml M-CSF
(R and D) and L929 (ATCC) conditioned media. Cells were harvested on day 7 and seeded as 1
106 cell/well in 24-well plate for experiments. To infect BMDM, MHV-A59 was incubated with
BMDM as a MOI 1 (1:1) for 24 hr. For inflammasome activation, LPS (1 mg/ml) or Pam3CSK4 (1 mg/
ml) was pre-treated with or without BHB (1, 5, and 10 mM) for 4 hr before MHV-A59 infection for 24
hr or ATP (5 mM) treatment for 1 hr.
Western blotting
To prepare samples for western blotting, tissues were snap frozen in liquid nitrogen. RIPA buffer
with protease inhibitors was used to homogenize the tissues. After cell supernatant was collected,
cells were harvested by directly adding RIPA buffer on cell culture plate. After quantification of pro-
tein amount by the DC protein assay (Bio-Rad), the same amount of protein was run on SDS–PAGE
gel followed by transferring to nitrocellulose membrane. Specific primary antibodies and appropriate
secondary antibodies (Thermo Fisher Scientific) were used to probe blots, and bands were detected
by ECL Western Blotting Substrate (Pierce). The following primary antibodies were used for
Ryu et al. eLife 2021;10:e66522. DOI: https://doi.org/10.7554/eLife.66522 18 of 25Research article Immunology and Inflammation
experiments: Antibodies to caspase-1 (1:250, Genentech), b-actin (1:1,000, 4967L; Cell Signaling), IL-
1b (1:1000, GTX74034, GeneTex), and ASC (1:1000, AG-25B-0006, AdipoGen).
ASC oligomerization assay
To detect ASC oligomers, cells were harvested in NP-40 lysis buffer that contains 20 mM HEPES–
KOH (pH 7.5), 150 mM KCl, 1% NP-40, 0.1 mM PMSF, and protease inhibitors. The cells in lysis
buffer were incubated on ice for 15 min and centrifuged at 6000 rpm at 4˚C for 10 min. Supernatant
was collected and kept for cell lysate western blotting. The pellet was vortexed with 1 ml of NP-40
lysis buffer and centrifuged at 6000 rpm at 4˚C for 10 min. The pellet was incubated with 50 ml of
NP-40 lysis buffer and 1 ml of 200 mM disuccinimidyl suberate for 30 min at room temperature and
then centrifuged at 6000 rpm at 4˚C for 10 min. The pellet with SDS sample buffer and reducing
reagent was loaded for western blotting.
Flow cytometry
Lung was digested in RPMI (Thermo Fisher) with 0.5 mg/ml Collagenase I (Worthington) and 0.2 mg/
ml DNase I (Roche) for 1 hr. Digested lung tissues were minced through 100 mm strainer. Spleen was
directly minced through 100 mm strainer. Minced tissues were additionally filtered with 40 mm
strainer after red blood cell lysis by ACK lysing buffer (Quality Biological). After incubation with Fc
Block CD16/32 antibodies (Thermo Fisher Scientific), the cells from lung and spleen were further
incubated with surface antibodies for 30 min on ice in the dark. Washed cells were stained with
LIVE/DEAD Fixable Aqua Dead Cell Stain Kit (Thermo Fisher Scientific). BD LSRII was used for flow
cytometry, and results were analyzed by FlowJo software. The following antibodies were used for
flow cytometry analysis to detect CD4 T cell, CD8 T cell, gd T cell, neutrophil, eosinophil, and macro-
phage: CD45-BV711, MerTK-FITC, CD64-BV605, F4/80-eFluor450, Ly6C-PerCP-Cy5.5, CD11c-APC,
CD169-PE, CD86-PE-Cy7, CD3-BV605, CD4-PE-Cy7, CD8-eFluor450, TCR g/d-PE, Ly6G-APC,
SiglecF-BV605, CD62L-PerCP-Cy5.5, CD44-APC-Cy7.
Single-cell RNA-sequencing
Lung cells were prepared as mentioned above for flow cytometry and equal amount of cells were
pooled as indicted in the experiments. Single-cell RNA-sequencing libraries were prepared at Yale
Center for Genome Analysis following manufacturer’s instruction (10 Genomics). NovaSeq6000
was used for sequencing library read.
Alignment, barcode assignment, and unique molecular identifier
counting
The Cell Ranger Single-Cell Software Suite (v3.0.2) (available at https://support.10xgenomics.com/
single-cell-gene-expression/software/pipelines/latest/what-is-cell-ranger) was used to perform sam-
ple demultiplexing, barcode processing, and single-cell 3’ counting. Cellranger mkfastq was used to
demultiplex raw base call files from the NovaSeq6000 sequencer into sample-specific fastq files.
Subsequently, fastq files for each sample were processed with cellranger counts to align reads to
the mouse reference (version mm10-3.0.0) with default parameters.
Preprocessing analysis with Seurat package
For the analysis, the R (v3.5.0) package Seurat (v3.1.1) (Butler et al., 2018) was used. Cell Ranger fil-
tered genes by barcode expression matrices were used as analysis inputs. Samples were pooled
together using the merge function. The fraction of mitochondrial genes was calculated for every cell,
and cells with high (>5%) mitochondrial fraction were filtered out. Expression measurements for
each cell were normalized by total expression and then scaled to 10,000, after that log normalization
was performed (NormalizeData function). Two sources of unwanted variation – unique molecular
identifier (UMI) counts and fraction of mitochondrial reads – were removed with ScaleData function.
For both datasets, platelet clusters as well as a cluster of degraded cells (no specific signature and
low UMI count) were removed and data was re-normalized without them. In case of Old-Keto and
Old-Chow dataset, we additionally removed neutrophils, doublets, and red blood cells. Doublets
were manually defined as cells that were positive for two or more marker sets.
Ryu et al. eLife 2021;10:e66522. DOI: https://doi.org/10.7554/eLife.66522 19 of 25You can also read