Plant-associated CO2 mediates long-distance host location and foraging behaviour of a root herbivore
←
→
Page content transcription
If your browser does not render page correctly, please read the page content below
RESEARCH ARTICLE

                                   Plant-associated CO2 mediates long-
                                   distance host location and foraging
                                   behaviour of a root herbivore
                                   Carla CM Arce1†, Vanitha Theepan2†, Bernardus CJ Schimmel2, Geoffrey Jaffuel1,
                                   Matthias Erb2*, Ricardo AR Machado1,2*
                                   1
                                    Institute of Biology, University of Neuchâtel, Neuchâtel, Switzerland; 2Institute of
                                   Plant Sciences, University of Bern, Bern, Switzerland

                                   Abstract Insect herbivores use different cues to locate host plants. The importance of CO2 in
                                   this context is not well understood. We manipulated CO2 perception in western corn rootworm
                                   (WCR) larvae through RNAi and studied how CO2 perception impacts their interaction with their
                                   host plant. The expression of a carbon dioxide receptor, DvvGr2, is specifically required for dose-
                                   dependent larval responses to CO2. Silencing CO2 perception or scrubbing plant-associated CO2
                                   has no effect on the ability of WCR larvae to locate host plants at short distances (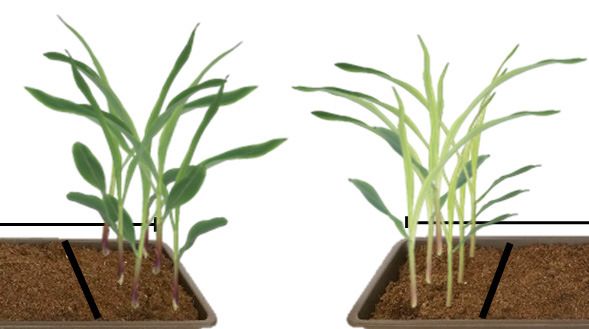
Research article                                                                                                          Ecology

                                   eLife digest Living deep in the ground and surrounded by darkness, soil insects must rely on
                                   the chemicals released by plants to find the roots they feed on. Carbon dioxide, for example, is a
                                   by-product of plant respiration, which, above ground, is thought to attract moths to flowers and flies
                                   to apples; underground, however, its role is still unclear. This gaseous compound can travel through
                                   soil and potentially act as a compass for root-eating insects. Yet, it is also produced by decaying
                                   plants or animals, which are not edible. It is therefore possible that insects use this signal as a long-
                                   range cue to orient themselves, but then switch to another chemical when closer to their target to
                                   narrow in on an actual food source.
                                      To test this idea, Arce et al. investigated whether carbon dioxide guides the larvae of Western
                                   corn rootworm to maize roots. First, the rootworm genes responsible for sensing carbon dioxide
                                   were identified and switched off, making the larvae unable to detect this gas. When the genetically
                                   engineered rootworms were further than 9cm from maize roots, they were less able to locate that
                                   food source; closer to the roots, however, the insects could orient themselves towards the plant.
                                   This suggests that the insects use carbon dioxide at long distances but rely on another chemicals to
                                   narrow down their search at close range.
                                      To confirm this finding, Arce et al. tried absorbing the carbon dioxide using soda lime, leading to
                                   similar effects: carbon dioxide sensitive insects stopped detecting the roots at long but not short
                                   distances. Additional experiments then revealed that the compound could help insects find the best
                                   roots to feed on. Indeed, eating plants that grow on rich terrain – for instance, fertilized soils – helps
                                   insects to grow bigger and faster. These roots also release more carbon dioxide, in turn attracting
                                   rootworms more frequently.
                                      In the United States and Eastern Europe, Western corn rootworms inflict major damage to crops,
                                   highlighting the need to understand and manage the link between fertilization regimes, carbon
                                   dioxide release and how these pests find their food.

                                       Root-feeding insects are highly attracted to CO2 in vitro (Bernklau and Bjostad, 1998a;
                                   Bernklau and Bjostad, 1998b; Eilers et al., 2012; Hibbard and Bjostad, 1988; Jones and Coaker,
                                   1978; Klingler, 1966; Nicolas and Sillans, 1989; Rogers et al., 2013; Strnad et al., 1986;
                                   Strnad and Dunn, 1990). Given that CO2 is produced and released by plant roots and diffuses rela-
                                   tively well through the soil, a likely explanation for this phenomenon is that root herbivores use CO2
                                   as a host location cue (Bernklau and Bjostad, 1998a; Bernklau and Bjostad, 1998b; Doane et al.,
                                   1975; Erb et al., 2013; Johnson and Gregory, 2006; Johnson and Nielsen, 2012), However, the
                                   reliability of CO2 as a host location cue for root feeders has been questioned due to a number of
                                   reasons: (i) CO2 can be emitted by many other sources apart from host plant roots, including decay-
                                   ing organic matter, microorganisms, and non-host plants; (ii) there is a strong diurnal fluctuation in
                                   plant CO2 emissions that does not necessarily match with insect foraging habits; and (iii) other plant-
                                   released chemicals can be used by root herbivores for host location within a CO2 background
                                   (Agus et al., 2010; Eilers et al., 2012; Erb et al., 2013; Hansen, 1977; Hibbard and Bjostad,
                                   1988; Hiltpold and Turlings, 2012; Johnson and Nielsen, 2012; Reinecke et al., 2008;
                                   Weissteiner et al., 2012). A model that may reconcile these different views is that CO2 may be used
                                   as an initial cue at long distances, while other, more host-specific volatiles may be used at shorter
                                   distances (Erb et al., 2013; Johnson et al., 2006; Johnson and Nielsen, 2012). So far, this model
                                   has not been experimentally validated, and the precise role of plant-associated CO2 as a host loca-
                                   tion cue by herbivores, in general, and root herbivores, in particular, remains unclear (Eilers et al.,
                                   2016). To the best of our knowledge, no studies so far have investigated the role of plant-associated
                                   CO2 in plant–herbivore interactions in vivo using molecular manipulative approaches.
                                       The larvae of Diabrotica virgifera virgifera (the western corn rootworm [WCR]) feed almost exclu-
                                   sively on maize roots in agricultural settings and cause major yield losses in the US and Eastern
                                   Europe (Ciosi et al., 2008; Gray et al., 2009; Meinke et al., 2009; Toepfer et al., 2015). The larvae
                                   rely on a number of volatile and non-volatile chemicals to identify and locate host plants,
                                   and distinguish between suitable and less-suitable maize plants and forage within the maize root sys-
                                   tem (Hiltpold et al., 2013; Johnson and Gregory, 2006; Johnson and Nielsen, 2012;

Arce, Theepan, et al. eLife 2021;10:e65575. DOI: https://doi.org/10.7554/eLife.65575                                                  2 of 29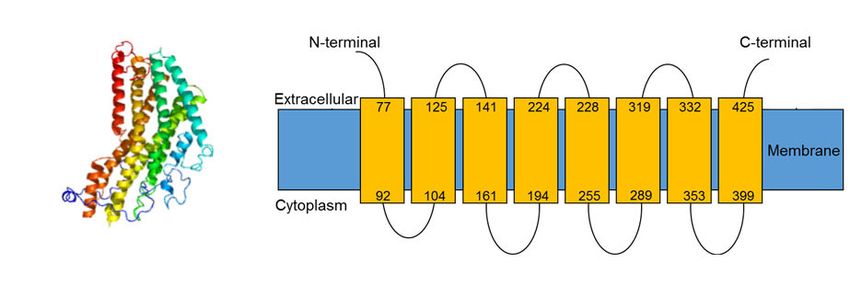
Research article                                                                                                     Ecology

                                   Robert et al., 2012c; Schumann et al., 2018). Non-volatile primary metabolites such as sugars and
                                   fatty acids as well as secondary metabolites such as benzoxazinoids and phenolic acid conjugates
                                   modulate larval behaviour (Bernklau et al., 2011; Bernklau et al., 2015; Bernklau et al., 2016a;
                                   Bernklau et al., 2018; Erb et al., 2015; Hu et al., 2018; Huang et al., 2017; Machado et al., 2021;
                                   Robert et al., 2012c). Volatiles including (E)-b-caryophyllene, ethylene, and CO2 attract the larvae
                                   (Bernklau and Bjostad, 1998a; Bernklau and Bjostad, 1998b; Robert et al., 2012b; Robert et al.,
                                   2012a), while methyl anthranilate repels them (Bernklau et al., 2016b). Based on the finding that
                                   high CO2 levels can outweigh the attractive effects of other maize volatiles, it was suggested that
                                   CO2 may be the only relevant volatile attractant for WCR larvae (Bernklau and Bjostad, 1998b).
                                   However, under conditions where CO2 levels are similar, WCR larvae reliably choose between host
                                   plants of different suitability using other volatile cues (Huang et al., 2017; Lu et al., 2016;
                                   Robert et al., 2012b; Robert et al., 2012a). The demonstrated ability of WCR larvae to respond to
                                   different volatile cues and the recent identification of putative CO2 receptors from transcriptomic
                                   data (Rodrigues et al., 2016) make this species a suitable model system to investigate the role of
                                   CO2 in plant–herbivore interactions. Ongoing efforts to use CO2 as a bait to control WCR in the field
                                   (Bernklau et al., 2004; Schumann et al., 2014a; Schumann et al., 2014b) provide further motiva-
                                   tion to assess the importance of this volatile for WCR foraging.
                                       To understand the importance of CO2 for WCR foraging in the soil, we manipulated the insect’s
                                   capacity to perceive CO2. We reduced the expression levels of three putative WCR CO2 receptor-
                                   encoding genes through RNA interference (RNAi), resulting in the identification of DvvGr2 as an
                                   essential gene for CO2 perception. Using DvvGr2-silenced larvae in combination with CO2 removal,
                                   we then assessed the importance of CO2 perception for WCR behaviour and foraging in olfactome-
                                   ters and soil arenas. Our experiments reveal how root-associated CO2 modulates the interaction
                                   between maize and its economically most damaging root pest and expand the current repertoire of
                                   potential adaptive explanations for the attraction of insect herbivores to CO2.

                                   Results
                                   Plants create CO2 gradients in the soil
                                   Plant-emitted CO2 may be used as a host location cue by root herbivores. To understand whether
                                   the presence of plant roots is associated with higher CO2 levels, we measured CO2 levels in the soil
                                   at different distances from young maize seedlings. We observed a significant CO2 gradient in the
                                   soil, with concentrations of 548–554 ppm in the rhizosphere, 506–515 ppm at distances between 8
                                   and 16 cm from the plant, and 460–484 ppm at distances between 16 and 32 cm (Figure 1A). At dis-
                                   tances of more than 40 cm, CO2 levels levelled off at 425–439 ppm. We then removed the plants
                                   and remeasured CO2 levels 1 hr afterwards. In the absence of the plants, no CO2 gradient was
                                   observed, and CO2 concentrations in the soil were around 430 ppm (Figure 1B). When surrounding
                                   soil was removed and seedling roots were washed, we observed 542 ± 6.74 ppm CO2 around the
                                   roots (n = 3). Thus, the release of CO2 from maize roots can account for the CO2 difference between
                                   soil trays with and without plants. This experiment shows that elevated CO2 levels derived from
                                   roots and probably from root-associated microorganisms are temporally and spatially associated
                                   with the presence of maize roots, and may thus be used as a host location cue by the WCR. To test
                                   this hypothesis, we identified CO2 receptors in WCR larvae, genetically impair their expression, and
                                   conducted a series of behavioural experiments as described below.

                                   The WCR genome encodes three putative CO2 receptors
                                   To identify genes encoding putative CO2 receptors in WCR, we used known CO2 receptor-encoding
                                   gene sequences as queries against the WCR genome (available from the National Center for Bio-
                                   technology Information [NCBI]). Three putative carbon dioxide receptor candidates, DvvGr1,
                                   DvvGr2, and DvvGr3, were identified, matching three candidate genes that were found in previous
                                   transcriptome analyses (Rodrigues et al., 2016). Phylogenetic reconstruction based on in silico-pre-
                                   dicted protein sequences revealed orthologous relationships for the three WCR candidate receptors
                                   and the receptors of several other insects (Figure 2A). Consistent with their taxonomy, we observed
                                   close homology between the protein sequences of the CO2 receptors of WCR and the protein
                                   sequences of other coleopteran insects such as Tribolium castaneum (Figure 2A). Expression levels

Arce, Theepan, et al. eLife 2021;10:e65575. DOI: https://doi.org/10.7554/eLife.65575                                             3 of 29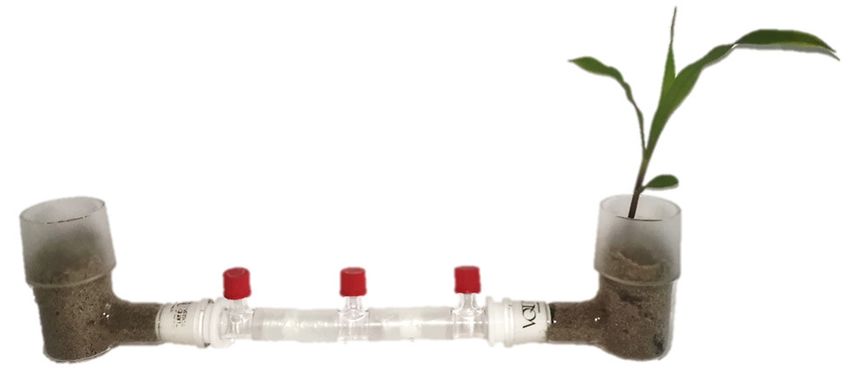
Research article                                                                                                          Ecology

               A                                                                           B

                                                          80 cm                                                       80 cm

                                                                                          4.5cm

                              1    2       3   4      5    6      7   8   9    10 11              1   2   3   4   5    6      7   8    9    10 11
               C                                                                           D
                        600                                          a                a
                                                           bc abc ab
    CO2 concentration
     (µmol/mol, ppm)

                        500
                              d            d          d cd
                                    d          d                                                  d   d   d   d   d    d      d   d    d     d     d
                        400
                        300
                        200
                        100
                          0
                              1     2      3   4      5    6      7   8   9    10    11           1   2   3   4   5    6      7   8    9    10    11

                                                                                    Tray position

Figure 1. Plants create CO2 gradients in the soil. (A, B) CO2 levels were determined in soil-filled trays at different distances from young maize seedlings
(A) before and (B) after removing the seedlings from the system. Arrows indicate air sampling points. Different colours indicate sampling positions
within three individual trays that were assayed (n = 3). Red arrows indicate samplings points in tray 1, green arrows indicate samplings points in tray 2,
and blue arrows indicate samplings points in tray 3. (C, D) Mean (± SEM) CO2 levels at different distances from the plant (C) before and (D) after
removing the seedlings from the system. Different letters indicate significant differences in CO2 levels in each tray position (p < 0.05 by two-way
ANOVA with Holm’s multiple-comparisons test). For details regarding the statistical results, refer to Supplementary file 1. Raw data are available in
Figure 1—source data 1.
The online version of this article includes the following source data for figure 1:
Source data 1. Raw data for Figure 1.

                                                   of DvvGr1 and DvvGr2 were found to be significantly higher in the head than in the rest of the body
                                                   (thorax and abdomen) of second instar WCR larvae (Figure 2B, C). No significant difference in
                                                   expression was observed for DvvGr3 (Figure 2D). Protein tertiary structure and topology models
                                                   indicated that all three genes encode for 7-transmembrane domain proteins, which is consistent with
                                                   their roles as receptors (Figure 2B–D).

                                                   DvvGr2 expression is specifically required for responsiveness of WCR
                                                   larvae to CO2
                                                   To determine the importance of DvvGr1, DvvGr2, and DvvGr3 for the responsiveness of WCR larvae
                                                   to CO2, we knocked down the expression of each gene individually through double-stranded RNA
                                                   (dsRNA)-mediated RNAi and conducted initial behavioural experiments with carbonated water as a
                                                   CO2 source (Figure 3). Oral administration of dsRNA targeting either DvvGr1, DvvGr2, or DvvGr3
                                                   reduced the expression levels of these genes by 80%, 83%, and 66% compared to WCR larvae fed
                                                   with dsRNA of the green fluorescent protein (GFP) gene (herein referred to as wild type [WT])
                                                   (Figure 3A). All RNAi constructs were confirmed to be gene specific (Figure 3A). Measurements
                                                   within the olfactometers showed that CO2 levels were approximately 100 ppm higher in the arms of
                                                   the L-shaped pots that contained plastic cups filled with carbonated water than in the arms of
                                                   L-shaped pots that contained plastic cups filled with distilled water (Figure 3B, Figure 3—figure
                                                   supplement 1). A higher proportion of WT larvae moved towards olfactometer arms with higher

Arce, Theepan, et al. eLife 2021;10:e65575. DOI: https://doi.org/10.7554/eLife.65575                                                               4 of 29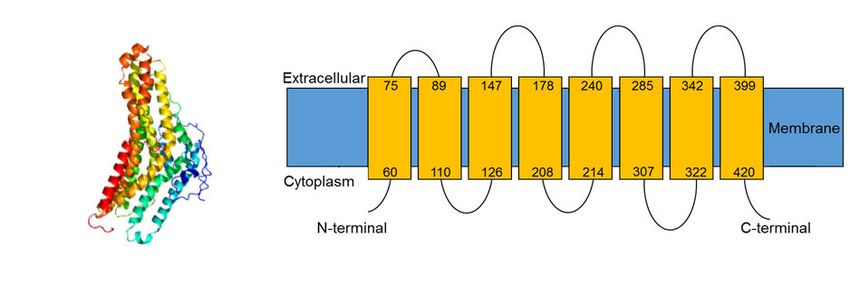
Research article                                                                                                                Ecology

                                                                 A

                                                                                                   64
                                                                                                   100
                                                                                                         Group 1
                                                                                          0.1            Group 2
                                                                                                         Group 3
                                                                                     81

                                                                 B                Carbon dioxide Group 1 receptor (DvvGr1)

                                                               0.12       ***
                                                               0.09
                                                               0.06
                                                               0.03
                                                                  0
                                                                      Body Head
                                                                 C
                                        Relative expression

                                                                                  Carbon dioxide Group 2 receptor (DvvGr2)
                                                               0.12
                                                               0.09        ***
                                                               0.06
                                                               0.03
                                                                  0
                                                                      Body Head

                                                                 D                 Carbon dioxide Group 3 receptor (DvvGr3)
                                                                           n.s
                                                              0.016
                                                              0.012
                                                              0.008
                                                              0.004
                                                                  0
                                                                      Body Head

                                   Figure 2. The western corn rootworm (WCR) genome contains three putative carbon dioxide (CO2) receptors. (A)
                                   Phylogenetic relationships between putative CO2 receptors based on protein sequences of different insects. Dmel:
                                   Drosophila melanogaster; Dsim: Drosophila simulans; Dsec: Drosophila sechellia; Dyak: Drosophila yakuba; Dere:
                                   Drosophila erecta; Dana: Drosophila ananassae; Dper: Drosophila persimilis; Dpse: Drosophila pseudoobscura;
                                   Figure 2 continued on next page

Arce, Theepan, et al. eLife 2021;10:e65575. DOI: https://doi.org/10.7554/eLife.65575                                                        5 of 29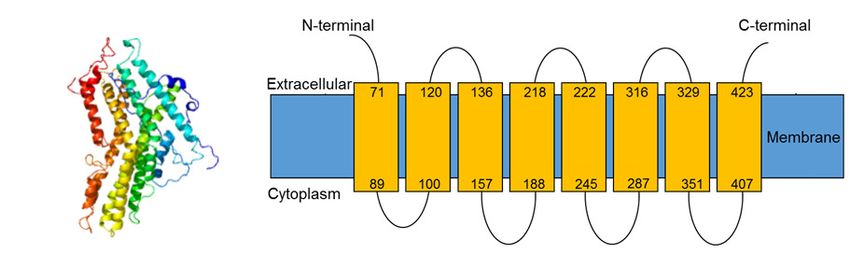
Research article Ecology
Figure 2 continued
Dwil: Drosophila willistoni; Dgri: Drosophila grimshawi; Dmoj: Drosophila mojavensis; Dvir: Drosophila virilis;
Agam: Aedes gambiae; Aaeg: Aedes aegypti; Cqui: Culex quinquefasciatus; Bmor: Bombyx mori; Tcas: Tribolium
castaneum; Dvv: Diabrotica virgifera virgifera (WCR). Evolutionary relationships were inferred using the neighbor-
joining method. The optimal tree with the sum of branch length = 4.44068889 is shown. The percentage of
replicate trees in which the associated taxa clustered together in the bootstrap test (100 replicates) are shown next
to the branches. The tree is drawn to scale, with branch lengths in the same units as those of the evolutionary
distances used to infer the phylogenetic tree. The evolutionary distances were computed using the Poisson
correction method and are in the units of the number of amino acid substitutions per site. A total of 242 amino
acid positions were included in the final data set. (B–D) Mean (± SEM) relative gene expression levels of group 1
(DvvGr1) (B), group 2 (DvvGr2) (C), and group 3 (DvvGr3) (D) CO2 receptors in the bodies (thorax and abdomen) or
heads of second instar WCR larvae (n = 10). Asterisks indicate statistically significant differences between tissue
types within genes (***p < 0.001 by Student’s t test; n.s.: not significant). For details regarding the statistical
results, refer to Supplementary file 1. Raw data are available in Figure 2—source data 1. (B–D) Predicted protein
tertiary structure (left) and transmembrane protein topology (right) of (B) DvvGr1; (C) DvvGr2, and (D) DvvGr3
according to the Phyre2 algorithm.
The online version of this article includes the following source data for figure 2:
Source data 1. Raw data for Figure 2.
CO2 levels (Figure 3C). Silencing DvvGr1 or DvvGr3 expression did not alter this preference. In con-
trast, DvvGr2-silenced larvae did not show preference for any olfactometer arm (Figure 3C). To
explore the role of DvvGr2 in different aspects of WCR behaviour, we conducted a series of addi-
tional experiments. First, we assessed the impact of silencing DvvGr2 on the capacity of WCR larvae
to respond to other volatile and non-volatile host cues (Figure 3D–G). DvvGr2-silenced larvae
responded similarly to the repellent volatile methyl anthranilate as WT larvae (Figure 3E). Respon-
siveness to non-volatile compounds such as Fe(III)(DIMBOA)3 and a blend of glucose, fructose, and
sucrose was also unaltered in DvvGr2-silenced larvae (Figure 3F, G), demonstrating that knocking
down DvvGr2 expression does not alter the capacity of WCR larvae to respond to other important
chemical cues. Second, we assessed the contribution of DvvGr2 to CO2 responsiveness using syn-
thetic CO2 at different concentrations (Figure 4, Figure 4—figure supplement 1). WT larvae
showed characteristic dose-dependent behavioural responses to CO2. While they did not respond
to 22 ppm CO2 above ambient CO2 levels, they were attracted to CO2 concentrations between
59 and 258 ppm above ambient and repelled by CO2-enriched air at 950 ppm above ambient CO2
levels and above (Figure 4). In contrast, DvvGr2-silenced larvae did not respond to CO2 enrichment
at any of the tested concentrations (Figure 4). These experiments show that WCR larvae are
attracted to CO2-enriched environments within the physiological range of the maize rhizosphere and
that DvvGr2 silencing fully and specifically suppresses CO2 responsiveness in WCR larvae.
DvvGr2 expression does not affect larval motility or short-range host
location
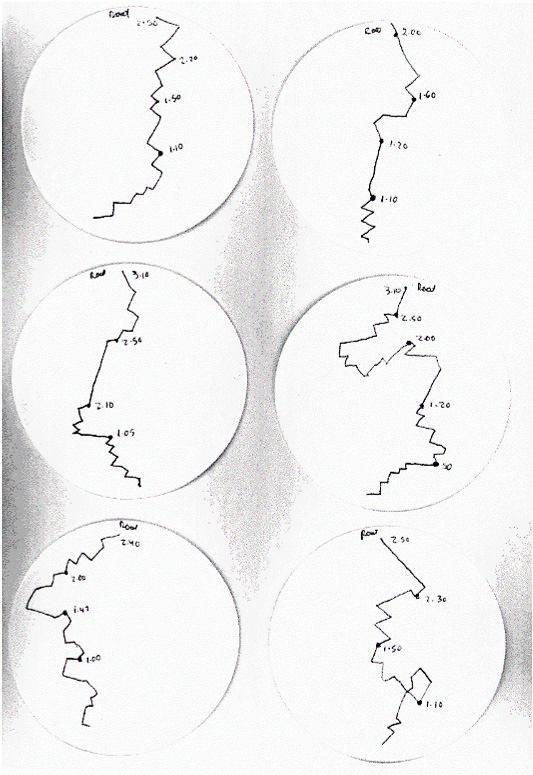
To assess the impact of DvvGr2 on larval motility, we followed the trajectories of individual larvae in
humid filter paper-lined Petri plates that were outfitted with a CO2 point releaser (Figure 5). WT lar-
vae made frequent turns, but consistently oriented themselves towards the CO2 release point. Once
they reached the CO2 release point, they stopped moving (Figure 5A). DvvGr2-silenced larvae
exhibited similar turning behaviour as WT larvae, but did not move towards the CO2 release point
(Figure 5B). WT larvae spend more time on CO2 release point than DvvGr2-silenced larvae
(Figure 5C). During the movement phase, the mean speed of WT larvae and DvvGr2-silenced larvae
was similar (Figure 5C), but the distance covered by DvvGr2-silenced larvae was higher, as they did
not stop at the CO2 release point. In a second experiment, we followed the trajectories of individual
larvae in Petri plates with maize roots (Figure 5D, E). Speed and distance covered were similar
between WT and DvvGr2-silenced larvae (Figure 5F). Surprisingly, both WT and DvvGr2-silenced lar-
vae oriented themselves towards the maize roots and reached the maize roots after a similar amount
of time (Figure 5F). This result shows that DvvGr2 expression is required for the location and detec-
tion of CO2, but does not influence WCR motility nor its ability to locate maize roots over short dis-
tances (i.e.,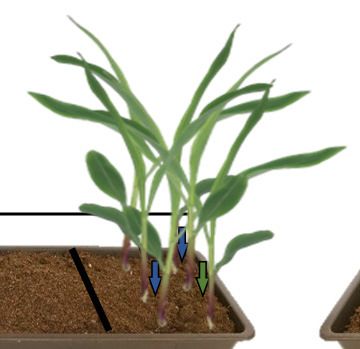
Research article                                                                                                                   Ecology

       A                                               DvvGr1                  B                Water
                                                                                                                              Carbonated
                                                              a                                            Release point of     water
                                   1.6
                                                                                                               larvae
                                   1.2             a                a
                                                                                                        Mesh            Mesh
                                   0.8
                                   0.4                  b
                                     0                                                                   9cm
                                             GFP       Gr1   Gr2   Gr3                         387±14.36                      488±33.65*
             Relative expression

                                                       DvvGr2                                 CO2 concentration (µmol/mol, ppm)
                                   1.6
                                   1.2             a                           C
                                                        a           a
                                   0.8

                                                                                                                                   **
                                                                                WT larvae
                                   0.4                        b
                                     0
                                                                                Gr1-silenced

                                                                                                                                      **
                                             GFP       Gr1   Gr2   Gr3
                                                       DvvGr3
                                   1.6
                                                        a                       Gr2-silenced
                                   1.2             a         a

                                   0.8
                                                                    b

                                                                                                                                      **
                                   0.4                                          Gr3-silenced
                                    0
                                             GFP       Gr1   Gr2   Gr3                 -100 -75 -50 -25 0               25 50 75 100
                                             dsRNA fed to larvae                                     Larval choice (%)

       D                                                                       E                                       Roots +
                                                                                                      Roots
                                                                                                                  methyl anthranilate
                                                                                               ***

                                                                               WT larvae
                                         Control             Cue
                                                                                               ***

                                                                               Gr2-silenced

                                                                                           -90       -60 -30      0    30
                                                                                                     Larval choice (%)
       F                                                                       G
                                          Buffer Fe(III)(DIMBOA)3                                    Buffer       Sugar Blend
                                                                         ***

                                                                                                                                      ***

    WT larvae                                                                      WT larvae
                                                                                                                                      ***
                                                                        ***

   Gr2-silenced                                                                 Gr2-silenced

                                   -30 -15 0 15 30 45 60                                       -30 -15 0 15 30 45 60
                                       Larval choice (%)                                            Larval choice (%)

Figure 3. The carbon dioxide group 2 receptor (DvvGr2) is specifically required for the attraction of western corn rootworm (WCR) towards CO2. (A)
Mean (± SEM) relative gene expression levels of group 1 (DvvGr1), group 2 (DvvGr2), and group 3 (DvvGr3) CO2 receptors after WCR larvae were fed
with dsRNA-expressing bacteria targeting green fluorescent protein (GFP, herein referred to as WT), DvvGr1, DvvGr2, or DvvGr3 genes (n = 11–13).
Different letters indicate significant differences of gene expression levels (p < 0.05 by one-way ANOVA with Holm’s multiple-comparisons test). (B)
Figure 3 continued on next page

Arce, Theepan, et al. eLife 2021;10:e65575. DOI: https://doi.org/10.7554/eLife.65575                                                           7 of 29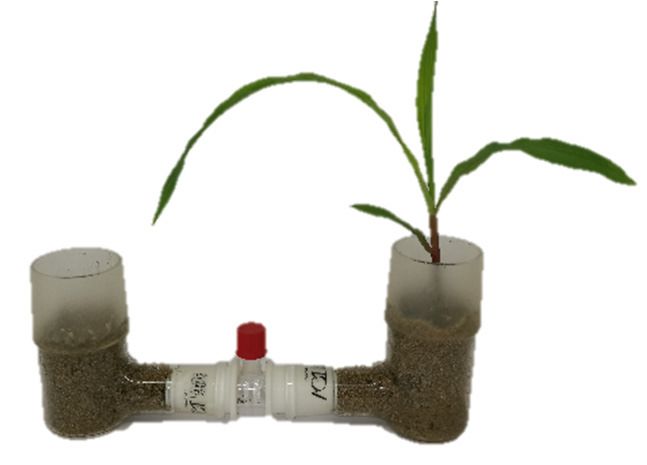
Research article                                                                                                                         Ecology

Figure 3 continued
Mean (± SEM) CO2 levels in each L-shaped pot of the two-arm belowground olfactometers used to test the attractive and repellent effects of CO2 to
WCR larvae (n = 4–8). Asterisk indicates significant differences in CO2 levels (*p < 0.05 by Student’s t test). For detailed data on CO2 levels, refer to
Figure 3—figure supplement 1. (C) Mean (± SEM) proportion of WCR larvae observed in the olfactometer arms with higher CO2 levels (carbonated
water side) or in control arms (distilled water side). Larvae were considered to have made a choice when they were found at a distance of 1 cm or less
from the wire mesh (indicated by dashed green lines). Seven olfactometers with six larvae each were assayed (n = 7). (D) Petri plates used to test insect
responses to methyl anthranilate, to Fe(III)(DIMBOA)3, and to sugars. (E) Mean (± SEM) proportion of WCR larvae observed on roots or on roots placed
next to filter paper discs impregnated with methyl anthranilate, (F) on filter paper discs impregnated with buffer or with Fe(III)(DIMBOA)3, and (G) on
filter paper discs impregnated with buffer or with a blend of glucose, fructose, and sucrose. For (E), 10 choice arenas with five larvae each were assayed
(n = 10). Larvae were considered to have made a choice when they made physical contact with the roots or the filter paper discs. For (F, G), 20 choice
arenas with six larvae each were assayed (n = 20). Asterisks indicate statistically significant differences in larval choices between treatments (***p < 0.001
by generalized linear model followed by False discovery rate (FDR)-corrected post hoc tests). Note that the number of replicates across experiments
varied depending on the availability of insects. For details regarding the statistical results, refer to Supplementary file 1. Raw data are available in
Figure 3—source data 1.
The online version of this article includes the following source data and figure supplement(s) for figure 3:
Source data 1. Raw data for Figure 3.
Figure supplement 1. Carbon dioxide levels at different sampling points.

                                      Root-associated CO2 enhances volatile-mediated host location by WCR
                                      larvae in a distance-specific manner
                                      To further explore the role of plant-associated CO2 and DvvGr2 in volatile-mediated host location,
                                      we performed a series of olfactometer experiments with maize plants grown in sand on one side
                                      and sand only on the other side. We tested attraction at two distances, 9 and 18 cm, from the vola-
                                      tile sources and the release points of the larvae (Figure 6). We also manipulated the diffusion of
                                      CO2 into the arms of a subset of olfactometers by adding a layer of CO2-absorbing soda lime into
                                      the olfactometer arms. CO2 measurements revealed that the presence of a host root system
                                      increased CO2 concentrations by approximately 100 ppm above ambient CO2 levels in the corre-
                                      sponding olfactometer arm (Figure 6, Figure 6—figure supplement 1). The soda lime reduced
                                      ambient CO2 concentrations in the olfactometer arms by approximately 100 ppm and equalized
                                      CO2 concentrations between arms with and without a host plant (Figure 6). The diffusion of other
                                      maize root volatiles was not affected by the soda lime (Figure 6—figure supplement 2), thus vali-
                                      dating the CO2 scrubbing approach. Larvae did not have direct access to the plant, the plant growth
                                      medium, or the soda lime, and received no visual cues, and thus had to rely on host plant volatiles
                                      for orientation. When released at distance of 9 cm from the volatile sources, both WT and DvvGr2-
                                      silenced larvae showed a clear preference for the olfactometer arms leading to host plants
                                      (Figure 6A). This preference was still intact in olfactometers outfitted with soda lime, showing that
                                      volatiles other than CO2 are sufficient for volatile-mediated host location at a short distance. At a
                                      distance of 18 cm from the volatile sources, WT larvae showed a similarly strong preference for arms
                                      leading to host plants (Figure 6B). By contrast, DvvGr2-silenced larvae did not exhibit any prefer-
                                      ence (Figure 6B). In the presence of soda lime, neither WT nor DvvGr2-silenced larvae were
                                      attracted to arms with a host plant (Figure 6B). Taken together, these experiments provide strong
                                      support for the hypothesis that WCR larvae use plant-associated CO2 to locate host plants over dis-
                                      tances greater than 9 cm in a DvvGr2-dependent manner.

                                      Root-associated CO2 enhances volatile-mediated host location by WCR
                                      larvae in a distance-specific manner
                                      WCR larvae can move up to 1 m in the soil. Second and third instar larvae in particular are known to
                                      move between maize plants across rows in maize fields (Hibbard et al., 2003). To test whether
                                      DvvGr2-mediated CO2 responsiveness mediates host location over longer distances in a soil context,
                                      we planted maize plants in soil-filled plastic trays, released WCR larvae at distances of 16, 32, 48, or
                                      64 cm from the maize plants, and evaluated larval positions after 8 hr (Figure 7). This time point was
                                      chosen based on preliminary observations showing that larvae take approximately 8 hr to cross the
                                      soil arenas. Direct access to the roots was impeded by using volatile-permeable fabrics, referred to
                                      hereby as root barriers. The CO2 emitted by maize roots formed a gradient in the soil, starting at
                                      about 506 ppm in the rhizosphere (zone 1) and 430 ppm at distances of 16–32 cm from the plant

Arce, Theepan, et al. eLife 2021;10:e65575. DOI: https://doi.org/10.7554/eLife.65575                                                                  8 of 29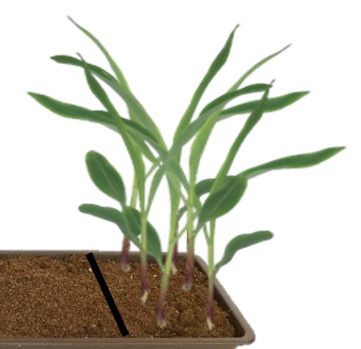
Research article                                                                                              Ecology

    A
                                                                Air                 CO2-enriched air
                                                                         Release point of
                                                                             larvae
                                                                      Mesh           Mesh

                                                                      9cm
    B
                               CO2 concentration                                                                 CO2 concentration
                                (µmol/mol, ppm)                                                                   (µmol/mol, ppm) ǻCO2
                                     511                                                                                 533        22*
                                     513                                                                                 572        59**
                                     522
                                                                                                              ***        730       208***
                                     526
                                                                                                            ***          784       258***
                                                                                                       **
        WT larvae

                                     516                                                                                 970       454***
                                     537                                                                                1041       504***
                                     504                                                                                1173       669***
                                     508                                                                                1463       955***
                                     502
                                                      *                                                                 1748      1246***
                                     529
                                                    **                                                                  2062      1533***
                                     515
                                                  ***                                                                   2347      1832***
                                        505
                                                  ***                                                                      528          23**
                                        518                                                                                570          52**
        Gr2-silenced larvae

                                        508                                                                                724         216***
                                        522                                                                                773         251***
                                        505                                                                                964         459***
                                        526                                                                                1034        508***
                                        489                                                                                1164        675***
                                        509                                                                                1456        947***
                                        491                                                                                1738        1247***
                                        534                                                                                2057        1523***
                                        521                                                                                2343        1822***

                                                 -100 -80 -60 -40 -20 0        20           40   60     80 100
                                                                Larval choice (%)

Figure 4. DvvGr2 is required for dose-dependent western corn rootworm (WCR) responses to CO2. (A) Two-arm olfactometer used to test the attractive
and repellent effects of CO2 on WCR larvae. (B) Mean ( ± SEM) proportion of WCR larvae observed in each arm of the olfactometers. Larvae were
considered to have made a choice when they were found at a distance of 1 cm or less from the wire mesh, indicated by dashed green lines. Three
olfactometers with six larvae each were assayed (n = 3). Asterisks indicate statistically significant differences between larval choices (*p < 0.05;
**p < 0.01; ***p < 0.001 by generalized linear model [GLM] followed by FDR-corrected post hoc tests). Mean CO2 concentrations in each olfactometer
side and the difference between them (DCO2) are indicated. Asterisks indicate significant differences in the CO2 levels of each olfactometer arm
(*p < 0.05; **p < 0.01; *** p < 0.001 by GLM followed by FDR-corrected post hoc tests). For detailed data on CO2 levels, refer to Figure 4—figure
supplement 1. For details regarding the statistical results, refer to Supplementary file 1. Raw data are available in Figure 4—source data 1.
The online version of this article includes the following source data and figure supplement(s) for figure 4:
Source data 1. Raw data for Figure 4.
Figure supplement 1. Carbon dioxide levels at different sampling points.

Arce, Theepan, et al. eLife 2021;10:e65575. DOI: https://doi.org/10.7554/eLife.65575                                                         9 of 29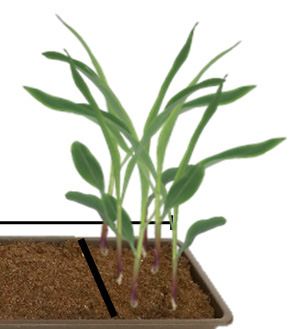
Research article Ecology
A WT larvae B Gr2-silenced larvae C
Mean speed
0.25
(cm/s)
0.2
0.15
0.1
0.05
0
distance (cm)
20 ***
Crawled
15
10
5
0
CO2 source (s)
Time spent on
160 ***
120
80
40
2.25 cm
0
CO2 source Release point of larvae Larval trajectory WT Gr2-
silenced
D WT larvae E Gr2-silenced larvae F
0.12
Mean speed
(cm/s)
0.08
0.04
0
18
distance (cm)
Crawled
12
*** 6
0
reach roots (s)
200
Time spent to
150
100
2.25 cm
50
Maize root Release point of larvae Larval trajectory
0
WT Gr2-
silenced
Figure 5. Silencing the carbon dioxide group 2 receptor (DvvGr2) impairs western corn rootworm (WCR) responses to CO2 without affecting larval
motility or search behaviour. (A, B) Trajectories of individual wild type (WT) (A) and DvvGr2-silenced (B) WCR larvae in Petri plates with a CO2 source.
The blue circles represent larval release points. The red circles represent CO2 sources consisting of a fine needle that releases CO2 at 581 ppm,
resulting in CO2 concentrations 60 ppm above ambient CO2 levels at the release point. (C) Mean (± SEM) speed and distance covered during the
Figure 5 continued on next page
Arce, Theepan, et al. eLife 2021;10:e65575. DOI: https://doi.org/10.7554/eLife.65575 10 of 29Research article Ecology
Figure 5 continued
movement phase, and time spent at the CO2 source during the first 3 min of the experiment. (D, E) Trajectories followed by WT (D) and by DvvGr2-
silenced (E) WCR larvae on Petri plates containing maize seedling roots. The blue circles represent larval release points. The yellow circles represent
maize seedling roots. (F) Mean (± SEM) speed and distance covered during the movement phase, and time necessary to reach the maize root during
the first 3 min of the experiment. For both experiments, six Petri plates with one larva each were assayed (n = 6). Asterisks indicate statistically
significant differences between mobility parameters of WT and DvvGr2-silenced larvae (***p < 0.001 by Student’s t test). For details regarding the
statistical results, refer to Supplementary file 1. Raw data are available in Figure 5—source data 1.
The online version of this article includes the following source data for figure 5:
Source data 1. Raw data for Figure 5.
(zone 2) (Figure 7B, Figure 7—figure supplement 1). At distances of more than 32 cm from the
plant, the CO2 levels were around 400 ppm and statistically indistinguishable from soil without plants
or ambient air (Figure 7—figure supplement 1). To confirm that larval motility is not altered by
DvvGr2 silencing in a soil context, we first released WT and DvvGr2-silenced larvae into the middle
of a set of arenas without a host plant and evaluated larval positions after 8 hr. We found that the
larvae dispersed equally across the arenas, without any difference between WT and DvvGr2-silenced
larvae (Figure 7A). Eight hours after releasing the larvae into arenas that included host plants on
one side, 53% of WT larvae that were released at 64 cm from the plant were retrieved close to the
maize rhizosphere, that is, in zone 1 (Figure 7C). In contrast, only 33% of the DvvGr2-silenced larvae
that were released at the same distance were recovered from the maize rhizosphere (Figure 7C).
Significantly more DvvGr2-silenced larvae were recovered further away from the plants, in zones 3
and 4 (Figure 7C). The number of WT and DvvGr2-silenced WCR larvae found close to the host plant
increased with decreasing release distance, as did the difference between WT and DvvGr2-silenced
larvae (Figure 7C–F). At a release distance of 16 cm, only slightly more WT than DvvGr2-silenced lar-
vae were found close to the plant roots (Figure 7F). To further confirm the role of DvvGr2 in mediat-
ing host plant location over long distances in the soil, we performed a time-course experiment
where we released WT and DvvGr2-silenced larvae in zone 5 (64 cm away from the host plant) and
then recorded how rapidly they reached zone 1 containing host plants (Figure 7—figure supple-
ment 2). The capacity of the larvae to directly feed on the host roots was impeded using a volatile-
permeable root barrier (Figure 7—figure supplement 2). Within 10 hr, 36% of the released WT lar-
vae were found in zone 1, and within 32 hr, this number had increased to 90% (Figure 7—figure
supplement 2). By contrast, only 24% of the released DvvGr2-silenced larvae were found in zone 1
after 10 hr, and after 32 hr, this value had only increased to 56% (Figure 7—figure supplement 2).
Thus, the capacity to detect CO2 gradients contributes to successful host location by WCR larvae in
a distance-specific manner in the soil. While larvae released at a distance equal to or below 32 cm
from the host plant (zones 2–3) can use CO2 directly as a host location cue, larvae released at
greater distances likely move randomly before reaching zones with plant-associated CO2 gradients.
CO2 perception enhances the capacity of WCR larvae to locate better
hosts
Plant nutritional status determines plant growth and defence, and can thus modulate plant–herbi-
vore interactions (Wetzel et al., 2016). To test for a possible connection between plant nutritional
status, host suitability, and CO2-dependent herbivore attraction, we varied the nutrient supply of
maize plants and then carried out CO2 measurements, and behavioural and insect performance
experiments (Figure 8). To exclude direct or soil-mediated effects of fertilization, plants were first
grown under different fertilization regimes and then, prior to experiments, harvested, washed, and
replanted. Higher CO2 levels were observed close to the roots of plants that were well fertilized
compared to the levels that were observed close to the roots of plants that received medium (50%
of optimally fertilized plants) or low (10% of optimally fertilized plants) fertilizer doses (Figure 8A, B,
Figure 8—figure supplement 1A, B). As observed before, soil CO2 levels decreased with increasing
distance from the plants and were lowest in the middle of the experimental trays (Figure 8A, B). In
choice experiments with maize plants planted approximately 50 cm apart, which corresponds to row
spacing used for high planting densities in maize cultivation, WT larvae showed a significant prefer-
ence for well-fertilized over medium- or low-fertilized plants (Figure 8C, D). DvvGr2-silenced larvae
did not show any preference (Figure 8C, D). In no-choice experiments, WCR larvae gained most
Arce, Theepan, et al. eLife 2021;10:e65575. DOI: https://doi.org/10.7554/eLife.65575 11 of 29Research article Ecology
A
Release point of
larvae
CO2-scrubber
Metal mesh
CO2 concentration 9cm CO2 concentration
ǻCO2
(µmol/mol, ppm) (µmol/mol, ppm)
WT 505 605 100***
**
Control
larvae
Gr2-silenced 505 615 110***
larvae **
CO2 scrubber
WT
390 391 1
larvae **
Gr2-silenced
378 375
larvae ** 3
-75 -60 -45 -30 -15 0 15 30 45 60 75
Larval choice (%)
B Release point of
larvae
18cm
CO2 concentration CO2 concentration ǻCO2
(µmol/mol, ppm) (µmol/mol, ppm)
WT 504 624 120***
**
Control
larvae
Gr2-silenced 504 610 106***
larvae
CO2 scrubber
WT 384 386 2
larvae
Gr2-silenced 378 377 1
larvae
-75 -60 -45 -30 -15 0 15 30 45 60 75
Larval choice (%)
Figure 6. Plant-associated CO2 mediates host location by western corn rootworm (WCR) larvae in a distance-specific manner. (A, B) Mean (± SEM)
proportion (%) of WCR larvae observed on each side of the olfactometers. Larva were considered to have made a choice when they were found at a
distance of 1 cm or less from the wire mesh, indicated by dashed green lines. Control olfactometers allowed for plant-associated CO2 to diffuse into
the central glass tubes, while CO2 scrubber olfactometers were outfitted with soda lime to suppress CO2 diffusion while allowing for the diffusion of
Figure 6 continued on next page
Arce, Theepan, et al. eLife 2021;10:e65575. DOI: https://doi.org/10.7554/eLife.65575 12 of 29Research article Ecology
Figure 6 continued
other volatiles. Mean CO2 concentrations in each olfactometer side and the difference between them (DCO2) are given. Asterisks indicate significant
differences in the CO2 levels of each olfactometer arm (***p < 0.001 by generalized linear model [GLM] followed by FDR-corrected post hoc tests). For
detailed data on CO2 levels and other volatiles, refer to Figure 6—figure supplements 1 and 2. Four olfactometers with six larvae each were assayed
using wild type (WT) or DvvGr2-silenced larvae (n = 4). Asterisks indicate statistically significant differences between treatments (**p < 0.01 by GLM
followed by FDR-corrected post hoc tests). For details regarding the statistical results, refer to Supplementary file 1. Raw data are available in
Figure 6—source data 1.
The online version of this article includes the following source data and figure supplement(s) for figure 6:
Source data 1. Raw data for Figure 6.
Figure supplement 1. Carbon dioxide levels at different sampling points.
Figure supplement 2. Soda lime does not influence the diffusion of plant volatiles other than CO2 into olfactometer arms.
weight on washed roots of well-fertilized maize plants than on washed roots of plants treated with
medium or low doses of fertilizer (Figure 8E). Hence, intact CO2 perception allows WCR larvae to
locate suitable host plants at agriculturally relevant distances, which may result in specific insect dis-
tribution patterns in heterogeneous environments.
Discussion
In this study, we conducted gene sequence similarity analyses, phylogenetic relationship reconstruc-
tions, RNA interference, and behavioural experiments to explore the biological relevance of root-
associated CO2 for plant–herbivore interactions. We found that the WCR genome contains at least
three putative CO2 receptor-encoding genes: DvvGr1, DvvGr2, and DvvGr3, which is consistent with
previous transcriptomic-based studies (Rodrigues et al., 2016). Protein tertiary structure and topol-
ogy prediction models show that the identified genes code for proteins that contain seven trans-
membrane domains, which is consistent with the protein topology of gustatory and olfactory
receptors (Dahanukar et al., 2005; Hallem et al., 2006). Larval behaviour and gene silencing based-
functional characterization of the three identified WCR putative CO2 receptor genes revealed that
the intact expression of DvvGr2 is essential for the attractive effects of CO2 to WCR larvae. Knocking
down DvvGr2 rendered larvae fully unresponsive to synthetic and plant-associated CO2 without
impairing responses to other stimuli or affecting search behaviour and motility. In Aedes aegypti,
Helicoverpa armigera, and Drosophila melanogaster, both carbon dioxide receptors Gr1 and Gr3
are required for CO2 detection (Erdelyan et al., 2012; Jones et al., 2007; Kwon et al., 2007;
McMeniman et al., 2014; Ning et al., 2016; Suh et al., 2004). In Culex quinquefasciatus, both Gr2
and Gr3 carbon dioxide receptors are required, while Gr1 acts as a modulator (Xu et al., 2020). In
A. aegypti, the involvement of Gr2 in carbon dioxide responsiveness is still under debate
(Erdelyan et al., 2012; Kumar et al., 2019). Taken together, the molecular elements required for
carbon dioxide perception may be species-specific. Our results support this notion as DvvGr2, but
not DvvGr1 and DvvGr3, are crucial for CO2 responsiveness. The role of DvvGr1 and DvvGr3 for
WCR remains to be determined, but their presence and expression may hint at additional complexity
in developmental and/or tissue-specific patterns of CO2 responsiveness in this species.
Despite the inability of DvvGr2-silenced WCR larvae to respond to differences in CO2 levels, the
larvae were still able to orient towards maize roots at short distances of 8–10 cm. Olfactometer
experiments in combination with CO2 removal demonstrate that other volatile cues can be used by
WCR larvae to locate maize plants at distances shorter than 9 cm. Earlier studies found that (E)-b-car-
yophyllene, which is emitted from the roots of certain maize genotypes when they are attacked by
root herbivores, attracts second and third instar WCR larvae and allows them to aggregate on maize
plants and thereby enhance their fitness (Robert et al., 2012b), while neonate larvae are not
attracted to this volatile (Hiltpold and Hibbard, 2016). Ethylene has also been shown to attract
WCR larvae (Robert et al., 2012a), and MBOA or its breakdown products have also been proposed
as volatile attractants (Bjostad and Hibbard, 1992). Methyl anthranilate, on the other hand, has
been shown to repel WCR larvae (Bernklau et al., 2016b; Bernklau et al., 2019). Many other leaf-
and root-feeding herbivores are known to respond to plant volatiles other than CO2 (Bruce et al.,
2005). Given the low reliability of CO2 as a host-specific cue, it is probably not surprising that WCR,
as a highly specialized maize feeder, can use other volatile cues to locate host plants. Integrating
Arce, Theepan, et al. eLife 2021;10:e65575. DOI: https://doi.org/10.7554/eLife.65575 13 of 29Research article Ecology
Release point of
A larvae
80 cm
Zone 5 Zone 4 Zone 3 Zone 2 Zone 1 4.5cm
Proportion of larvae in
each tray zone (%)
WT larvae Gr2-silenced larvae
30
20
10
0
Zone 5 Zone 4 Zone 3 Zone 2 Zone 1
Tray zone where larvae were recovered
B
Zone 5 Zone 4 Zone 3 Zone 2 Zone 1
404±7.84c 397±4.89c 402±2.97c 430±7.62b 506±31.8a
C CO2 concentration (µmol/mol, ppm)
80
WT larvae Gr2-silenced larvae
60 Release point of
**
larvae
38%
40
* *
20
Proportion of larvae in each tray zone (%)
0
D 80
60 Release point of
larvae
** 31%
40
20
0
E
80
60
Release point of
larvae
**
32%
40
20
*
0
F *
80 16%
Release point of
60 larvae
40
20
0
Zone 5 Zone 4 Zone 3 Zone 2 Zone 1
Tray zone where larvae were recovered
Figure 7. Root-associated CO2 is used by western corn rootworm (WCR) larvae for host location in a distance-
specific manner. (A) Mean (± SEM) proportion of wild type (WT) (dark green) or DvvGr2-silenced (light green) WCR
larvae observed in the different tray zones 8 hr after releasing the larvae in the centre of soil-filled trays without
plants. Three trays per larval type with 20 larvae each were assayed (n = 3). (B) Schematic representation
Figure 7 continued on next page
Arce, Theepan, et al. eLife 2021;10:e65575. DOI: https://doi.org/10.7554/eLife.65575 14 of 29Research article Ecology
Figure 7 continued
(photomontage) of experimental set-up used to test distance-specific host location abilities of WCR larvae
depicting mean (± SEM) CO2 levels detected in the soil gas phase of each tray zone (n = 3–4). Different letters
indicate significant differences in CO2 levels (p < 0.05 by one-way ANOVA with Holm’s multiple-comparisons test).
For detailed data on CO2 levels, refer to Figure 7—figure supplement 1. (C–F) Mean (± SEM) proportion of WT
(dark green) or DvvGr2-silenced (light green) WCR larvae observed in the different tray zones 8 hr after releasing
the larvae at distances of 64 cm (C), 48 cm (D), 32 cm (E), or 16 cm (F) from the plants. Six trays per larval type and
distance combination with 20 larvae each were assayed (n = 6). Asterisks indicate statistically significant differences
in the proportion of WT and DvvGr2-silenced larvae found in each tray zone (*p < 0.05; **p < 0.01 by generalized
linear model followed by FDR-corrected post hoc tests). For details regarding the statistical results, refer to
Supplementary file 1. Raw data are available in Figure 7—source data 1.
The online version of this article includes the following source data and figure supplement(s) for figure 7:
Source data 1. Raw data for Figure 7.
Figure supplement 1. Carbon dioxide levels at different sampling points.
Figure supplement 2. Root-associated CO2 is required for host location by western corn rootworm (WCR) larvae
at long distances.
other volatile cues likely allows WCR larvae to locate maize plants even in the absence of reliable
CO2 gradients in the soil, thus increasing the robustness of its foraging behaviour at short distances.
An intriguing result in this context is the fact that WCR larvae show the same efficiency in locating
maize roots at short distances in the absence of a CO2 gradient, suggesting that this volatile may
not play a role as a cue at close range.
Although intact CO2 perception was not required for host location at short distances, it had a
strong impact on the capacity of WCR larvae to reach the maize rhizosphere at long distances. A
gradient of plant-associated CO2 was detected at distances of up to 32 cm from the plant. When
WCR larvae were released at distances greater than 32 cm, they still managed to locate plants in a
DvvGr2-dependent manner. This result can be explained by random movement, where the larvae
move randomly until they encounter a CO2 gradient, or by localized CO2 gradients along preferen-
tial gas-phase pathways that may extend beyond 32 cm, or a combination of both. The advantages
of CO2 as a host location cue are that it is abundantly produced through respiration by most organ-
isms, is relatively stable (Jones and Coaker, 1977; Li et al., 2016), and diffuses rapidly in air, water,
and soil (Hashimoto and Suzuki, 2002; Ma et al., 2013). CO2 may thus be a suitable long-range
cue to locate organisms with high respiratory rates, such as mammals and heterotroph plant parts,
including roots and their associated microbial communities (Johnson and Nielsen, 2012). Above-
ground insects can be attracted to CO2 traps located as far away as 10 m, and it is estimated that
this distance could even be as long as 60 m under optimal environmental circumstances
(Guerenstein and Hildebrand, 2008; Zollner et al., 2004). For belowground insects, this distance is
hypothesized to be within the lower centimetre range as CO2 diffusion is substantially decreased
within the soil matrix compared to CO2 diffusion in air (Bernklau et al., 2005; Doane et al., 1975;
Doane and Klingler, 1978; Klingler, 1966). Other volatiles that are less abundant and diffuse even
less well through the soil such as (E)-b-caryophyllene are unlikely to be detectable at distances of
more than 10 cm (Chiriboga M. et al., 2017; Hiltpold and Turlings, 2008). These volatiles are thus
likely useful host location cues at short, but not long, distances in the soil. The finding that WCR inte-
grates CO2 perception with other environmental cues and that attraction to CO2 is context depen-
dent is in line with patterns reported for other insects such as mosquitoes, whose response to stimuli
such as colour, temperature, and human body odours is enhanced by CO2 (McMeniman et al.,
2014; van Breugel et al., 2015), and pollinating hawkmoths, which use CO2 as a redundant volatile
distance stimulus in a sex-specific manner (Goyret et al., 2008).
A recent study shows that a CO2 receptor in Drosophila flies is also involved in the detection and
behavioural responses to other volatiles (MacWilliam et al., 2018). We observed that DvvGr2-
silenced larvae were repelled by methyl anthranilate, a potent maize root repellent, to a similar
extent as WT larvae, suggesting that their sensitivity to this plant volatile is unchanged
(Bernklau et al., 2016b). In Drosophila flies, the CO2 receptor Gr63a is required for spermidine
attractiveness over short time spans, that is, less than 1 min, but not over longer time spans (hours),
when other receptors likely become more important (MacWilliam et al., 2018). In the present
Arce, Theepan, et al. eLife 2021;10:e65575. DOI: https://doi.org/10.7554/eLife.65575 15 of 29Research article Ecology
A B
Low fertilizer Optimum fertilizer Medium fertilizer Optimum fertilizer
Release point of Release point of
larvae larvae
80 cm 80 cm
Zone 5 Zone 4 Zone 3 Zone 2 Zone 1 4.5cm Zone 5 Zone 4 Zone 3 Zone 2 Zone 1
467±21.6bc 438±14.8c 421±29.9c 549±18.7ab 611±34.2a 512±16.4b 440±18.7bc 417±21.3c 510±34.4b 614±30.0a
CO2 concentration (µmol/mol, ppm)
C D
Low-fertilized Optimally-fertilized Medium-fertilized Optimally-fertilized
plants plants plants plants
***
WT
larvae *
Gr2-silenced
larvae
-40 -20 0 20 40 60 -40 -20 0 20 40 60
Larval choice (%)
E
Insect performance
c
Larval mass (mg)
16 b
12 a
8
4
0
Low Medium Optimum
Plant fertilizer regime
Figure 8. CO2 perception increases the location of more suitable host plants. (A, B) Schematic representation (photomontage) of soil-filled trays used
to evaluate location of differentially fertilized plants by western corn rootworm (WCR) larvae depicting mean (± SEM) CO2 levels detected in the soil gas
phase of each tray zone (n = 10). Different letters indicate statistically significant differences in CO2 levels (p < 0.05 by one-way ANOVA with Holm’s
multiple-comparisons test). For details regarding CO2 levels, refer to Figure 8—figure supplement 1. Mean (± SEM) proportion of WCR larvae
recovered close to plants that received low (zone 5) or optimum (zone 1) fertilizer doses (C), or that were recovered close to plants that received
medium (zone 5) or optimum (zone 1) fertilizer doses (D) 8 hr after releasing the larvae. Six trays with 20 larvae per tray were assayed (n = 6). Different
letters indicate statistically significant differences in larval preferences (*p < 0.05; ***p < 0.001 by generalized linear model followed by FDR-corrected
post hoc tests). (E) Mean (± SEM) weight of WCR larvae after 7 days feeding on plants fertilized with low, medium, or optimum fertilizer doses. Twenty
solo cups with 4–7 larvae each were assayed (n = 20). Different letters indicate statistically significant differences in larval mass (p < 0.05 by one-way
ANOVA followed by Holm’s multiple-comparisons tests). For details regarding the statistical results, refer to Supplementary file 1. Raw data are
available in Figure 8—source data 1.
The online version of this article includes the following source data and figure supplement(s) for figure 8:
Figure 8 continued on next page
Arce, Theepan, et al. eLife 2021;10:e65575. DOI: https://doi.org/10.7554/eLife.65575 16 of 29Research article Ecology
Figure 8 continued
Source data 1. Raw data for Figure 8.
Figure supplement 1. Carbon dioxide levels at different sampling points.
experiments, WCR behaviour was evaluated after one or more hours. The CO2 scrubber experiment
provides further evidence that the foraging patterns observed in this study are not due to different
sensitivity of DvvGr2-silenced larvae to other root volatiles.
Apart from acting as a long-distance host location cue, CO2 also links plant fertilization to herbi-
vore behaviour by guiding WCR to well-fertilized plants. As WCR larvae are resistant to root defen-
ces of maize (Robert et al., 2012b), it is likely to benefit from increased fertilization, independently
of the plant’s defensive status. As the plant nutritional status and host quality for WCR larvae are
associated with higher CO2 release from the roots, following the highest concentrations of CO2 in
the soil may be adaptive for the herbivore as it may increase its chance not only to find a maize plant
per se but also to identify a plant that has the resources to grow vigorously and that is a better host.
More experiments are needed to confirm this hypothesis as in the current set-up the larvae may
have followed the only available CO2 gradient close to their release point rather than having made a
choice between two gradients. However, given the dose-dependent responses of WCR, preferential
orientation towards plants surrounded by higher CO2 levels appears likely. Well-fertilized maize
plants increase photosynthesis and biomass production, which results in higher CO2 release from the
roots (Zhu and Lynch, 2004). WCR larvae are specialized maize pests that have evolved with intense
maize cultivation in the corn belt of the US (Gray et al., 2009) and are resistant to maize defence
metabolites (Robert et al., 2012b). Following the strongest CO2 gradient in an equally spaced
maize monoculture may indeed be a useful strategy for this root feeder to locate suitable food sour-
ces. An association between CO2 emission and food-source profitability was also suggested for
Datura flowers, which emit the highest level of CO2 in times when nectar is most abundant
(Guerenstein et al., 2004; Thom et al., 2004). These findings support the general hypothesis that
CO2 is a marker of metabolic activity that allows for an assessment of the vigour and profitability of
a wide variety of hosts. The impact of CO2 for the distribution of root herbivores such as the WCR in
heterogeneous environments remains to be determined. Based on our results, we expect plant-asso-
ciated CO2 to contribute to uneven herbivore distribution and to aggregation on plants with a good
nutritional status within monocultures.
In summary, this work demonstrates how a herbivore uses its capacity to perceive CO2 to locate
host plants. Volatiles other than CO2 are also integrated into host-finding behaviour in the soil, but
their effects are more important at short than at long distances. Random movement in the soil may
help this root herbivore to increase its capacity to find host cues at even greater distances. Thus, evi-
dence is now accumulating that CO2 acts as an important host location cue in different insects, likely
because of its unique role as a highly conserved long-range marker of metabolic activity within com-
plex sensory landscapes.
Materials and methods
Plants and planting conditions
Maize seeds (Zea mays L., var. Akku) were provided by Delley Semences et Plantes SA (Delley, Swit-
zerland). Seedlings were grown under greenhouse conditions (23 ± 2˚C, 60% relative humidity, 16:8
h L/D, and 250 mmol/m2/s1 additional light supplied by sodium lamps). Plantaaktiv 16+6+26 Typ K
fertilizer (Hauert HBG Dünger AG, Grossaffoltern, Switzerland) was added twice a week after plant
emergence following the manufacturer’s recommendations. The composition of the fertilizer is: total
nitrogen (N) 16%, nitrate 11%, ammonium 5%, phosphate (P2O5) 6%, potassium oxide (K2O) 26%,
magnesium oxide (MgO) 3.3%, boron (B) 0.02%, copper (Cu, EDTA-chelated) 0.04%, iron (Fe, EDTA-
chelated) 0.1%, manganese (Mn, EDTA-chelated) 0.05%, molybdenum (Mo) 0.01%, and zinc (Zn,
EDTA-chelated) 0.01%. When plants were used as insect food, seedlings were germinated in vermic-
ulite (particle size: 2–4 mm; tabaksamen, Switzerland) and used within 4 days after germination.
Arce, Theepan, et al. eLife 2021;10:e65575. DOI: https://doi.org/10.7554/eLife.65575 17 of 29Research article Ecology
Insects and insect rearing
Diabrotica virgifera virgifera (WCR) insects used in this study were derived from a non-diapausing
colony reared at the University of Neuchâtel. The eggs used to establish the colony were supplied
by USDA-ARS-NCARL, Brookings, SD. New insects of the same origin are introduced into the colony
every 3–6 months. Upon hatching, insects were maintained in organic soil (Selmaterra, Bigler Samen
AG, Thun, Switzerland) and fed freshly germinated maize seedlings (var. Akku).
Identification of CO2 receptor genes
To identify CO2 receptor orthologues in WCR, we used CO2 receptor-encoding gene sequences of
T. castaneum and several sequences from other insects as queries against publicly available WCR
genome sequences (NCBI accession: PXJM00000000.2) using the National Center for Biotechnology
Information Basic Local Alignment Search Tool (NCBI BLAST) (Robertson and Kent, 2009;
Wang et al., 2013; Xu and Anderson, 2015). The full gene sequences can be retrieved from
the NCBI databank using the following accession numbers: XM_028276483.1 (DvvGr1),
XM_028280521.1 (DvvGr2), and XM_028272033.1 (DvvGr3). These gene sequences were translated
to obtain protein sequences. The obtained protein sequences and the protein sequences of CO2
receptors from different insects were used to infer evolutionary relationships using the neighbor-join-
ing method in MEGA 7 (Kumar et al., 2016; Robertson and Kent, 2009; Rodrigues et al., 2016;
Saitou and Nei, 1987). The optimal tree with the sum of branch length = 4.44068889 is provided in
Figure 2A. The percentage of replicate trees in which the associated taxa clustered together in the
bootstrap test (100 replicates) are shown next to the branches (Felsenstein, 1985). The tree is
drawn to scale, with branch lengths in the same units as those of the evolutionary distances used to
infer the phylogenetic tree. The evolutionary distances were computed using the Poisson correction
method (Zuckerkandl and Pauling, 1965) and are in the units of the number of amino acid substitu-
tions per site. A total of 242 amino acid positions were included in the final data set. Graphical
representation and edition of the phylogenetic tree were performed with the Interactive Tree of Life
(version 3.5.1) (Letunic and Bork, 2016). Protein tertiary structures and topologies were predicted
using Phyre2 (Kelley et al., 2015).
Production of dsRNA
Escherichia coli HT115 were transformed with recombinant L4440 plasmids that contained a 211–
240 bp long gene fragment targeting one of the three CO2 receptors. Cloned nucleotide sequences
were synthetized de novo (Eurofins, Germany). To induce the production of dsRNA, an overnight
bacterial culture was used to inoculate fresh Luria–Berthani broth (25 g/L, Luria/Miller, Carl Roth
GmbH, Karlsruhe, Germany). Once the bacterial culture reached an OD600 of 0.6–0.8, it was supple-
mented with isopropyl b-D-1-thiogalactopyranoside (Sigma-Aldrich, Switzerland) at a final concentra-
tion of 2 mM. Bacterial cultures were incubated at 37˚C in an orbital shaker (Ecotron, Infors HT,
Bottmingen, Switzerland) at 130 rpm for 16 additional hours. Bacteria were harvested by centrifuga-
tion (2000 rpm, 10 min) using a top bench centrifuge (IEC Centra GP6R, Thermo Fisher Scientific,
Waltham, MA, USA) and stored at 20˚C in a freezer (Bosch, Gerlingen, Germany) for further use
(Kim et al., 2015).
Gene silencing experiments
To induce gene silencing in WCR, 6–10 second instar WCR larvae were released in solo cups (30 ml,
Frontier Scientific Services, Inc, Germany) containing approximately 2 g of autoclaved soil (Selma-
terra, Bigler Samen AG, Thun, Switzerland) and 2–3 freshly germinated maize seedlings. Maize seed-
lings were coated with 1 ml of bacterial solution containing approximately 200–500 ng of dsRNA
targeting the different CO2 receptor genes. As controls, larvae were fed with bacteria-producing
dsRNA-targeting GFP genes, which are absent in the WCR genome (Rodrigues et al., 2016). dsRNA
was produced as described above. Fresh bacteria and seedlings were added to solo cups every
other day for three consecutive times. Two days after the last dsRNA/bacteria application, larvae
were collected and used for experiments.
Arce, Theepan, et al. eLife 2021;10:e65575. DOI: https://doi.org/10.7554/eLife.65575 18 of 29You can also read