Mitochondrial calcium uptake regulates tumour progression in embryonal rhabdomyosarcoma - Nature
←
→
Page content transcription
If your browser does not render page correctly, please read the page content below
www.nature.com/cddis

                  ARTICLE                 OPEN

                  Mitochondrial calcium uptake regulates tumour progression in
                  embryonal rhabdomyosarcoma
                                                                                                    1✉
                  Hsin Yao Chiu1, Amos Hong Pheng Loh2 and Reshma Taneja

                  © The Author(s) 2022

                      Embryonal rhabdomyosarcoma (ERMS) is characterised by a failure of cells to complete skeletal muscle differentiation. Although
                      ERMS cells are vulnerable to oxidative stress, the relevance of mitochondrial calcium homoeostasis in oncogenesis is unclear. Here,
                      we show that ERMS cell lines as well as primary tumours exhibit elevated expression of the mitochondrial calcium uniporter (MCU).
                      MCU knockdown resulted in impaired mitochondrial calcium uptake and a reduction in mitochondrial reactive oxygen species
                      (mROS) levels. Phenotypically, MCU knockdown cells exhibited reduced cellular proliferation and motility, with an increased
                      propensity to differentiate in vitro and in vivo. RNA-sequencing of MCU knockdown cells revealed a significant reduction in genes
                      involved in TGFβ signalling that play prominent roles in oncogenesis and inhibition of myogenic differentiation. Interestingly,
                      modulation of mROS production impacted TGFβ signalling. Our study elucidates mechanisms by which mitochondrial calcium
                      dysregulation promotes tumour progression and suggests that targeting the MCU complex to restore mitochondrial calcium
1234567890();,:

                      homoeostasis could be a therapeutic avenue in ERMS.

                      Cell Death and Disease (2022)13:419 ; https://doi.org/10.1038/s41419-022-04835-4

                  INTRODUCTION                                                                             protein. The loss of MCU inhibits mitochondrial Ca2+ uptake by
                  Rhabdomyosarcoma (RMS) is the most prevalent soft-tissue                                 approximately 75% [14, 15]. Mitochondrial calcium uptake 1
                  sarcoma in childhood and adolescence [1–3]. Even though RMS                              (MICU1) is the gatekeeper of MCU complex and forms a
                  cells express myoblast determination protein 1 (MYOD), a master                          heterodimer with MICU2 [16, 17]. The MICU1-MICU2 complex
                  regulator of myogenic differentiation, they exhibit a failure to                         prevents mitochondrial Ca2+ overload under basal cytosolic Ca2+
                  complete the differentiation programme. The two main subtypes                            conditions. MICU1 acts to regulate the threshold of MCU opening
                  are embryonal rhabdomyosarcoma (ERMS) and alveolar rhabdo-                               and cooperates with MICU2 to activate the channel under high
                  myosarcoma (ARMS) that account for approximately 70 and 20%,                             Ca2+ concentration [18].
                  respectively, of all RMS cases [1–4]. ERMS cells possess a more                             MCU and MICU1 deregulations have been reported in several
                  complex karyotype with a loss of heterozygosity at 11p15.5 and a                         cancers [13, 19, 20]. For instance, MCU overexpression in breast
                  higher mutation burden compared to ARMS [4, 5]. Mutations in                             cancer correlates with tumour size, invasiveness and poor
                  RAS, receptor tyrosine kinase or phosphoinositide-3 kinase (PI3K)                        prognosis [21]. In colorectal cancer, MCU-induced mitochondrial
                  complexes are most commonly found in ERMS [2, 5]. These                                  Ca2+ uptake promotes mitochondrial biogenesis and tumour
                  pathways maintain redox balance and energy metabolism for                                growth through mitochondrial transcription factor A (TFAM) and
                  cellular functions [6, 7]. Given these genetic aberrations in ERMS                       nuclear factor kappa-light-chain-enhancer of activated B cells (NF-
                  and the importance of mitochondrial function in cancer, a few                            κB) [22]. The elevation in mitochondrial Ca2+ through MCU
                  studies have demonstrated that reactive oxygen species (ROS)                             overexpression promotes hepatocellular carcinoma (HCC) metas-
                  production and cellular metabolism are altered in ERMS [8–10].                           tasis through ROS production [23]. In contrast, the downregulation
                  Upregulation of mitochondrial genes in patient tumours has also                          of MCU in cervical and colon cancer favours survival [24]. MICU1
                  been reported [11]. These observations suggest that mitochon-                            expression is deregulated in liver, breast and ovarian cancer. Low
                  drial dysfunction may be important in ERMS oncogenesis.                                  MICU1 expression in HCC is correlated with poor prognosis [25],
                  Nevertheless, the role of mitochondrial calcium (Ca2+) homo-                             but paradoxically, MICU1 overexpression in ovarian cancer
                  eostasis has not been characterised.                                                     correlates with poor survival and chemoresistance [26, 27]. While
                     Mitochondrial calcium uniporter (MCU) complex is the main                             the deregulation of expression varies in a cancer type-specific
                  channel responsible for mitochondrial Ca2+ uptake and requires                           manner, in general, overexpression of MCU and loss of MICU1
                  inner mitochondrial membrane (IMM) potential for Ca2+ to enter                           expression are correlated with poor prognosis [13, 28].
                  the mitochondrial matrix. The MCU complex plays a fundamental                               In this study, we show that MCU is overexpressed in ERMS
                  role in regulating global Ca2+ signalling, redox balance, aerobic                        tumours and its silencing causes a reduction in mitochondrial
                  metabolism and apoptosis [12, 13]. MCU is the main pore-forming                          Ca2+ uptake. This is correlated with reduced mitochondrial ROS

                  1
                   Department of Physiology, Healthy Longevity Translational Research Program, Yong Loo Lin School of Medicine, National University of Singapore, Singapore 117593, Singapore.
                  2
                   VIVA-KKH Paediatric Brain and Solid Tumour Programme, KK Women’s and Children’s Hospital, Singapore 229899, Singapore. ✉email: phsrt@nus.edu.sg
                  Edited by Professor Massimiliano Agostini

                  Received: 23 November 2021 Revised: 31 March 2022 Accepted: 4 April 2022

                  Official journal of CDDpress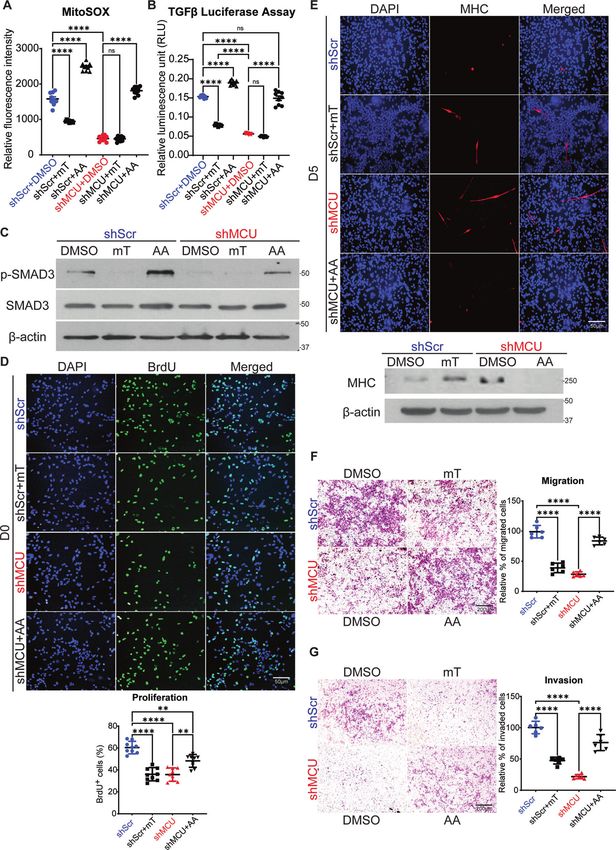
H.Y. Chiu et al.
2

    (mROS) production. Reduction of MCU expression impaired              consequent to reduced mROS levels. Elevating mROS reversed the
    cellular proliferation and motility, while enhancing myogenic        phenotypes observed upon MCU depletion. Our study elucidates
    differentiation. Interestingly, transforming growth factor beta      the relevance of mitochondrial Ca2+ signalling in driving tumour
    (TGFβ) signalling pathway was dampened upon MCU knockdown            progression.

                                                                                            Cell Death and Disease (2022)13:419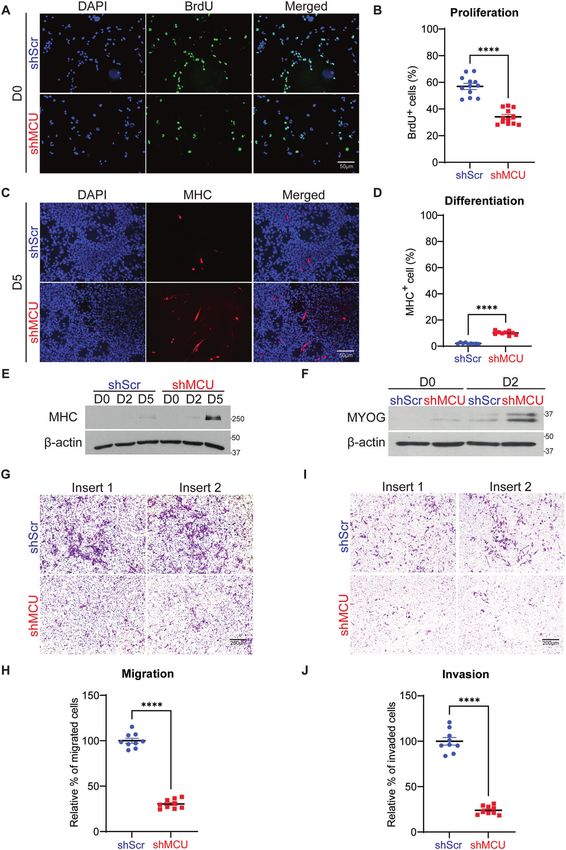
H.Y. Chiu et al.
                                                                                                                                               3
Fig. 1 Altered mitochondrial function and MCU expression in ERMS cell lines and patient samples. A, B Basal and maximal mitochondrial
Ca2+ levels in HSMM, RD, RD18, JR1, RH30 and RH41 cells was measured with Rhod2-AM staining. The graph on the right below shows basal
and maximal mitochondrial Ca2+ uptake upon induction with 100 μM histamine (n = 3). Values correspond to the average ± SEM. The blue line
indicates significance calculated by comparing the average of ERMS cell lines and ARMS cell lines. C, D Oxygen consumption rate (OCR) was
measured with Seahorse analyser with the addition of O: Oligomycin, FCCP: Carbonyl cyanide-4-(trifluoromethoxy)-phenylhydrazone, AA + R:
Antimycin A and Rotenone accordingly. Values correspond to average ± SEM (n = 3). Basal and maximal respiration rate of HSMM, ERMS and
ARMS cell lines as well as mitochondrial ATP-linked respiration are shown (n = 3). The blue line shows significance between the average of
ERMS cell lines and ARMS cell lines. E MCU mRNA was examined in HSMM, RD, RD18, JR1, RH30 and RH41 by qPCR analysis (n = 3). Values
correspond to average ± SEM. Statistical significance was calculated by one-way ANOVA analysis. The blue line shows the significance
comparing the average of ERMS cell lines and ARMS cell lines. F Western blot analysis showing MCU, MICU1 and HSP60 protein levels in
HSMM, RD, RD18, JR1, RH30 and RH41 cells. β-actin was used as loading control. A representative image of three independent experiments is
shown. G 6 archival ERMS patient tumour specimens were analysed by IHC using anti-MCU antibody. Images were taken at ×40 magnification.
Inset shows ×3 zoomed in image. Scale bar: 50 μm. One-way ANOVA test with appropriate correction was performed for statistical analysis. ns
not significant, *p ≤ 0.05, **p ≤ 0.01, ***p ≤ 0.001 and ****p ≤ 0.0001.

RESULTS                                                                induction, a pronounced 65% reduction in maximal mitochon-
MCU is overexpressed in ERMS                                           drial Ca2+ uptake was observed in shMCU cells with a small,
Previous studies have suggested deregulation of oxidative stress       albeit significant decrease in basal mitochondrial Ca2+ (Fig. 2C).
in ERMS [10, 29, 30]. We therefore examined mitochondrial Ca2+         A significant reduction in mROS including hydrogen peroxide
uptake, oxygen consumption rate (OCR) and adenosine tripho-            and superoxide was seen with pC1-HyperRed-mito fluorescent
sphate (ATP)-linked respiration in three patient-derived ERMS cell     probe (Fig. 2D) and MitoSOX staining (Fig. 2E) respectively.
lines (RD, RD18 and JR1). As controls, we used primary human           Reduced cytosolic ROS was also observed with CM-H2DCFDA
skeletal muscle myoblasts (HSMM) and two ARMS cell lines (RH30         staining in shMCU cells (Fig. 2F). Since ATP and mROS are
and RH41). Live-cell staining using Rhod2-AM revealed signifi-          produced by electron transport chain (ETC) during cellular
cantly elevated mitochondrial Ca2+ in ERMS cell lines as compared      respiration, we examined ATP production and OCR. A
to HSMM and ARMS cell lines (Fig. 1A). The uptake of                   significant reduction in overall ATP production was observed
mitochondrial Ca2+ upon induction is crucial in relaying signals.      in shMCU cells (Fig. 2G). Correspondingly, up to 70% reduction
Basal fluorescence was measured for 1 min before Ca2+ uptake            in basal and maximal respiration rate was seen upon MCU
was induced with 100 μM of histamine. Maximal mitochondrial            knockdown, and ATP-linked respiration through oxidative
Ca2+ uptake was measured by quantifying the difference between         phosphorylation (OXPHOS) also showed a significant reduction
basal fluorescence and highest fluorescence intensity attained           (Fig. 2H, I). Similarly, MCU knockdown in JR1 cells resulted in a
post-induction. A significant increase in basal and maximal             significant reduction in maximal mitochondrial Ca2+ uptake
mitochondrial Ca2+ uptake was seen in all three ERMS cell lines        with no change in basal mitochondrial Ca 2+ (Supplementary
relative to HSMM (Fig. 1B). We then analysed mitochondrial             Fig. 2A, B). In addition, a reduction in MitoSOX staining
function through measurement of OCR and ATP-linked respiration.        (Supplementary Fig. 2C), basal and maximal respiration rate,
A significant increase in basal and maximal OCR, as well as in ATP      as well as ATP-linked respiration was seen upon MCU knock-
production, were seen in ERMS cell lines relative to HSMM and          down (Supplementary Fig. 2D, E).
ARMS cell lines (Fig. 1C, D).                                             To further examine the link between MCU and mROS, we
   Mitochondrial Ca2+ uptake into the inner mitochondrial matrix       overexpressed MCU in C2C12 mouse myoblast cells. MCU over-
is tightly regulated by the MCU complex. Therefore, we examined        expression (pMCU) resulted in a significant increase in maximal
the expression of MCU, the main pore forming subunit of MCU            mitochondrial Ca2+ uptake, with no change in basal mitochondrial
complex in ERMS. MCU was found to be overexpressed in all three        Ca2+ (Supplementary Fig. 3A, B). A significant elevation in mROS
ERMS cell lines at both the mRNA and protein level compared to         production was also observed upon MCU overexpression (Sup-
HSMM and ARMS cell lines (Fig. 1E, F). On the other hand, MICU1        plementary Fig. 3C). Together these results demonstrate that
expression was downregulated in all three ERMS cell lines (Fig. 1F).   modulation of MCU expression is sufficient to change mitochon-
No significant difference was observed in the expression Heat           drial function.
Shock Protein 60 (HSP60) a mitochondrial molecular chaperone
(Fig. 1F), suggesting that there was no overt change in                MCU knockdown decreases oncogenic phenotypes in ERMS
mitochondrial mass that would account for the change in MCU            cells
and MICU1 expression. MCU expression was also examined in six          We next examined the phenotype of MCU knockdown cells. A
archival ERMS tumour sections by immunohistochemistry (IHC)            significant reduction in the percentage of 5-bromo-2’-deoxy-
using anti-MCU antibody (Fig. 1G). All samples showed high MCU         uridine-positive (BrdU+) cells was seen in shMCU cells relative to
expression with varying degrees of speckling. Similarly, a tissue      control cells (Fig. 3A, B). Similarly, transient MCU knockdown in RD,
microarray (TMA) of 27 ERMS patient tumours showed elevated            RD18, JR1 and RH36 cells reduced their proliferative capacity
MCU expression as compared to 24 ARMS patient samples and 8            (Supplementary Fig. 4). Conversely, there was an increase in the
normal muscles (Supplementary Fig. 1).                                 number of BrdU+ cells in MCU-overexpressing cells compared to
                                                                       controls (Supplementary Fig 3E). RD shScr and shMCU cells were
MCU knockdown decreases mitochondrial function in ERMS                 differentiated and stained with anti-myosin heavy chain (MHC)
cells                                                                  antibody. An increase in MHC -positive (MHC+) cells was observed
To investigate the relevance of MCU overexpression, RD cells           in shMCU cells, as well as in siMCU RD, RD18, JR1 and RH36 cells;
were transfected with non-targeting control shRNA (shScr) or           increase in MHC expression was also verified by western blot
MCU-specific shRNA (shMCU). The knockdown of MCU was                    analysis (Fig. 3C–E and Supplementary Fig. 5). Myogenin (MYOG),
specific, with no change in MICU1, MICU2 and HSP60 levels               an early myogenic differentiation marker, was also elevated in
(Fig. 2A). We next examined the effect of MCU knockdown on             expression (Fig. 3F). We then investigated the migratory and
mitochondrial Ca2+ concentration using Rhod2-AM which                  invasive capacity of shScr and shMCU cells. A profound reduction
localised specifically in the mitochondria as seen by co-               of approximately 80% in the migratory capacity of shMCU and
localisation with MitoTracker (Fig. 2B). Upon histamine                siMCU cells compared to controls was seen (Fig. 3G, H and

Cell Death and Disease (2022)13:419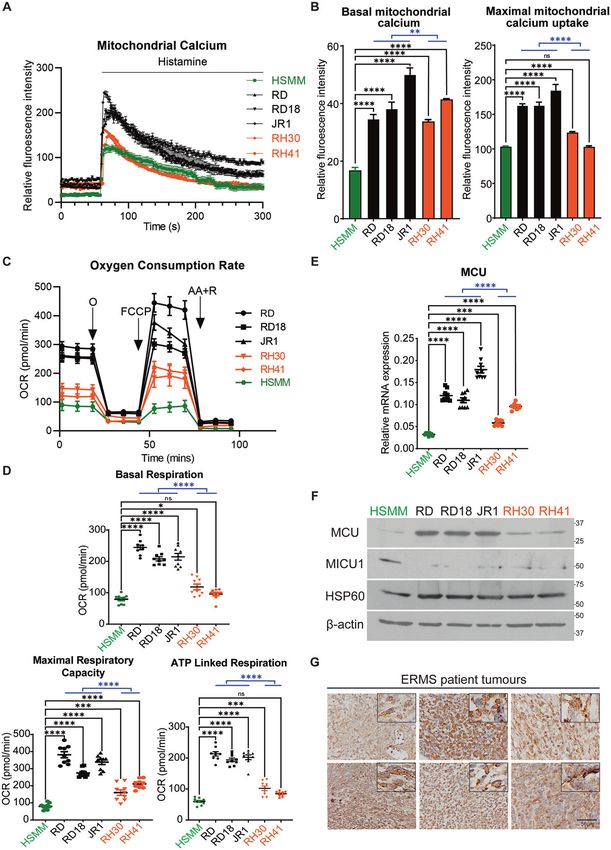
H.Y. Chiu et al.
4

    Supplementary Fig. 6). MCU knockdown also significantly                 TGFβ signalling pathway is downregulated upon MCU
    decreased invasiveness through matrigel (Fig. 3I, J). In contrast      knockdown
    to ERMS cell lines, no significant differences were apparent in         In order to identify mechanisms underlying MCU function, we
    proliferation, differentiation and migration upon MCU knockdown        performed RNA-Sequencing (RNA-Seq). Cluster analysis of differ-
    in the ARMS cell line RH30 (Supplementary Fig. 7A–G).                  entially expressed genes from control RD and MCU knockdown

                                                                                              Cell Death and Disease (2022)13:419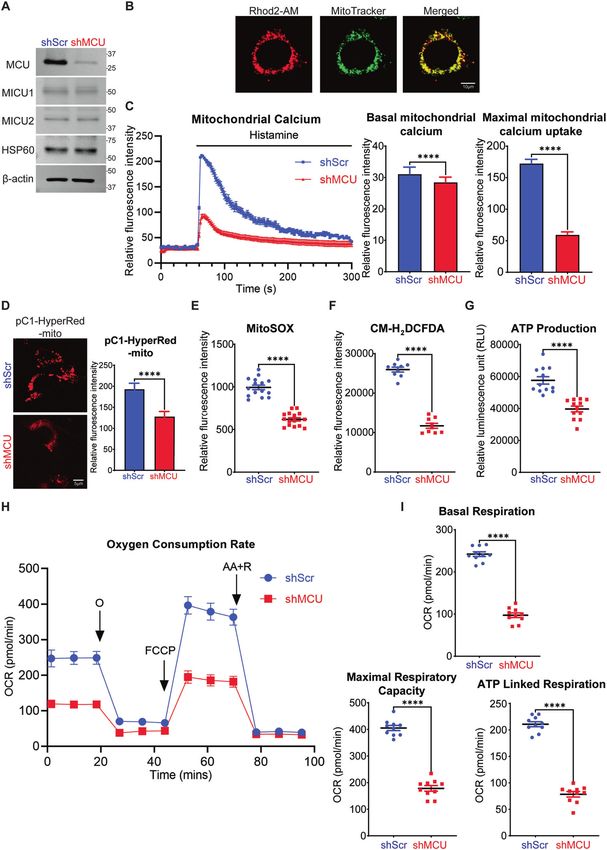
H.Y. Chiu et al.
                                                                                                                                               5
Fig. 2 MCU regulates mitochondrial functions in ERMS. A Western blot analysis showed significant downregulation of MCU expression in
stable MCU knockdown RD cells with no change in MICU1, MICU2 and HSP60 expression. The western blot is representative of three
independent experiments. B, C Co-localisation of Rhod2-AM and MitoTracker staining. Scales bar: 10 µm. Basal and maximal mitochondrial
Ca2+ uptake upon induction with 100 μM histamine using Rhod2-AM staining is shown in control and shMCU cells (n = 3). Values correspond
to the average ± SEM. D Mitochondrial hydrogen peroxide measurement using pC1-HyperRed-mito fluorescent probe. Scale bar: 5 μm.
Fluorescence intensity quantified with Image J (n = 3). Values correspond to average ± SEM. E MitoSOX Red staining of shMCU in comparison
to shScr is shown (n = 5). Values correspond to average ± SEM. F Cellular ROS in shMCU as compared to shScr was measured by flow
cytometry using CM-H2DCFDA staining (n = 3). Values correspond to average ± SEM. G ATPlite kit revealed reduced ATP production in shMCU
as compared to shScr (n = 4). Values correspond to average ± SEM. H, I OCR was measured in shMCU cells compared to shScr cells. O:
Oligomycin, FCCP: Carbonyl cyanide-4-(trifluoromethoxy)-phenylhydrazone, AA + R: Antimycin A and Rotenone were added accordingly.
Values correspond to average ± SEM (n = 3). Basal and maximal respiration rate along with ATP-linked respiration in shScr and shMCU cells is
shown. Two-tailed non-parametric unpaired t test was performed for statistical analysis. ****p ≤ 0.0001.

cells, and volcano plot of differentially expressed genes (Fig. 4A)     Moreover, a significant reduction in p-SMAD3 levels was seen in
revealed that 891 genes were significantly up regulated and 1223         MCU knockdown tumours by western blot analysis (Fig. 5F).
genes were significantly down regulated in siMCU cells. Gene
Ontology (GO) analysis showed that skeletal system development,         MCU regulates TGFβ signalling pathway through mROS
muscle organ development and focal adhesion were among the              Previous studies have shown crosstalk between ROS and TGFβ
top 5 unique biological processes associated with differentially        signalling [42, 43]. We therefore examined whether mROS is
expressed genes in siMCU cells (Fig. 4B and Supplementary Fig.          upstream of and regulates TGFβ signalling. To alter mROS
8A). Kyoto Encyclopaedia of Genes and Genomes (KEGG) pathway            levels, RD cells were treated with mitoTEMPO (a mROS
analysis identified TGFβ signalling pathway to be among the top          scavenger) and antimycin A (a complex IV inhibitor) for 48 h.
5 significantly altered pathways upon MCU knockdown (Fig. 4C, D          Treatment with mitoTEMPO resulted in a significant reduction
and Supplementary Fig. 8B). We validated the downregulation of          in mROS levels in shScr cells, while no further decrease was
TGFβ1, TGFβR1 and TGFβR2 expression by qPCR in MCU knock-               observed in shMCU cells. On the other hand, treatment with
down cells (Fig. 4E). Several genes that regulate myogenesis such       antimycin A elevated mROS levels in both shScr and shMCU
as myostatin (MSTN) [31] and hairy/enhancer-of-split related with       cells. (Fig. 6A). MitoTEMPO treatment of shScr cells significantly
YRPW motif protein 2 (HEY2) [32] were also downregulated upon           reduced TGFβ activity to levels similar to shMCU cells, although
MCU knockdown and validated by qPCR (Supplementary Fig. 8C).            shMCU cells showed no further reduction in TGFβ activity (Fig.
The differential expression of integrins ITGB3, ITGA3 and ITGA7         6B). Consistently, p-SMAD3 level was reduced in mitoTEMPO
were also validated in shMCU cells (Supplementary Fig. 8D). The         treated shScr cells with no observable difference in
TGFβ signalling pathway is well known for its role in tumour            mitoTEMPO-treated shMCU cells (Fig. 6C). Conversely, treat-
progression and epithelial-to-mesenchymal transition (EMT)              ment of shMCU cells with antimycin A rescued TGFβ reporter
[33, 34]. We therefore focused on examining this pathway.               activity (Fig. 6B) and p-SMAD3 levels to those comparable to
Consistent with reduced expression of TGFβ1, TGFβR1 and TGFβR2,         control DMSO-treated cells (Fig. 6C).
phosphorylated Smad family member 3 (p-SMAD3) levels, a                    MCU regulates mROS through increased mitochondrial Ca2+
readout of TGFβ signalling, was reduced in shMCU cells whereas          production [44–46]. We first examined whether the phenotypic
total SMAD3 levels were unchanged (Fig. 4F). A significant               effects of MCU depletion are mROS-dependent. Upon treat-
reduction in the TGFβ reporter 3TP-Lux [35] activity was seen in        ment of control cells with mitoTEMPO, BrdU+ cells were
shMCU cells (Fig. 4G). Consistently, MCU overexpression resulted        reduced to a level similar to shMCU cells. On the other hand,
in a significant increase in TGFβ activity in C2C12 cells as             treatment of shMCU cells with antimycin A partially rescued
compared to control cells (pCMV) (Supplementary Fig. 3D). Basal         proliferation (Fig. 6D). Treatment with mitoTEMPO also
TGFβ activity however was not elevated in the ARMS cell lines           increased the number of MHC+ cells in control cells, and
RH30 and RH41 (Supplementary Fig. 7H). Importantly, several             conversely, a prominent reduction in MHC staining was seen
transcriptional targets of the pathway whose expression was             upon antimycin A treatment in shMCU cells (Fig. 6E). Similarly,
altered by RNA-Seq data, including latent transforming growth           migration and invasion were decreased in mitoTEMPO treated
factor beta binding protein 2 (LTBP2), LTBP4, matrix metallopepti-      shScr cells, whereas increased migration and invasion were
dase 16 (MMP16), metalloproteinase inhibitor 3 (TIMP3) and serpin       observed in antimycin A-treated shMCU cells (Fig. 6F, G).
family E member 1 (SERPINE1) [36–39], were differentially                  We next examined the mechanisms by which mROS regulates
expressed in shMCU cells (Supplementary Fig. 8E). Together,             TGFβ ligand and receptors. TGFβ1, TGFβR1 and TGFβR2 transcripts
these data demonstrate that elevation of MCU expression is              were evidently reduced in mitoTEMPO-treated shScr cells to levels
sufficient to modulate TGFβ signalling.                                  similar to shMCU cells. On the hand, treatment of shMCU cells with
                                                                        antimycin A rescued mRNA expression of TGFβ1, TGFβR1 and
MCU promotes tumour growth in vivo                                      TGFβR2 to levels comparable to shScr cells (Supplementary Fig.
To examine the impact of MCU loss in vivo, we injected RD control       9A). Previous studies have shown transcriptional regulation of
(shScr) and shMCU cells in BALB/c nude mice. A significant               TGFβ signalling by mROS via NF-κB and p38/JNK/ERK pathways
reduction in tumour growth was apparent in mice injected with           [47, 48]. Control shScr cells treated with mitoTEMPO showed
shMCU cells (Fig. 5A–C) without any adverse effect on weight (Fig.      significant reduction in phosphorylated NF-κB (p-NF-κB) and
5D). Tumour sections from shScr and shMCU cells were analysed           phosphorylated p38 mitogen-activated protein kinases (p-p38
histologically and by IHC (Fig. 5E). Ki-67, a proliferation marker,     MAPK) protein levels with no change in total NF-κB and p38 MAPK
was significantly reduced in shMCU tumours. In contrast,                 expression, that was similar to shMCU cells (Supplementary Fig.
myogenic differentiation was strikingly increased as seen from          9B). Conversely, antimycin A treatment in shMCU cells rescued p-
MHC and MYOG levels by IHC and western blot analysis of tumour          NF-κB and p-p38 MAPK expression to levels similar to that of
lysates. Melanoma Cell Adhesion Molecule (MCAM) and Snail               control shScr cells (Supplementary Fig. 9B).
Family Transcriptional Repressor 2 (SNAI2), which promote                  Collectively, our data demonstrate that modulation of mROS
metastasis and oncogenic progression [40, 41] were decreased.           production alters TGFβ signalling and oncogenic phenotypes in
No overt change in active caspase 3 staining was apparent.              ERMS (Fig. 7).

Cell Death and Disease (2022)13:419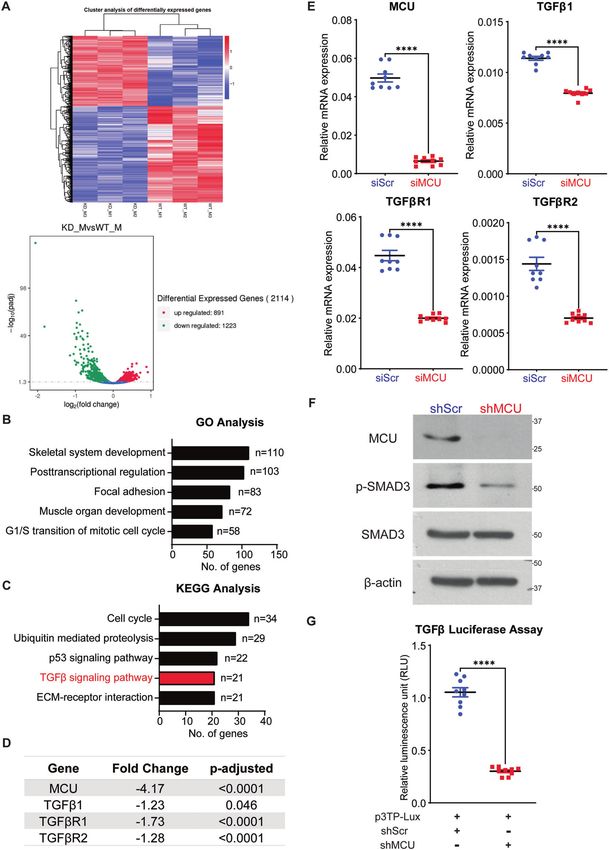
H.Y. Chiu et al.
6

    DISCUSSION                                                            has not been examined. Here we show that deregulated
    The RAS pathway is frequently activated in ERMS and impacts           expression of the MCU complex impairs mitochondrial Ca2+
    redox balance [6, 29]. Consistently, ERMS cells are sensitive to      homoeostasis in ERMS cell lines. MCU knockdown caused a
    drugs that elevate oxidative stress [29, 49]. Despite these           reduction in mitochondrial Ca2+ uptake and reduced mROS
    correlations, the importance of mitochondrial Ca2+ homoeostasis       production. This inhibited the TGFβ signalling pathway and

                                                                                           Cell Death and Disease (2022)13:419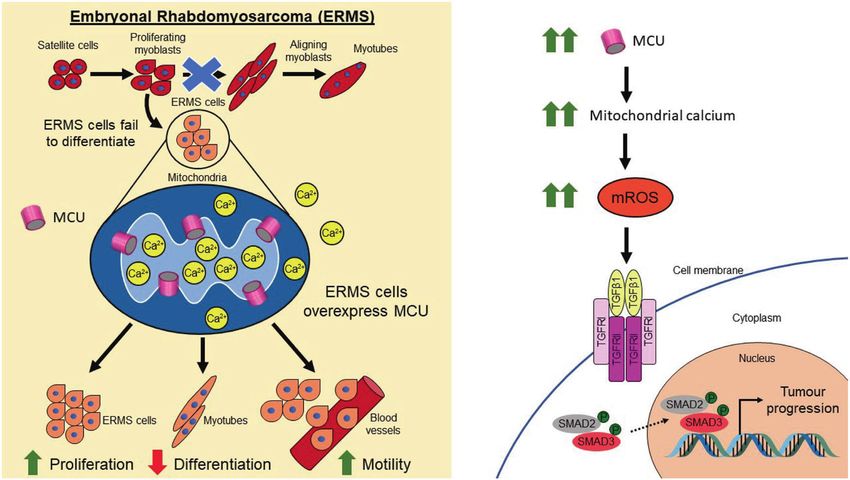
H.Y. Chiu et al.
                                                                                                                                                        7
Fig. 3 MCU knockdown inhibits oncogenic phenotypes. A, B BrdU assay to examine proliferation in shScr and shMCU cells. BrdU+ cells were
analysed by immunofluorescence (n = 4). Images are representative of four independent experiments. Scale bar: 50 μm. The scatter plot shows
the percentage of BrdU+ cells in shMCU cells relative to controls. The values correspond to average ± SEM. C, D Control shScr and shMCU cells
were cultured for 5 days in differentiation medium and analysed by immunofluorescence using anti-MHC antibody. Nuclei were stained with
DAPI. Representative images of four independent experiments are shown. Scale bar: 50 μm. The scatter plot shows the percentage of MHC+
cells in shMCU cells relative to controls. The values correspond to average ± SEM. E MHC level was analysed in control and shMCU cells by
western blot analysis at Day 0 (D0), D2 and D5 in differentiation medium. F MYOG level was analysed in control and shMCU cells by western
blot analysis at D0 and D2. G, H Boyden chamber migration assay of control and shMCU cells. Migrated cells were observed after 24 h using
crystal violet staining. Images are representative of four independent experiments. Scale bar: 200 μm. The relative percentage of migrated cells
were quantified in the scatter plot and the values correspond to average ± SEM. I, J Matrigel invasion assay of control and shMCU cells.
Invaded cells were stained with crystal violet after 24 h. Images are representative of four independent experiments. Scale bar: 200 μm. The
relative percentage of invaded cells were quantified in the scatter plot and the values correspond to average ± SEM. Two-tailed non-
parametric unpaired t test was performed for statistical analysis. ****p ≤ 0.0001.

impaired proliferation and motility of tumour cells but promoted          such as BH3-interacting domain death agonist (BID), tumour
myogenic differentiation in vitro and in vivo.                            protein P53 (TP53), apoptotic protease activating factor 1 (APAF1)
   Our finding that MCU positively regulates mitochondrial Ca2+            and phorbol-12-myristate-13-acetate-induced protein 1 (PMAIP1)
uptake is in concordance with previous studies on MCU knockout            [63] were reduced significantly upon MCU knockdown. The
mice which show a lack of mitochondrial Ca2+ uptake [50, 51].             decreased expression of such pro-apoptotic genes may underlie
Moreover, an attenuation in mitochondrial Ca2+ uptake upon                the absence of apoptosis in shMCU cells. SNAI2 directly represses
MCU knockdown has been reported in neurons [52], heart [53],              the pro-apoptotic gene BIM/BCL2L11 expression in a p53-
liver [15] and pancreatic β cells [54]. The reduced OCR upon MCU          independent manner in RMS cell lines, and confers protection
knockdown is also in line with similar observations in myofibers of        from ionising radiation [64]. As SNAI2 levels are also down
MCU knockout mice [55].                                                   regulated upon MCU knockdown, it would be interesting to
   Mitochondria contribute to tumourigenesis and tumour pro-              determine the effect of radiation on these cells.
gression in many ways that include the generation of ROS,                    In addition to MCU overexpression, MICU1 is down regulated in
accumulation of metabolites, and alterations in apoptosis [56].           ERMS cell lines. The regulatory mechanisms that underlie these
Most of these processes are tightly regulated by Ca2+ ions. Since         changes in expression are unclear and need further investigation.
MCU and MICU1 regulate mitochondrial Ca2+ uptake and                      As shMCU cells showed a modest impact on basal mitochondrial
metabolism, deregulation in their expression leads to mitochon-           Ca2+ levels, it is likely that the down regulation of MICU1 in ERMS
drial dysfunction. Indeed, studies have shown that increased or           cell lines may contribute to the endogenous elevation of basal
decreased MCU and MICU1 expression in different cancers                   level of mitochondrial Ca2+ [16, 17].
contribute to tumourigenesis and metastasis in several ways                  Mitochondrial dysfunction is increasingly recognised to have
[13, 19, 20]. In HCC as well as in breast cancer, MCU overexpression      central role in the development of several human diseases including
results in increased Ca2+ uptake and mROS generation, which play          cancer. Pharmacological interventions targeting mitochondria could
an important role in driving tumour progression and metastasis            become effective strategies for treating pathological conditions
[21, 23]. Elevated mROS activates hypoxia-inducible factor 1-alpha        associated with mitochondrial dysfunction. However, the develop-
(HIF1α), which promotes tumour progression [21]. Additionally,            ment of such therapeutic tools is hampered by the incomplete
mROS has been reported to reduce superoxide dismutase 2                   understanding of the molecular mechanisms underlying major
(SOD2) activity and promote ROS-dependent matrix metallopro-              mitochondrial functions. In this context, our study elucidates how
teinase (MMP) activity, which promotes cell motility [23].                high MCU expression is linked to tumour progression and a block in
Interestingly, our RNA-Seq data identified a novel signalling              myogenic differentiation. Targeting the MCU-mROS-TGFβ axis could
pathway downstream of mROS production in ERMS. We show that               be a new unexplored therapeutic strategy in ERMS.
TGFβ signalling is dampened in response to MCU knockdown. The
interplay between ROS and TGFβ signalling pathway has been
widely studied [34, 42, 57, 58] and both TGFβ ligands and                 MATERIALS AND METHODS
receptors have been reported to be transcriptionally regulated by         Cell culture, transient and stable knockdown cells
ROS via the p38 MAPK and NF-kB pathways [48]. TGFβ signalling is          Primary human skeletal muscle myoblasts (HSMM) were purchased from
elevated in ERMS [59, 60]. Increasing or decreasing mROS                  Zen-Bio, Inc. (NC, USA) and cultured in skeletal muscle cell growth medium
modulated TGFβ signalling, demonstrating that elevated MCU-               (#SKM-M, Zen-Bio, USA). Cells were maintained at a confluency of no more
mediated mROS production is upstream of TGFβ signalling.                  than 70% and experiments were performed with cells under 7 passages.
                                                                          ERMS cell lines were a kind gift from Peter Houghton (Nationwide
Nevertheless, we note that integrins, which also regulate TGFβ            Children’s Hospital, Ohio, USA) and Rosella Rota (Bambino Gesu Children’s
signalling, are down regulated upon MCU knockdown. It is                  Hospital, Rome, Italy). RD cells were cultured in Dulbecco’s Modified Eagle
plausible that the reduced expression of these genes upon MCU             Medium (DMEM) (Sigma-Aldrich, St. Louis, MO, USA) with 10% foetal
knockdown also contributes to the reduction of TGFβ signalling.           bovine serum (FBS) (HyClone, Cytiva, U.S.) and 1% Penicillin-Streptomycin
The TGFβ pathway has well-established roles in cell cycle                 (HyClone, Cytiva, U.S.). RD18, JR1, RH36, RH30 and RH41 were cultured in
progression and tumour invasion [33, 34]. In addition, TGFβ               RPMI 1640 with L-Glutamine (Thermo Fisher Scientific, Waltham, MA, USA)
signalling potently represses myogenic differentiation [59, 61]. The      with 10% FBS and 1% Penicillin–Streptomycin. Mouse myoblasts (C2C12)
impaired TGFβ signalling in shMCU cells correlates with the               were purchased from ATCC and cultured in DMEM with 20% FBS and 1%
observed reduction in proliferation and cell motility and elevated        Penicillin–Streptomycin. The authenticity of all cell lines was confirmed by
                                                                          Short Tandem Repeats (STR) analyses (Axil Scientific Pte Ltd, Singapore).
myogenic differentiation in vitro and in vivo.                               For transient knockdown, cells were transfected with 50 nM human
   In some cancers, MCU overexpression protects cells from                MCU-specific siRNA (ON-TARGETplus siRNA SMARTpool, Dharmacon,
apoptosis and thus MCU silencing potentiates cell death                   Lafayette, CO, USA) containing a pool of three to five 19-25 nucleotide
[21, 62]. While ERMS cells overexpress MCU, we did not observe            siRNAs. Control cells were transfected with 50 nM scrambled siRNA (ON-
cell death in shMCU cells in vitro and in vivo. RNA-Seq analysis          TARGETplus, non-targeting pool, Dharmacon, Lafayette, CO, USA). Trans-
showed that the p53 pathway was also altered in response to               fections were performed using Lipofectamine RNAiMax (Thermo Fisher
MCU knockdown. The expression of several pro-apoptotic genes              scientific). Cells were analysed 48 h post-transfection for all assays.

Cell Death and Disease (2022)13:419
H.Y. Chiu et al.
8
For transient overexpression, cells were transiently transfected with For generation of stable knockdown cell lines, HEK293FT cells were
2.5 µg of pLYS5-MCU-Flag (#50054, Addgene). Control cells were transfected with packaging plasmid pIP1 (5 µg) and pIP2 (5 µg), envelope
transfected with 2.5 µg of pCMV-GFP (#11153, Addgene). Transfections plasmid pIP/VSV-G (5 µg) (ViraPowerTM Lentiviral Packaging Mix, Thermo
were performed using Lipofectamine 3000 Transfection Reagent Fisher Scientific) and 5 µg lentiviral expression constructs shRNA (pLKO.1
(Thermo Fisher Scientific). Cells were analysed 48 h post-transfection Mission shRNA DNA clone, Sigma-Aldrich Inc.) or shMCU (#SHCLNG-
for all assays. NM_138357 Mission shRNA, Sigma-Aldrich Inc.). 16 h post-transfection, the
Cell Death and Disease (2022)13:419H.Y. Chiu et al.
9
Fig. 4 TGFβ signalling pathway is deregulated upon MCU knockdown. A RNA-Seq heatmap (upper panel) showing hierarchical cluster of
differentially expressed genes. Red represents high expression and blue represents low expression. Volcano plot (lower panel) shows
distribution of differentially expressed genes upon MCU knockdown. B GO enrichment histogram showing top five significantly enriched
biological processes upon MCU knockdown based on the number of differentially expressed genes. C KEGG enrichment histogram showing
top five unique significantly enriched pathways upon MCU knockdown based on the number of differentially expressed genes. D A list of the
top significantly altered genes in the TGFβ pathway identified by RNA-Seq analysis upon MCU knockdown are shown with the fold change
and adjusted p values. E qPCR analysis for TGFβ1, TGFβR1 and TGFβR2 mRNA in control and siMCU cells. The values correspond to average ±
SEM (n = 3). F Western blot analysis of control and shMCU cells using MCU, p-SMAD3 and SMAD3 antibodies. A representative western blot
from three independent experiments is shown. G Control and shMCU cells were transfected with 200 ng of the TGFβ reporter p3TP-Lux and
5 ng Renilla luciferase. Cells were analysed for luciferase activity 48 h later. The values correspond to average ± SEM (n = 3). Two-tailed non-
parametric unpaired t-test was performed for statistical analysis. ****p ≤ 0.0001.
cell supernatant was replaced with basal DMEM medium. The supernatants respiration rate was measured before cells were exposed sequentially to
were centrifuged, and the viral pellet was resuspended in DMEM medium. oligomycin (1 μM), carbonyl cyanide p-trifluoromethoxyphenylhydrazone
RD cells were transduced with shRNA control lentivirus particles or shMCU (FCCP; 1 μM) and rotenone + antimycin A (500 nM each). After each
lentivirus particles with polybrene (8 µg/ml) (Sigma-Aldrich Inc.). Trans- injection, OCR was measured for 5 min, the medium was mixed and again
duced cells were selected with 1 µg/ml puromycin (Sigma-Aldrich Inc.) for measured for another 5 min. After the experiment, protein concentration
three days until all cells in control plates were dead. was determined by lysing samples in each well and performing Bradford
analysis (Bio-Rad). Maximum respiration rate was quantified by maximal
OCR after adding FCCP. ATP-linked respiration was quantified by the
Mitochondrial calcium measurement decrease in OCR upon injection of the ATP synthase inhibitor oligomycin.
Cells were plated on glass bottom dishes and loaded with 5 µM Rhod-2 AM
(Sigma-Aldrich Inc.) and 100 nM MitoTracker Green FM (Invitrogen) in
extracellular medium as described previously [65, 66]. Cells were incubated Reporter assays
for 50 min at 37 °C before washing with the same extracellular buffer TGFβ reporter assay was analysed as described [67]. Briefly, shScr and
containing 0.25% BSA at room temperature for 20 min. To measure shMCU cells were transfected with 200 ng of 3TP-Lux reporter in 24-well
mitochondrial Ca2+, the dishes were mounted on an on-stage incubator at plates. 5 ng of Renilla reporter was co-transfected as an internal normal-
37 °C with 5% CO2 and imaged with confocal microscope with ×60 water isation control. Transfection was carried out in triplicates using Lipofecta-
objective lens. After 1 min of baseline recording, 100 μM histamine (Sigma- mine 3000 Transfection Reagent (Thermo Fisher Scientific). Reporter
Aldrich Inc.) was added to induce mitochondrial Ca2+ uptake. Confocal activity was analysed with the Dual-Luciferase Reporter Assay System
images were recorded every 1 s at 561 nm excitation for another 4 min. (Promega). Luminescence was analysed with Varioskan plate reader using
The fluorescence intensities of the images were analysed and quantified the SkanIT software.
with Image J (NIH). Mitochondrial Ca2+ changes were quantified by
plotting relative fluorescence intensity of the images for a duration of
5 min. Basal mitochondrial Ca2+ was quantified by measuring relative Western blot analysis
fluorescence intensity during the first 1 min of baseline recording. Maximal Whole-cell and tumour lysates were isolated using RIPA buffer supplemented
mitochondrial Ca2+ uptake was quantified by the difference between with protease inhibitors (Complete Mini, Sigma-Aldrich Inc.) and phosphatase
maximal fluorescence intensity and basal fluorescence intensity. inhibitors including sodium pyrophosphate, β-glycerophosphate, sodium
fluoride and sodium orthovanadate (Sigma-Aldrich). The following primary
antibodies were used: anti-MCU (#D2Z3B 1:1000, Cell Signaling), anti-MICU1
Reactive oxygen species (#HPA037479 1:1000, Sigma-Aldrich), anti-MICU2 (#ab101465 1:1000, Abcam),
Cellular ROS and mitochondrial superoxide were detected using fluorescence anti-phospho-SMAD3 (#C25A9, 1:1000, Cell Signaling), anti-SMAD3 (#9513,
probe CM-H2DCFDA (Invitrogen; Thermo Fisher Scientific, Inc., USA) and 1:1000, Cell Signaling), anti-MYOG (#sc-12732, 1:500, Santa-Cruz), anti-MHC
MitoSOX Red (Invitrogen; Thermo Fisher Scientific, Inc., USA) respectively. Cells (#sc-32732, 1:250, Santa-Cruz) anti-HSP60 (#611563, BD Biosciences), anti-
were trypsinised and loaded with 5 μM CM-H2DCFDA or 5 μM MitoSOX Red phospho-NF-κB (#3037, 1:1000, Cell Signaling), anti-NF-κB (#ab52175, 1:500,
for 20 min at 37 °C, respectively. Fluorescence intensity was analysed using Abcam), anti-phospho-p38 MAPK (#9211, 1:1000, Cell Signaling), anti-p38
flow cytometry. A minimum of 100,000 events per sample were collected and MAPK (#9212, 1:1000, Cell Signaling), and anti-β-actin (#A2228, 1:10,000, Sigma-
the data was analysed using CytExpert software (Beckman Coulter, Inc.). To Aldrich). Appropriate secondary antibodies (IgG-Fc Specific-Peroxidase) of
modulate mROS levels, RD cells were treated with 200 nM of mitoTEMPO mouse or rabbit origin (Sigma-Aldrich) were used.
(mT), whereas shMCU cells were treated with 500 nM antimycin A (AA) for
48 h. DMSO was used as a control.
To measure mitochondrial hydrogen peroxide, cells were transfected RNA sequencing (RNA-Seq) and quantitative real-time
with pC1-HyPerRed-mito (Addgene plasmid #60247). Forty-eight hours polymerase chain reaction (qPCR)
post transfection, cells were imaged with confocal microscope with ×60 For RNA-Seq analysis, RNA was isolated from control (siScr) and siMCU cells in
water objective lens. HyperRed-mito fluorescence intensity was analysed triplicates using Trizol. RNA purity and integrity were assessed with Nanodrop,
by Image J software (NIH). agarose gel electrophoresis and Agilent 2100. Raw image data file from
Illumina (HiSeq PE150) was transformed to Sequenced Reads by CASAVA base
recognition and stored in FASTQ(fq) format. Raw reads were filtered in order to
ATP measurement achieve clean reads using the following filtering conditions: reads without
ATP production was measured with the ATPlite Luminescence Assay adaptors, reads containing number of base that cannot be determined below
System (PerkinElmer) according to the manufacturer’s instructions. 10% and at least 50% bases of the reads having Qscore denoting Quality value
≤5. For mapping of the reads, STAR software was used. 1 M base was used as
the sliding window for distribution of the mapped reads. For the analysis of
Oxygen consumption rate measurement
differentially expressed genes, Gene Ontology (GO) and Kyoto Encyclopaedia
Oxygen consumption rate (OCR) was measured with a XF24 extracellular
analyser (Seahorse Bioscience) and XF Cell Mito Stress Test Kit (Seahorse of Genes and Genomes (KEGG) analysis were done with corrected p value
Bioscience). Cells were seeded at 50,000 cells/well (~80–90% confluentH.Y. Chiu et al.
10
Fig. 5 MCU promotes ERMS tumour growth in vivo. A, B Nude mice were injected with shScr cells (n = 7) or shMCU cells (n = 7).
Representative images of 5 mice in each group (A), and resected tumours of 6 mice in each group (B) are shown. C, D The absolute tumour
volume and body weight are shown in the graphs below. Statistical significance was calculated using repeated-measure one-way ANOVA where
****p ≤ 0.0001. Values correspond to the average ± SEM. E Tumours from two shScr and two shMCU mice were analysed by IHC using anti-MCU,
anti-Ki67, anti-MHC, anti-MCAM, anti-SNAI2 and anti-active caspase 3 antibodies. Histology was assessed by haematoxylin and eosin (H&E)
staining. Images were taken at ×40 magnification. Inset shows ×3 zoomed in image. Scale bar: 50 μm. F Two sets of tumour lysates from shScr
and shMCU mice were analysed by western blot with anti-p-SMAD3, anti-SMAD3, anti-MHC, anti-MYOG and anti-β-actin antibodies.
Cell Death and Disease (2022)13:419H.Y. Chiu et al.
11
internal control GAPDH to obtain delta CT (ΔCT). Relative expression was Proliferation and differentiation assays
calculated by 2−ΔCT equation. qPCR was done using technical triplicates Proliferation and differentiation were analysed as described [68, 69]. Briefly,
and at least three independent biological replicates were done for each proliferation was measured using 5-bromo-2’-deoxy-uridine (BrdU) label-
analysis. Representative data is shown. Primer sequences can be found in ling (Roche, Basel, Switzerland). Cells were pulsed with 10 μM BrdU, fixed
Supplementary Table 1. RNA-Seq data has been deposited in GEO under and incubated with anti-BrdU antibody (1:100) followed by anti-mouse Ig-
the accession number GSE173200. fluorescein antibody (1:200) and mounted onto a glass slide using DAPI
Cell Death and Disease (2022)13:419H.Y. Chiu et al.
12
Fig. 6 Modulation of mROS impacts TGFβ signalling. A shScr and shMCU RD cells were treated with DMSO, mitoTEMPO (mT) or antimycin A
(AA) for 48 h. MitoSOX staining showed significantly decreased mROS levels upon mT treatment in shScr cells, whereas increased mROS levels
were observed with AA treatment in both shScr and shMCU cells. The values correspond to average ± SEM (n = 3). B shScr and shMCU cells
were treated with mT and AA as indicated for 48 h. Cells were transfected with the p3TP-Lux and analysed for luciferase activity 48 h later. The
values correspond to average ± SEM (n = 3). C p-SMAD3 and SMAD3 levels were examined by western blot analysis in shScr and shMCU cells
treated with mT and AA. Representative images of three independent experiments are shown. D Proliferation was analysed by BrdU assay in
shScr cells and shMCU cells treated with mT or AA for 48 h as indicated. Images are representative of three independent experiments. Scale
bar: 50μm. The bar graph shows the percentage of BrdU+ cells in shMCU cells relative to shScr cells. The values correspond to average ± SEM.
E shScr cells were treated for 5 days in differentiation media with DMSO or mT and shMCU cells were treated with DMSO or AA. MHC+ cells
were analysed by immunofluorescence and quantified using western blot with anti-MHC antibody. Nuclei were stained with DAPI.
Representative images of three independent experiments are shown. Scale bar: 50 μm. F Migration was analysed for 24 h using Boyden
chamber assays following 48 h treatment of shScr cells with DMSO or mT and shMCU cells with DMSO or AA. Images are representative of
three independent experiments. Scale bar: 200 μm. The relative percentage of migrated cells were quantified in the scatter plot. The values
correspond to average ± SEM.G Matrigel invasion was analysed after 24 h following treatment of shScr cells with DMSO or mT and shMCU cells
with DMSO or AA for 48 h. Images are representative of three independent experiments. Scale bar: 200 μm. The relative percentage of
migrated cells were quantified in the scatter plot and the values correspond to average ± SEM. One-way ANOVA test with appropriate
correction was performed for statistical analysis. ns not significant, **p ≤ 0.01, ****p ≤ 0.0001.
Fig. 7 Graphical model of MCU function in ERMS. Mitochondrial calcium uniporter (MCU) is overexpressed in ERMS. Elevated mitochondrial
calcium uptake due to MCU overexpression in the mitochondria promotes mROS production that activates TGFβ signalling and promotes
tumour progression by increasing proliferation and motility with a decreased propensity to differentiate in vitro and in vivo.
(Vectashield, Vector Laboratories, CA, USA). Images were captured using Mouse xenograft experiments
fluorescence microscope BX53 (Olympus Corporation, Shinjuku, Tokyo, Six-week-old C.Cg/AnNTac-Foxn1nuNE9 female BALB/c nude mice (InVivos,
Japan) at ×40 magnification. Singapore) were injected subcutaneously in the right flank with either
For differentiation, cells were cultured in differentiation media shScr or shMCU RD cells (106 cells per mice). 7 mice were used randomly in
consisting of either basal DMEM or RPMI 1640 with 2% Horse Serum each group. The number of mice per group was determined using power
(HyClone, Cytiva, U.S.) for 2–5 days. Cells were incubated with anti-MHC analysis assuming 5% significance level and 80% statistical power with
primary antibody (MHC; R&D Systems, Minneapolis, MN, USA) (1:400) 10% attrition rate. Tumour onset and growth were monitored every
followed by secondary goat anti-Mouse IgG (H + L) Highly Cross- alternate day. Tumour diameter was measured, and volume was calculated
Adsorbed Secondary Antibody, Alexa Fluor 568 (Thermo Fisher using the following formula: V = (L × W × W)/2, where V = tumour volume,
scientific). Coverslips were mounted with DAPI (Vectashield, Vector L = tumour length, W = tumour width. Resected tumours were used to
Laboratories, CA, USA) and imaged with BX53 microscope (Olympus prepare tumour lysates for western blot analysis or fixed with formalin for
Corporation) at ×40 magnification. histopathological analysis. No blinding was done for the analysis. All
animal procedures were approved by the Institutional Animal Care and Use
Committee under the protocol number R19-0890.
Migration and invasion assay
Migratory and invasive capacity were assessed as described [68, 69]
with Boyden chamber (Greiner Bio-One). Briefly, cells were serum Immunohistochemistry (IHC)
deprived for at least 12 h and seeded at a density of 50,000 cell per well Paraffin sections of 6 archival primary ERMS tumours from KK Women’s
in serum-free media. In all, 10% FBS-containing media was added to and Children Hospital in Singapore were analysed by IHC using anti-MCU
the lower chamber. The inserts were stained with crystal violet after antibody (1:50, Sigma-Aldrich). Following Institutional Review Board
24 h and imaged at ×10 magnification. The invasive capacity of the approval (CIRB 2014/20179), specimens were obtained from patients at
cells was determined similarly using inserts coated with matrigel (Bio KK Women’s and Children Hospital who were recruited prospectively, with
Lab) and cells were seeded at a density of 70,000 cells per insert. written parental consent and child assent obtained. TMA (SO2082b),
Cell Death and Disease (2022)13:419H.Y. Chiu et al.
13
comprising of 27 ERMS tumour specimens, 24 ARMS tumour specimens 16. Mallilankaraman K, Doonan P, Cárdenas C, Chandramoorthy HC, Müller M, Miller
and 8 striated muscle tissue, was purchased from US Biomax, Inc. and R, et al. MICU1 is an essential gatekeeper for MCU-mediated mitochondrial Ca2+
analysed by IHC using anti-MCU antibody (1:50, Sigma-Aldrich) following uptake that regulates cell survival. Cell 2012;151:630–44.
the manufacturer’s protocol. Paraffin sections from mouse xenografts were 17. Csordás G, Golenár T, Seifert EL, Kamer KJ, Sancak Y, Perocchi F, et al. MICU1
stained with haematoxylin and eosin and analysed by IHC as described controls both the threshold and cooperative activation of the mitochondrial Ca2+
[68, 69]. Sections were incubated overnight at 4 °C with anti-MCU (1:50, uniporter. Cell Metab. 2013;17:976–87.
Sigma-Aldrich), anti-Ki67 (1:100, Santa Cruz Biotechnology), anti-MCAM 18. Payne R, Hoff H, Roskowski A, Foskett JK. MICU2 restricts spatial crosstalk
(1:200, Proteintech), anti-SNAI2 (1:100, Proteintech), anti-active caspase 3 between InsP3R and MCU channels by regulating threshold and gain of MICU1-
(1:200, Cell Signaling), anti-MHC (1:200, Santa Cruz Biotechnology) mediated inhibition and activation of MCU. Cell Rep. 2017;21:3141–54.
antibodies using Dako REAL EnVIsion-HPR, Rabbit-Mouse kit (Dako, 19. Vultur A, Gibhardt CS, Stanisz H, Bogeski I. The role of the mitochondrial calcium
Denmark). Sections were counterstained with haematoxylin (Sigma- uniporter (MCU) complex in cancer. Pflug Arch. 2018;470:1149–63.
Aldrich). Slides were dehydrated and mounted using DPX (Sigma-Aldrich) 20. Cui C, Yang J, Fu L, Wang M, Wang X. Progress in understanding mitochondrial
and imaged using BX53 Olympus microscope at ×40 magnification. calcium uniporter complex-mediated calcium signalling: a potential target for
cancer treatment. Br J Pharmacol. 2019;176:1190–205.
21. Tosatto A, Sommaggio R, Kummerow C, Bentham RB, Blacker TS, Berecz T, et al.
Statistical analysis The mitochondrial calcium uniporter regulates breast cancer progression via HIF‐
For statistical analysis, two-tailed non-parametric unpaired t test was used
1α. EMBO Mol Med. 2016;8:569–85.
to evaluate the significance between data sets with the use of GraphPad
22. Liu Y, Jin M, Wang Y, Zhu J, Tan R, Zhao J, et al. MCU-induced mitochondrial
prism 9.0 software. For animal xenograft experiment and rescue calcium uptake promotes mitochondrial biogenesis and colorectal cancer
experiments, one-way analysis of variance test (ANOVA) with appropriate growth. Signal Transduct Target Ther. 2020;5:1–13.
correction was performed with the GraphPad prism 9.0 software. Each 23. Ren T, Zhang H, Wang J, Zhu J, Jin M, Wu Y, et al. MCU-dependent mitochondrial
experiment was performed at least thrice as independent biological Ca2+ inhibits NAD+/SIRT3/SOD2 pathway to promote ROS production and
replicates. Each independent experiment had three technical replicates metastasis of HCC cells. Oncogene. 2017;36:5897–909.
with the exception of migration and invasion assay which had two
24. Marchi S, Lupini L, Patergnani S, Rimessi A, Missiroli S, Bonora M, et al. Down-
technical replicates each. All technical replicates were plotted on the
regulation of the mitochondrial calcium uniporter by cancer-related miR-25. Curr
scatter plots. Standard error of mean was calculated for all data sets and a Biol. 2013;23:58–63.
p valueH.Y. Chiu et al.
14
44. Feno S, Butera G, Vecellio Reane D, Rizzuto R, Raffaello A. Crosstalk between 68. Bhat AV, Palanichamy Kala M, Rao VK, Pignata L, Lim HJ, Suriyamurthy S, et al.
calcium and ROS in pathophysiological conditions. Oxid Med Cell Longev. Epigenetic regulation of the PTEN-AKT-RAC1 axis by G9a is critical for tumor
2019;2019:9324018. growth in alveolar rhabdomyosarcoma. Cancer Res. 2019;79:2232–43.
45. Wang Y, Li X, Zhao F. MCU-dependent mROS generation regulates cell meta- 69. Pal A, Leung JY, Ang GCK, Rao VK, Pignata L, Lim HJ, et al. EHMT2 epigenetically
bolism and cell death modulated by the AMPK/PGC-1α/SIRT3 signaling pathway. suppresses Wnt signaling and is a potential target in embryonal rhabdomyo-
Front Med. 2021;8:674986. sarcoma. eLife. 2020;9:e57683.
46. Delierneux C, Kouba S, Shanmughapriya S, Potier-Cartereau M, Trebak M, Hempel
N. Mitochondrial calcium regulation of redox signaling in cancer. Cells
2020;9:432. ACKNOWLEDGEMENTS
47. Chang C-H, Pauklin S. ROS and TGFβ: from pancreatic tumour growth to We thank Peter Houghton (Nationwide Children’s Hospital, Ohio, USA) and Rosella
metastasis. J Exp Clin Cancer Res. 2021;40:152. Rota (Bambino Gesu Children’s Hospital, Rome, Italy) for the ERMS cell lines, Jeff
48. Lin W, Tsai W-L, Shao R-X, Wu G, Peng LF, Barlow LL, et al. Hepatitis C virus Wrana (Lunenfeld-Tanenbaum Research Institute, Mount Sinai Hospital, Toronto,
regulates transforming growth factor beta1 production through the generation Canada) for 3TP-Lux reporter and Karthik Mallilankaraman (National University of
of reactive oxygen species in a nuclear factor kappaB-dependent manner. Gas- Singapore) for valuable advice, discussions and imaging buffers.
troenterology 2010;138:2509–18.
49. Hedrick E, Crose L, Linardic CM, Safe S. Histone deacetylase inhibitors inhibit
rhabdomyosarcoma by reactive oxygen species-dependent targeting of specifi-
city protein transcription factors. Mol Cancer Ther. 2015;14:2143–53. AUTHOR CONTRIBUTIONS
50. Pan X, Liu J, Nguyen T, Liu C, Sun J, Teng Y, et al. The physiological role of HYC did all the experiments. AHPL provided tumour samples and analysed the
mitochondrial calcium revealed by mice lacking the mitochondrial calcium uni- patient IHC data. HYC and RT analysed the data and wrote the manuscript.
porter. Nat Cell Biol. 2013;15:1464–72.
51. Luongo TS, Lambert JP, Yuan A, Zhang X, Gross P, Song J, et al. The mitochondrial
calcium uniporter matches energetic supply with cardiac workload during stress FUNDING
and modulates permeability transition. Cell Rep. 2015;12:23–34. This work was supported by the Ministry of Education grant [NUHSRO/2020/149/T1/
52. Qiu J, Tan Y-W, Hagenston AM, Martel M-A, Kneisel N, Skehel PA, et al. Mito- Seed-Sep/03] to RT and VIVA Foundation for Children with Cancer (VIVA-KKH
chondrial calcium uniporter MCU controls excitotoxicity and is transcriptionally Paediatric Brain and Solid Tumour Programme) to AHPL. HYC is supported by the
repressed by neuroprotective nuclear calcium signals. Nat Commun. 2013;4:2034. President’s Graduate Scholarship at the National University of Singapore.
53. Joiner MA, Koval OM, Li J, He BJ, Allamargot C, Gao Z, et al. CaMKII determines
mitochondrial stress responses in heart. Nature 2012;491:269–73.
54. Tarasov AI, Semplici F, Ravier MA, Bellomo EA, Pullen TJ, Gilon P, et al. The COMPETING INTERESTS
mitochondrial Ca2+ uniporter MCU is essential for glucose-induced ATP increases The authors declare no competing interests.
in pancreatic β-cells. PLoS ONE. 2012;7:e39722.
55. Gherardi G, Nogara L, Ciciliot S, Fadini GP, Blaauw B, Braghetta P, et al. Loss of
mitochondrial calcium uniporter rewires skeletal muscle metabolism and sub- ETHICS APPROVAL
strate preference. Cell Death Differ. 2019;26:362–81. Following Institutional Review Board approval (CIRB 2014/20179), tumour specimens
56. Chiu HY, Tay EXY, Ong DST, Taneja R. Mitochondrial dysfunction at the center of were obtained from patients at KK Women’s and Children Hospital who were
cancer therapy. Antioxid Redox Signal. 2020;32:309–30. recruited prospectively, with written parental consent and child assent obtained.
57. Krstić J, Trivanović D, Mojsilović S, Santibanez JF. Transforming growth factor-
beta and oxidative stress interplay: implications in tumorigenesis and cancer
progression. Oxid Med Cell Longev. 2015;2015:654594. ADDITIONAL INFORMATION
58. Yang I-H, Lee J-J, Wu P-C, Kuo H-K, Kuo Y-H, Huang H-M. Oxidative stress Supplementary information The online version contains supplementary material
enhanced the transforming growth factor-β2-induced epithelial-mesenchymal available at https://doi.org/10.1038/s41419-022-04835-4.
transition through chemokine ligand 1 on ARPE-19 cell. Sci Rep. 2020;10:4000.
59. Wang S, Guo L, Dong L, Guo L, Li S, Zhang J, et al. TGF-beta1 signal pathway may Correspondence and requests for materials should be addressed to Reshma Taneja.
contribute to rhabdomyosarcoma development by inhibiting differentiation.
Cancer Sci. 2010;101:1108–16. Reprints and permission information is available at http://www.nature.com/
60. Wang H, Yang G-H, Bu H, Zhou Q, Guo L-X, Wang S-L, et al. Systematic analysis of reprints
the TGF-beta/Smad signalling pathway in the rhabdomyosarcoma cell line RD. Int
J Exp Pathol. 2003;84:153–63. Publisher’s note Springer Nature remains neutral with regard to jurisdictional claims
61. Liu D, Black BL, Derynck R. TGF-β inhibits muscle differentiation through func- in published maps and institutional affiliations.
tional repression of myogenic transcription factors by Smad3. Genes Dev.
2001;15:2950–66.
62. Curry MC, Peters AA, Kenny PA, Roberts-Thomson SJ, Monteith GR. Mitochondrial
calcium uniporter silencing potentiates caspase-independent cell death in MDA-
MB-231 breast cancer cells. Biochem Biophys Res Commun. 2013;434:695–700. Open Access This article is licensed under a Creative Commons
63. Singh R, Letai A, Sarosiek K. Regulation of apoptosis in health and disease: the Attribution 4.0 International License, which permits use, sharing,
balancing act of BCL-2 family proteins. Nat Rev Mol Cell Biol. 2019;20:175–93. adaptation, distribution and reproduction in any medium or format, as long as you give
64. Wang L, Hensch NR, Bondra K, Sreenivas P, Zhao XR, Chen J, et al. SNAI2- appropriate credit to the original author(s) and the source, provide a link to the Creative
mediated repression of BIM protects rhabdomyosarcoma from ionizing radiation. Commons license, and indicate if changes were made. The images or other third party
Cancer Res. 2021;81:5451–63. material in this article are included in the article’s Creative Commons license, unless
65. Madesh M, Hawkins BJ, Milovanova T, Bhanumathy CD, Joseph SK, Ramachan- indicated otherwise in a credit line to the material. If material is not included in the
draRao SP, et al. Selective role for superoxide in InsP3 receptor–mediated article’s Creative Commons license and your intended use is not permitted by statutory
mitochondrial dysfunction and endothelial apoptosis. J Cell Biol. regulation or exceeds the permitted use, you will need to obtain permission directly
2005;170:1079–90. from the copyright holder. To view a copy of this license, visit http://creativecommons.
66. Mallilankaraman K, Cárdenas C, Doonan PJ, Chandramoorthy HC, Irrinki KM, org/licenses/by/4.0/.
Golenár T, et al. MCUR1 is an essential component of mitochondrial Ca2+ uptake
that regulates cellular metabolism. Nat Cell Biol. 2012;14:1336–43.
67. Acharjee S, Chung T-K, Gopinadhan S, Shankar SR, Wang Y, Li L, et al. Sharp-1 © The Author(s) 2022
regulates TGF-β signaling and skeletal muscle regeneration. J Cell Sci.
2014;127:599–608.
Cell Death and Disease (2022)13:419You can also read