Observation and modelling of ozone-destructive halogen chemistry in a passively degassing volcanic plume
←
→
Page content transcription
If your browser does not render page correctly, please read the page content below
Atmos. Chem. Phys., 21, 12413–12441, 2021
https://doi.org/10.5194/acp-21-12413-2021
© Author(s) 2021. This work is distributed under
the Creative Commons Attribution 4.0 License.

Observation and modelling of ozone-destructive halogen chemistry
in a passively degassing volcanic plume
Luke Surl1,2,3 , Tjarda Roberts1 , and Slimane Bekki2
1 Laboratoirede Physique et de Chimie de l’Environnement et de l’Espace, CNRS, Université d’Orléans, Orléans, France
2 LATMOS/IPSL,   Sorbonne Université, UVSQ, CNRS, Paris, France
3 Department of Chemistry, University of Aberdeen, Aberdeen, UK

Correspondence: Luke Surl (lukesurl@gmail.com)

Received: 18 February 2021 – Discussion started: 18 March 2021
Revised: 2 July 2021 – Accepted: 15 July 2021 – Published: 19 August 2021

Abstract. Volcanoes emit halogens into the atmosphere that       linear controls on this ratio. Sensitivity simulations con-
undergo complex chemical cycling in plumes and cause de-         firm the importance of near-vent radical products from high-
struction of ozone. We present a case study of the Mount         temperature chemistry in initiating the ambient-temperature
Etna plume in the summer of 2012, when the volcano was           plume halogen cycling. Heterogeneous reactions that activate
passively degassing, using aircraft observations and numeri-     bromine also activate a small fraction of the emitted chlo-
cal simulations with a new 3D model “WRF-Chem Volcano”           rine; the resulting production of chlorine radical Cl strongly
(WCV), incorporating volcanic emissions and multi-phase          enhances the methane oxidation and hence the formation of
halogen chemistry.                                               formaldehyde (HCHO) in the plume.
   Measurements of SO2 – an indicator of plume intensity –          Modelled rates of ozone depletion are found to be similar
and ozone were made in the plume a few tens of kilometres        to those derived from aircraft observations. Ozone destruc-
from Etna, revealing a strong negative correlation between       tion in the model is controlled by the processes that recycle
ozone and SO2 levels. From these observations, using SO2         bromine, with about three-quarters of this recycling occur-
as a tracer species, we estimate a mean in-plume ozone loss      ring via reactions between halogen oxide radicals. Through
rate of 1.3×10⁻⁵ molecules of O3 per second per molecule of      sensitivity simulations, a relationship between the magnitude
SO2 . This value is similar to observation-based estimates re-   of halogen emissions and ozone loss is established.
ported very close to Etna’s vents, indicating continual ozone       Volcanic halogen cycling profoundly impacts the over-
loss in the plume up to at least tens of kilometres downwind.    all plume chemistry in the model, notably hydrogen oxide
   The WCV model is run with nested grids to simulate the        radicals (HOx ), nitrogen oxides (NOx ), sulfur, and mercury
plume close to the volcano at 1 km resolution. The focus is on   chemistry. In the model, it depletes HOx within the plume,
the early evolution of passively degassing plumes aged less      increasing the lifetime of SO2 and hence slowing sulfate
than 1 h and up to tens of kilometres downwind. The model        aerosol formation. Halogen chemistry also promotes the con-
is able to reproduce the so-called “bromine explosion”: the      version of NOx into nitric acid (HNO3 ). This, along with
daytime conversion of HBr into bromine radicals that con-        the displacement of nitrate out of background aerosols in
tinuously cycle in the plume. These forms include the radi-      the plume, results in enhanced HNO3 levels and an almost
cal BrO, a species whose ratio with SO2 is commonly mea-         total depletion of NOx in the plume. The halogen–mercury
sured in volcanic plumes as an indicator of halogen ozone-       model scheme is simple but includes newly identified photo-
destroying chemistry.                                            reductions of mercury halides. With this set-up, the mercury
   The species BrO is produced in the ambient-temperature        oxidation is found to be slow and in near-balance with the
chemistry, with in-plume BrO / SO2 ratios on the order of        photo-reduction of the plume. Overall, the model findings
10−4 mol/mol, similar to those observed previously in Etna       demonstrate that halogen chemistry has to be considered for
plumes. Wind speed and time of day are identified as non-        a complete understanding of sulfur, HOx , reactive nitrogen,

Published by Copernicus Publications on behalf of the European Geosciences Union.
12414                                     L. Surl et al.: Observation and modelling of ozone-destructive halogen chemistry

and mercury chemistry and of the formation of sulfate parti-       et al., 2013; Cadoux et al., 2015; Brenna et al., 2020), depen-
cles in volcanic plumes.                                           dent upon the fraction of emitted halogens that avoid dry-
                                                                   and wet-removal processes within the tropospheric plume
                                                                   and are therefore able to reach the stratosphere. Estimates
1     Introduction                                                 for this fraction vary substantially (between 0 and 1), and the
                                                                   fraction depends on both volcanic and atmospheric condi-
1.1    Background                                                  tions (see Mather, 2015, and references therein). In recent
                                                                   decades, satellite and aircraft observations have identified
Volcanoes emit mixtures of various gases and particulates          the presence of elevated halogens at high altitudes follow-
into the atmosphere. Of the gaseous emissions, H2 O, CO2 ,         ing some (but not all) volcanic eruptions, in particular chlo-
and SO2 are typically the species with the greatest fluxes.        rine as HCl (e.g. Rose et al., 2006; Prata et al., 2007; Carn
Most studies on the atmospheric impact of volcanic emis-           et al., 2016) and occasionally bromine as BrO (Theys et al.,
sions have focused on sulfur because of its well-known ef-         2009, 2014). Co-injection of volcanic halogens alongside
fects on atmospheric composition, notably aerosol loading          SO2 into the stratosphere modifies the chemistry–climate im-
and climate (e.g. Oppenheimer et al., 2011). Several other         pacts of the eruptions (Brenna et al., 2020; Ming et al., 2020;
species are emitted from volcanoes, including other sulfur         Wade et al., 2020). This occurs through feedbacks on SO2
species (such as H2 S, which can, in some cases, be domi-          processing to sulfate particles (Lurton et al., 2018) and deple-
nant) and the primary focus of this study: halogens. Chlorine,     tion of ozone and other climate gases such as water vapour
bromine, and fluorine are routinely detected in various pro-       and methane, with feedbacks on aerosol microphysics and
portions within volcanic plumes and are emitted primarily          transport, thereby changing the radiative impacts (Staunton-
as hydrogen halides. Gerlach (2004) reported that gaseous          Sykes et al., 2021). The chemistry–climate impacts of vol-
emissions from arc volcanoes are, on average, 0.84 % HCl,          canic eruptions also depend on background halogen loading
0.061 % HF, and 0.0025 % HBr. Iodine has also been de-             that is currently elevated due to historic CFC emissions. As
tected in volcanic plumes (e.g Aiuppa et al., 2005; Bo-            the stratospheric halogen loading approaches pre-industrial
browski et al., 2017), but its emission fluxes are typically       levels in future, volcanic sulfur injections are expected to in-
about 2 orders of magnitude below those of bromine.                crease total column ozone, whereas halogen-rich injections
   The quantities of halogen species emitted from a volcano        would deplete ozone (Klobas et al., 2017).
and their temporal variability appear to provide information          All these impacts of volcanic halogens depend critically
on sub-surface processes (Pyle and Mather, 2009). Correla-         on the extent of the conversion of emitted volcanic hydro-
tions between the bromine-to-sulfur ratio and volcanic ac-         gen halides into halogen radicals, a process called halo-
tivity have been found in long-term observations (e.g. Bo-         gen activation. Indeed, hydrogen halides are weakly reac-
browski and Giuffrida, 2012; Dinger et al., 2018; Warnach          tive and very soluble. As a result, their direct impact on at-
et al., 2019; Dinger et al., 2021), suggesting that this ratio     mospheric chemistry is very limited and short-lived because
could potentially be used for monitoring and forecasting of        they are rapidly removed from the atmosphere. In contrast,
volcanic activity.                                                 halogen radicals are much more reactive chemically, in par-
   However, volcanic halogen emissions are not just potential      ticular with respect to ozone, and less soluble. Therefore,
indicators of sub-surface processes. Importantly, they impact      assessing the atmospheric impacts of volcanic halogens re-
the chemical composition of the atmosphere and hence possi-        quires a quantitative understanding of the physico-chemical
bly the climate. For instance ozone, the precursor of the most     plume processes driving the partitioning of volcanic halogen
important atmospheric oxidant (the hydrogen oxide radical          species, especially bromine species, between radicals and hy-
OH), is found to be greatly depleted in volcanic plumes con-       drogen halides. This is the primary focus of the present study.
taining halogens (Rose et al., 2006; Vance et al., 2010; Kelly     Note that only a small fraction of chlorine emissions under-
et al., 2013; Surl et al., 2015). Ozone is predominately de-       takes reactive chemistry in plumes, and this small fraction
stroyed by bromine chemistry cycles (Bobrowski et al., 2007;       is mostly activated as a result of bromine chemistry (Rüdi-
von Glasow, 2010; Roberts, 2018). Halogen chemistry also           ger et al., 2021, and references therein). As in most studies
leads to the depletion of nitrogen oxides (NOx ) and hydrogen      on volcanic plume halogen chemistry, fluorine and iodine are
oxide radicals (HOx ) (Bobrowski et al., 2007; Roberts et al.,     ignored. The solubility and stability of HF, the main emitted
2009; Jourdain et al., 2016) and may oxidize mercury to more       fluorine species, are such that no significant fluorine chem-
soluble, and therefore more easily deposited, forms (von           istry occurs within the plume (von Glasow et al., 2009). Io-
Glasow, 2010). The effects are not limited to the troposphere      dine, while very reactive, is of substantially lower in-plume
because volcanic plumes can also reach the tropopause re-          abundance than bromine and chlorine (Aiuppa et al., 2005).
gion, sometimes injecting halogens directly into the strato-          Once emitted at high temperatures in the atmosphere, vol-
sphere (Rose et al., 2006; Millard et al., 2006). In the case of   canic volatiles are cooled very quickly by the fast mixing
bromine- or chlorine-rich, large-scale eruptions, this could       of the plume with the surrounding air. Whilst some halo-
result in massive stratospheric ozone depletion (Kutterolf         gen radicals as well as HOx and NOx may be formed by

Atmos. Chem. Phys., 21, 12413–12441, 2021                                          https://doi.org/10.5194/acp-21-12413-2021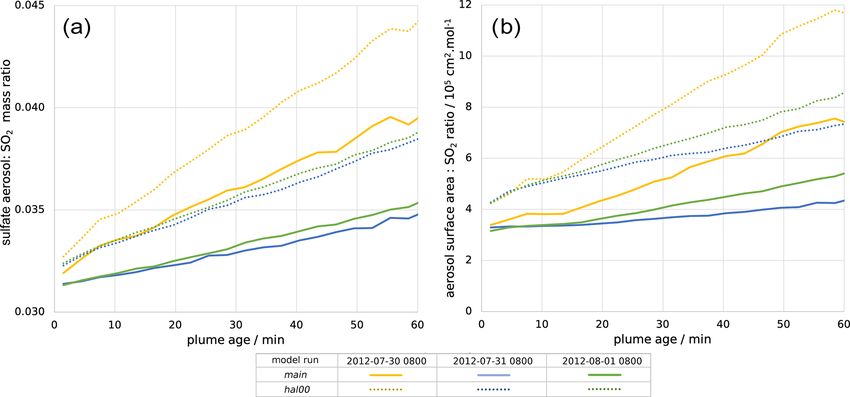
L. Surl et al.: Observation and modelling of ozone-destructive halogen chemistry                                                12415

                                                                          A fast interchange exists between Br and BrO. The
                                                                       Br + O3 → BrO + O2 reaction consumes an O3 molecule,
                                                                       while BrO photolysis effectively reverses this as the O radi-
                                                                       cal produced quickly reacts with O2 to form O3 . When BrO is
                                                                       reduced to Br via any other pathway (directly or indirectly),
                                                                       the net result is the loss of an O3 molecule.
                                                                          As well as depleting ozone, halogen chemistry has influ-
                                                                       ences on other chemical systems, such as through reactions
                                                                       with NOx and HOx , as shown in Fig. 1. Volcanic halogens
                                                                       deplete HOx , increasing the lifetime of SO2 with respect to
                                                                       OH oxidation, and oxidation of CH4 by Cl radicals can sig-
                                                                       nificantly reduce the in-plume lifetime of CH4 . Jourdain et al.
                                                                       (2016) modelled both of these phenomena occurring in an
                                                                       Ambrym plume, finding that halogens’ depletive effect on
                                                                       HOx further increased the lifetime of SO2 with respect to ox-
                                                                       idation by OH by 36 %. Modelling by Roberts et al. (2009)
                                                                       indicates that volcanic halogen chemistry can result in con-
                                                                       version of in-plume NOx to HNO3 .
                                                                          Finally, volcanoes are also sources of mercury to the at-
Figure 1. The major reactions of the bromine cycle. Orange lines in-
                                                                       mosphere (Pyle and Mather, 2003) mainly in the inert form
dicate photolysis reactions, blue lines heterogeneous reactions, and
                                                                       Hg(0) (Witt et al., 2008; Bagnato et al., 2007). A 1D model
black lines other gas-phase reactions. BrO → Br includes one pho-
tolysis reaction and three other reactions.                            study by von Glasow (2010) suggested that this mercury
                                                                       could be rapidly oxidized by halogen chemistry in a vol-
                                                                       canic plume to more soluble forms easily removed from the
high-temperature reactions immediately after emission from             atmosphere (Seigneur and Lohman, 2008). Significant ad-
the vent (in the so-called “effective source region”; see Bo-          vances in understanding of the kinetics of halogen–mercury
browski et al., 2007, and Roberts et al., 2019, and references         chemistry have been made in the last decade (e.g. Saiz-Lopez
therein), it is the atmospheric chemistry in the cooled and ex-        et al., 2018, 2019), and these are included in the modelling
panding plume that causes a sustained halogen cycling that             part of this study.
impacts tropospheric ozone. This halogen chemistry contin-
ues to occur as the plume disperses into the background at-            1.2     Observation and modelling studies
mosphere. This chemistry is complex and non-linear. The
major bromine cycling driving bromine activation and ozone             The current understanding of halogen chemistry within vol-
loss is shown in Fig. 1. Heterogeneous processes involving             canic plumes is based upon a body of observations that
acidic aerosol are the main pathway by which HBr is con-               have used a variety of techniques, coupled with numerical
verted to reactive forms. The complete cycle requires photol-          modelling results, most of which have used zero- or one-
ysis reactions and therefore only occurs within the daytime.           dimensional chemical box models.
This bromine cycle is sometimes referred to as the “bromine
explosion” (Wennberg, 1999; Bobrowski et al., 2007) be-                1.2.1    Observations
cause of its autocatalytic nature; bromine extracted from HBr
can continue to cycle and generate further reactive bromine            There are two main methods for measuring halogens in vol-
from this source. The proportion of emitted bromine that ex-           canic plumes: remote sensing and in situ sampling.
ists as BrO impacts the in-plume BrO / SO2 ratio. The ob-                 Remote sensing accounts for most observations of reactive
servations of Dinger et al. (2021) show that this quantity can         halogens in volcanic plumes. Since the first reported detec-
vary with meteorological conditions. Although no equivalent            tion by Bobrowski et al. (2003), bromine monoxide (BrO)
“chlorine explosion” exists, heterogeneous reactions can also          has been observed within the plume of dozens of volcanoes
generate reactive chlorine radicals (via BrCl), which can re-          by differential optical absorption spectroscopy (DOAS) (see
act with ozone to form chlorine oxide species.                         Gutmann et al., 2018, for a recent catalogue of such observa-
   Reactive halogen chemistry in tropospheric volcanic                 tions). A smaller number of measurements of in-plume ClO
plumes, as evidenced by enhanced BrO, has been observed                and OClO have also been reported. These halogen molecules
for many volcanoes worldwide (Gutmann et al., 2018), with              have spectroscopic signatures within the ultraviolet range,
satellite observations greatly expanding the quantity and ge-          meaning they can be identified from the same data that are
ographic scope of observations (e.g. Hörmann et al., 2013).            used to monitor SO2 , including data collected from long-
                                                                       term DOAS monitoring networks at volcanoes (Dinger et al.,
                                                                       2018; Warnach et al., 2019). As well as ground and airborne

https://doi.org/10.5194/acp-21-12413-2021                                             Atmos. Chem. Phys., 21, 12413–12441, 2021
12416                                    L. Surl et al.: Observation and modelling of ozone-destructive halogen chemistry

observations, BrO has been observed in the plumes of some         rates of chemical reactions and include the continual dilution
larger volcanic eruptions by satellite-based instruments (e.g.    of the plume with background air. Such models are found
Hörmann et al., 2013; Seo et al., 2019), though such large        to better reproduce observations if the initial halogen emis-
eruptions are the focus of a future study rather than this one.   sions include a fraction of halogen radicals. This represents
    In situ sampling of halogens provides the most direct ap-     the radicals generated by high-temperature chemistry in the
proach to quantifying total halogen emissions: time-averaged      effective source region.
sampling has for decades been used to quantify total volcanic        To our best knowledge, Jourdain et al. (2016) is the only
halogen emission contents for F, Cl, Br, and I (e.g. Aiuppa       prior 3D Eulerian-type mesoscale chemistry-transport mod-
et al., 2004; Wittmer et al., 2014). Modern techniques now        elling study published to date dealing with halogen chem-
allow for a degree of speciation in the bromine observed          istry in a tropospheric volcanic plume. Volcanic emissions
through these methods (Rüdiger et al., 2017, 2021). For most      and halogen chemistry were implemented into the CCATT-
reactive halogen species, these methods required samples to       BRAMS model to simulate the chemistry within the plume
be collected in situ and then subsequently analysed in-lab.       of Ambrym during an intense passive-degassing episode in
Consequently, there are fewer in situ observations of reactive    2005. Their model is similar to the one used in our study.
halogens than by remote sensing.                                  However, their gas emission flux for the Ambrym event is
    As well as these direct approaches, ozone measurements        about 6 times greater than the Mount Etna passive-degassing
can provide indirect evidence for halogen chemistry. Ozone        event studied here. Mechanistically, their results showed
destruction in tropospheric volcanic plumes, caused by vol-       the formation of BrO as well as ozone depletion occurring
canic halogen cycling, has been measured in a limited num-        within the plume’s core that impacts bromine speciation. The
ber of cases (Vance et al., 2010; Oppenheimer et al., 2010;       study also simulated in-plume depletion of HOx and NOx
Kelly et al., 2013; Surl et al., 2015). In ash-rich explosive     as well as lengthening of SO2 and methane lifetimes due to
eruptions, it is possible that uptake of ozone on ash parti-      halogen chemistry. The model successfully reproduced ob-
cles may also contribute to some ozone loss (Maters et al.,       served BrO / SO2 spatial patterns; however the magnitude
2017). Measuring ozone in volcanic plumes in the tropo-           was somewhat underestimated, and there were no measure-
sphere region downwind from volcanoes is challenging and          ments of ozone to provide constraints on the predictions of
typically only achieved using instrumented aircraft. Observa-     ozone depletion, a key feature of reactive halogen chemistry.
tions suggest a direct relation between bromine content and       Finally, Jourdain et al. (2016) focuses on the wider-scale im-
ozone depletion (Roberts, 2018), although this is based on        pact of volcanic emissions, whereas this study focuses more
only three available volcanic datasets: Mount Etna, Mount         on the detailed mechanisms of halogen cycling in the early
Redoubt, and Kı̄lauea. Observations at Mount Redoubt vol-         plume with cross-validation against ozone and halogen radi-
cano suggest that ozone losses, as a ratio to SO2 , increase in   cal observations.
magnitude with respect to the distance from the source (Kelly        WRF-Chem has been used in several studies to model tro-
et al., 2013).                                                    pospheric volcanic plumes, generally showing good agree-
    For the above methods, the observed halogen gas quan-         ment with observations (Stuefer et al., 2013; Burton et al.,
tities or ozone depletions are often ratioed to simultaneous      2020; Egan et al., 2020; Rizza et al., 2020; Hirtl et al.,
sulfur or SO2 measurements. This allows for comparison be-        2019, 2020). Such studies have predominantly focused on
tween plumes of different “strengths” (i.e. density or dilu-      ash and SO2 distribution, and there have been none, to our
tion) and, for example, the tracing of how halogen chemistry      knowledge, that incorporate halogen chemistry.
changes as a plume disperses as it travels downwind. This use
of SO2 as a plume tracer presupposes that it has a long atmo-     1.2.3   This study
spheric lifetime relative to the timescale of the given study.
                                                                  The present study is devoted to a plume from Etna dur-
1.2.2   Numerical modelling                                       ing July/August 2012, a period when this volcano was
                                                                  passively degassing. We present new airborne ozone and
Another tool for studying the chemistry of volcanic plumes        SO2 measurements which were made during traverses of
is numerical modelling. Most volcanic plume halogen chem-         plumes at distances 7–21 km from the vents. Several other
istry modelling studies to date have originated from imple-       previously published plume measurements were also made
mentations of a few models, in particular MISTRA (Aiuppa          around this time. Near-simultaneous near-vent (< 500 m)
et al., 2007; Bobrowski et al., 2007; von Glasow, 2010;           ozone measurements and DOAS observations of BrO / SO2
Bobrowski et al., 2015; Surl et al., 2015) and PlumeChem          ratios around 10 km downwind were reported by Surl et al.
(Roberts et al., 2009, 2014, 2018; Kelly et al., 2013).           (2015). Additionally in situ sampling of halogen emissions
A more recent study by Rüdiger et al. (2021) used the             was undertaken that summer at the crater rim by Wittmer
CABBA/MECCA box model. These Lagrangian models are                et al. (2014), and further DOAS measurements were also
either zero- or one-dimensional and simulate the chemical         made of Etna’s plume by Gliß et al. (2015). Consequently,
evolution of the cooled plume by calculating the in-plume         this period of Etna’s activity may have the richest overall

Atmos. Chem. Phys., 21, 12413–12441, 2021                                         https://doi.org/10.5194/acp-21-12413-2021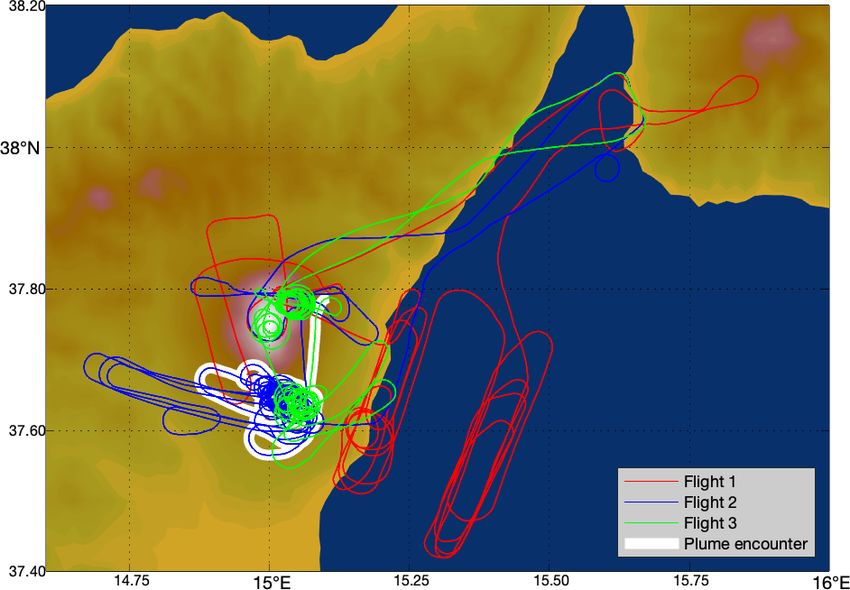
L. Surl et al.: Observation and modelling of ozone-destructive halogen chemistry 12417
dataset to date for determining halogen activity in relation
to ozone loss in the plume of a volcano.
The observational dataset is analysed using a 3D regional
chemistry-transport model (WRF-Chem) modified with re-
spect to its handling of volcanic emissions and with halo-
gen chemistry added to a chemical mechanism. The goal of
the modelling is to assess the ability of the 3D model to ad-
equately reproduce the key chemistry features (ozone loss,
BrO / SO2 ratios) of the Etna plume given reasonable input
parameters, such as the typical halogen emission fluxes for
the volcano in a passive-degassing state. We then diagnose
in-plume chemical processes in the model, exploiting the fact
that a model can be interrogated in far greater detail than an
observational dataset. The focus is on the chemical processes
in the near-downwind plume, up to tens of kilometres from
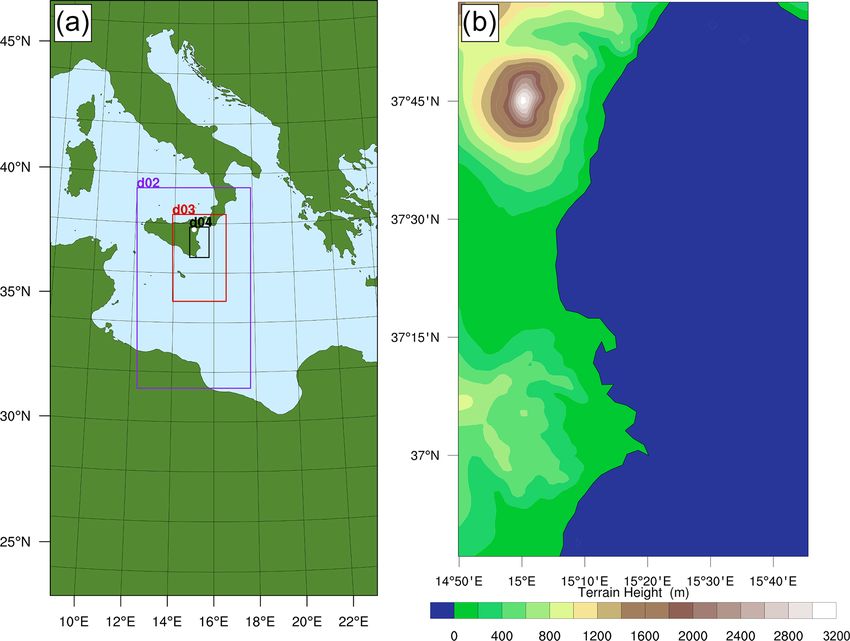
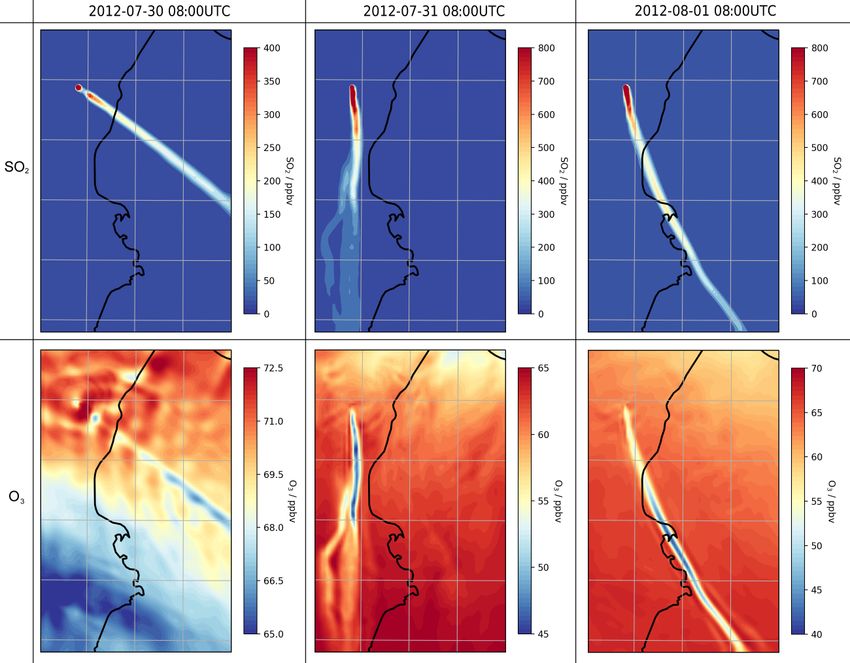
emissions sources for plume ages of up to tens of minutes. As Figure 2. Flight paths of the aircraft on the 3 measurement days:
red – 30 July 2012, blue – 31 July 2012, green – 1 August 2012.
well as halogen chemistry and the associated ozone destruc-
Major plume encounter locations as identified by our algorithm are
tion, the simulated impacts of plume chemistry on the vari- highlighted in white.
ous interconnected chemical systems discussed above (HOx ,
SO2 lifetime and its oxidation to particles, methane lifetime,
reactive nitrogen, and mercury chemistry) are also investi- tential source of interference; however mercury-detecting in-
gated. struments were also active during this campaign, and the
level of gaseous mercury emission from the volcano was de-
termined to be nil or low (Weigelt et al., 2016a). Both the
2 Methods SO2 and ozone instruments have a temporal resolution of 10 s
(averaging time), and their response times are 80 and < 30 s,
2.1 Aircraft measurements of SO2 and ozone in the respectively.
plume Three flights were conducted, one each on the mornings of
30 July 2012, 31 July, and 1 August, during daylight hours.
The aircraft campaign presented in this study was conducted These flights started and ended at Reggio Calabria Airport
as part of the Global Mercury Observation System project and attempted several transects of the plume. The flight paths
(http://www.gmos.eu, last access: 13 August 2021) with the are shown in Fig. 2.
same aircraft and instrumentation discussed in Weigelt et al. Since ambient concentrations of ozone vary both spatially
(2016a) and Weigelt et al. (2016b). We refer the reader to and temporally, rather than assessing all of the observation
these works for a full description of the campaign set-up and data together, we undertook a systematic approach to iden-
instruments; in this section we highlight the most relevant tify and isolate separate “major plume encounters” from the
aspects. dataset and separately evaluate the ozone variations within
The measurements of this study were performed with these. This approach was designed such that the majority of
a CASA 212 two-engine turboprop aircraft fitted with a the variation in ozone within each major plume encounter
specially designed gas inlet system. SO2 was measured could be ascribed to plume chemistry rather than variations in
with a Thermo Environmental Instruments Model 43C the background. Our approach also fixed a maximum range
pulsed fluorescence gas analyser with root mean squared of distances from the vent that could be considered part of
(RMS) noise of 1 ppbv and precision of 1 ppbv or 1 % a single major plume encounter so as to minimize any inter-
of reading (http://www.thermo.com.cn/Resources/200802/ nal variation in ozone losses within a plume encounter due to
productPDF_12267.pdf, last access: 13 August 2021). Es- plume chemistry varying with distance from the source. In-
timates of the interferences from H2 O and NO are re- spection of the data showed that, outside of the plume, rapid
ported as < 3 ppbv and < 2 % of reading. Ozone was mea- changes in altitude corresponded with substantial changes in
sured with a Teledyne API 400E, with RMS noise and ozone mixing ratio. In order to avoid mistaking such back-
precision < 0.5 % of reading. This measurement is not ground ozone variation as a plume signal, we fixed a maxi-
subject to interference from SO2 or H2 O as these in- mum range of altitudes that could be considered part of one
terferences are efficiently removed by the comparison of major plume encounter. Lastly, encounters that are too short
measurements between the ambient air channel and the or do not reach a sufficiently high plume intensity so as to
ozone-scrubbed reference channel (http://www.teledyne-api. allow for an identification of signal above background varia-
com/products/oxygen-compound-instruments/t400, last ac- tion are dismissed.
cess: 13 August 2021). Mercury vapour is listed as a po-
https://doi.org/10.5194/acp-21-12413-2021 Atmos. Chem. Phys., 21, 12413–12441, 2021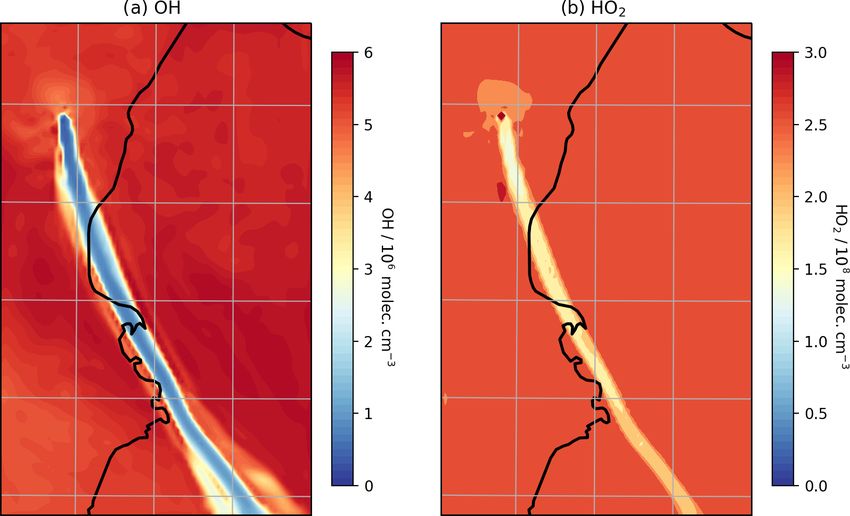
12418                                     L. Surl et al.: Observation and modelling of ozone-destructive halogen chemistry

  Our algorithm is therefore as follows:                           overall reaction with HBr or HCl) by a parameterization that
                                                                   assumes fast aqueous-phase equilibria between Br2 , Br2 Cl− ,
  – A plume encounter is considered to begin when the              and BrCl as described by Jourdain et al. (2016). Reactions
    SO2 measurement exceeds 10 ppbv and ends when SO2              added to the scheme are listed in the Supplement (Tables S1,
    drops below 10 ppbv.                                           S2, S4) along with their rate equations and references for
                                                                   these. Parameters controlling the heterogenous reactions are
  – If a data point’s altitude is more than 300 m higher or
                                                                   tabulated in Table S3.
    lower than that of any previous data point in the current
                                                                      The only SO2 oxidation pathway included in CBMZ-
    encounter, the encounter ends, and another immediately
                                                                   MOSAIC is oxidation by OH, and we did not add any fur-
    begins.
                                                                   ther pathways. Galeazzo et al. (2018) discusses how other
  – If a data point’s distance from the source is more than        pathways could potentially occur in the aqueous phase in
    5 km greater or smaller than that of any previous data         volcanic plumes: oxidation by O3aq , oxidation by H2 O2 , and
    point in the current encounter, the encounter ends, and        transition-metal-catalysed oxidation by O2 .
    another immediately begins.                                       Our volcanic emissions pre-processor, a modified version
                                                                   of the PREP-CHEM-SRC utility (Freitas et al., 2011), pro-
  – If a plume encounter has maximum SO2 less than                 vides as inputs to the model fluxes of sulfur, bromine, chlo-
    100 ppbv or lasts for less than 2 min, it is considered        rine, and mercury species as well as an “at-source” sul-
    a “minor plume encounter” and is discarded.                    fate particle flux and fluxes of radicals resulting from high-
                                                                   temperature chemistry within the vent (e.g. OH, NO). This
This process is presented in full as a flowchart in Fig. S1.       emission is time-invariant and is into a single grid cell of the
                                                                   model (cf. the more spatially and temporally sophisticated
2.2     Modelling
                                                                   pre-processor of Hirtl et al., 2020).
We use version 4.1.5 of WRF-Chem (Grell et al., 2005),                We have also introduced artificial tracer species to WCV
which is a fully coupled three-dimensional regional model          that do not influence the chemistry but are useful for analy-
for atmospheric physics, meteorology, and chemistry, includ-       sis; tracer1 is a wholly inert species that is emitted with the
ing cloud and aerosol radiative feedback processes. We have        same flux rate as SO2 . It is used to compute mean (weighted
made several modifications to the code, in particular volcanic     average) in-plume values of parameters; here an “in-plume
gas emissions and chlorine, bromine, and mercury chemistry.        average” of a value (e.g. of ozone mixing ratio) refers to the
We name this new model “WRF-Chem Volcano” (WCV).                   average of this value across all grid boxes where tracer1 ex-
Our WCV developments build on the WRF-Chem version                 ceeds 3 ppbv, weighted by the tracer1 content of the boxes.
developed by the Roland von Glasow group at the Univer-               The species tracer2 is similar to tracer1 but undergoes a
sity of East Anglia (Surl, 2016), and our WCV developments         first-order exponential decay with specified rate. The ratio
were made with reference to the model code of Badia et al.         of tracer1 and tracer2 can therefore be used to derive the
(2019), another development on the University of East An-          mean time since emission of any part of the plume. This ap-
glia version with a focus on marine chemistry.                     proach allows us to accurately calculate plume age in any
                                                                   model grid cell and enables us to monitor how plume param-
2.2.1    Mechanism                                                 eters (e.g. ozone mixing ratio, BrO / SO2 ratio) vary with the
                                                                   plume time evolution since emission.
WCV extends the CBMZ-MOSIAC chemistry scheme with                     We have also added to the model output monitoring of sev-
eight aerosol size bins (Zaveri and Peters, 1999; Zaveri et al.,   eral chemistry diagnostics, such as rates of relevant reactions,
2008) to include bromine, chlorine, and mercury chemical           in order to carry out species’ chemical budgets and therefore
mechanisms with gas-phase, photolytic, and heterogeneous           facilitate the analysis of the underlying halogen and ozone-
reactions involving the following species: HBr, Br, BrO,           destructive chemistry.
HOBr, BrNO3 (a.k.a. BrONO2 ), Br2 , HCl, Cl, ClO, OClO,
HOCl, ClNO3 , Cl2 , BrCl, Hg, HgBr, HgCl, HgBr2 , HgCl2 ,          2.2.2   Model settings
and HgBrCl. We exclude BrNO2 as previous studies have
found it to be a negligible component (Roberts et al., 2014;       The total area modelled, at 30 km horizontal resolution, is de-
Rüdiger et al., 2021). These species are also incorporated into    picted in Fig. 3a. Also shown are the extents of the progres-
the dry- and wet-deposition schemes and the FastJ photoly-         sively nested domains, each modelled with grid dimension 3
sis scheme (Wild et al., 2000). The rates of heterogeneous         times smaller than their parent. These domains are two-way
reactions involving HOBr, BrNO3 , and ClNO3 on volcanic            nested in exchanging meteorological, chemical, and physi-
aerosols are calculated online accounting for the wet sur-         cal information between them. Here we focus on the near-
face area of aerosol and gas-phase diffusion limitations as        downwind plume processing (up to about 90 min). Therefore
described by Marelle et al. (2021). The products of HOBr re-       all the figures and results presented in this study are from the
active uptake are partitioned between Br2 and BrCl (i.e. net       d04 nest (Fig. 3b), which models an 88 km × 134 km area

Atmos. Chem. Phys., 21, 12413–12441, 2021                                          https://doi.org/10.5194/acp-21-12413-2021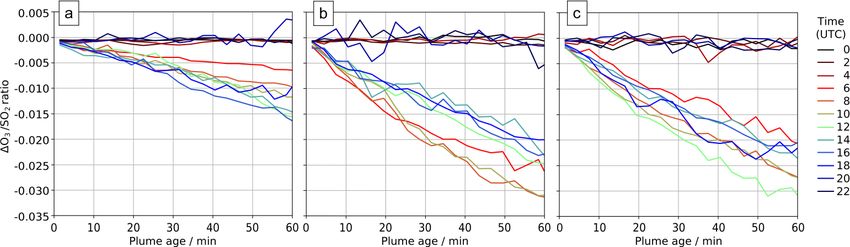
L. Surl et al.: Observation and modelling of ozone-destructive halogen chemistry                                                 12419

Figure 3. (a) The WCV model area; d02, d03, and d04 are progressively nested domains with two-way nesting. (b) Terrain elevation in d04.

around the east coast of Sicily with a horizontal spatial reso-       the aircraft at the same distance from the source. We assume
lution of 1.1 km. The model has 50 vertical layers, extending         these observed maxima correspond to transects which cross
up to 50 hPa.                                                         or come close to the core of the plume. A total of 40 kg s−1
   The model was initialized on 29 July 2012 at 00:00 UTC             also falls mid-way within the normal range of measured SO2
and ran for 4 d, therefore covering all of the days of the air-       fluxes 41 ± 30 kg s−1 for Etna’s activity during non-eruptive
craft measurements. The first 24 h is considered spin-up; re-         (passive degassing) periods (Salerno et al., 2009). A volcanic
sults are presented from > 24 h onwards.                              H2 O flux is set to be 15 times greater (in terms of number of
   The volcano was considered to be a point source of gas and         molecules) than the SO2 flux following Aiuppa et al. (2008).
aerosol, emitting at a constant flux rate throughout the simu-        Being effectively inert chemically, CO2 and its emissions are
lation period. Although Mount Etna has several active vents           ignored in the model.
(Northeast Crater, Bocca Nova, Voragine, Southeast Crater)               Mount Etna’s plume also contains sulfate-rich particles
at the volcano summit, the maximum horizontal resolution              whose presence in the young plume at the volcano summit
of the model is not sufficient to distinguish these. Emissions        (Martin et al., 2012; Roberts et al., 2018) indicates that they
are released into a single grid cell at 37.751◦ N, 14.995◦ S,         are formed early on, possibly in the vent, well below the
and 3300 m a.s.l., the location of the summit peak of Etna.           grid resolution of the model. These “at-source” aerosols are
This altitude does not correspond to the lowest model level           treated as primary aerosols. They are included in the model
at this location but rather a few levels above it because, even       by setting a volcanic aerosol emission flux which is derived
at the maximum model resolution, the sub-grid topography              from the reported near-summit sulfate / SO2 mass ratio of
of the Etna volcano is smoothed out in the model grid box.            0.03 (Roberts et al., 2018). All of this aerosol is taken to be
For example, at the 1.1 km resolution, the ground altitude of         sulfate with a size distribution across the eight MOSAIC size
the Etna grid box is 3088 m. The lower the model resolution           bins following that of Roberts et al. (2018), with an extrapo-
is, the more potent the smoothing of sub-grid terrain features        lation made for the smallest bins. During the in situ measure-
is and hence the greater this discrepancy is.                         ments of Surl et al. (2015) made on 30 June and 1 August
   Modelled emissions of SO2 were set to 40 kg s−1 . This             the plume was observed to be ash-free. Therefore no ash was
flux was estimated by adjusting initial estimates according           included in this modelling.
to comparisons between outputs from preliminary runs and                 Chlorine and bromine emission fluxes are specified based
observed SO2 mixing ratios. A 40 kg s−1 flux results in SO2           on the observed summit chlorine-to-bromine ratio, HCl-to-
mixing ratios within the centre of the modelled plume being           SO2 ratio, and the SO2 flux specified above. We rely on a
similar to the maximum SO2 mixing ratios observed from                comprehensive compositional analysis undertaken between

https://doi.org/10.5194/acp-21-12413-2021                                            Atmos. Chem. Phys., 21, 12413–12441, 2021
12420                                     L. Surl et al.: Observation and modelling of ozone-destructive halogen chemistry

June 2010–June 2012 by Wittmer et al. (2014). The chlorine-        Table 1. Volcanic emission fluxes in the main model run.
to-bromine ratio was fixed to 300 by mass (683 by mole),
which is an average calculated for the compositions of Bocca                                             Ratio to SO2
                                                                          Species    Flux (s−1 )
Nova and Northeast Crater reported by Wittmer et al. (2014).                                              Mass          Molar
The HCl-to-SO2 ratio was set to 0.4 mol/mol, which is about
mid-way in the range of ratios (0.29 to 0.56) for these craters.          SO2        40 kg                    1             1
                                                                          Br         7.6 g         1.89 × 10⁻⁴    1.5 × 10⁻⁴
   As stated in the introduction, volcanic gases are believed
                                                                          HBr        23 g          5.66 × 10⁻⁴    4.5 × 10⁻⁴
to react at high temperatures immediately following their re-
                                                                          OH         11 g           2.7 × 10⁻⁴    1.0 × 10⁻³
lease in the vent and into the atmosphere, generating radicals,
                                                                          NO         8.4 g          2.1 × 10⁻⁴    4.5 × 10⁻⁴
notably HOx and some halogen radicals. These radicals – as
                                                                          Hg         0.9 g          2.4 × 10⁻⁵    7.8 × 10⁻⁶
well as the primary aerosols – subsequently initiate the onset
                                                                          Aerosol    1.2 kg                0.03          0.02
of the bromine cycling in the cooled plume (Fig. 1). A repre-
sentation of the high-temperature radicals is therefore needed
for the WCV volcanic input. Thermodynamic models have
been used previously to represent this high-temperature “ef-       2000). Chemical information is sourced from CAM-CHEM
fective source region” (Bobrowski et al., 2007), but their as-     (Buchholz et al., 2019; Emmons et al., 2020) and applied us-
sumption of chemical equilibrium is not considered reliable,       ing the MOZBC utility. Since mercury, bromine, and chlo-
whereas recently developed kinetic models do not yet include       rine species other than HCl were absent from this CAM-
halogens (see Roberts et al., 2019). Here we choose a sim-         CHEM data, we set their initial and boundary values to zero.
pler approach by, in the main run, partitioning the bromine           As well as the main model run detailed above, several
emission flux into hydrogen halide and radicals, with 75 %         other model runs were made with varying emissions (Ta-
of bromine emitted as HBr and 25 % as Br radicals, and by          ble 2). These include a model run with no volcanic emissions
including an HOx emission. This bromine partitioning fol-          (novolc). Differences between novolc and the other runs are
lows previous thermodynamic modelling estimates (Roberts           used to quantify volcanic impacts. Sensitivity runs were iden-
et al., 2014). Emissions of volcanic HOx are highly uncer-         tical to the main run except for the perturbations to the vol-
tain; there exist order-of-magnitude differences between ki-       canic emissions listed in Table 2. The noHighT run excludes
netic and thermodynamic model predictions and in the speci-        all species expected to be generated in the high-temperature
ation between OH and HO2 (Roberts et al., 2019). Here, we          volatile-air mix of the first few seconds after volcanic emis-
define the volcanic HOx emission by setting an OH / SO2            sion and therefore includes only H2 O, SO2 , HCl, and HBr
molar ratio of 0.001 (between reported thermodynamic and           (all bromine as HBr) as well as primary sulfate.
kinetic model ranges). The immediate reaction of OH with
SO2 in WCV will generate HO2 and some additional sul-
fate. Whilst all volcanic chlorine is emitted as HCl in the        3   Aircraft observations quantifying ozone destruction
model, the reaction with volcanic OH will also quickly gen-            in the plume
erate some Cl radicals.
   Although there are open questions regarding the kinetics        The encounter-finding algorithm described in Sect. 2.1 yields
of high-temperature NO generation in the first few seconds         19 major plume encounters, 11 on 31 July and 8 on 1 August
of plume evolution (Martin et al., 2012), we chose to in-          2012. Only minor plume encounters occurred on 30 July. The
clude these emissions to assess their possible effect. We use      locations of these major encounters are highlighted in Fig. 2.
an NO / SO2 molar emission ratio of 4.5 × 10⁻⁴ , which is of       Plots of O3 vs. SO2 for these encounters are shown in Fig. 4
the order typically produced by high-temperature thermody-         for 31 July and Fig. 5 for 1 August. These data are also sum-
namic modelling of the early plume–air mix (cf. 6.6 × 10⁻⁴         marized in Table 5.
used in Roberts et al., 2014).                                        For the majority of encounters, there is a clear anti-
   Although the aircraft campaign did not find a detectable        correlation between O3 and SO2 , with linear fits yielding
mercury signal for the plume (Weigelt et al., 2016a), we           negative gradients for most encounters, which is consistent
include a small mercury emission so as to investigate this         with continuous O3 destruction during the plume evolution.
mechanism. We use a general volcanic emission ratio of             In several plots, the anti-correlation between SO2 and O3
7.8×10⁻⁶ mol Hg per mol SO2 from Bagnato et al. (2014), a          variations is evident from aligned data points corresponding
quantity too small to significantly interfere with other chem-     to consecutive observations. All encounters span ranges of
ical systems. All of this mercury is emitted as Hg(0).             several kilometres, in which the background O3 is liable to
   We use external data for model forcing at the boundaries        vary. We believe this is a significant secondary source of vari-
of the outermost domain and for the initial conditions of          ations in O3 in these encounters. Mixing of the plume with
the model. Meteorological information is sourced from the          external air with varying levels of O3 would generate ran-
NCEP FNL Operational Model Global Tropospheric Anal-               dom fluctuations in the data and alter the O3 / SO2 gradient
yses (National Centers for Environmental Prediction et al.,        and its correlation with the plume density. This is the most

Atmos. Chem. Phys., 21, 12413–12441, 2021                                           https://doi.org/10.5194/acp-21-12413-2021
L. Surl et al.: Observation and modelling of ozone-destructive halogen chemistry                                      12421

Figure 4. Measurements of SO2 and O3 mixing ratios for the 11 major plume encounters on 31 July 2012.

https://doi.org/10.5194/acp-21-12413-2021                                          Atmos. Chem. Phys., 21, 12413–12441, 2021
12422                                        L. Surl et al.: Observation and modelling of ozone-destructive halogen chemistry

Table 2. Volcanic emission rates of species in the model runs of this study relative to those of main and speciation of bromine at emission;
n/a stands for not applicable.

                                                      Relative volcanic emission rate
                         Run                                                                               HBr : Br
                                      SO2     H2 O   Aerosol     Brtotal       HCl    OH     NO      Hg
                         main            1       1          1         1           1      1      1      1    75 : 25
                         novolc          0       0          0         0           0      0      0      0        n/a
                         noHighT         1       1          1         1           1      0      0      1    100 : 0
                         mag33        0.33    0.33       0.33      0.33        0.33   0.33   0.33   0.33    75 : 25
                         mag150        1.5     1.5        1.5       1.5         1.5    1.5    1.5    1.5    75 : 25
                         hal00           1       1          1         0           0      1      1      1        n/a
                         hal33           1       1          1      0.33        0.33      1      1      1    75 : 25
                         hal150          1       1          1       1.5         1.5      1      1      1    75 : 25
                         oth33        0.33    0.33       0.33         1           1   0.33   0.33   0.33    75 : 25
                         oth150        1.5     1.5        1.5         1           1    1.5    1.5    1.5    75 : 25
                         br50_50         1       1          1         1           1      1      1      1    50 : 50
                         br90_10         1       1          1         1           1      1      1      1    90 : 10
                         br95_5          1       1          1         1           1      1      1      1     95 : 5
                         br100_0         1       1          1         1           1      1      1      1    100 : 0
                         NO_00           1       1          1         1           1      1      0      1    75 : 25
                         OH_25           1       1          1         1           1   0.25      0      1    100 : 0
                         OH_10           1       1          1         1           1    0.1      0      1    100 : 0

likely cause for the apparent curvatures when plotting some                each plume encounter as an estimate for background ozone
series of consecutive observations. In the case of encounters              for all data points within that encounter. The output from this
10 and 12, this secondary source of variation obscures the                 analysis across the whole dataset was too noisy to discern an
primary effect producing slightly positive gradients.                      overall trend.
   These observational data show that ozone is depleted                       The observed depletion of ozone in the Mount Etna
within the plume, and this depletion is proportional to the                plume is consistent with ozone-destructive halogen chem-
intensity of the plume as quantified by SO2 measurements.                  istry in volcanic plumes (Gutmann et al., 2018, and refer-
   Weighting by the duration of each encounter and their                   ences therein). Halogens were not measured by the aircraft,
R 2 values, the average O3 vs. SO2 gradient for the plume                  but ground-based remote sensing confirms the presence of
encounters is −0.018 molec. molec.−1 , and the average dis-                volcanic BrO in the plume during July–August 2012 (Surl
tance from the source is 14 km. Assuming that ozone destruc-               et al., 2015).
tion is a continuous process and that, at distance zero, ozone                The following section presents the results of 3D high-
destruction is zero, these values can be used to quantify the              resolution WCV model simulations, focusing on the ozone-
rate of ozone destruction as a ratio of SO2 per kilometre trav-            destructive halogen chemistry in Mount Etna plumes during
elled; the resulting value is 0.0015 molec. molec.−1 km−1 .                the 2012 aircraft campaign. The model is used to quantify the
This could be converted to a destruction-per-second value by               ozone depletion and attribute it to specific halogen reactions
dividing by wind speed. No wind speed data were collected                  and to investigate additional impacts of volcanic plume halo-
during the flights, so to do this we inspect the meteorologi-              gen chemistry on atmospheric HOx , NOxy , and mercury. Ob-
cal output from the model, which yields for both days a wind               servational data and the model outputs are compared in Sec-
speed for the plume of approximately 9 m s−1 at the time of                tion 4.4.2, where parameters relating to the observed plume
the flights. Using this value yields a rate with respect to time           encounters and the linear regressions applied to them are also
of −1.3 × 10⁻⁵ molec. molec.−1 s−1 . Interestingly, this rate              tabulated (Table 5) along with model data.
is very close to a value of −1.0 × 10⁻⁵ molec. molec.−1 s−1
derived from in situ measurements made within 500 m of the
vents on 27–30 July 2012 (Surl et al., 2015), supporting the
theory of a continuous process beginning from no ozone de-                 4    Modelling of the atmospheric chemistry of Mount
pletion at the source.                                                          Etna’s plume
   We note that an analysis to evaluate the trend in ozone
depletion with respect to distance within the dataset yielded a            All results discussed in this section are from the main model
null result: ozone-depletion-to-SO2 ratios were calculated for             run unless otherwise stated. We have paid particular attention
each in-encounter data point by using the y-axis intersect of              to the results relating to 08:00 UTC on 30 July 2012, 31 July,

Atmos. Chem. Phys., 21, 12413–12441, 2021                                                    https://doi.org/10.5194/acp-21-12413-2021
L. Surl et al.: Observation and modelling of ozone-destructive halogen chemistry 12423
Figure 5. Measurements of SO2 and O3 mixing ratios for the eight major plume encounters on 1 August 2012.
and 1 August 2012 as the aircraft was sampling the plume at from the source (Figs. 6, 14). The CBMZ-MOSAIC reaction
approximately this time. scheme includes gas-phase oxidation of SO2 by OH, gener-
In several cases we use plume age as a variable. This is ating secondary sulfate aerosol. We note that the model does
determined from the tracers, as discussed in the “Methods” not contain other potentially significant SO2 loss mecha-
section. nisms which occur in the liquid phase (Galeazzo et al., 2018).
The importance of these liquid-phase pathways is likely di-
4.1 SO2 , aerosol, and HOx minished in a passively degassing plume that does not form
a water cloud, which is the case studied here. Nevertheless,
Before investigating the halogen chemistry of the volcano the results of this section concerning SO2 oxidation should
plume, we first look at SO2 . The volcano emits 40 kg of be interpreted with caution.
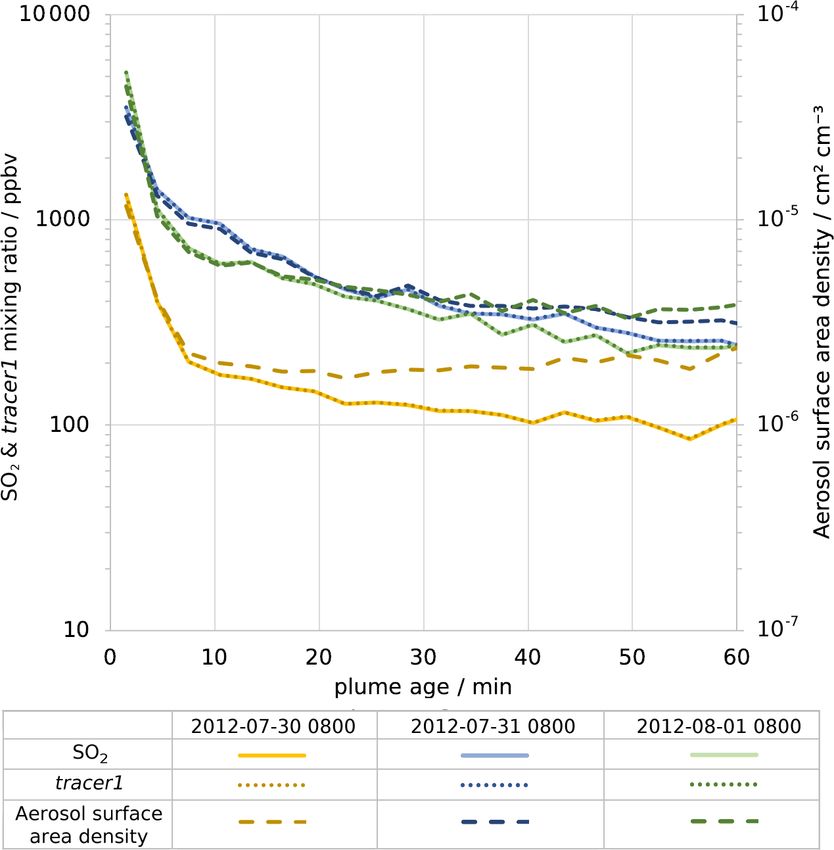
SO2 per second throughout the simulation. This produces a For plumes aged less than an hour, the modelled mixing
plume that travels downwind, dispersing (i.e. diluting) during ratios of SO2 and tracer1 in the plume are nearly identical
transport; SO2 mixing ratios decrease with time and distance (Fig. 6), indicating that SO2 losses via OH oxidation in this
https://doi.org/10.5194/acp-21-12413-2021 Atmos. Chem. Phys., 21, 12413–12441, 202112424 L. Surl et al.: Observation and modelling of ozone-destructive halogen chemistry
tio continues to increase with plume age due to ambient-
temperature oxidation by OH mixing in from background air.
There are similar trends for the ratio of aerosol surface
area to SO2 (Fig. 7b). The increase in this ratio shows that
the secondary aerosol formation notably increases the sur-
face area available for HOBr uptake. When considered in ab-
solute terms, this secondary aerosol formation partly offsets
the decline in aerosol surface area density caused by plume
dispersion. This can be seen in Fig. 6, where the aerosol sur-
face area density declines at a slower rate than SO2 mixing
ratio. For 30 July the aerosol surface area density is approx-
imately constant after 10 min, indicating that the secondary
formation compensates for the dispersion in this regard.
Although the oxidation of SO2 is not significant over these
timescales with regard to SO2 mixing ratios, the oxidation
that does occur is significant for in-plume aerosol and HOx
levels. There is a substantial depletion of OH within the
plume and a moderate depletion of HO2 (Fig. 8); for plumes
aged around 30 min, OH and HO2 levels are depleted by
around 85 % and 40 %, respectively (Table 3). This occurs
despite the modelled volcano being a source of OH. This
emitted OH is consumed very quickly. This result is consis-
Figure 6. Modelled average in-plume mixing ratios of, on left axis,
tent with the model findings for the Ambrym plume of Jour-
SO2 (solid lines) and tracer1 (dotted lines) and, on right axis, den-
sity of aerosol surface area (dashed lines). Values are plotted against dain et al. (2016), who modelled total OH loss occurring in
plume age for 08:00 UTC for 30 July 2012 (yellow), 31 July 2012 the core of that plume.
(blue), and 1 August 2012 (green). Note that both y axes are loga- Volcanic halogens and SO2 compete for reaction with the
rithmic. available OH in the model. The abundance of SO2 in the
plume results in substantial conversion of OH to HO2 via
the SO2 + OH reaction. This starts a chain of reactions with
period are negligible. This gives confidence to the use of SO2 short-lived intermediate species that is simplified to a single
as a plume tracer. SO2 + OH → HO2 + H2 SO4 reaction in the model (Bekki,
The average mixing ratio of SO2 in the plume of 30 July 1995; Galeazzo et al., 2018). Volcanic HCl is also abundant
is, for plume ages less than an hour, typically around a third and removes OH by the HCl + OH → H2 O + Cl reaction. A
of the equivalent parts of the plume on the other two dates similar reaction of HBr also occurs, but HBr is much less
(Fig. 6), although the declining trend of SO2 mixing ratios abundant. HO2 is consumed as part of the bromine cycle in
with age is similar. This difference is due to the fact that the BrO + HO2 → HOBr reaction.
the wind speed on 30 July is much higher than on the other Table 3 compares the weighted average mixing ratios of
dates: the average wind speeds in the < 60 min old plume HOx species and the instantaneous SO2 lifetime within the
at 08:00 UTC are 19, 9, and 9 m s−1 for 30 July, 31 July, plume for the main run, the halogen-free hal00 run, and the
and 1 August, respectively. Therefore, volcanic emissions equivalent model cells in the plume-free novolc run. Com-
are released into a greater volume of air on 30 July, yield- paring these, it can be seen that the non-halogen components
ing lower concentrations of volcanic volatiles and volcanic of the plume are sufficient to cause substantial OH depletion,
aerosol within the plume. As a consequence, the aerosol sur- whilst halogens are the cause of HO2 depletion; the hal00
face area density within the plume on 30 July is lower, though plume actually has greater HO2 compared to the novolc case.
secondary aerosol production reduces this difference as the Compared to the novolc case, the instantaneous lifetime
plume evolves (Fig. 6). of SO2 with respect to oxidation by OH is substantially in-
The volcano is a direct source of aerosols, with a flux of creased in the halogen-free plume (hal00) due to the reduced
1.2 kg of sulfate per second in the model. This is important OH concentrations, which are caused by high SO2 levels.
for the halogen chemistry as it provides a surface for HOBr The addition of halogens to the hal00 scenario, i.e. moving to
uptake, enabling heterogeneous reactions. Figure 7a shows the main case run, further suppresses OH and hence reduces
that, shortly after emission, the in-plume ratio of sulfate to even more SO2 oxidation, further increasing its lifetime. For
SO2 is slightly above the emission ratio of 0.03 because of the plume part tabulated in Table 3, the instantaneous life-
the early oxidation of SO2 by volcanogenic OH (released in times of SO2 for the hal00 and main model runs are, respec-
the emission grid box to account for high-temperature radi- tively, 4.5 and 7.4 times that of the hal00 run. Slower SO2
cal production), which produces additional sulfate. This ra- oxidation results in slower secondary aerosol production, as
Atmos. Chem. Phys., 21, 12413–12441, 2021 https://doi.org/10.5194/acp-21-12413-2021L. Surl et al.: Observation and modelling of ozone-destructive halogen chemistry 12425
Figure 7. (a) Mass ratio of sulfate aerosol to SO2 within the plume and (b) ratio of the total in-plume aerosol surface area to SO2 concentra-
tion, both plotted against plume age for 08:00 UTC for 30 July 2012 (yellow), 31 July 2012 (blue), and 1 August 2012 (green). Solid lines
are for the main model run; dotted lines are for the hal00 run; see Table 2.
Figure 8. Modelled mixing ratios of (a) OH and (b) HO2 at 3300 m a.s.l. at 08:00 UTC on 1 August 2012.
seen in terms of both mass and surface area (Fig. 7). This re- Table 3. In-plume concentrations of HO2 and OH and instantaneous
sult for a tropospheric volcanic plume mirrors findings from lifetime of SO2 with respect to oxidation by OH for parts of the
a recent study of a stratospheric volcanic cloud (Lurton et al., plume aged 30 ± 5 min at 08:00 UTC on 1 August 2012 for three
2018). model runs. Figures for the novolc use the same grid cell weighting
Whilst a detailed analysis of the aerosol microphysics and as the main model run.
climate impacts of volcanic aerosols lies beyond the scope of
Model run HO2 OH SO2 lifetime
this study, our simulations show substantial differences in the
(molec. cm−3 ) (molec. cm−3 ) (h)
plume sulfate particle surface area density for WCV model
simulations with and without volcanic halogen emissions. As novolc 2.6 × 10⁸ 5.8 × 10⁶ 53
plume halogen chemistry exerts an important influence on hal00 4.6 × 10⁸ 1.4 × 10⁶ 240
the oxidation rate of volcanic SO2 and associated formation main 1.6 × 10⁸ 0.9 × 10⁶ 390
of secondary aerosol, our results suggest that models simu-
https://doi.org/10.5194/acp-21-12413-2021 Atmos. Chem. Phys., 21, 12413–12441, 202112426 L. Surl et al.: Observation and modelling of ozone-destructive halogen chemistry
lating chemistry–climate impacts of volcanic sulfur should Our model study identifies how variations in time of day
not ignore the chemistry of volcanic halogens. and plume intensity (which is controlled by wind speed in
this constant-emission case) impact BrO / SO2 . These may
4.2 Bromine speciation and BrO / SO2 ratio present additional complications for the interpretation of
BrO / SO2 ratios observed in passively degassing volcanic
In the main model run, bromine is emitted from the volcano plumes. Variations in BrO / SO2 are often evaluated with re-
as HBr and Br in a 3 : 1 ratio. During daylight this is rapidly spect to distance from a volcano. We note that the wind speed
converted to other forms, including BrO. Figure 9 shows how has a “double effect”. First, faster winds give the impres-
the forms which this bromine takes vary between parts of the sion that the chemistry evolves more slowly as a function of
plume at different ages at 08:00 UTC on 30 July, 31 July, and distance downwind because the plume moves further from
1 August. In this model output, HOBr becomes the dominant the source in a given time. Second, all other factors being
form of bromine within the plume, followed by BrO. The equal, the along-plume dilution is expected to be stronger at
fraction of BrO increases over approximately the first 20 min higher wind velocities, affecting the in-plume chemistry and
before reaching an approximately stable fraction. A signifi- bromine speciation through the influx of background ozone-
cant amount of Br2 is formed shortly after emission, but this rich air.
fraction declines, with BrCl being the larger fraction of the
two halogen dimers. A significant reservoir of BrNO3 that 4.2.1 Comparison to observed BrO / SO2 ratios
forms shortly after emission declines slowly over time.
There are significant quantitative differences between the No measurements of in-plume BrO / SO2 column ratio were
bromine evolution on these three dates, although the trends made as part of this study. However the DOAS-measured
are similar. These differences occur despite the emission pa- BrO / SO2 columns reported in Surl et al. (2015) span from
rameters being the same for all days. Compared to the other 24 July 2012 to 2 August 2012, which includes our time pe-
two dates, HBr and BrNO3 persist in the plume for much riod. These observations were made between 5 and 17 km
longer on 30 July. The balance between HOBr and BrO is from the volcano at approximately the middle of the day. Fig-
more greatly tilted towards the former on that day because ure 11 plots these observations alongside the modelling data
the in-plume aerosol surface area density is lower on 30 July for 12:00 UTC each day. These observed ratios, ranging from
(see Sect. 4.1 and Fig. 6), reducing the rate of heterogeneous 0.6–1.3 × 10⁻⁴ , are at about half of the equivalent modelled
reactions that consume HBr, BrNO3 , and HOBr. Addition- ratios for 31 July and 1 August and are comparable, although
ally, the reaction of BrO with background HO2 to form HOBr still slightly lower on average, to those modelled for 30 July,
is suppressed under more concentrated plume conditions due where the initial rise in BrO / SO2 ratios occurs over the first
to the depletion of HO2 discussed in Sect. 4.1. 15–20 km.
Although the bromine speciation appears roughly stable Although not simultaneous with the time span of this
after approximately 30 min of evolution, this does not indi- study, BrO / SO2 measurements made close to the vents the
cate that no further chemistry is occurring; bromine is instead following month (11 September 2012–26 September 2012)
continually cycled between forms. This is shown in Fig. S3, reported by Gliß et al. (2015) are also a relevant compari-
which depicts the rates of transfers between bromine species. son. BrO / SO2 ratios were found rising rapidly with travel
“Stability” indicates a state where the chemical formation time from the vent, reaching about 1.3 × 10⁻⁴ at about 150 s
and loss of each species are approximately balanced, i.e. a travel time and then remaining at this level. This rapid rise
steady state. and higher ratio have better agreement with the observations
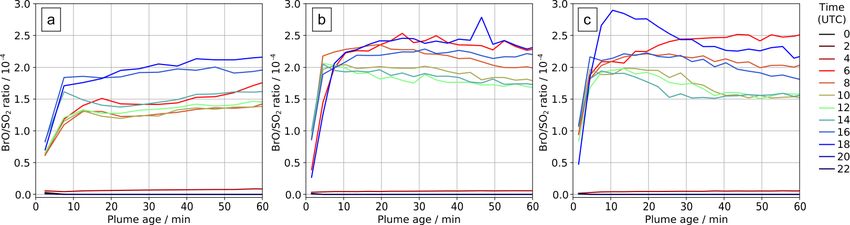
The ratio of total bromine and SO2 is mostly invariant of 31 July and 1 August.
in the plume; therefore the variations in bromine speciation More generally, the shape of the modelled BrO / SO2 ver-
with plume age yield variations in in-plume BrO / SO2 ra- sus distance–time trend seen in Figs. 10, 11, and 13a – of
tios. There is an initial rise in BrO / SO2 , followed by a an initial rise followed by a steady value – is in agreement
small decrease in some cases, and then a plateau. This pattern with the general trend observed for Etna (Fig. 11) and other
varies with time of day, as shown in Fig. 10. Sunrise is shortly volcanoes (Gutmann et al., 2018).
after 04:00 UTC and sunset shortly after 18:00 UTC. Negligi-
ble BrO is formed in the model plume at night. We find on all 4.2.2 Importance of high-temperature volcanic
three dates that BrO / SO2 ratios are generally greater in the products
morning and evening than during the middle of the day. This
occurs because BrO is more rapidly converted to HOBr in the In the main model run, Br and OH radicals are included
middle of the day, when atmospheric HO2 is at a maximum. in the model volcano emission – representing their high-
Although moderate in magnitude, this phenomenon may be temperature generation in the “effective source region” (see
significant when comparing spectroscopic columns at differ- Sect. 2.2.2). The importance of these in the autocatalytic pro-
ent times, including datasets from low-earth-orbit satellites cesses of the bromine explosion can be seen by inspecting the
with overpasses at different local times. output from runs in which the emission strengths of differ-
Atmos. Chem. Phys., 21, 12413–12441, 2021 https://doi.org/10.5194/acp-21-12413-2021You can also read