Protein co expression network based profiles revealed from laser microdissected cancerous cells of lung squamous cell carcinomas
←
→
Page content transcription
If your browser does not render page correctly, please read the page content below
www.nature.com/scientificreports
OPEN Protein co‑expression
network‑based profiles revealed
from laser‑microdissected
cancerous cells of lung
squamous‑cell carcinomas
Toshihide Nishimura1,2,9*, Kiyonaga Fujii1,2,3,9, Haruhiko Nakamura1,2,9, Saeko Naruki4,9,
Hiroki Sakai2, Hiroyuki Kimura2, Tomoyuki Miyazawa2, Masayuki Takagi4, Naoki Furuya5,
Gyorgy Marko‑Varga6, Harubumi Kato7,8 & Hisashi Saji2
No therapeutic targets have been identified for lung squamous cell cancer (SqCC) which is the second
most prevalent lung cancer because its molecular profiles remain unclear. This study aimed to unveil
disease-related protein networks by proteomic and bioinformatic assessment of laser-microdissected
cancerous cells from seven SqCCs compared with eight representative lung adenocarcinomas.
We identified three network modules significant to lung SqCC using weighted gene co-expression
network analysis. One module was intrinsically annotated to keratinization and cell proliferation of
SqCC, accompanied by hypoxia-induced aerobic glycolysis, in which key regulators were activated
(HIF1A, ROCK2, EFNA1-5) and highly suppressed (KMT2D). The other two modules were significant
for translational initiation, nonsense-mediated mRNA decay, inhibited cell death, and interestingly,
eIF2 signaling, in which key regulators, MYC and MLXIPL, were highly activated. Another key
regulator LARP1, the master regulator in cap-dependent translation, was highly suppressed although
upregulations were observed for hub proteins including EIF3F and LARP1 targeted ribosomal proteins,
among which PS25 is the key ribosomal protein in IRES-dependent translation. Our results suggest
an underlying progression mechanism largely caused by switching to the cap-independent, IRES-
dependent translation of mRNA subsets encoding oncogenic proteins. Our findings may help to
develop therapeutic strategies to improve patient outcomes.
Non-small-cell carcinoma (NSCLC) is a common cause of death g lobally1. Lung squamous cell carcinoma (SqCC)
accounts for approximately 30% of N SCLCs2 and is the second most prevalent type of lung cancer. SqCC tumors
usually occur in the central part of the lung or one of the main airways, the bronchus, and are more strongly
associated with smoking than any other type of NSCLC. Currently, patients with SqCC are treated with various
anticancer drugs, such as molecularly targeted drugs, immune checkpoint inhibitors, cytotoxic chemotherapy,
and combination therapies of these drugs. Ninety-seven percent of cases resistant to chemotherapy were attrib-
utable to s moking3 and, recently, next-generation sequencing has been used to easily detect some oncogenic
driver mutations from small biopsy samples in clinical practice4. However, most cases of oncogenic-driven lung
cancer are non-squamous NSCLC.
1
Department of Translational Medicine Informatics, St. Marianna University School of Medicine, Kawasaki,
Kanagawa 216‑8511, Japan. 2Department of Chest Surgery, St. Marianna University School of Medicine,
Kawasaki, Kanagawa 216‑8511, Japan. 3Laboratory of Analytical Chemistry, Daiichi University of Pharmacy,
Fukuoka, Fukuoka 815‑8511, Japan. 4Department of Pathology, St. Marianna University Hospital, Kawasaki,
Kanagawa 216‑8511, Japan. 5Division of Respiratory Medicine, Department of Internal Medicine, St. Marianna
University School of Medicine, Kawasaki, Kanagawa 216‑8511, Japan. 6Clinical Protein Science & Imaging,
Biomedical Centre, Department of Biomedical Engineering, Lund University, BMC D13, 221 84 Lund,
Sweden. 7Tokyo Medical University, Tokyo 160‑0023, Japan. 8International University of Health and Welfare,
Tokyo 107‑8402, Japan. 9These authors contributed equally: Toshihide Nishimura, Kiyonaga Fujii, Haruhiko
Nakamura and Saeko Naruki. *email: t-nisimura@marianna-u.ac.jp
Scientific Reports | (2021) 11:20209 | https://doi.org/10.1038/s41598-021-99695-x 1
Vol.:(0123456789)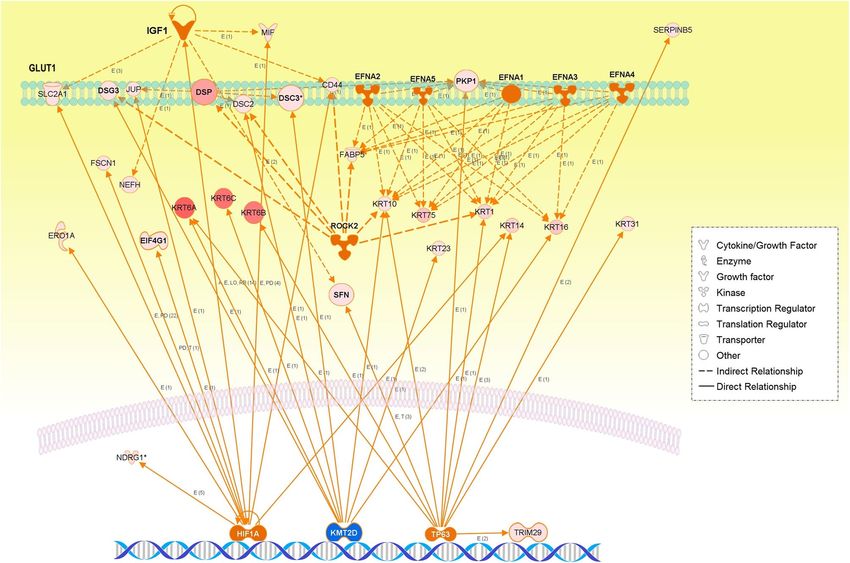
www.nature.com/scientificreports/
On the other hand, potentially actionable oncogenic alterations have been identified in lung SqCC such as
fibroblast growth factor receptor 1 (FGFR1) amplification, MET amplification, phosphatidylinositol-4,5-bis-
phosphate 3-kinase, catalytic subunit alpha (PIK3CA) mutation/amplification, and discoidin domain receptor
tyrosine kinase 2 (DDR2) m utation5–7. Although these oncogene aberrations might be useful as prognostic
factors, no molecular targeted therapy has been established for SqCC. Therefore, the overall survival of SqCC
is relatively shorter than that for non-squamous NSCLC. The molecular pathogenesis of SqCC has not been
understood, and no targeted therapeutics are available to address acutely unmet medical needs. To improve the
outcomes of SqCC patients, it is important to further understand the molecular profiles of SqCC to develop an
effective therapeutic strategy.
Notable advances in high-accuracy mass spectrometry (MS) have made clinical proteomics feasible, allow-
ing shotgun sequencing and the quantitative analysis of proteins expressed in clinical specimens. Proteome
data obtained by this MS-based protein sequencing can be used to identify key disease-related proteins and
therapeutic targets8. The main aim of this study was to identify profiles of protein co-expression networks
significantly associated with lung SqCC compared to lung papillary predominant adenocarcinoma (PPA), as
representative lung adenocarcinoma. We collected target cells of a certain type from sections of formalin-fixed
paraffin-embedded (FFPE) cancer tissues using the laser microdissection technique (Supplementary Fig. S1),
which characterized both SqCC and PPA tumors, followed by label-free spectral counting and identification-
based semiquantitative shotgun proteomic analysis. Weighted gene co-expression network analysis (WGCNA)9,
an unsupervised clustering method based on the correlation network of gene and/or protein expression, was
performed to identify data-driven protein co-expression networks.
Results and discussion
Proteome datasets of lung SqCCs and PPAs. MS-based proteomic analysis was conducted on the
FFPE tissue specimens comprising seven SqCCs and eight PPAs. These specimens were selected for their pre-
served condition, tumor area, and well-clarified pathological diagnosis (Table 1). Presurgical treatment was not
performed for any of these lung adenocarcinomas. Statistical t-test on the smoking Brinkmann index (BI) exhib-
ited that SqCC was significantly associated with the extent of smoking (p = 0.018).
A total of 2108 proteins were identified, among which 1281 (60.8%) were commonly expressed in the can-
cerous cells of both SqCC and PPA. One hundred and fifteen (5.5%) and 712 (33.8%) were unique to SqCC and
PPA, respectively (Fig. 1A).
We subjected 1396 and 1993 proteins expressed in SqCC and PPA, respectively, to gene ontology (GO) analy-
sis using the Protein Analysis Through Evolutionary Relationships (PANTHER) version 16.0 software program
(The Thomas Lab, University of Southern California, Los Angeles, CA, USA)10, and the results were notably
similar between the two subtypes (Fig. 1B). Common to both subtypes, proteins were abundantly associated
with the cellular process, localization, biological regulation, metabolic process, and response to stimulus in the
biological process (GO), and with the cytoskeletal protein, transporter, nucleic acid metabolism protein, protein-
binding activity modulator, translational protein, metabolite interconversion enzyme, protein modifying enzyme,
membrane traffic protein, chaperone, and hydrolase in the protein class (GO) (Fig. 1B).
Identification of data‑driven key protein network modules by WGCNA. We identified 30 protein
modules by constructing weighted protein co-expression networks, in which all the identified proteins were
clustered (Fig. 2A). The WGCNA analysis was performed with a soft threshold power of 25 selected for approxi-
mate scale-free topology, a minimum module size of 15, and a module detection sensitivity deepSplit of 4. The
traits used in the WGCNA analysis were the lung cancer subtypes, SqCC and PPA. Correlations were obtained
between resultant modules and traits to identify the protein modules significant to respective traits. A heatmap
of the eigen protein expressions and samples (Fig. 2B) and pairwise correlations between the modules regarding
eigen-protein expressions (Fig. 2C) are presented respectively.
We identified nine modules that showed high and/or moderate correlations (correlation: |r|> 0.5) and sta-
tistical significances (multiple testing correction with the Benjamini–Hochberg method: q-value < 0.05) with
clinical traits (Supplementary Fig. S2). We focused on the protein co-expression network modules significantly
associated with lung SqCC, which were found to be WM26, WM27, and WM28 (indicated by the red dashed
squares) whereas six modules, WM11, WM13, WM15, WM16, WM17, and WM18 (indicated by the blue dashed
squares), were significant to PPA.
Functional enrichment analysis of the PPI networks. The biological associations between the pro-
teins in each key protein network significant to SqCC were analyzed by mapping the network proteins in the
human protein–protein interaction (PPI) network and by pathway enrichment (Fig. 3).
We used the Search Tool for the Retrieval of Interacting Genes/Proteins (STRING) d atabase11 to generate
the PPI networks for the three WGCNA network modules associated with SqCC–WM26, WM27, and WM28,
and were reconstructed using the Cytoscape version 3.8.2 software program (Institute for Systems Biology,
Seattle, WA, USA). Top hub proteins were determined using the cytoHubba plugin by maximal clique cen-
trality (MCC)12. The three WGCNA modules, WM26 (r = 0.851, q = 0.0004), WM27 (r = 0.900, q = 7.34 × 10⁻⁵),
and WM28 (r = 0.884, q = 0.0001), were significantly correlated with SqCC, where eigen proteins and/or hub
proteins are indicated by blue and red dotted circles, respectively (Fig. 3). For the top three WGCNA modules
significant to PPA (WM15, WM16, and WM18), their protein networks and pathways enriched are presented
in Supplementary Fig. S3.
The three WGCNA protein network modules were significant to SqCC (Fig. 3A). The pathways enriched for
WM26 (Fig. 3B) included (1) biological process (GO): cornification, keratinization, and intermediate filament
Scientific Reports | (2021) 11:20209 | https://doi.org/10.1038/s41598-021-99695-x 2
Vol:.(1234567890)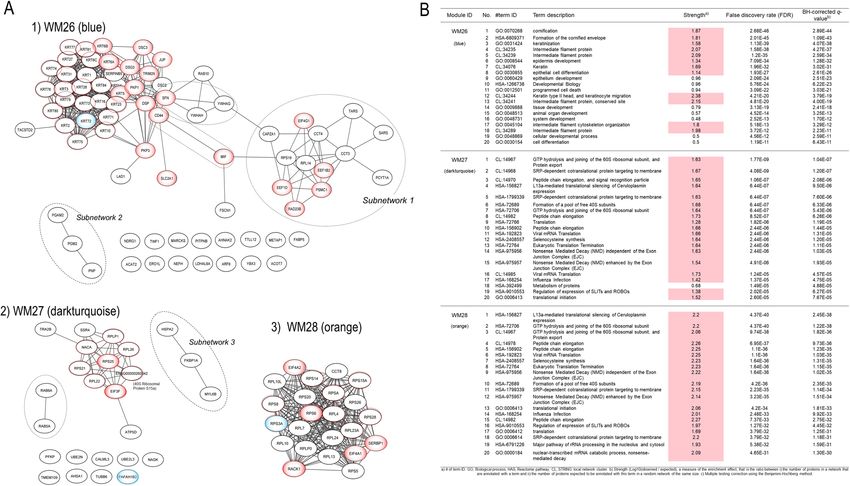
www.nature.com/scientificreports/
Clinical TNM
Tumor classification
Histological Surgical size on CT Clinical Smoking
Sample no. Age (years) Sex type method Location (mm) c-T c-N c-M stage index (BI) EGFR mutation status
(A) SqCC (n = 8)
Radical
SqCC_T60 76 M SqCC LS6 21 cT1b cN0 cM0 cIA 4400 Unknown
lobectomy
Radical
SqCC_T62 74 M SqCC LS6 20 cT1a cN0 cM0 cIA 1000 Unknown
lobectomy
Limited
SqCC_T63 56 M SqCC LS1 + 2 15 cT1a cN0 cM0 cIA 720 Unknown
resection
Radical
SqCC_T64 65 M SqCC RS4 19 cT1a cN0 cM0 cIA 900 Unknown
lobectomy
Radical
SqCC_T66 60 M SqCC LS6 21 cT1b cN0 cM0 cIA 800 Unknown
lobectomy
Radical
SqCC_T67 63 F SqCC RS3 12 cT1a cN0 cM0 cIA 840 Unknown
lobectomy
Radical
SqCC_T68 77 M SqCC LS4 20 cT1a cN0 cM0 cIA 500 Unknown
lobectomy
M (85.7%) / F (14.3%)
Aver-
67.3 ± 8.4 18.3 ± 3.5
age ± SD
(B) PPA (n = 7)
Radical exon 21 L858R,
PPA_T10 46 F PPA (AD) LS10 26 cT1b cN0 cM0 cIA 0 Positive
lobectomy exon20 T790M
Radical exon19 deletion
PPA_T11 61 F PPA (AD) LS9 16 cT1a cN0 cM0 cIA 0 Positive
lobectomy E746-A751del
exon19
Radical deletion E746-
PPA_T12 71 F PPA (AD) RS3 26 cT1b cN0 cM0 cIA 0 Positive
lobectomy A751del, S752I
(TCT → ATT)
Radical
PPA_T13 73 F PPA (AD) LS1 + 2 LS9 40, 22 T2a, T1b cN0 cM0 cIB 0 Negative
lobectomy
Radical
PPA_T14 63 F PPA (AD) RS8 13 cT1a cN0 cM0 cIA 0 Positive exon 21 L858R
lobectomy
Radical
PPA_T15 68 F PPA (AD) RS2 26 cT1b cN0 cM0 cIA 0 Positive L858R
lobectomy
Radical
PPA_T16 73 M PPA (AD) RS4 10 cT1a cN0 cM0 cIA 1060 Negative
lobectomy
Radical
PPA_T17 57 F PPA (AD) RS1 27 cT1b cN0 cM0 cIA 0 Negative
lobectomy
M (12.5%)/F (87.5%)
Aver-
64.0 ± 9.3 18.0 ± 9.9
age ± SD
Group comparison
p-value
0.244 0.234 0.018
(t-test)
Table 1. Clinicopathological information. SqCC squamous cell carcinoma, PPA papillary predominant
adenocarcinoma, AD adenocarcinoma, BI Brinkmann Index.
cytoskeleton organization; (2) Reactome pathways: formation of the cornified envelope; and (3) STRING local
network cluster: intermediate filament protein and keratin type II head and keratinocyte migration. Subnetwork
1 was significant to translation, in which key proteins and their associated pathways included EEF1B and EEF1D,
eukaryotic translation elongation; CCT3 and CCT4, chaperonin-mediated protein folding; EIF4G1, signaling
by insulin receptor; RAD23B, nucleotide excision repair; and PSMC1, cell cycle progression, apoptosis, or DNA
damage repair. Translation initiation factor eIF4G was overexpressed in S qCC13. Subnetwork 2 is significant to
the oxidoreduction coenzyme metabolic process and/or glycolysis and gluconeogenesis. The group of CD44
and MIF (macrophage migration inhibitory factor) suggests the negative regulation of DNA damage response
and intrinsic apoptotic signaling pathway by the p53 class mediator. The 14-3-3 proteins, SFN (stratifin, 14-3-3
sigma, or epithelial cell marker protein 1), YWHAG (14-3-3 gamma), and YWHAH (14-3-3 eta), are involved
in protein insertion into the mitochondrial membrane, which is involved in the apoptotic signaling pathway.
Niemira et al. conducted the RNA-seq based profiling of tissues obtained from 114 patients with NSCLC
who received tumor resection surgery, followed by bioinformatics analyses combined with WGCNA14. Their GO
enrichment analysis of genes differentially expressed in lung SqCC revealed deregulated processes of cornifica-
tion, epidermis development, keratinization, and epidermal cell d ifferentiation14, which is consistent with our
results. Pak et al. investigated the morphologic characteristics of lung SqCC and concluded that keratinization
in lung SqCC was associated with a poor prognosis and mostly with s moking15. The hub proteins in this module
were the series of intermediate filament proteins including the eigen-protein KRT72 (keratin 72). KRT5 (keratin
Scientific Reports | (2021) 11:20209 | https://doi.org/10.1038/s41598-021-99695-x 3
Vol.:(0123456789)
www.nature.com/scientificreports/
Figure 1. Venn map and hierarchical clustering of the identified proteins. (A) Venn map of the identified
proteins. (B) Gene ontology (GO) analysis of the identified proteins for SqCC and PPA. (1) Biological
process. 1, developmental process (GO:0032502); 2, multicellular organismal process (GO:0032501); 3,
cellular process (GO:0009987); 4, reproduction (GO:0000003); 5, localization (GO:0051179); 6, reproductive
process (GO:0022414); 7, multi-organism process (GO:0051704); 8, biological adhesion (GO:0022610); 9,
immune system process (GO:0002376); 10, biological regulation (GO:0065007); 11, growth (GO:0040007);
12, signalling (GO:0023052); 13, metabolic process (GO:0008152); 14, interspecies interaction between
organisms (GO:0044419); 15, response to stimulus (GO:0050896); 16, pigmentation (GO:0043473); 17,
biological phase (GO:0044848); 18, behavior (GO:0007610); 19, locomotion (GO:0040011). (2) Protein class.
1, extracellular matrix protein (PC00102); 2, cytoskeletal protein (PC00085); 3, transporter (PC00227); 4,
scaffold/adaptor protein (PC00226); 5, cell adhesion molecule (PC00069); 6, nucleic acid metabolism protein
(PC00171); 7, intercellular signal molecule (PC00207); 8, protein-binding activity modulator (PC00095); 9,
viral or transposable element protein (PC00237); 10, calcium-binding protein (PC00060); 11, gene-specific
transcriptional regulator (PC00264); 12, defense/immunity protein (PC00090); 13, translational protein
(PC00263); 14, metabolite interconversion enzyme (PC00262); 15, protein-modifying enzyme (PC00260);
16, chromatin/chromatin-binding, or -regulatory protein (PC00077); 17, transfer/carrier protein (PC00219);
18, membrane traffic protein (PC00150); 19, chaperone (PC00072); 20, cell junction protein (PC00070); 21,
structural protein (PC00211); 22, storage protein (PC00210); 23, transmembrane signal receptor (PC00197).
5), KRT6A (keratin 6A), KRT6B (keratin 6B), DSG3 (desmoglein 3), and TRIM29 (tripartite motif-containing
protein 29) are also highly connected proteins in this module, which were reported as potential biomarkers
for distinguishing between SqCC and lung a denocarcinoma16. DSG3, a member of seven transmembrane des-
mosomal cadherins, was upregulated in various SqCC tissues, and its expression level correlated with clinical
stages17. TRIM29, also known as the ataxia group D complementary gene (ATDC), is a transcriptional regulator
involved in cell proliferation, differentiation, infiltration, migration, and invasion18. Expressions of TRIM29 were
upregulated in numerous cancer types and were suggested to promote lung SqCC cell metastasis by regulating
the autophagic degradation of E-cadherin19.
The enriched pathways of the WM27 module included (1) biological process (GO): translational initiation;
(2) Reactome pathways: L13a-mediated translational silencing of ceruloplasmin expression, translation, and
nonsense-mediated decay (NMD) independent of the exon junction complex; and (3) STRING local cluster:
signal recognition particle-dependent cotranslational protein targeting the membrane, and peptide chain elonga-
tion (Fig. 3). Subnetwork 3 is significant for protein refolding, and the Ras-related proteins RAB5A and RAB6A
are involved in cytosolic transport. The eigen-protein PAFAH1B2 (platelet-activating factor acetylhydrolase IB
subunit alpha2, also known as the PAF-AH 30 kDa subunit) was overexpressed in some types of tumors including
lung cancer20. The transcription of PAFAH1B2 is directly initiated by HIF1α activated in a hypoxic environment,
and its overexpression induces epithelial–mesenchymal transition and subsequent aggressive p henotypes21. The
hub proteins included the ribosomal proteins—RPLP1, RPL26, RPS25, RPS21, and RPL22, which participate
in NMD, and EIF3F. Under cellular stress, translation initiation switches from cap-dependent translation to
alternative mechanisms such as internal ribosome entry site (IRES) initiation22. RPS25 is the key ribosomal
Scientific Reports | (2021) 11:20209 | https://doi.org/10.1038/s41598-021-99695-x 4
Vol:.(1234567890)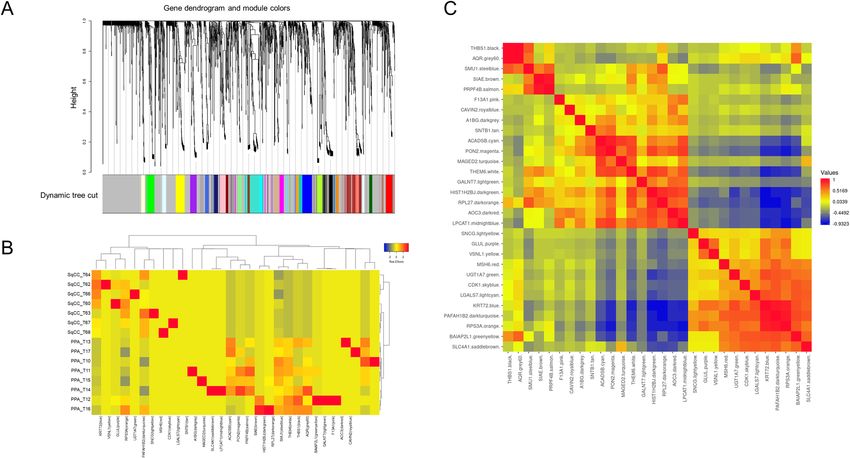
www.nature.com/scientificreports/
Figure 2. Protein network modules identified by weighted gene co-expression network analysis (WGCNA). (A)
Protein dendrogram obtained by clustering the dissimilarity based on consensus topological overlap with the
corresponding module. Colored rows correspond to the 30 modules identified. (B) Heatmap of semiquantitative
expressions of module eigen proteins with samples. (C) Pairwise correlations between the modules in the
heatmap of eigen proteins in module membership.
protein mediating c-MYC IRES-dependent translation under endoplasmic reticulum s tress23. EIF3F (eukaryotic
translation initiation factor 3F) was overexpressed in lung cancer cells, which were reported to reprogram cell
proliferation and energy m etabolism24.
The enriched pathways of WM28 (Fig. 3) included (1) biological process (GO): translational initiation,
nuclear-transcribed mRNA catabolic process, and NMD; (2) Reactome pathways: L13a-mediated translational
silencing of ceruloplasmin expression, GTP hydrolysis, and joining of the 60S ribosomal subunit, peptide chain
elongation, and NMD independent of the exon junction complex; and (3) STRING local network cluster: GTP
hydrolysis and joining of the 60S ribosomal subunit and protein export, and peptide chain elongation. Thus,
WM27 and WM28 shared almost the same enriched pathways. The hub proteins in this module were the ribo-
somal proteins including the eigen-protein RPS3A. The expression of RPS3A was upregulated, and its frequent
enhancement was reported in patients with SqCC25. RACK1 (receptor for activated C kinase 1) is a member of
the 40S ribosomal subunit involved in translational repression and the initiation of ribosome quality control via
the regulatory ubiquitylation of 40S ribosomal proteins26. SERBP1 (SERPINE1/PAI1 mRNA-binding protein 1,
also known as PAI-RBP1), a member of the serine protease inhibitor, was identified as a partner of RACK127.
SERBP1 was overexpressed in various cancers including breast cancer, ovarian carcinoma, glioblastoma, and also
lung SqCC, and this might be associated with tumorigenicity and resistance to anticancer drugs28. RPS6 (40S
ribosomal protein S6), a substrate for p70S6 kinase (p70S6K), is known to play important roles in tumorigenesis
and development. The highly expressed RPS6 and its phosphorylated form have been observed in various can-
cers including NSCLC, where upstream of Akt2/mTOR/p70S6K signaling pathway was aberrantly r egulated29.
The dephosphorylation of RPS6 can inhibit the mTOR pathway, resulting in the inhibition of tumor growth and
metastasis30. Eukaryotic translation initiation factors, EIF4A1 and EIF4A2, are the RNA helicases belonging to
the EIF4F initiation complex that unwind mRNA during translation31. EIF4A1was upregulated in various cancers
while the downregulation of EIF4A2 in NSCLC was associated with a poor p rognosis32.
Multivariate correlation analysis of semiquantitative key protein expressions. Representative
proteins expressed throughout all the 30 modules were subjected to multivariate correlation analysis (MVA). As
a result, the spectral count-based semiquantitative expression of 89 key proteins including eigen proteins and/or
hub proteins was clustered into several groups (a, b, c, d, and e; Fig. 4). The clusters c, d, and e were characteristic
of the SqCC trait whereas the clusters a and b were characteristic of the PPA trait. Of these, cluster e included
hub proteins of the WM26 module and eigen proteins of the SqCC characteristic modules. Cluster d included
most of the hub proteins in WM28.
Scientific Reports | (2021) 11:20209 | https://doi.org/10.1038/s41598-021-99695-x 5
Vol.:(0123456789)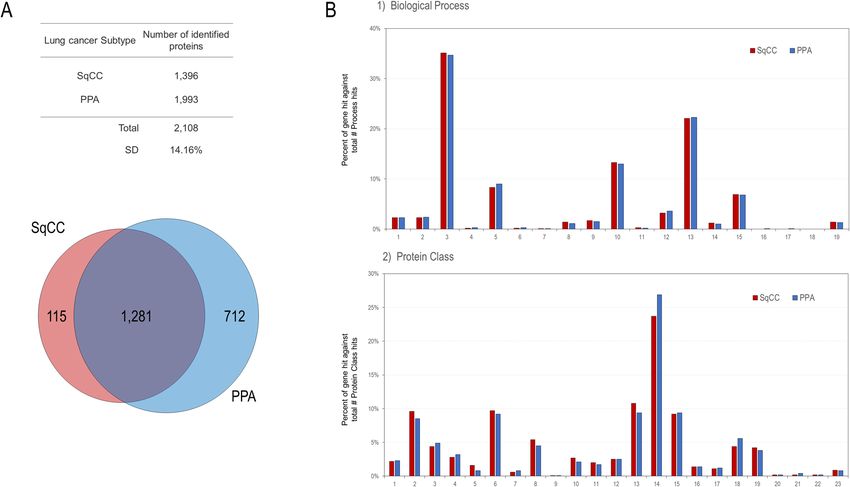
www.nature.com/scientificreports/
Figure 3. Data-driven protein co-expression networks and pathway enrichment results obtained for the
lung SqCC trait. (A) The co-expression networks of respective modules: (1) WM26, (2) WM27, and (3)
WM28 modules. Circle nodes in blue gradation and dotted red represent eigen proteins and/or hub proteins,
respectively, for each module, and circle nodes in red gradation also indicate key proteins in the network
modules. Dashed circles in black denote subnetworks and protein groups. (B) Among pathways enriched for the
protein core networks obtained for biological process (GO) and Reactome pathways, the top 20 pathways are
presented in the order of significance by the q-value. The dashed circles denote subnetworks and protein groups.
Causal networks, canonical pathways, and downstream regulator effects predicted by
IPA. Causal network analysis together with downstream annotation was performed for the WGCNA mod-
ules significant to SqCC, using the Ingenuity Pathway Analysis (IPA) (http://www.ingenuity.com) software33.
Table 2 briefly summarizes the top master regulators, diseases or functions, and canonical pathways predicted
for the three SqCC-characteristic WGCNA modules. Master regulators were predicted to be activated or
inhibited (|z-value|> 2.0) and upregulated (1.5 < z-value < 2.0) with the significance of network bias-corrected
p-value < 0.005. The top master regulators with high values in activation or inhibition score (z-score) in causal
networks, which were significantly associated with SqCC (WM26, WM27, and WM28) and PPA (WM15,
WM16, and WM18), are presented in Supplementary Tables S1 and S2, together with their participating regula-
tors and target molecules in the datasets.
Master regulators predicted for the WM26 module. Highly activated master regulators predicted for the WM26
module were MNK1/2, ROCK2, EFNA4, EFNA3, EFNA5, EFNA2, DSP, EFNA1, and SFN, while KMT2D and
MXD1 were highly inhibited. MNK1/2 encodes mitogen-activated protein kinases interacting protein kinases
1 and 2 (Mnk1 and Mnk2) which are known to play important roles in controlling signals involved in mRNA
translation. ROCK2 encodes the Rho-associated coiled-coil-containing protein kinase 2 (also known as Rho-
kinase 2 or ROCK-II), belonging to mammalian serine/threonine kinases and downstream effectors of the small
GTPase RhoA, which are key regulators of keratinocyte adhesion and terminal d ifferentiation34. ROCK2 is an
oncoprotein that acts as a prognostic marker in various solid tumors35.
EFNA4, EFNA3, EFNA5, EFNA2, and EFNA1 are members of the Eph (erythropoietin-producing hepatoma
or Ephrin) receptors of the A-type, which are the most important family of receptor tyrosine kinases involved
in signaling pathways of embryogenesis and tissue patterning. Eph signaling regulates cell morphology and
migration by modifying cell adhesion and organizing actin cytoskeleton and then affects cell proliferation and
differentiation36. Eph receptors are expressed in cancer cells and the tumor microenvironment involved in tumo-
rigenesis and m etastasis37. However, Eph receptors can act both as tumor promoters and suppressors, depending
on the cancer type37,38. Regarding lung cancer, the upregulation or overexpression of EFNA1, EFNA2, EFNA4,
EFNA5, and EFNA7 are indicative of tumor-promoting roles in lung c ancer39.
KMT2D encodes histone-lysine N-methyltransferase 2D, formerly named MLL2 (myeloid/lymphoid or
mixed-lineage leukemia 2), which methylates “Lys-4” of histone H3 (H3K4me), inducing epigenetic tran-
scriptional activation. This epigenetic regulator KMT2D is the most frequently mutated in all cancers, and its
Scientific Reports | (2021) 11:20209 | https://doi.org/10.1038/s41598-021-99695-x 6
Vol:.(1234567890)www.nature.com/scientificreports/
Figure 4. Multivariate correlation analysis for the spectral counting-based expression of 89 eigen proteins and/
or hub proteins and other key proteins expressed among all the modules identified for both the SqCC and PPA
traits. Clusters are denoted by a, b, c, d, and e. Eigen proteins in the WGCNA network modules significant for
SqCC or PPA are denoted in red or blue letters, respectively; the hub proteins are also indicated by red or blue-
filled circles, respectively.
mutations are notably associated with keratinocyte c ancers40. Lin-Shiao et al. recently reported that KMT2D
interacts with the transcription factor TP63 on chromatin and regulates TP63 target enhancers to coordinate
epithelial homeostasis and GO analysis for genes upregulated in shKMT2D-treated keratinocytes showed epi-
thelial cornification, keratinization, differentiation, and development as the most enriched c ategory41.
Tumor protein 63 (TP63), the master regulatory transcription factor of epithelial tissues, was predicted to be
upregulated (z-value = 1.897). TP63 regulates most of the same target genes involved in vitamin D and retinoid
MT2D41. Vitamin D receptor regulates the c-MYC/MXD1 network, in which
signaling that are regulated by K
the transcriptional repressor MXD1 is the antagonist, to suppress c-MYC function, preventing epidermal tumor
formation42. Interestingly, the MXD1 causal network inhibited in this study suggested the activation of c-MYC.
SFN was activated, encoding SFN, which is a cell cycle checkpoint protein and is present mainly in tissues
enriched in the stratified squamous keratinizing epithelium. SFN binds to translation and initiation factors, and
especially stimulates tumor initiation and the progression of early-stage lung adenocarcinoma43. DSP (desmo-
plakin) encodes the major high-molecular-weight protein of desmosomes. Desmosomal genes are expressed
differently between lung adenocarcinoma and lung SqCC although the mechanism regulating their expression
remains unknown.
Scientific Reports | (2021) 11:20209 | https://doi.org/10.1038/s41598-021-99695-x 7
Vol.:(0123456789)www.nature.com/scientificreports/
Causal networks Canonical pathways Diseases or functions Downstream regulatory effects
Top annotations
Module ID (color) Master regulators z-score (z-value) p-value Top annotations p-value (z-value) Top annotation Consistency
Glucocorticoid recep-
MNK1/2 3.638 5.01E−24
tor signaling
HIPPO signaling
ROCK2 2.646 1.78E−04
(− 1)
Purine ribonucleo-
EFNA4, EFNA3,
2.449 sides degradation to 2.95E−04
EFNA5, EFNA2
ribose-1-phosphate
Cell cycle: G2/M
EFNA1 2.236 DNA damage check- 5.62E−04 Cell proliferation of
point regulation Keratinization of
WM26 (blue) 2.46E−52 squamous cell carci- 3.795
epidermis
Desmoplakin, DSP 2 ERK5 signaling 1.74E−03 noma cell lines
SFN 2 p53 signaling 4.17E−03
Tumor protein 63
1.897 IGF-1 signaling 4.90E−03
(TP63)
Max dimerization
− 2.132
protein 1 (MXD1)
KMT2D − 2.828
CDK4/6 − 2.828
Zinc finger E-box-
Initiation of transla-
binding homeobox 2.714 EIF2 signaling 1.26E−07 9.92E−09
tion of protein
(ZEB)
Carbohydrate-
responsive element- Nonsense-mediated
2 mTOR signaling 7.59E−05 1.22E−07
binding protein mRNA decay
(MLXIPL)
Regulation of eIF4
Metabolism of
cdk 2 and p70S6K Signal- 7.76E−04 1.12E−05 (− 0.436)
protein
ing
Baculoviral IAP Remodeling of
repeat-containing 1897 Epithelial Adherens 2.51E−03
WM27 (darktur- protein (BIRC5) Junctions N/A
quoise)
FABP2 1.89
MYCN 1.633
Rapamycin-insen-
sitive companion of −2
mTOR (RICTOR)
5-Fluorouracil(5-
FU), chemical drug −2
intervention
La-related protein 1
− 2.24
(LARP1)
Mir200 − 2.714
Initiation of transla-
MYC 4 EIF2 signaling 2.51E−35 5.31E−39
tion of protein
Regulation of eIF4 Nonsense-mediated
MLXIPL 3.873 2.00E−20 1.31E−35
and p70S6K signaling mRNA decay
MYCN 3.742 mTOR signaling 3.16E−19 Translation of protein 4.18E−31
Metabolism of
TCR 2.449 HIF1α signaling 1.78E−02 1.81E−21 (− 1.72)
protein
Insulin secretion Cell death of osteo-
CAMK2N2 − 2.138 2.51E−02 5.88E−13 (− 2.828)
signaling pathway sarcoma cells
CD 437, chemical Cell death of osteo-
WM28 (orange) − 2.236 Translation of mRNA 2.65E−11 8.132
drug intervention sarcoma cells
ST1926, chemical Cell death of tumor
− 2.449 2.28E−10 (− 2.53)
drug intervention cells
Cell death of cancer
RICTOR −3 1.09E−09 (− 2.333)
cells
Sirolimus (Rapamy-
cin), chemical drug − 3.464
intervention
La-related protein 1
− 3.873
(LARP1)
Table 2. Representative master regulators predicted to be activated or inhibited (|z-value|> 2.0) and
upregulated (1.5 < z-value < 2.0) are summarized for the three WGCNA modules significant to lung SqCC
(network bias-corrected p-value < 0.005), in which top annotations on canonical pathways, diseases or
functions, and downstream regulatory effects are also provided.
Scientific Reports | (2021) 11:20209 | https://doi.org/10.1038/s41598-021-99695-x 8
Vol:.(1234567890)www.nature.com/scientificreports/
The protein networks of the WM26 module demonstrated the involvement of upregulated desmosomal
proteins including DSP, DSC2 (desmocollin 2), DSC3 (desmocollin 3), JUP (junction plakoglobin), PKP1 (pla-
kophilin 1), and PKP3 (plakophilin 3). Martin-Padron et al. reported that PKP1 was overexpressed and increased
cell proliferation and cell survival in lung SqCC, and found that PKP1 enhances MYC translation together with
the translation initiation complex by binding to the MYC mRNA44. Kudo et al. demonstrated via immunohis-
tochemical staining that the expression of DSC3, SFN, DSP, and JUP among cell adhesion and growth inhibitor
genes was highly increased in TP53-mutated tumors and that TP53-mutated tumors exhibited high nuclear
staining of the TP53 protein only in tumor cells at the tumor margins adjacent to the stroma but not in the
tumor interior; thus, exhibiting tumor cell heterogeneity in the expression of mutated TP53 protein between
the tumor interior and margins45.
Keratinization of the epidermis and cell proliferation of SqCC cell lines were thus significantly annotated
to the WM26 network module (Table 2), with key regulators being HIF1A (hypoxia-inducible factor 1 subunit
alpha) and IGF1 (insulin-like growth factor 1).
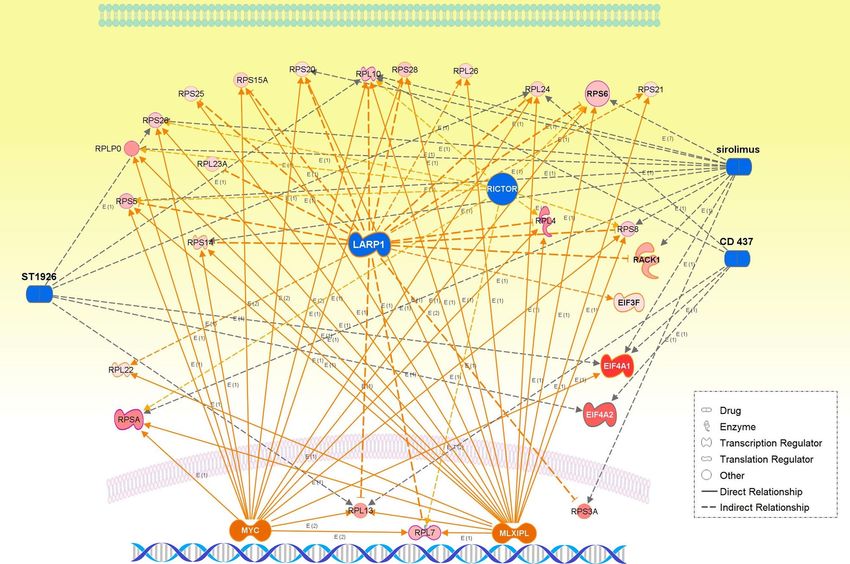
Master regulators predicted for the WM27 and WM28 modules. The WM27 and WM28 modules were found
to share the same master regulators that representatively included highly activated MLXIPL and MYCN, and
highly suppressed LARP1 and RICTOR (rapamycin-insensitive companion of mTOR), which were remark-
able in the WM28 module: LARP1, overlap p-value = 3.59 × 10⁻³² and z-value = − 3.873; MLXIPL, overlap
p-value = 8.54 × 10⁻³⁰ and z-value = 3.873; MYCN, overlap p-value = 3.27 × 10⁻²² and z-value = 3.742; RICTOR,
overlap p-value = 4.10 × 10⁻¹² and z-value = − 3.0.
Highly activated ZEB and highly inhibited Mir200 were characteristic of the WM27 module. ZEB encodes the
zinc finger E-box-binding homeobox proteins ZEB1 and ZEB2 which regulate the epithelial–mesenchymal tran-
sition pathway as both transcriptional activators and repressors. The miRNA-200 (miR-200) family can repress
ZEB proteins to regulate epithelial d ifferentiation46. Activated ZEB and inhibited Mir200 suggested progressive
tumorigenesis acquiring a mesenchymal phenotype in lung SqCC. The high expression of ZEB1 is associated
with tumor grade in NSCLC or distant metastasis in lung S qCC47.
LARP1 (La-related protein 1) is an RNA binding protein and mTORC1 effector involved with terminal oli-
gopyrimidine (TOP) mRNA translation. Surprisingly, LARP1 was found to be highly suppressed in this study.
Significant upregulated LARP1 was frequently reported to correlate with adverse prognosis in several cancers
including NSCLC48. In contrast, clear cell renal cell carcinoma progression was promoted by decreased LARP1
derived from the downregulation of the long noncoding RNA ASB16-AS1 by inhibiting miR-185-5p and miR-
214-3p49. Our result should be understood along contexts underpinning disease mechanisms and because the
function of LARP1 is highly c ontroversial50.
The highly activated MYC, MLXIPL, and MYCN and highly suppressed LARP1 and RICTOR were predicted
for the WM28 module. MLXIPL encodes a carbohydrate-responsive element-binding protein, which is a basic
helix-loop-helix leucine zipper (bHLH-LZ) transcription factor of the MYC/MAX/MAD superfamily, promotes
aerobic glycolysis through inhibition of TP53, resulting in tumor cell p roliferation51.
MYCN, a member of the MYC family of oncogenes, also encodes a bHLH-LZ protein MYCN, and its deregu-
lation was reported in various cancer types and was often associated with a poor prognosis. MYCN-amplified
cancer cells exhibit the enhanced expression of genes and proteins involved in aerobic glycolysis (referred to
as the Warburg effect), oxidative phosphorylation, and the detoxification of reactive oxygen species (ROS)52.
Numerous chemical drug interventions including sirolimus (rapamycin) were inhibited (Table 2), suggest-
ing an involvement of potential therapeutic targets in those data-driven networks. The translation initiation of
protein, nonsense-mediated mRNA decay, and negatively regulated cell death of tumor and cancer cells were
annotated to the WM28 module (Table 2).
Interestingly, the EIF2 signaling pathway exhibited the highest significance in overlapping p-values among
the top canonical pathways predicted for both the WM27 and WM28 network modules, and it was remarkably
activated especially for WM28 (overlap p-value = 2.77 × 10⁻³⁵ and z-value = 2.828). The upregulation of eIF2α
and eIF2β, which are members of translation initiation factors (eIFs), has been reported in several cancer types
including lung cancer, and is often associated with poor prognosis in patients53. Bilguun et al. found that STXBP4
(syntaxin binding protein 4) which targets TP63 was crucially associated with lesion growth in lung SqCC
patients, in which the eIF2 signaling pathway was the most significantly a ctivated54.
The top canonical pathways predicted for the three SqCC characteristic modules are also listed in Table 2.
The WM26 module was most significantly annotated to glucocorticoid receptor signaling and inhibited HIPPO
signaling, and the WM27 and WM28 were significant to eIF2 signaling, mTOR signaling, and the regulation of
eIF4 and p70S6K signaling.
Genomic alteration landscape of early‑stage SqCCs based on the TCGA database. Kim et al.
performed a comparative genomic analysis between Korean and North American lung SqCC samples and dem-
onstrated a spectrum of genomic alterations similar to the two ethnically different cohorts, which contrasts
with the differences noted in lung adenocarcinoma55. The TCGA lung SqCC sub-datasets (T1A-T2A: n = 184)
were selected to match our early tumor stage patients’ group, and their genomic alteration profiles were visual-
ized using the cBioPortal Pan-Lung cancer (TCGA, Cell 2018) (https://www.cbioportal.org/) (Supplementary
Fig. S4). Frequently altered driver mutation candidates were as follows: TP53 (80%) and CDKN2A (40%) in cell
cycle; PIK3CA (43%), PTEN (19%), and FGFR1 (17%) in mitogenesis and RAS signaling; SOX2 (39%) and TP63
(31%) in squamous cell differentiation; KMT2D (23%) and FAT1 (20%) in transcription and gene expression;
and SYNE1 (29%) and NFE2L2 (21%) in cell survival. Characteristics regarding mRNA-level expressions types
of genomic alterations represent PIK3CA, frequent missense (driver) and high amplification; PTEN, frequent
Scientific Reports | (2021) 11:20209 | https://doi.org/10.1038/s41598-021-99695-x 9
Vol.:(0123456789)www.nature.com/scientificreports/
Figure 5. The integrative networks of representative master and participating regulators predicted for the
WM26 module.
truncating (driver) and missense (driver); SOX2 and TP63, high amplification; KMT2D, highly frequent truncat-
ing (driver) and splice (driver); and NEF2L2, frequent missense (driver) (Supplementary Fig. S5). Shang et al.
reported a mutational landscape of Chinese lung SqCC patients, in which mutation frequencies of PIK3CA,
NFE2L2, and KMT2D were most s ignificant56, which was quite similar to our TCGA-based study, although most
of their cohorts were at advanced tumor stages. In our TCGA-based genomic alterations, PIK3CA, SOX2, and
TP63 co-occurred with high significances of q-value < 0.001, and NOTCH2 and DDR2 co-occurred with q = 0.002.
No driver mutation candidates were mutually exclusive. TP63 was co-expressed with PKP1, KRT6A, DSG3,
KRT6C, NFE2L2, KRT6B, and SOX2 at the mRNA level (Spearman’s correlation > 0.6 and q-values < 5.0 × 10⁻¹⁸),
which was found to be consistent with co-expression networks of the WM26 module (Fig. 2A). Our IPA analysis
of the WM26 module annotated the proliferation of SqCC, in which the key regulator HIF1A was important
in the adaptive response to hypoxia and angiogenesis. The ROS-responsive transcription factor NRF2 encoded
by NEF2L2 can bind and transactivate an antioxidant response element upstream of HIF1A, through which
the expression of HIF1α encoded by HIF1A is regulated directly by NRF257. Moreover, the accumulation of
HIF1α directly upregulates SLC2A1 (known as GLUT1, glucose transporter-1), as we indeed observed in the co-
expression networks of WM26, most likely suggesting hypoxia-induced metabolic changes to aerobic glycolysis
(the Warburg effect).
Overview, limitations, and conclusion. We identified protein co-expression networks significantly
associated with lung SqCC by WGCNA following MS-based proteomic analysis. Multivariate correlation analy-
sis for semiquantitative expressions of key proteins exhibited protein clusters characteristic of the SqCC trait,
which were well differentiated from those characteristics of the PPA trait. Strikingly, pathways enriched for
the WM26 module predominantly involved keratinization. The predicted causal networks were also annotated
to cell morphology and keratinization of the epidermis, in which key master regulators were highly activated
ROCK2 and Ephrs (EFNA1-5), while an epigenetic regulator and lung tumor suppressor KMT2D were highly
inhibited. Downstream regulator effects were annotated to the cell proliferation of SqCC, and a key regulator,
HIF1A, was involved in hypoxia-induced metabolic changes to aerobic glycolysis. Correspondingly, upregulated
TP63 was predicted for the WM26 module (Table 2 and Fig. 5), and genomic alterations in the early-stage TCGA
SqCC database exhibited highly amplified and frequently truncated driver mutations of KMT2D (Supplemen-
tary Fig. S5).
Pathways enriched and master participating regulators of causal networks predicted for both the WM27 and
WM28 modules were annotated to translation initiation and nonsense-mediated mRNA decay. The co-expression
Scientific Reports | (2021) 11:20209 | https://doi.org/10.1038/s41598-021-99695-x 10
Vol:.(1234567890)www.nature.com/scientificreports/
Figure 6. The integrative networks of representative master and participating regulators predicted for the
WM27 and WM28 modules, together with chemical drug interventions (CD 437, ST1926, and sirolimus
[rapamycin]).
networks of the WM27 module were characteristic of mesenchymal transformation by activated ZEB, and of
upregulated hub ribosomal proteins including the key ribosomal protein RPS25 of IRES-dependent translation.
Hong et al. revealed that non-phosphorylated LARP1 interacts with ribosomal protein mRNAs and inhibits
their translation while LARP1 phosphorylated by mTORC1 and Akt/S6K1 allows ribosomal protein mRNA
translation58. However, this switching mechanism of translation of ribosomal protein mRNAs depending on
phosphorylation/non-phosphorylation of LARP1 does not seem to interpret our results of both the highly sup-
pressed LARP1 and upregulated expressions of the hub ribosomal proteins including RACK2, RPS6, and RPS25,
which were predicted to be indirectly targeted by LARP1. Suppression of the cell death of tumor and cancer cells
was centrally annotated as downstream regulator effects to the WM28 module, in which key master regulators
were highly suppressed LARP1 and highly activated MYC and MLXIPL (Table 2 and Fig. 6). Even more, interest-
ingly, the eIF2 signaling was annotated commonly to both two modules with the highest significance.
Collectively, all the results we obtained in this study might allow a possible scenario as follows. Physiological
stressors such as hypoxia and/or ROS downregulate mTOR activity which represses cap-dependent translation
and reduces overall protein synthesis, in which the eIF2 ternary complex mostly plays an important role59.
The inhibition of protein synthesis leads to the activation of alternative cap-independent translation of mRNA
subsets which utilizes IRESs located in the 5′ untranslated region of mRNA60. These mRNAs encode oncogenic
proteins such as HIF1α, MYC, c-MYC, VGFA, and BCL-2, which promote the progression of tumorigenesis,
angiogenesis, and cancer cell survival. Thus, the eIF2 complex assembly importantly functions in switching from
cap-dependent to cap-independent t ranslation60,61. This might explain why LARP1, the master regulator in the
cap-dependent TOP mRNA translation, was highly suppressed and why this loss of LARP1 caused the reduction
of mTOR activity and downstream mTORC1 signaling including RICTOR.
The limitation of this study was the number of patients examined. We plan to validate the data-driven protein
networks as systems obtained from this study using a larger sample size of the external cohort in the future.
Numerous immunohistochemical (IHC) studies have already been reported for several member proteins of the
WM26 module such as DSG3, CK5(KRT5), and TRIM29 (Fig. 3A), and p63 [TP63, one of the master regulators
predicted for the WM26 network module (Table 2)], which are often clinically used to diagnose lung SqCC16,62.
Many studies have shown that p63 is a sensitive (90%) and fairly specific marker for lung SqCC, and tripartite
motif-containing 29 (TRIM29) is a sensitive marker (93.7%) for lung SqCC and is a fairly specific marker
staining only 6.1% of lung adenocarcinomas (https://biocare.n et/produc t/p63-trim29-antibody/). Desmoglein 3
(DSG3) is often highly expressed in various squamous cell carcinomas (SqCC) and has demonstrated a sensitiv-
ity of 85–99% and an ability to discriminate lung adenocarcinoma with a specificity of 98–100%. A cocktail of
Scientific Reports | (2021) 11:20209 | https://doi.org/10.1038/s41598-021-99695-x 11
Vol.:(0123456789)www.nature.com/scientificreports/
DSG3 + CK5 antibodies reported sensitivities of 93% and 100% for lung SqCC, with a specificity of 100% against
lung adenocarcinoma (https://biocare.net/product/desmoglein-3-ck5-antibody/).
In conclusion, we successfully applied WGCNA to clinical proteomic datasets. Our results could identify
data-driven network profiles and their master regulators characterizing cancerous cells microdissected from
FFPE tissues of lung SqCCs, exhibiting the progression of SqCC concomitantly with aberrant keratinization,
epithelial-mesenchymal transformation, aerobic glycolysis, and negatively regulated cell death. Collectively,
the results obtained in this study suggest an underlying disease mechanism of lung SqCC progression caused
largely by switching to the cap-independent, IRES-dependent translation of mRNA subsets encoding oncogenic
proteins. We plan to conduct a larger-sample cohort study, including genomic alteration analysis, to investigate
data-driven proteogenomic networks, which will further provide clinically important information on the pro-
teogenomic landscape of lung SqCCs.
Materials and methods
FFPE tissue specimens and sample preparation. Among 1333 patients who underwent surgical lung
cancer resection at St. Marianna University Hospital between 2000 and 2020, only 198 (14.9%) had tumors that
were histologically confirmed lung SqCC. The pathological specimens were independently reviewed by two
pathologists (H. N. and M. T.) to confirm that they satisfied the 2015 World Health Organization classification
criteria for lung tumors (histological criteria)63. FFPE tumor tissue blocks from 15 surgical specimens histo-
logically confirmed as lung SqCC and PPA were obtained without patient identifiers from the St. Marianna
University School of Medicine Hospital. Informed consent was obtained from all participating subjects. The pro-
tocol was approved by the Institutional Review Board of St. Marianna University School of Medicine (approval
no. 1461) and the study adhered to the Helsinki Declaration. For tissue microdissection, 10-μm-thick sections
from the FFPE tumor blocks were cut and placed on DIRECTOR slides (OncoPlex Diagnostics Inc., Rockville,
MD, USA). The sections were deparaffinized and stained with hematoxylin using standard histological methods
before dissection. Microdissection was performed using a Leica LMD7 microdissection microscope (Leica, Wet-
zlar, Germany). A total area of 4 mm2 with approximately 15,000 tumor cells was directly transferred from the
FFPE sections via laser dissection into the cap of a 200-μL low-binding tube (Supplementary Fig. S1).
Proteins were extracted and digested with trypsin using the Liquid Tissue MS Protein Prep kits (OncoPlex
Diagnostics Inc.) according to the manufacturer’s p rotocol64. Briefly, dried microdissection pellets were sus-
pended in 20 μL of Liquid Tissue buffer and heated at 95 °C for 90 min followed by cooling on ice, at which point
0.1 μg of trypsin was added to each tube. The tubes were then incubated at 37 °C for 18 h. The digested samples
were dried and then resuspended in 50 μL of 2% acetonitrile aqueous solution containing 0.1% trifluoroacetic
acid. Finally, the digested samples were frozen at − 80 °C until further processing.
Liquid chromatography‑tandem MS (LC–MS/MS)‑based proteomic analysis. A label-free quan-
titation approach using spectral counting by LC–MS/MS was adopted for the global proteomic analysis. The
digested samples (5 μL for a single run) were analyzed in triplicate by LC–MS/MS using a reverse-phase LC
system interfaced with a Q Exactive Orbitrap mass spectrometer (Thermo Fisher Scientific, Bremen, Germany)
via a nano-electrospray ionization device (AMR Inc., Tokyo, Japan). The LC system consisted of an Ultimate3000
HPLC System (Thermo Fisher Scientific), a trap cartridge (0.3 mm × 5.0 mm, CERI, Tokyo, Japan), and a capil-
lary separation column (Zaplous column alpha-PepC18, 3 μm, 12 nm, 0.1 mm × 150 mm, AMR Inc.) fitted
with an emitter tip (FortisTip, OmniSeparo-TJ, Hyogo, Japan). An auto-sampler (HTC-PAL, CTC Analytics,
Zwingen, Switzerland) loaded an aliquot of samples into the trap, which was then washed with solvent A (2%
acetonitrile aqueous solution containing 0.1% formic acid) to concentrate the peptides in the trap and desalt
them. Subsequently, the trap was connected in series to the separation column, and the peptides were eluted
from the whole column with 0.1% formic acid aqueous solution and acetonitrile by linear 5–40% acetonitrile
concentration gradient over 90 min at a flow-rate of 500 nL min−1. LC–MS/MS analysis and protein identifica-
tion have been described in detail previously65,66. In brief, the raw data were processed using PatternLab for
Proteomics software v4.0. Peptide sequence matching was performed using the Comet algorithm against the
UniProt Homo sapiens database. A target-reverse strategy was employed for increased confidence in protein
identification. This search considered tryptic peptide candidates, and the formylation of lysine and oxidation of
methionine were considered as variable modifications. The Comet search engine considered a precursor mass
tolerance of 40 ppm and a fragment bin tolerance of 0.02. The validity of the peptide spectrum matches was
assessed using PatternLab’s Search Engine Processor (SEPro) module. Acceptable FDR for spectra, peptide and
protein are 3%, 2%, and 1%, respectively. The expressions of the identified proteins were assessed by spectral
count-based protein quantification. The spectral count is the number of MS/MS spectra assigned to each protein.
WGCNA. The similarity in the protein expression patterns was calculated for all protein pairs using their
pairwise Pearson’s correlation coefficient. An adjacency matrix is computed by increasing the similarity matrix
up to the power of 100 to obtain a co-expression network with scale-free properties. A topological overlap matrix
(TOM), which considers topological similarities between a pair of proteins in the network, was then generated
from the resultant scale-free co-expression network. We generated a tree that clustered proteins in its branches
by hierarchical clustering using the dissimilarity according to TOM (1 − TOM), and protein modules were deter-
mined using dynamic tree cutting to trim the branches9.
Modules were summarized by the first principal component referred to as eigen protein in the text, which
has the highest connectivity in the module. Module membership, defined as the correlation between the protein
expression profile and the module eigen protein, was measured with values ranging from 0 to 1, with 0 represent-
ing a gene that is not part of the module, and 1 representing high connectivity with the module. Subsequently,
Scientific Reports | (2021) 11:20209 | https://doi.org/10.1038/s41598-021-99695-x 12
Vol:.(1234567890)www.nature.com/scientificreports/
the module-trait association was determined using the correlation between the module eigen protein and the
two clinical traits, SqCC and PPA. A protein module was summarized by the top hub protein (referred to as eigen
protein) with the highest connectivity in the module. To identify the protein modules associated with clinical
traits, we calculated the correlation coefficients between the eigen proteins and clinical traits. WGCNA analysis
was conducted using a Garuda Platform Gadget (The Systems Biology Institute, Tokyo, Japan) that implemented
the WGCNA pipeline based on the WGCNA R-package9.
Protein–protein interaction network construction. To construct a protein interaction network for a
protein module, we used the STRING database (version 11.0)11. STRING networks were calculated under the
criteria for linkage with experiments, databases, text mining, and co-expression alone, with the default settings
(medium confidence score: 0.400 network depth: 0 interactions). Functional enrichment results were obtained
for canonical pathways, with p < 0.05. Proteins in a protein module were mapped in the protein interaction
network from the STRING database, to produce the results of the enrichment analysis regarding the biological
process (GO), STRING local network cluster (CL), and Reactome pathways (HAS). The enrichment effect was
also evaluated by the measure, Strength, which is the ratio (log10 [observed/expected] regarding (i) the number
of proteins in a network annotated with a term and (ii) the number of proteins expected to be annotated with
this term in a random network of the same size. Subsequently, protein networks imported from the STRING
database were visualized using Cytoscape version 3.8.2. The proteins inside co-expression modules exhibit high
connectivity, and the proteins within the same module may play similar roles. We identified hub proteins in
each module according to their intramodular connectivity and correlation with module eigen proteins. The top
20 high-degree proteins were identified using the cytoHubba p lugin12. The top-ranked proteins in each module
were considered to be hub proteins—“highly connected proteins.” Functional enrichment results were obtained
for canonical pathways, considering p < 0.05 to be statistically significant. Multivariate correlation analysis of
semiquantitative key protein expressions was performed using the JMP software (SAS Institute, Cary, NC, USA).
Master regulator and causal network analysis and downstream regulator effect annotation
predicted by IPA. Canonical pathways, master regulators, and causal networks were predicted using the
ingenuity pathway analysis (IPA) software33. Quantile-normalized protein expression data for the selected mod-
ules were used as input data sets. Causal networks (p < 0.005) were predicted from the WGCNA network mod-
ules significantly associated with the two clinical traits (SqCC and PPA), where the activation and inhibition of
a predicted network were defined by z-values > 2.0 andwww.nature.com/scientificreports/
18. Zhou, X. M. et al. Upregulated TRIM29 promotes proliferation and metastasis of nasopharyngeal carcinoma via PTEN/AKT/
mTOR signal pathway. Oncotarget 7, 13634–13650 (2016).
19. Xu, W., Chen, B., Ke, D. & Chen, X. TRIM29 mediates lung squamous cell carcinoma cell metastasis by regulating autophagic
degradation of E-cadherin. Aging 12, 13488–13501 (2020).
20. Denizot, Y. et al. Is there a role of platelet-activating factor in human lung cancer?. Lung Cancer 33, 195–202 (2001).
21. Ma, C. et al. PAFAH1B2 is a HIF1a target gene and promotes metastasis in pancreatic cancer. Biochem. Biophys. Res. Commun.
501, 654–660 (2018).
22. Hertz, M. I. et al. Ribosomal protein S25 dependency reveals a common mechanism for diverse internal ribosome entry sites and
ribosome shunting. Mol. Cell. Biol. 33, 1016–1026 (2013).
23. Shi, Y. et al. Therapeutic potential of targeting IRES-dependent c-myc translation in multiple myeloma cells during ER stress.
Oncogene 35, 1015–1024 (2016).
24. Esteves, P. et al. Nuclear control of lung cancer cells migration, invasion and bioenergetics by eukaryotic translation initiation
factor 3F. Oncogene 39, 617–636 (2020).
25. Slizhikova, D. K., Vinogradova, T. V. & Sverdlov, E. D. The NOLA2 and RPS3A genes as highly informative markers for human
squamous cell lung cancer. Bioorg. Khim. 31, 195–199 (2005).
26. Sundaramoorthy, E. et al. ZNF598 and RACK1 regulate mammalian ribosome-associated quality control function by mediating
regulatory 40S ribosomal ubiquitylation. Mol. Cell. 65, 751–760 (2017).
27. Bolger, G. B. The RNA-binding protein SERBP1 interacts selectively with the signaling protein RACK1. Cell Signal. 35, 256–263
(2017).
28. Ahn, J. W. et al. SERBP1 affects homologous recombination-mediated DNA repair by regulation of CtIP translation during S phase.
Nucleic Acids Res. 43, 6321–6333 (2015).
29. Chen, B. et al. Hyperphosphorylation of ribosomal protein S6 predicts unfavorable clinical survival in non-small cell lung cancer.
J. Exp. Clin. Cancer Res. 34, 126 (2015).
30. Hua, H. et al. Targeting mTOR for cancer therapy. J. Hematol. Oncol. 12, 71 (2019).
31. Bhat, M. et al. Targeting the translation machinery in cancer. Nat. Rev. Drug Discov. 14, 261–278 (2015).
32. Shaoyan, X. et al. Downregulation of EIF4A2 in non-small-cell lung cancer associates with poor prognosis. Clin. Lung Cancer. 14,
658–665 (2013).
33. Krämer, A., Green, J., Pollard, J. Jr. & Tugendreich, S. Causal analysis approaches in ingenuity pathway analysis. Bioinformatics 30,
523–530 (2014).
34. Lock, F. E. & Hotchin, N. A. Distinct roles for ROCK1 and ROCK2 in the regulation of keratinocyte differentiation. PLoS ONE 4,
e8190 (2009).
35. Dourado, M. R. et al. Clinicopathologic significance of ROCK2 expression in oral squamous cell carcinomas. J. Oral Pathol. Med.
47, 121–127 (2018).
36. Pasquale, E. B. Eph receptors and ephrins in cancer: Bidirectional signalling and beyond. Nat. Rev. Cancer. 10, 165–180 (2010).
37. van der Anderton, M., Meulen, E., Blumenthal, M. J. & Schäfer, G. The role of the Eph receptor family in tumorigenesis. Cancers
13, 206 (2021).
38. Buckens, O. J., El Hassouni, B., Giovannetti, E. & Peters, G. J. The role of Eph receptors in cancer and how to target them: Novel
approaches in cancer treatment. Expert Opin. Investig. Drugs. 29, 567–582 (2020).
39. Giaginis, C. et al. Ephrin (Eph) receptor A1, A4, A5 and A7 expression in human non-small cell lung carcinoma: Associations
with clinicopathological parameters, tumor proliferative capacity and patients’ survival. BMC Clin. Pathol. 14, 8 (2014).
40. Sze, C. C. & Shilatifard, A. MLL3/MLL4/COMPASS family on epigenetic regulation of enhancer function and cancer. Cold Spring
Harb. Perspect. Med. 6, a026427 (2016).
41. Lin-Shiao, E. et al. KMT2D regulates p63 target enhancers to coordinate epithelial homeostasis. Genes Dev. 32, 181–193 (2018).
42. Salehi-Tabar, R. et al. Vitamin D receptor as a master regulator of the c-MYC/MXD1 network. Proc. Natl. Acad. Sci. U S A. 109,
18827–18832 (2012).
43. Kim, Y. et al. Stratifin regulates stabilization of receptor tyrosine kinases via interaction with ubiquitin-specific protease 8 in lung
adenocarcinoma. Oncogene 37, 5387–5402 (2018).
44. Martin-Padron, J. et al. Plakophilin 1 enhances MYC translation, promoting squamous cell lung cancer. Oncogene 39, 5479–5493
(2020).
45. Kudo, I. et al. Particular gene upregulation and p53 heterogeneous expression in TP53-mutated maxillary carcinoma. Oncol. Lett.
14, 4633–4640 (2017).
46. Brabletz, S. & Brabletz, T. The ZEB/miR-200 feedback loop—A motor of cellular plasticity in development and cancer?. EMBO
Rep. 11, 670–677 (2010).
47. Zhang, J. et al. Involvement of ZEB1 and E-cadherin in the invasion of lung squamous cell carcinoma. Mol. Biol. Rep. 40, 949–956
(2013).
48. Xu, Z. et al. LARP1 is regulated by the XIST/miR-374a axis and functions as an oncogene in non-small cell lung carcinoma. Oncol.
Rep. 38, 3659–3667 (2017).
49. Li, M. et al. Downregulation of the lncRNA ASB16-AS1 decreases LARP1 expression and promotes clear cell renal cell carcinoma
progression via miR-185-5p/miR-214-3p. Front. Oncol. 10, 617105 (2021).
50. Berman, A. J. et al. Controversies around the function of LARP1. RNA Biol. 18, 207–217 (2021).
51. Iizuka, K., Takao, K. & Yabe, D. ChREBP-mediated regulation of lipid metabolism: Involvement of the gut microbiota, liver, and
adipose tissue. Front. Endocrinol. 11, 587189 (2020).
52. Yoshida, G. J. Beyond the Warburg effect: N-Myc contributes to metabolic reprogramming in cancer cells. Front. Oncol. 10, 791
(2020).
53. Tanaka, I. et al. eIF2β, a subunit of translation-initiation factor EIF2, is a potential therapeutic target for non-small cell lung cancer.
Cancer Sci. 109, 1843–1852 (2018).
54. Bilguun, E. O. et al. Distinctive roles of syntaxin binding protein 4 and its action target, TP63, in lung squamous cell carcinoma:
A theranostic study for the precision medicine. BMC Cancer 20, 935 (2020).
55. Kim, Y. et al. Integrative and comparative genomic analysis of lung squamous cell carcinomas in East Asian patients. J. Clin. Oncol.
32, 121–128 (2014).
56. Shang, Y. et al. Comprehensive genomic profile of Chinese lung cancer patients and mutation characteristics of individuals resistant
to icotinib/gefitinib. Sci. Rep. 10, 20243 (2020).
57. Lacher, S. E., Levings, D. C., Freeman, S. & Slattery, M. Identification of a functional antioxidant response element at the HIF1A
locus. Redox Biol. 19, 401–411 (2018).
58. Hong, S. et al. LARP1 functions as a molecular switch for mTORC1-mediated translation of an essential class of mRNAs. Elife 6,
e25237 (2017).
59. Spriggs, K. A., Bushell, M. & Willis, A. E. Translational regulation of gene expression during conditions of cell stress. Mol. Cell.
40, 228–237 (2010).
60. Braunstein, S. et al. A hypoxia-controlled cap-dependent to cap-independent translation switch in breast cancer. Mol. Cell. 28,
501–512 (2007).
61. Silvera, D., Formenti, S. C. & Schneider, R. J. Translational control in cancer. Nat. Rev. Cancer. 10, 254–266 (2010).
Scientific Reports | (2021) 11:20209 | https://doi.org/10.1038/s41598-021-99695-x 14
Vol:.(1234567890)You can also read