Thermal dissociation cavity-enhanced absorption spectrometer for measuring NO2, RO2NO2, and RONO2 in the atmosphere - Recent
←
→
Page content transcription
If your browser does not render page correctly, please read the page content below
Atmos. Meas. Tech., 14, 4033–4051, 2021
https://doi.org/10.5194/amt-14-4033-2021
© Author(s) 2021. This work is distributed under
the Creative Commons Attribution 4.0 License.

Thermal dissociation cavity-enhanced absorption spectrometer for
measuring NO2, RO2NO2, and RONO2 in the atmosphere
Chunmeng Li1 , Haichao Wang1,2,3 , Xiaorui Chen1 , Tianyu Zhai1 , Shiyi Chen1 , Xin Li1 , Limin Zeng1 , and Keding Lu1
1 StateKey Joint Laboratory of Environmental Simulation and Pollution Control, College of Environmental Sciences and
Engineering, Peking University, Beijing, 100871, China
2 School of Atmospheric Sciences, Sun Yat-sen University, Zhuhai, Guangdong, 510275, China
3 Guangdong Provincial Observation and Research Station for Climate Environment and Air Quality Change in the Pearl

River Estuary, Key Laboratory of Tropical Atmosphere-Ocean System, Ministry of Education, Southern Marine Science and
Engineering Guangdong Laboratory (Zhuhai), Zhuhai, 519082, China

Correspondence: Haichao Wang (wanghch27@mail.sysu.edu.cn) and Keding Lu (k.lu@pku.edu.cn)

Received: 31 December 2020 – Discussion started: 21 January 2021
Revised: 23 April 2021 – Accepted: 29 April 2021 – Published: 3 June 2021

Abstract. We developed thermal dissociation cavity-                1   Introduction
enhanced absorption spectroscopy (TD-CEAS) for the in situ
measurement of NO2 , total peroxy nitrates (PNs, RO2 NO2 ),
and total alkyl nitrates (ANs, RONO2 ) in the atmosphere.          Organic nitrates (ONs) act as temporary NOx reservoir
PNs and ANs were thermally converted to NO2 at the cor-            species, which affect atmospheric circulation and impact air
responding pyrolytic temperatures and detected by CEAS             quality and climate (Mellouki et al., 2015). Peroxy nitrates
at 435–455 nm. The instrument sampled sequentially from            (PNs, RO2 NO2 ) and alkyl nitrates (ANs, RONO2 ) are two
three channels at ambient temperature, 453 and 653 K,              important kinds of organic nitrates. They are closely related
with a cycle of 3 min, to measure NO2 , NO2 + PNs, and             to the distribution of oxidants in the atmosphere by termi-
NO2 + PNs + ANs. The absorptions between the three chan-           nating the HOx cycle. ONs are also important precursors of
nels were used to derive the mixing ratios of PNs and ANs          secondary organic aerosols (SOAs) (Berkemeier et al., 2016;
by spectral fitting. The detection limit (LOD, 1σ ) for retriev-   Lee et al., 2016; Ng et al., 2017; Rollins et al., 2012). Volatile
ing NO2 was 97 parts per trillion by volume (pptv) in 6 s.         organic compounds (VOCs) are oxidized by OH or O3 to pro-
The measurement uncertainty of NO2 was 9 %, while the un-          duce peroxy radicals (RO2 ), and then RO2 reacts with NO2
certainties of PN and AN detection were larger than those          to produce PNs (Reaction R1). In addition, the aldehydes
of NO2 due to chemical interferences that occurred in the          formed during the process of NO3 oxidizing isoprene at night
heated channels, such as the reaction of NO (or NO2 ) with         react with NO3 to form PNs. PNs can be divided into two
the peroxy radicals produced by the thermal dissociation of        categories depending on the nature of the RO2 group. One is
organic nitrates. Based on laboratory experiments and nu-          peroxy acyl nitrates (PANs) when RO2 is R0 C (O)OO, among
merical simulations, we created a lookup table method to cor-      which PPN (peroxypropionyl nitrate) and PAN (peroxyacetyl
rect these interferences in PN and AN channels under various       nitrate) dominate PNs with percentages of 75 %–90 % due to
ambient organic nitrates, NO, and NO2 . Finally, we present        their relatively high thermal stability. The other is some per-
the first field deployment and compare it with other instru-       oxy nitrates without acyl groups, which are only abundant in
ments during a field campaign in China. The advantages and         cold regions (Roberts, 1990; Roberts et al., 1998b; Thieser et
limitations of this instrument are outlined.                       al., 2016; Wooldridge et al., 2010). The sink pathways of PNs
                                                                   include deposition, thermal decomposition, photolysis, and
                                                                   OH oxidation, and thermal decomposition dominates in the
                                                                   troposphere with a temperature dependence (Reaction R2).
                                                                   Therefore, the lifetime of PAN varies from less than 1 h to

Published by Copernicus Publications on behalf of the European Geosciences Union.
4034                                           C. Li et al.: Thermal dissociation cavity-enhanced absorption spectrometer

several months, depending on the environmental conditions.       al., 2002). Afterwards, chemical ionization mass spectrom-
                                                                 etry (CIMS), cavity ring-down spectroscopy (CRDS), and
RO2 + NO2 + M → RO2 NO2 + M                              (R1)    cavity attenuated phase-shift spectroscopy (CAPS) are used
RO2 NO2 + M → RO2 + NO2 + M                              (R2)    to quantify the pyrolytic products (Paul and Osthoff, 2010;
                                                                 Slusher et al., 2004; Thieser et al., 2016; Wild et al., 2014).
In the high-NOx region, RO2 reacts primarily with NO to          The detection limits and response times of TD-CIMS are ex-
produce ANs. ANs can also be emitted directly from biomass       cellent, but 13 C-labeled PAN is required as an internal stan-
combustion and the ocean. Ocean emissions are regarded           dard. TD-CRDS and TD-CAPS show high spatial and tem-
as the main source of short-chain ANs (C1 –C3 ), and up to       poral resolution and good measurement capability (Sadanaga
tens of parts per trillion by volume (pptv) of the species       et al., 2016; Sobanski et al., 2016). CEAS (cavity-enhanced
above have been measured in marine areas (Atlas et al., 1993;    absorption spectroscopy) is a powerful technology that can
Chuck et al., 2002; Talbot et al., 2000). NO3 -initiated ANs     monitor several compounds or species simultaneously with
during the night are generally considered to be important and    broad absorption bands being detected (Fiedler et al., 2003)
have a higher organic nitrate yield than OH-initiated ANs        and has been applied to measure many species in field stud-
(Horowitz et al., 2007; Perring et al., 2013). During the day-   ies, such as NO2 , HONO, NO3 , N2 O5 , IO, glyoxal, and
time, there is a branching reaction between RO2 and NO to        methylglyoxal (Ball et al., 2004; Barbero et al., 2020; Duan
form ANs (Reaction R3a) with a small branch ratio (1 %–          et al., 2018; Gherman et al., 2008; Jordan and Osthoff, 2020;
30 %) (Arey et al., 2001; Reisen et al., 2005; Russell and       Kahan et al., 2012; Langridge et al., 2006; Lechevallier et
Allen, 2005; Wennberg et al., 2018). Ambient ANs are re-         al., 2019; Liu et al., 2019; Min et al., 2016; Thalman and
moved by photolysis or oxidation to produce NOx or HNO3 ,        Volkamer, 2010; Vaughan et al., 2008; Venables et al., 2006;
transportation as NOx reservoirs, or deposition. ANs play        Ventrillard-Courtillot et al., 2010; Ventrillard et al., 2017;
a significant role in SOA formation (Lee et al., 2016; Zare      H. Wang et al., 2017; Washenfelder et al., 2016, 2008; Watt
et al., 2018). Monofunctional ANs are stable and account         et al., 2009).
for a small proportion of ANs, among which those formed             Organic nitrates have a large range of mixing ratios in the
from alkanes can be tracers of human activities in remote        atmosphere that vary from several pptv in warm and remote
areas (Simpson et al., 2006; Wang et al., 2003). Polyfunc-       regions to several parts per billion by volume (ppbv) in pol-
tional ANs are hard to detect since they are more reactive       luted regions. Field measurements of organic nitrates have
than monofunctional ANs.                                         been extensively conducted in the United States and Europe
                                                                 (Fischer et al., 2000; Glavas and Moschonas, 2001; Kastler
RO2 + NO + M → RO2 NO + M                               (R3a)    and Ballschmiter, 1999; Perring et al., 2009; Roberts et al.,
RO2 + NO + M → RO + NO2                                 (R3b)    1998a; Sobanski et al., 2017), but related studies are sparse
                                                                 in China (Chen et al., 2017; Song et al., 2018; Sun et al.,
The various sources and sinks of ONs complicate their atmo-      2018; Zhang et al., 2018). Ozone pollution in China has oc-
spheric distribution. The measurement of ANs and PNs has         curred frequently in recent years (Ma et al., 2019; Shu et al.,
been developed by gas chromatography (GC). GC is used for        2019; T. Wang et al., 2009, 2017; Yin et al., 2019). Although
the separation of species, and then the separated substances     many studies have examined the effect of PNs and ANs on
are quantified by electron capture detectors (ECDs), lumi-       regulating ozone formation (Chen et al., 2018; Ling et al.,
nol chemiluminescence (CL), or mass spectrometry (MS)            2016; Liu et al., 2018, 2012, 2010; Zeng et al., 2019; Zhang
(Atlas, 1988; Blanchard et al., 1993; Flocke et al., 2005;       et al., 2014), the issue has not been well studied. Here, we
Gaffney et al., 1998; Hao et al., 1994; Luxenhofer et al.,       developed a pyrolytic measurement system based on CEAS
1994; Tanimoto et al., 1999). These methods measure in-          to detect NO2 , PNs, and ANs in the atmosphere. In this study,
dividual species accurately (Roberts et al., 2003), but the      the detailed setup of the instrument, laboratory characteriza-
individual standards are incomprehensive. Furthermore, the       tions, and its first field application in China are presented.
methods suffer from relatively low time resolution (Blan-
chard et al., 1993). The strength of the bond between the
NO2 group and the organic group determines the temper-           2     Methods
ature to pyrolyze the organic nitrates. The cleavage of the
NO2 group in PNs requires approximately 85–115 kJ mol−1          2.1    Instrumentation of TD-CEAS
(Kirchner et al., 1999), while for ANs, the pyrolytic process
requires approximately 160–170 kJ mol−1 (Roberts, 1990);         Our instrument is designed to measure NO2 , ANs, and PNs
therefore, PNs are more prone to dissociate thermally. Based     in the atmosphere and has the characteristics of good sta-
on the feature of gradient pyrolysis of reactive nitrogen com-   bility, low energy consumption, and portability. The total
pounds, TD-LIF (thermal-dissociation laser-induced fluores-      weight of the instrument is less than 30 kg, the overall size is
cence) was developed to measure PNs, ANs, and gaseous            110×60×50 cm, and power consumption is less than 300 W.
HNO3 indirectly by quantifying the NO2 product (Day et           The measurement of NO2 is achieved by CEAS. Due to the

Atmos. Meas. Tech., 14, 4033–4051, 2021                                           https://doi.org/10.5194/amt-14-4033-2021
C. Li et al.: Thermal dissociation cavity-enhanced absorption spectrometer                                                      4035

feature of gradient pyrolysis of ANs and PNs, the sample
gas flowing out from three different channels contains the to-
tal amount of NO2 at different temperatures. The gradient of
NO2 concentration absorption at different pyrolytic temper-
atures is used to retrieve the mixing ratio of NO2 , PNs, and
ANs. The time resolution of the instrument measurement is
6 s, the measurement time of each channel is 1 min, and each
cycle is 3 min.
   The CEAS system has been described in detail in previous
literature (Duan et al., 2018; Fiedler et al., 2003; Gherman et
al., 2008; Jordan and Osthoff, 2020; Jordan et al., 2019; Lan-
gridge et al., 2006; Liang et al., 2019; Liu et al., 2019; Min et
al., 2016; Tang et al., 2020; Ventrillard-Courtillot et al., 2010;
H. Wang et al., 2017; Yi et al., 2016); thus there is a brief
introduction to the principle of the instrument here. NO2
molecules have a specific absorption structure in the wave-
length range of 430–460 nm (Fig. S1 in the Supplement).
Based on Lambert–Beer’s law, the extinction coefficient (α)
is proportional to the absorber’s concentration and optical
path. Here, α is mainly contributed by molecular absorption,
Rayleigh scattering, and Mie scattering. In addition, it can
                                                                     Figure 1. The overall schematic of the CEAS (a) and the instru-
also be obtained by comprehensive calculations through the
                                                                     ment (b). The CEAS is mainly composed of LEDs, collimating
intensity of the sampling spectrum, reference spectrum, mir-         optics, a cage structure, a high-finesse cavity, and a spectrome-
ror reflectivity, and effective cavity length.                       ter. After filtering the PM, the gas passes through three quartz
   In Eq. (1), λ is the wavelength of light, I0 (λ) is the in-       tubes, and then the alternate measurements of NO2 , NO2 + PNs,
tensity of the reference spectrum, I (λ) is the sample spec-         and NO2 + PNs + ANs are achieved by three-way solenoid valves.
trum, deff is the effective cavity length (see Sect. 3.2 in de-
tail), R (λ) is the mirror reflectivity, αMie (λ) is the extinc-
tion due to Mie scattering, αRayl (λ) is the extinction due to
Rayleigh scattering, and ni and σi (λ) are the number density           Four stainless-steel columns are used to collimate two op-
and absorption cross section of ith gas compounds, respec-           posing high-mirror mounting bases. The two endplates in the
tively. According to Eq. (1), it is necessary to quantify the        middle of the cage structure further enhance the stability of
mirror reflectivity, effective cavity length, and NO2 absorp-        the system. The light source is introduced into the system
tion cross section.                                                  through a fiber connected to a two-dimensional adjustment

            I0 (λ)

                           1 − R (λ)
                                                                    frame (CXY1, Thorlabs, Newton, NJ, USA) through a con-
α (λ) =            −1                                                nector. The plano-convex lens (f = 30 mm) is installed in
            I (λ)             deff
         X                                                           another adjustment frame, and the two adjustment frames are
       =      ni × σi (λ) + αMie (λ) + αRayl (λ)               (1)   connected by a customized X-shaped adapter, which is fixed
          i                                                          at the end with the light source. The center alignment of the
As shown in Fig. 1a, the optical layout of the CEAS con-             light source, lens, and high-reflectivity module is achieved
sists of a light source, collimating optics, a cage system, a        by adjusting the adjustment frame in the vertical and hori-
high-finesse cavity, and a commercial spectrograph with a            zontal directions. Then, blue light is introduced into an opti-
charge-coupled device (CCD) detector. The core of the light          cal cavity composed of a pair of high-reflectivity (HR) mir-
source module is a single-color LED (M450D3, Thorlabs,               rors. The reflectivity of HR mirrors (CRD450-1025-100, Ad-
Newton, NJ, USA), which emits approximately 1850 mW                  vanced Thin Films, CO, USA) is reported by the manufac-
optical power at approximately 450 nm with a full width at           turer to be greater than 0.9999 (440–460 nm) with a radius
half maximum (FWHM) of 18 nm. To obtain a stable out-                curvature of 1.0 m and a diameter of 25.4 mm. The high-
put of the light source, the input current and operating tem-        reflectivity mirrors are installed in the groove of the special
perature of the light source are stabilized to reduce the in-        customized base and sealed by an O-ring, and then the three-
tensity and wavelength drift. The switching power supply is          dimensional microadjustment is achieved by squeezing the
12 VDC with a current of 1.00 ± 0.01 A. Constant current             lens and O-ring to finely adjust their pitch and yaw. The dis-
control is achieved through a stable current source. The tem-        tance between mirrors is 39.0 cm, and high-purity nitrogen
perature of the light source is controlled by the proportion         (> 99.999 %), which passes through the small hole before
integration differentiation (PID) algorithm and stabilized at        the mirror base, is used as a purge gas to protect the mirror
24.0 ± 0.1 ◦ C.                                                      surface.

https://doi.org/10.5194/amt-14-4033-2021                                               Atmos. Meas. Tech., 14, 4033–4051, 2021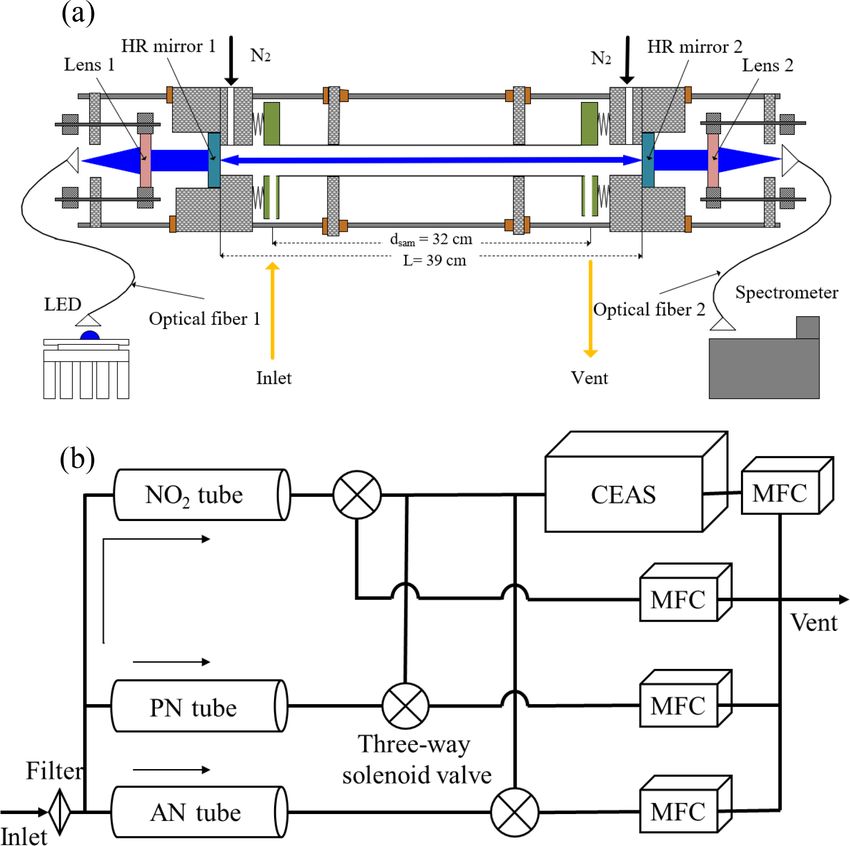
4036                                            C. Li et al.: Thermal dissociation cavity-enhanced absorption spectrometer

   The cavity system is sealed by two welded bellows, two          2.2   Laboratory experimental setup
polytetrafluoroethylene (PTFE) connecting pieces, and a
stainless-steel sampling cell that is internally polished. The     To characterize the performance and potential interferences
PTFE connecting piece connects the sampling cell and bel-          of this instrument, we used a photochemical PAN source in
lows and acts as a sample inlet and outlet. As shown in            the laboratory experiments. Acetone undergoes photolysis at
Fig. 1a, the distance between the inlet and outlet (dsam )         285 nm from a Hg lamp and then generates excess PA rad-
is 32.0 cm. After passing through the sampling cavity, the         icals (peroxyacetyl radicals) in zero air. A small amount of
blue light converges through another plano-convex mirror           NO reacts with PAs to form NO2 , and then NO2 further reacts
(f = 50 mm). It enters the detector spectrometer (QE65PRO,         with PAs to form PAN. We obtained a standard PAN source
Ocean Optics, Dunedin, FL, USA) for signal acquisition             in this way, which generated a source at a level of 1–10 ppbv.
through an optical fiber. The dark current in the CCD of the       The source was used for the laboratory experiments after the
spectrometer is reduced by controlling the temperature of the      temperature of the Hg lamp stabilized at 39.0 ◦ C, and the
CCD at −20.0 ◦ C; the width of the entrance slit is 100 µm,        source level and stability were double-checked by a GC-ECD
the corresponding wavelength resolution is 0.39 nm, and the        instrument. To investigate the potential interferences caused
detection wavelength range is 413.48–485.48 nm.                    by the pyrolysis of organic radical products reacting with
   The schematic of the TD-CEAS is shown in Fig. 1b. The           ambient NO and NO2 in the TD-CEAS, a multigas calibra-
flow system mainly includes the particulate matter filter in       tor (146i, Thermo Fisher Scientific, Inc., USA) was used to
the front end of the sampling line, quartz tubes for species py-   generate O3 gas by photolysis of oxygen and outputted well-
rolytic conversion, three-way system switching module, de-         mixed gases by diluting NO or NO2 with zero air according
tection module (CEAS), and flow control module. The sam-           to the requirement of studying the potential inferences caused
ple gas first passes through a PTFE filter membrane (25 µm         by ambient NO and NO2 . NO (1 ppmv) and NO2 (10 ppmv)
thickness, 4.6 cm diameter, and 2.5 µm pore size, Typris,          bottle gases were connected to the multigas calibrator. An
China) to remove ambient aerosols. The sample gas enters           ozone monitor was used to detect O3 levels in these exper-
the system through a 1/4 in. PFA (polytetrafluoroethylene)         iments (49i, Thermo Fisher Scientific, Inc., USA). A NOx
tube and is then divided into three channels (NO2 channel,         monitor was used to detect NO and NO2 levels in these ex-
AN channel, and PN channel) by using two T-shaped PFA              periments (42i, Thermo Fisher Scientific, Inc., USA). Pure
three-way connections. The gas flow at the end of each chan-       N2 (> 99.9999 %) and He (> 99.9999 %) bottle gases were
nel is controlled at 0.8 L min−1 , and the total flow rate (sam-   used to calibrate the mirror reflectivity of the CEAS and to
ple flow gas and purge gas) is 2.6 L min−1 maintained by           purge the mirrors.
mass flow controllers and a diaphragm pump.
   The quartz tubes have a length of 35 cm, which have an          2.3   Box model
inner diameter of 5 mm and an outer diameter of 10 mm and
                                                                   A box model was established to mimic the experimental re-
are connected to the system through a 10 mm to 6.35 mm
                                                                   sults and study the potential interferences of NO and NO2 in
(1/4 in.) PTFE connection. The quartz tubes of the AN chan-
                                                                   the PN and AN measurements. The chemical mechanism is
nel and the PN channel are heated by resistance wires, and
                                                                   based on previous work (Thieser et al., 2016). These reac-
temperature is controlled by the PID algorithm. An asbestos
                                                                   tions during the pyrolytic process in the box model are listed
sleeve on the quartz tube surface is used to insulate heat ex-
                                                                   in Text S1 in the Supplement, and the reaction rate of these
change with the external environment. The heating powers
                                                                   reactions is mainly taken from the Master Chemical Mech-
of the PN channel and AN channel are approximately 20
                                                                   anism, MCM v3.3 (website: http://mcm.leeds.ac.uk/MCM,
and 50 W, respectively. The length of the heating module is
                                                                   last access: March 2020) (Jenkin et al., 1997; Saunders et al.,
15 cm. According to the pyrolytic efficiency experiment (see
                                                                   2003). As the wall loss has an important effect on the lifetime
Sect. 3.4 for details), the heating temperatures for the AN
                                                                   of free radicals, we set the wall loss constant (kwall ) of RO2
and PN channels are controlled at 380 and 180 ◦ C, respec-
                                                                   to 0.3 s−1 (Thieser et al., 2016; Wooldridge et al., 2010). The
tively. One CEAS is used to detect the NO2 absorption of
                                                                   wall loss rate coefficients of HO2 and OH are selected as the
different channels to reduce the cross interference due to the
                                                                   values of 0.5 and 5.4 s−1 , respectively (Fuchs et al., 2008).
difference of multidetectors. A solenoid valve is connected
                                                                   The residence time of the sampling gas in each channel is
behind the quartz tube of each channel. At the same time, a
                                                                   calculated by considering the temperature distribution. The
time relay is used to periodically control the three T-shaped
                                                                   time step of the model is set to 0.001 s.
solenoid valves (71335SN2KVJ1, Parker Hannifin, USA),
and the internal surface of the T-shaped solenoid valves is
stainless steel. Each channel has the same constant flow rate
regardless of whether the sampling air draws into the CEAS
or vent. At the end of the channels, mass flow controllers are
used to restrict the flow rate.

Atmos. Meas. Tech., 14, 4033–4051, 2021                                             https://doi.org/10.5194/amt-14-4033-2021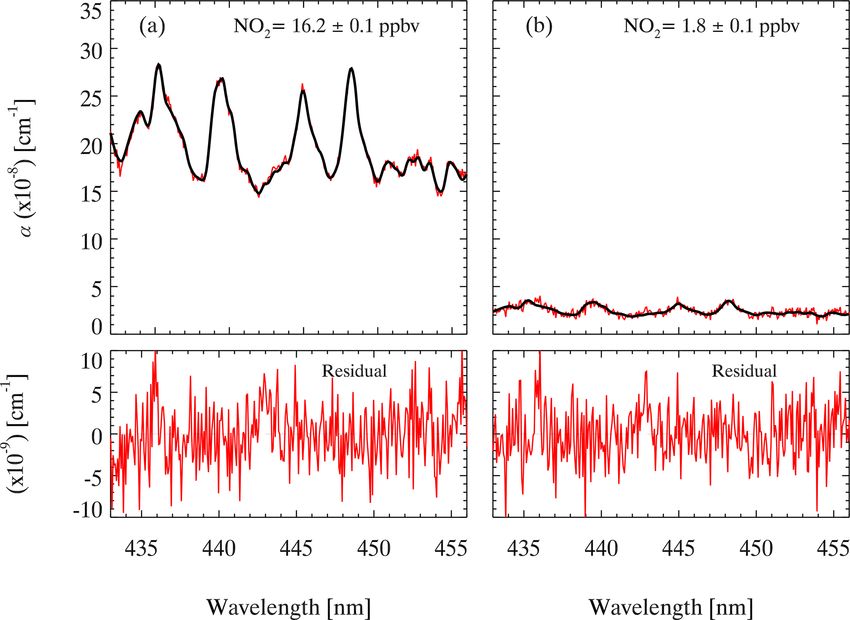
C. Li et al.: Thermal dissociation cavity-enhanced absorption spectrometer                                                                    4037

Figure 2. Mirror reflectivity and optical path length calibrated by
He (> 0.99999) and N2 (> 0.99999). The red line is the average
R(λ), and the blue line is the optical path length.

3     Instrument characterization

3.1    Mirror reflectivity

The spectra of pure N2 (> 0.99999) or He (> 0.99999) filling
the cavity through the purge lines are collected to calibrate
the mirror reflectivity, as the Rayleigh scattering section of
the two is significantly distinct; therefore, R(λ) can be cali-
brated according to Eq. (2) (Chen and Venables, 2011; Min
et al., 2016).                                                              Figure 3. The results of the effective cavity length. (a) The black
                                                                            line represents the flow rate, and the red points and brown dia-
R (λ) = 1d                                                                  monds represent the retrieved NO2 concentration with and without

     IN2 (λ) × nN2 × σRayl,N2 (λ) − IHe (λ) × nHe × σRayl,He (λ)            nitrogen purge (100 sccm ×2), respectively. (b) The relationship be-
 ×                                                                ,
                         IHe (λ) − IN2 (λ)                                  tween the ratio of the effective cavity length (deff ) to cavity physical
                                                                      (2)   distance (L) and the sampling flow rate.

where d is the distance between two high-reflectivity mir-
rors, λ is the wavelength, IN2 (λ) and IHe (λ) are spectra ob-
tained when the cavity is filled with pure N2 and He, respec-
tively, nN2 and nHe are the number densities calculated at                  NO2 standard source (130 ppbv) under two experimental set-
the measurement temperature and pressure in the cavity, re-                 tings with or without purging and then used Eq. (1) to cal-
spectively, and σRayl,N2 (λ) and σRayl,He (λ) are the Rayleigh              culate deff . The ratio of NO2 absorption with and without
scattering sections of N2 and He, respectively (Shardanand,                 purging is equal to the ratio of the effective cavity length
1977; Sneep and Ubachs, 2005). Figure 2 shows the average                   to the physical distance L between the mirrors (deff /L). A
of the mirror reflectivity calibration results. R(λ) is above               NO2 stand was prepared from a bottled standard (5 ppmv
0.9999 at 435–465 nm and up to 0.99992 at 450 nm. The to-                   NO2 ) and diluted with high-purity N2 in a multigas cali-
tal uncertainty of the mirror reflectivity is 5 %, which comes              brator (146i, Thermo Fisher Scientific, Inc., Waltham, MA,
from the uncertainty in the scattering section of N2 . The blue             USA). As shown in Fig. 3a, the retrieved concentration of
line is the average optical path length when the sampling flow              NO2 shows a general positive correlation trend with the flow
rate in the cavity is 0.8 L min−1 , which is equal to deff /(1−R)           rate with N2 purging; the concentration of NO2 is 130 ppbv
(deff is 31.84 cm), with a value up to 5.2 km at 450 nm.                    without a purge. The deff /L at different sampling flow rates
                                                                            is shown in Fig. 3b. The ratio of the effective cavity length in-
3.2    Effective cavity length                                              creases as the flow rate increases, suggesting the importance
                                                                            of airflow rate stability during sampling. The uncertainty of
The effective length of the absorbers (named effective cav-                 the prepared NO2 standard source is estimated to be 2.0 %,
ity length, deff ) in the detection cell is shorter than the phys-          while the uncertainty of the NO2 absorption cross section is
ical distance of the cavity with purge; thus, it needs to be                4.0 %, according to Voigt et al. (2002). As a result, the total
calibrated. We performed concentration determination on the                 uncertainty of deff calibration is 4.5 % (Voigt et al., 2002).

https://doi.org/10.5194/amt-14-4033-2021                                                        Atmos. Meas. Tech., 14, 4033–4051, 2021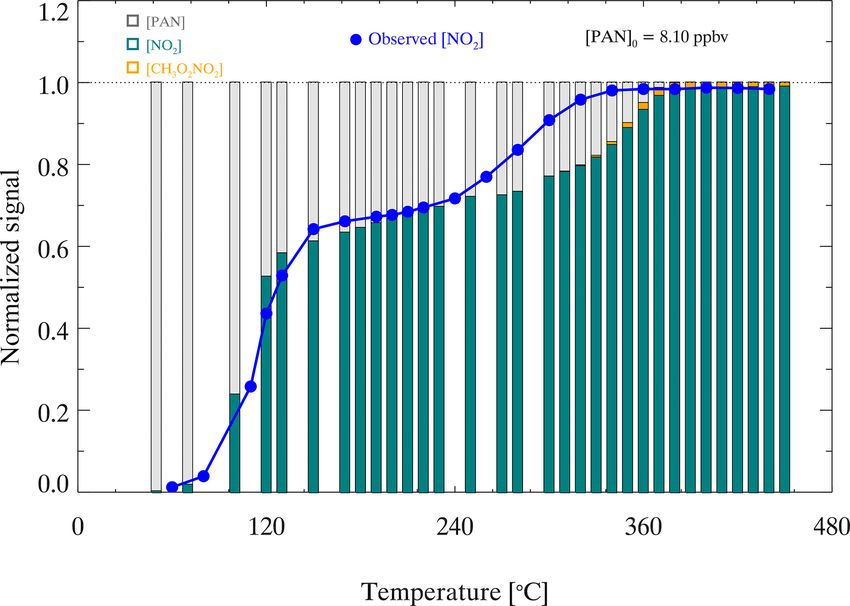
4038 C. Li et al.: Thermal dissociation cavity-enhanced absorption spectrometer
3.3 Spectral fitting
The absorption cross section of NO2 measured by Voigt et
al. (2002) is used to retrieve the NO2 concentration in this
study. The absorption cross section of NO2 between 435–
455 nm is selected to perform the spectral fitting. It has been
reported that the NO2 cross section is not sensitive to tem-
perature changes (Vandaele et al., 2002; Voigt et al., 2002);
therefore, convolution is only performed for our instrument
setup at ambient temperature. The peak at 436.2 nm of the Hg
spectrum measured by the spectrometer is used to generate a
wavelength-dependent instrument slit function that accounts
for the change in spectral resolution over the CCD pixels.
The convoluted cross section of NO2 is shown in Fig. S1.
The measured absorption coefficient (α) is processed by the
DOASIS (differential optical absorption spectroscopy intelli- Figure 4. An example of the spectral fit for an extinction spectrum
gent system). The fitting shift is constrained within ±0.2 nm. measured (6 s average) during field measurements. The fitted results
Glyoxal has strong absorption in the same optical window of NO2 are shown, and the total fit result and the residual at high
(Liu et al., 2019; Min et al., 2016; Thalman et al., 2015; concentrations (a) and low concentrations (b) are shown.
Thalman and Volkamer, 2010; Washenfelder et al., 2008), but
here we do not take glyoxal absorption into consideration in
the spectral fitting. The inclusion of glyoxal in the spectral
fitting would enlarge the fitting residual. Our field measure-
ments showed that the uncertainty caused by excluding gly-
oxal fitting was approximately 4 % (Fig. S2). Figure 4 shows
two examples of the spectral fitting of the measured absorp-
tion of high and low NO2 at a 6 s integration time during the
ambient measurement. The retrieved mixing ratios of NO2
were 16.2 ± 0.1 and 1.8 ± 0.1 ppbv, respectively. The cor-
responding fitting residual, which is the difference between
the measured and fitting results, is in the range of 10 × 10−9
at 435–455 nm. A typical measurement sequence during the
ambient measurement is illustrated in Fig. 5, which displays
NO2 mixing ratios of three channels alternatively. The mix-
ing ratio of NO2 in different channels is detected periodi-
Figure 5. An example of typical measurements performed in a field
cally, and there are several transitional points due to switch-
study with a 6 s spectrum integral time. A measurement cycle in-
ing measurement phases. Therefore, we excluded the transi- cludes three phases whose duration is 60 s. The red points denote
tion point of each phase and the two data points before and the NO2 mixing ratio measured in the AN channel ([NO2 ] 380 ◦ C),
after the transition point to avoid measurement error. As we the blue points denote the NO2 mixing ratio measured in the PN
discuss later, the mixing ratio of ANs and PNs can be cal- channel ([NO2 ] 180 ◦ C), and the black points denote the NO2 mix-
culated by subtracting the NO2 mixing ratio measured from ing ratio measured in the reference channel ([NO2 ] ambient tem-
different channels. perature).
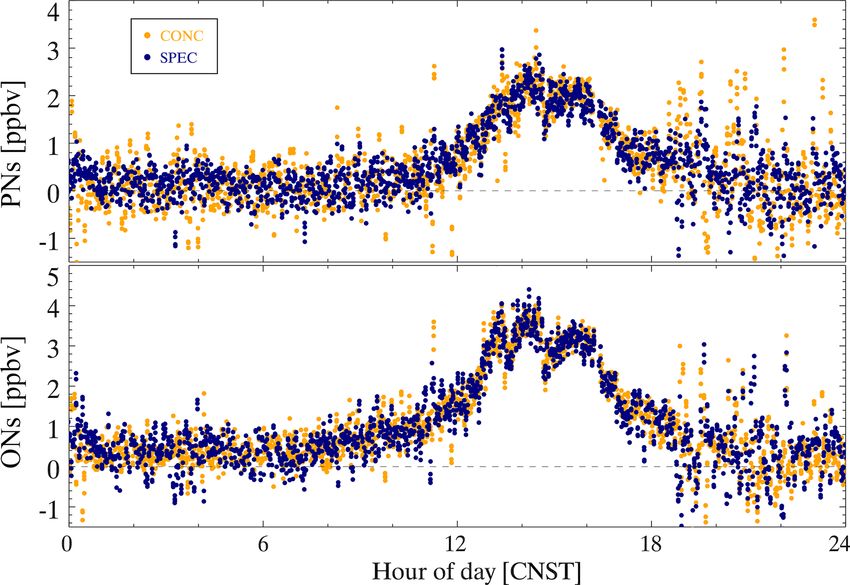
There are two methods to determine the mixing ratio of
ONs and PNs. One is the differential concentration method
(“CONC”). As shown in Eqs. (3)–(6), the I0 is fixed during is the differential absorption method (“SPEC”), by using the
data analysis by using the N2 spectrum: ITD380 and ITD180 dynamic background spectrum method for spectral fitting
are the spectra obtained when the CEAS detects the AN (Eqs. 7–8): IREF is the spectrum obtained at the reference
channel and PN channel, respectively; IN2 is the N2 spec- channel, ONs can be retrieved based on ITD380 and IREF , and
trum obtained when the cavity is filled with N2 (> 0.99999); PNs can be retrieved by ITD180 and IREF . An intercomparison
αTD380 and αTD180 are absorption coefficients when setting of field measurements shows that the SPEC method results
IN2 as I0 , and setting ITD380 or ITD180 as I , respectively; and in fewer outliers (Fig. 6). For the SPEC method, the shift
after deleting the abnormal points caused by phase switch- and squeeze of the spectrum is performed only once during
ing, [ONs] is obtained by subtracting [NO2 ]TD380 from the the spectral fitting, which reduces the uncertainty caused by
average of [NO2 ]REF , and [PNs] is obtained by subtracting the second spectral fitting. Therefore, we selected the SPEC
[NO2 ]TD180 from the average of [NO2 ]REF . The other method method to retrieve the concentrations of NO2 , PNs, and ANs
Atmos. Meas. Tech., 14, 4033–4051, 2021 https://doi.org/10.5194/amt-14-4033-2021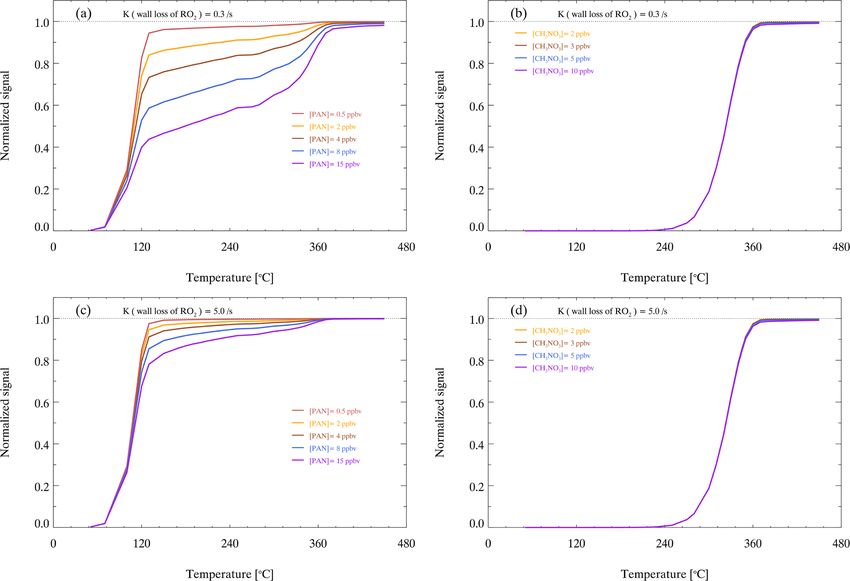
C. Li et al.: Thermal dissociation cavity-enhanced absorption spectrometer                                                  4039

                                                                  nal of thermal dissociation of PAN reaches the final plateau
                                                                  once the temperature is above 360 ◦ C. Similarly, PAN is re-
                                                                  ported to be thermally dissociated completely at approxi-
                                                                  mately 400 ◦ C (Friedrich et al., 2020). The presence of alkyl
                                                                  nitrates in the PAN source has been reported before by pre-
                                                                  vious studies and was regarded as the reason for the dual-
                                                                  plateau profile of PN dissociation (Paul et al., 2009). Here,
                                                                  we cannot rule out the possibility of alkyl nitrate impurities.
                                                                  However, the source level of PAN is equal to 92 ± 3 % of
                                                                  NOx input, suggesting only a very small percentage (≤ 8 %
                                                                  on average), if any, of ANs. If the PAN source is equal to
                                                                  4 ppbv in the PN channel at 180 ◦ C, as Fig. S3 shows, PAN
                                                                  will first dissociate completely, and then PAs will recombine
                                                                  with NO2 to form PAN when the airflow passes through the
                                                                  cooling lines.
Figure 6. An example of the calculation results of the fixed I0
                                                                     To further study the thermal dissociation of organic ni-
(“CONC”) and dynamic I0 (“SPEC”) methods performed in the
field measurements. Orange points represent the results of the    trates in the heated channels, box model simulations were
CONC method, and dark blue points represent the calculation re-   conducted to reproduce the response relationship between
sults of the SPEC method.                                         heating temperature and NO2 generated by pyrolysis. If the
                                                                  PAN source is equal to 4 ppbv in the PN channel at 180 ◦ C,
                                                                  as Fig. S3 shows, PAN will first dissociate completely, and
in the following data processes.                                  then PAs will recombine with NO2 to form PAN when the

             ITD380

                           1 − R (λ)
                                                                 airflow passes through the cooling lines. As shown in Fig. 7,
αTD380 =            −1                                     (3)    PAN gradually transforms into NO2 and CH3 O2 NO2 as the
              I N2            deff                                setting temperature increases. The simulated signals of ther-

             ITD180        1 − R (λ)                              mal dissociation of PAN show two plateaus, which is gener-
αTD180 =            −1                                     (4)
              I N2            deff                                ally consistent with the experimental results. However, there
[ONs] = [NO2 ]TD380 − [NO2 ]REF                            (5)    are some differences from 260 to 360 ◦ C, which may come
                                                                  from simulation uncertainties such as the temperature profile
[PNs] = [NO2 ]TD180 − [NO2 ]REF                            (6)
                                                              in the heated channel, the follow-up reactions of PA radicals,
           ITD380       1 − R (λ)                                 and their reaction rates. The first plateau at 180 ◦ C is caused
α[ONs] =          −1                                       (7)
            IREF           deff                                   by the recombination of PAs and NO2 after the pyrolysis of

           ITD180       1 − R (λ)                                 PAN, and the time for recombination from the end of the tube
α[PNs] =          −1                                       (8)    to the inlet is 297 ms. Therefore, recombination cannot be ig-
            IREF           deff
                                                                  nored when the heating temperature plateau period indicates
                                                                  that almost all PAN is transformed into NO2 , which is due to
3.4   The efficiency of thermal dissociation                      the increase in the pyrolytic loss of PAs, and the pyrolysis of
                                                                  PAN is enhanced with increasing temperature.
For the pyrolytic measurement of organic nitrates, the ex-           The occurrence of the dual-plateau phenomenon is due
act temperature setting for complete pyrolysis varies, mainly     to the competition of pyrolysis and recombination reactions.
due to the many factors that affect the efficiency of thermal     PAN will produce NO2 and PAs after thermal dissociation,
dissociation, such as the specificity of the quartz tube, the     but PAs will recombine with NO2 if PAs are not lost on the
heating residence time, and the temperature distribution of       wall surface in time (Reactions R7–R8). Therefore, the ther-
the heating part (Womack et al., 2017). The thermal dissoci-      mal curve shows two plateaus as the heating temperature in-
ation of PAN was tested separately in the PN channel and AN       creases. The concentration of PAN source and wall loss rate
channel, and the efficiency curves were the same. The heat-       of RO2 influence the fraction of related species. Figure 8a
ing temperature is the temperature of the quartz tube surface     and c show that the gap between the two plateaus increases
rather than the airflow temperature in the quartz tube. The       with PAN concentration and decreases as the wall loss rate
experiments were performed under normal sampling condi-           coefficients of RO2 increase. The wall loss of RO2 competes
tions, and the heating temperature was evaluated from room        with the recombination of PA radicals and NO2 . Therefore,
temperature to 440 ◦ C to determine the appropriate heating       a high wall loss rate coefficient of RO2 reduces the recombi-
temperature. Figure 7 shows that the pyrolysis of PAN starts      nation for PAN.
when the heating temperature is approximately 50 ◦ C. The            The consistency between the observed and simulated ther-
curve seems to reach a plateau when the heating tempera-          mal efficiencies of PAN suggests that the model simulation
ture is approximately 180 ◦ C. However, the normalized sig-       is reliable. Without the AN source to quantify the thermal

https://doi.org/10.5194/amt-14-4033-2021                                            Atmos. Meas. Tech., 14, 4033–4051, 2021
4040 C. Li et al.: Thermal dissociation cavity-enhanced absorption spectrometer
S6, the filter loss and sampling tube are negligible. The trans-
mission efficiency for PAN is > 97 % if there is a fresh filter
membrane in the holder. We propose that changing the filter
once a day can ensure a high transmission efficiency of the
species to be detected. However, isoprene nitrates are prone
to hydrolysis (Vasquez et al., 2020), which is more likely to
be lost during sampling. We have no evaluation of the sam-
pling loss of isoprene nitrates, and the wall loss of isoprene
nitrates is likely to be reduced by increasing the frequency of
filter changes. In the heated channels, organic nitrates will be
thermally dissociated to produce NO2 , but some simultane-
ous reactions will affect the NO2 mixing ratio. The potential
interferences mainly come from the following reactions: for-
mation of NO2 via NO and O3 , pyrolysis of O3 , reactions
of organic radicals with NO and NO2 , and pyrolysis of other
Figure 7. Normalized signals of thermal dissociation of PAN. The reactive nitrogen oxides.
blue points represent the normalized signal of the observed NO2 The formation of NO2 in a dark reaction between NO
mixing ratio during thermal dissociation. The histogram represents and O3 should be considered in NO2 measurements. If
the simulated distribution of thermal dissociation products at dif- the reaction has continued for a certain time (t) dur-
ferent temperatures, in which the gray, green, and orange columns ing sampling, the amount of NO2 formed [NO2 ]t can be
represent PAN, NO2 , and CH3 O2 NO2, respectively.
calculated: [NO2 ]t = k×[NO] × [O3 ] × t, where k is the
rate coefficient for Reaction (R4) and is given as 2.07 ×
10−12 exp(−1400/T ) cm3 molecule−1 s−1 (Atkinson et al.,
efficiency of ANs, we try to use the model simulation to de-
2004). According to the temperature distribution and airflow
termine the heating temperature of the AN channel. Based on
temperature measurements changing with the distance after
the same parameter settings of the model, MeN (methyl ni-
the heating quartz tube, the heated channel temperature pro-
trate, CH3 NO3 ) is selected as the representative ANs to sim-
files under normal sampling are shown in Fig. S7. Based on
ulate the pyrolytic efficiency curve. Figure 8b and d show
the temperature profile, the reaction of NO and O3 in the
that MeN can be totally thermally dissociated when the tem-
three channels can be calculated. As the residence time of
perature is over 380 ◦ C, indicating that a temperature set to
airflow in the three channels is short and similar (0.806 s in
380 ◦ C for the AN channel is reasonable. The simulation also
the reference channel, 0.697 s in the AN channel, and 0.730 s
showed that the two factors have almost no effect on the py-
in the PN channel), the simulation results show that the in-
rolysis of MeN, which is completely pyrolyzed to produce
ference is small. For example, during an ozone pollution day
NO2 when the temperature is 380 ◦ C. The simulation results
with O3 = 100 ppbv, NO = 2 ppbv, and NO2 = 5 ppbv, the
agree with previous reports about the temperature setting of
NO2 produced by the reaction of NO and O3 in the reference
thermal dissociation of ANs, with a range from 350 to 450 ◦ C
channel is 0.07 ppbv, corresponding to 1.3 % of atmospheric
(Day et al., 2002; Sadanaga et al., 2016; Sobanski et al.,
NO2 . Similarly, the interferences in the AN channel and PN
2016; Thieser et al., 2016). Therefore, 180 and 380 ◦ C are
channel are 0.14 ppbv (2.7 % of NO2 ) and 0.10 ppbv (2.0 %
selected as the heating temperatures of the PN channel and
of NO2 ), respectively. The interferences are within 3 % in
AN channel, respectively. In addition, the interference of in-
the typical case, which is smaller than the uncertainty of the
complete dissociation for PAN in the PN channel at 180 ◦ C
NO2 measurement. Therefore, the interference is ignored in
is considered in the lookup table for correction, which is de-
the measurement correction.
tailed in Sect. 4.1.
The thermal degradation of O3 occurs at high tempera-
tures, which reduces NO2 to NO via O(3 P) (Reactions R5–
4 Results and discussion R7). Interference has been ignored before in the process of
PN and AN pyrolysis (Day et al., 2002). However, subse-
4.1 Measurement interference quent studies have shown that the reaction can cause sig-
nificant negative deviations in the measurements of NO2 at
Previous studies have shown that the filter losses and wall higher temperatures, and the degree of interference is closely
losses of NO2 , PNs, and ANs are small when using Teflon related to the temperature change of the pyrolytic module
tubes and Teflon filters (Paul et al., 2009; Thieser et al., (Lee et al., 2014; Thieser et al., 2016). To determine the re-
2016). As shown in Fig. S4, the response to concentration duction reaction effect, we performed experiments in which
changes of PAN was nearly instantaneous under normal sam- NO2 was detected in three different channels when various
pling, suggesting that the memory effects on the inlet and amounts of NO2 and O3 were added. The experimental re-
cavity tubing were insignificant. As shown in Figs. S5 and sults are shown in Table 1 with various amounts of NO2
Atmos. Meas. Tech., 14, 4033–4051, 2021 https://doi.org/10.5194/amt-14-4033-2021C. Li et al.: Thermal dissociation cavity-enhanced absorption spectrometer 4041
Figure 8. Model-simulated thermal decomposition profiles of PAN and MeN with different amounts of PAN or MeN under different wall
loss rate coefficients of RO2 . Panels (a) and (b) show the NO2 signals of PAN and MeN when the wall loss rate coefficient of RO2 is 0.3 s−1 .
Panels (c) and (d) show the NO2 signals of PAN and MeN when the wall loss rate coefficient of RO2 is 5 s−1 .
Table 1. Measurements of the NO2 mixing ratio in three channels of the TD-CEAS with different added amounts of NO2 and O3 .
Order [NO2 ] [O3 ] [O3 ] × [NO2 ] [NO2 ]TD380 [NO2 ] − [NO2 ]TD380
[ppbv] [ppbv] [ppbv × ppbv] [ppbv] [ppbv]
0 7.45 ± 0.27 48.19 359 7.79 ± 0.27 −0.34
1 7.89 ± 0.27 67.47 532 8.17 ± 0.28 −0.28
2 15.58 ± 0.29 48.19 751 15.84 ± 0.28 −0.26
3 8.23 ± 0.27 96.38 793 8.22 ± 0.28 0.01
4 15.77 ± 0.25 67.47 1064 15.94 ± 0.27 −0.17
5 8.43 ± 0.27 144.57 1218 8.64 ± 0.28 −0.21
6 16.18 ± 0.28 96.38 1559 16.20 ± 0.28 −0.02
7 16.28 ± 0.30 144.57 2354 16.26 ± 0.31 0.02
and O3 added. No significant NO2 mixing ratio difference interference.
was observed between the reference and AN channels. We
showed negligible interference here, which is different from
previous reports (Lee et al., 2014; Thieser et al., 2016). This
is likely caused by the much lower temperature setting of our NO + O3 → NO2 (R4)
AN measurement channel. Since the pyrolytic rate constant O3 → O + O2 (R5)
of O3 is highly temperature-dependent, the lower tempera- O + O2 + M → O3 + M (R6)
ture would largely reduce the level of O atoms as well as this
O + NO2 → O2 + NO (R7)
https://doi.org/10.5194/amt-14-4033-2021 Atmos. Meas. Tech., 14, 4033–4051, 20214042 C. Li et al.: Thermal dissociation cavity-enhanced absorption spectrometer
The RO2 recombines with NO2 or reacts with NO to inter-
fere with the measurement of ANs and PNs. Taking PAN as
an example, organic radicals may trigger interference, as de-
scribed below (Reactions R8–R15). The PAs produced af-
ter thermal dissociation of PAN (Reaction R8) can recom-
bine with NO2 (Reaction R9). PAs can oxidize NO to pro-
duce NO2 while generating another organic radical (Reac-
tion R10). CH3 O2 can further initiate a series of reactions
that affect the distribution of NO2 (Reactions R11–R15).
Therefore, the lifetime and fate of PAs generated by PAN
pyrolysis will cause interference, and atmospheric NO and
NO2 will affect the degree of measurement interference.
CH3 C(O)O2 NO2 + M → CH3 C(O)O2 + NO2 + M (R8)
CH3 C(O)O2 + NO2 + M → CH3 C(O)O2 NO2 + M (R9)
CH3 C(O)O2 + NO(+O2 ) → NO2 + CH3 O2 + CO2 (R10)
CH3 O2 + NO → 0.999 × (CH3 O + NO2 )
+ 0.001 × CH3 O2 NO2 (R11)
CH3 O → HCHO + HO2 (R12)
CH3 O2 + NO2 → CH3 O2 NO2 (R13)
HO2 + NO → OH + NO2 (R14)
OH + NO2 → HNO3 (R15)
CH3 NO3 → CH3 O + NO2 (R16)
A set of laboratory experiments was conducted to measure
the interference in PN channels with different NO, NO2 , and
PAN levels. Figure 9a shows the measured and simulated re-
sults of different PAN concentrations mixed with different Figure 9. Simulated (lines) and measured (points) differences be-
concentrations of NO. With the increase in NO added, the de- tween the NO2 signal in the PN channel and reference channel for
tected PN mixing ratio (the signal difference between the PN different PAN samples with different added amounts of NO (a) and
channel and REF channel) also gradually increased. More NO2 (b). The error bars show 1 standard deviation.
NO reacted with PA radicals generated during thermal disso-
ciation to produce additional NO2 within the residence time
in the PN channel, which led to measurements higher than
ments can be corrected. In the field measurements, the cor-
the PAN source level. In contrast, as shown in Fig. 9b, the
rection factor refers to the ratio between the real value and the
measured PNs were lower than the PAN source level when
measured value of PNs. For example, in a typical case dur-
NO2 was added to the source, and the bias increased with the
ing field measurements where PNs = 3 ppbv, NO = 8 ppbv,
increase in NO2 added. The addition of NO2 to the system
and NO2 = 5 ppbv, the difference between the PN channel
improves the overall concentration of NO2 in the PN chan-
and reference channel is equal to 4.54 ppbv (equivalent to the
nel, promoting regeneration to PAN.
measured PNs), which requires a correction factor of 0.66.
We conducted numerical simulations by a box model to
Here, nearly 40 000 simulations are performed under various
mimic observations and to check the chemical reactions in
initial concentrations of NO (0–70 ppbv), NO2 (0–60 ppbv),
the PN channel. Figure 9a shows that the simulations have
and PAN (0–10 ppbv) to obtain the correction factor lookup
good consistency with the experimental results under differ-
table for our first field measurement (detailed in Sect. 4.3).
ent NO levels. Figure 9b shows that the model can capture the
The correction factor (C1) for PN measurements in the PN
trend of experimental results on NO2 interferences, except in
channel can be determined from the lookup table according
the case of a PAN source of 4.5 ppbv, which may be due to the
to atmospheric NO and NO2 and the raw data of PN mea-
reaction of small excess RO2 in the PAN source line and ex-
surements using linear interpolation. According to Eq. (9),
tra NO2 added to the instrument to generate additional PAN
the corrected PN mixing ratios are derived by the raw PN
before sampling. Overall, these experiments proved that NO
measurements ([NO2 _180]) and C1.
and NO2 interfere with the measurement of PNs. However,
the agreement of the experimental and model results indi-
cates that the interference of NO and NO2 for PN measure- [PNs_real] = [NO2 _180] × C1 (9)
Atmos. Meas. Tech., 14, 4033–4051, 2021 https://doi.org/10.5194/amt-14-4033-2021C. Li et al.: Thermal dissociation cavity-enhanced absorption spectrometer 4043
periments with added NO2 showed underestimated measure-
ments of ONs, and the interference was significantly weak-
ened compared with that in the PN channel. We used the
same box model except for updating the temperature distri-
bution and the corresponding residence time in the AN chan-
nel to simulate the interference of NO or NO2 under different
PAN source levels. However, there are still some uncertain-
ties about the reaction mechanism and reaction rate for the
thermal dissociation of PAN at these high temperatures. We
performed sensitivity tests on the follow-up reactions of PAs,
similar to the simulation results of Thieser et al. (2016), and
found that the isomerization of PAs to CH2 C(O)OOH has a
great effect on the consistency of the experiments and simu-
lation results. If the reaction rate of the branching reaction is
set to zero, as shown in Fig. 10, the simulation results cap-
ture the trend well when NO2 or NO is added. Many fac-
tors affect the NO2 signal produced by the thermal dissoci-
ation of PAN; therefore, the mechanism scheme mentioned
above provides a reasonable assumption for the interference
process. Overall, the box model predicts the interference of
PAN measurement caused by NO and NO2 in the AN chan-
nel. Next, the correction factors (C2) of different cases un-
der various amounts of NO, NO2 , and PAN added in the AN
channel are simulated to form the second lookup table.
[PNs_real] [ANs_real]
[NO2 _380] = + (10)
C2 C3
The raw ON mixing ratio ([NO2 _380]) is determined by
the difference between the AN channel and reference chan-
Figure 10. Simulated (lines) and measured (points) differences be- nel based on the SPEC method. According to Eq. (10), it
tween the NO2 signal in the AN channel and reference channel is necessary to quantify the interference caused by ambi-
for different PAN sources with different amounts of NO (a) and ent NO/NO2 for AN measurements. Due to the lack of AN
NO2 (b). The error bars show 1 standard deviation.
sources, we use box models to study the interferences by set-
ting MeN as the representative ANs. Methyl nitrate is py-
rolyzed to produce NO2 and CH3 O in the AN channel (Re-
In the AN channel, the thermal dissociation of PA radicals action R16), and CH3 O is an important intermediate prod-
is rapid, and the regeneration of PAN is also suppressed at uct of the reactions of PAs (Reactions R10–R12). Therefore,
higher temperatures. Therefore, there is a different relation- the mechanism scheme regarding PAN applies to interfer-
ship between PANs and ambient NOx in the AN channel. ence simulations of NOx for AN measurements. Similarly,
Similar to PNs, the measurement of ANs could be affected by the different cases under various NO, NO2 , and MeN addi-
NOx . We derived the PNs corrected by C1 and [NO2 _180] as tions were simulated to form the third lookup table for the
mentioned above. To determine the corrected concentrations corrections of AN measurements in the AN channel. Accord-
of ANs as Eqs. (10)–(11) show, we need to apply another ing to Eq. (10), the raw concentration of ANs is the difference
correction factor (C2) to determine the contribution of PNs between the raw ON measurements ([NO2 _380]) and the sig-
to ONs, in which this is subtracted from the raw ON mea- nal contribution of PNs ([PNs_real] /C2) in the AN channel.
surement ([NO2 _380]), and finally the third correction fac- The correction factor (C3) is determined by the third lookup
tor (C3) is applied to obtain corrected AN measurements. table and then multiplied by [ANs] to obtain the corrected
Figure 10 displays the interference of NO and NO2 with AN mixing ratio ([ANs_C]) by Eq. (11).
the PAN measurements in the AN channel. The laboratory
experiments showed that the measured signal difference in-
[PNs_real]
creased with NO (Fig. 10a). Hence, the presence of NO still [ANs_real] = [NO2 _380] − × C3 (11)
C2
led to higher measurement results of ONs compared with
the source value. However, the interference was weakened In addition to the interference mentioned above, other ni-
compared with the measured results in the PN channel at the trogen compounds may undergo pyrolysis to generate NO2
same NO and PAN source levels (Fig. 9a). Similarly, the ex- in the heated channels, such as N2 O5 and ClNO2 (Li et al.,
https://doi.org/10.5194/amt-14-4033-2021 Atmos. Meas. Tech., 14, 4033–4051, 20214044 C. Li et al.: Thermal dissociation cavity-enhanced absorption spectrometer 2018; Thaler et al., 2011; H. Wang et al., 2017; Womack et al., 2017), which may be a source of uncertainty for measure- ments of organic nitrates at night and early morning. Interfer- ences can be extracted if the simultaneous measurements of N2 O5 and ClNO2 are available. 4.2 Uncertainty and detection limit The uncertainty of the CEAS measurement of NO2 is con- tributed by the absorption cross section, mirror reflectivity, effective cavity length, and spectral fitting. The absorption cross section of NO2 is taken from Voigt et al. (2002), whose uncertainty is approximately 4 % (Voigt et al., 2002); the un- certainty of mirror reflectivity is approximately 5 %, deter- mined by the error of the scattering cross section of N2 ; the uncertainty of effective cavity length is approximately 4.5 %; and the uncertainty of spectral fitting when omitting the cross section of glyoxal is 4 %. According to Gaussian error prop- agation, the associated uncertainty of the ambient NO2 mea- surement is ±9 % based on the above parameters. The preci- sion of the CEAS can be assessed by the Allan deviation and standard deviation (Duan et al., 2018; Langridge et al., 2008; H. Wang et al., 2017). Figure 11 shows the variance anal- ysis of 21077 continuously measured N2 spectra when the cavity was filled with N2 under purge. The integration time was 3 s, and the sampling time was 6 s, as every two spectra were averaged before saving. The first 100 N2 spectra col- lected were averaged as I0 , and all spectra were analyzed based on I0 . The dataset was divided into 300 gradients for Figure 11. Instrument performance with different integration times. Gaussian fitting, and 1σ was 97 pptv, as shown in Fig. 11a. (a) The standard deviation of the measurements of NO2 with a 6 s The 21 077 N2 spectra mentioned above were averaged at integration time. (b) Allan deviation plots for measurements of NO2 different time intervals (from 6 to 11 400 s), and then the Al- with a 6 s integration time. lan deviations at different time intervals were calculated. As shown in Fig. 11b, the Allan deviation decreases as the sam- pling time increases when the sampling time is smaller than CAPS, and CEAS are all cavity-enhanced techniques with 1300 s, and the minimum is 5 pptv. When the sampling time high sensitivity and time resolution, of which CRDS and is 6 s, the Allan variance can reach 90 pptv, close to 1σ . ANs CAPS have been applied to detect NO2 after ON pyroly- and PNs are detected by the same CEAS system and calcu- sis. Specifically, in this study, the ONs and PNs are deter- lated by the dynamic I0 (SPEC) method; therefore, their pre- mined directly through broadband absorption measurement cision is identical to the NO2 measurement. The uncertainty by CEAS, which can avoid the uncertainty caused by mul- of [ANs] and [PNs] mainly comes from spectral fitting to de- tiple spectral fitting and subsequent differential calculations. rive the concentration of NO2 and the interference correction Overall, TD-CEAS has a detection capacity similar to that in heated channels, which should be larger than 9 %. of TD-LIF and others. Recently, thermal dissociation per- As summarized in Table 2, there are several typical tech- oxy radical chemical amplification (TD-PERCA)-CRDS was nologies to measure organic nitrates based on the thermal developed to indirectly determine PNs by measuring NO2 dissociation method. TD-LIF is the pioneer to determine or- through chemical amplification, which also showed high sen- ganic nitrates by measuring NO2 produced through pyrolysis sitivity, but the technology for atmospheric measurements (Day et al., 2002), and the technology has been developed needs to be studied further. well and deployed in considerable campaigns (Di Carlo et al., 2013; Farmer et al., 2006). TD-LIF has a high time reso- 4.3 Performance in field observations lution and low detection limit, but the determination of NO2 has to rely on extra calibration. TD-CIMS has a similar lim- TD-CEAS deployed the first field observations in Xin- itation to TD-LIF, and the method can measure some indi- jin County, Chengdu, China, in 2019, referred to as the vidual species of PNs, which need corresponding standards CHOOSE campaign (Yang et al., 2020). As shown in Fig. S8, to be calibrated one by one (Slusher et al., 2004). CRDS, there is a residential area 5 km northwest of the site; the sur- Atmos. Meas. Tech., 14, 4033–4051, 2021 https://doi.org/10.5194/amt-14-4033-2021
C. Li et al.: Thermal dissociation cavity-enhanced absorption spectrometer                                                              4045

Table 2. Typical thermal dissociation methods to measure organic nitrates.

               Method             Targets       Time resolution    Detection limit    Accuracy          Reference
               TD-LIF             ANs, PNs      10 s               90 pptv            10 %–15 %         Day et al. (2002)
               TD-LIF             ANs, PNs      1s                 18.4, 28.1 pptv    22 %, 34 %        Di Carlo et al. (2013)
               TD-CIMS            PAN, PPN      1s                 7, 4 pptv          20 %              Slusher et al. (2004)
               TD-CRDS            ANs, PNs      1s                 100 pptv           6%                Paul et al. (2009)
               TD-CAPS            PNs, ONs      2 min              7 pptv             NA                Sadanaga et al. (2016)
               TD-CRDS            ANs, PNs      1s                 28 pptv            6 % + 20 pptv     Thieser et al. (2016)
               TD-CRDS            ANs, PNs      1s                 59, 94 pptv        8 % + 10 pptv     Sobanski et al. (2016)
               PERCA-CRDS         PNs, PAN      1s                 6.8, 2.6 pptv      13 %              Taha et al. (2018)
               TD-CEAS            ANs, PNs      6s                 90 pptv            9%                This work

Figure 12. Time series of the observed mixing ratios of PNs, ANs, and NO2 during ozone pollution from the CHOOSE campaign in 2019.
The yellow regions indicate the daytime period. (a) The black lines represent the raw measurements of PNs, and the red lines are the corrected
measurements of PNs according to the lookup table. (b) The blue lines represent the raw measurements of ANs, and the orange lines are the
corrected measurements of ANs according to the lookup tables. (c) Measurements of NO2 in the reference channel.

rounding area is lush with trees and is close to a forest park           significant than that of NO at this site. The tendency of C2
and a national wetland park; and there is an industrial park             and C3 was consistent with C1 during measurements, but the
approximately 12 km to the west and 8 km to the south. Dur-              daily changes of C2 and C3 were relatively smaller as the
ing the CHOOSE campaign, TD-CEAS was deployed in a                       sensitivity of interferences in the AN channel decreased, as
container. The sampling inlet protruded from the container               mentioned above. Figure 12c shows that NO2 constantly in-
top and was supported by a bracket with a height of 4 m                  creased at night, reaching a peak near the early morning and
above the ground. We determined the raw data of PNs and                  maintaining a high value to approximately 11:00 (UTC+8)
ONs during the observation period, and then the raw data                 local time. High mixing ratios of PNs were observed dur-
were corrected as mentioned above. Figure 12a shows the                  ing the measurement, and the diurnal variation of PNs was
time series of raw data and the corrected data of PNs from               clear. The peak of ANs appeared in the noontime and several
9 to 18 August during the CHOOSE campaign, and Fig. 12b                  hours before that of PNs. However, when the ambient NO2
shows the time series of AN measurements before and af-                  changed drastically at night during the campaign, the differ-
ter correction. The correction factors are shown in Fig. S9.             ence in NO2 between adjacent measurement phases in a cycle
The value of C1 was generally greater than 1.0 (except dur-              was great, resulting in unfeasible measurements (Fig. S10).
ing the morning), suggesting that the role of NO2 was more               Simultaneous measurements showed that the N2 O5 mixing

https://doi.org/10.5194/amt-14-4033-2021                                                     Atmos. Meas. Tech., 14, 4033–4051, 2021
You can also read