Denitrification in soil as a function of oxygen availability at the microscale
←
→
Page content transcription
If your browser does not render page correctly, please read the page content below
Biogeosciences, 18, 1185–1201, 2021
https://doi.org/10.5194/bg-18-1185-2021
© Author(s) 2021. This work is distributed under
the Creative Commons Attribution 4.0 License.

Denitrification in soil as a function of oxygen
availability at the microscale
Lena Rohe1 , Bernd Apelt1 , Hans-Jörg Vogel1 , Reinhard Well2 , Gi-Mick Wu3 , and Steffen Schlüter1
1 Helmholtz Centre for Environmental Research – UFZ, Department of Soil System Sciences, Theodor-Lieser Str. 4,
06120 Halle, Germany
2 Thünen Institute of Climate-Smart Agriculture, Bundesallee 65, 38116 Braunschweig, Germany
3 Helmholtz Centre for Environmental Research – UFZ, PACE, Permoserstraße 15, 04318 Leipzig, Germany

Correspondence: Lena Rohe (lena.rohe@ufz.de)

Received: 12 June 2020 – Discussion started: 17 July 2020
Revised: 27 November 2020 – Accepted: 21 December 2020 – Published: 16 February 2021

Abstract. The prediction of nitrous oxide (N2 O) and of dini-      distances combined with the small measurement volume of
trogen (N2 ) emissions formed by biotic denitrification in soil    the microsensors. The substitution of predictors by indepen-
is notoriously difficult due to challenges in capturing co-        dent, readily available proxies for O2 demand (SOM) and O2
occurring processes at microscopic scales. N2 O production         supply (diffusivity) reduced the predictive power consider-
and reduction depend on the spatial extent of anoxic con-          ably (60 % and 66 % for N2 O and (N2 O+N2 ) fluxes, respec-
ditions in soil, which in turn are a function of oxygen (O2 )      tively).
supply through diffusion and O2 demand by respiration in              The new approach of using X-ray CT imaging analysis to
the presence of an alternative electron acceptor (e.g. nitrate).   directly quantify soil structure in terms of ansvf in combina-
   This study aimed to explore controlling factors of com-         tion with N2 O and (N2 O + N2 ) flux measurements opens up
plete denitrification in terms of N2 O and (N2 O + N2 ) fluxes     new perspectives to estimate complete denitrification in soil.
in repacked soils by taking micro-environmental conditions         This will also contribute to improving N2 O flux models and
directly into account. This was achieved by measuring mi-          can help to develop mitigation strategies for N2 O fluxes and
croscale oxygen saturation and estimating the anaerobic soil       improve N use efficiency.
volume fraction (ansvf) based on internal air distribution
measured with X-ray computed tomography (X-ray CT). O2
supply and demand were explored systemically in a full
factorial design with soil organic matter (SOM; 1.2 % and          1   Introduction
4.5 %), aggregate size (2–4 and 4–8 mm), and water satura-
tion (70 %, 83 %, and 95 % water-holding capacity, WHC)            Predicting emissions of the greenhouse gas nitrous oxide
as factors. CO2 and N2 O emissions were monitored with gas         (N2 O) is important in order to develop mitigation strate-
chromatography. The 15 N gas flux method was used to esti-         gies. Agriculture accounts for approximately 60 % of anthro-
mate the N2 O reduction to N2 .                                    pogenic N2 O emissions, most likely because high numbers
   N gas emissions could only be predicted well when ex-           of substrates for N2 O-producing processes result from ni-
planatory variables for O2 demand and O2 supply were con-          trogen (N) fertilization on agricultural fields (Syakila and
sidered jointly. Combining CO2 emission and ansvf as prox-         Kroeze, 2011; Thompson et al., 2019; Tian et al., 2020).
ies for O2 demand and supply resulted in 83 % explained            The required process understanding is hindered since var-
variability in (N2 O + N2 ) emissions and together with the        ious microbial species are capable of N2 O production via
denitrification product ratio [N2 O / (N2 O + N2 )] (pr) 81 % in   several pathways, and these may co-exist due to different
N2 O emissions. O2 concentration measured by microsensors          micro-environmental conditions within short distances in soil
was a poor predictor due to the variability in O2 over small       (Hayatsu et al., 2008; Braker and Conrad, 2011). Denitrifica-
                                                                   tion is one of the major biological pathways for N2 O pro-

Published by Copernicus Publications on behalf of the European Geosciences Union.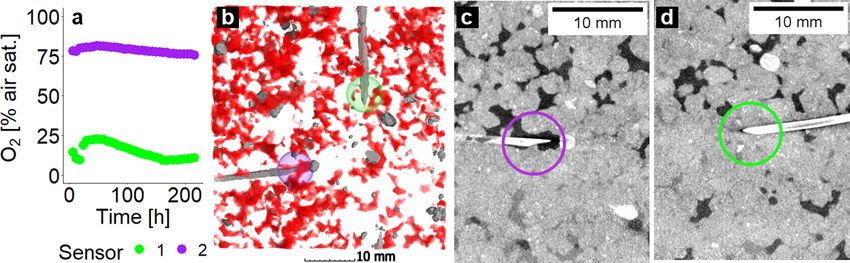
1186                             L. Rohe et al.: Denitrification in soil as a function of oxygen availability at the microscale

duction, which describes the reduction in nitrate (NO−     3 ) as   decrease due to N2 production, when diffusivity is extremely
the alternative electron acceptor into the trace gas nitrous ox-    low.
ide (N2 O) as an intermediate and molecular nitrogen (N2 )             Diffusivity is not routinely measured in denitrification
as the final product (Knowles, 1982; Philippot et al., 2007).       studies as it is more difficult to measure than air content or
Although it is well known that not all microbial species are        water saturation, but there are many empirical models to esti-
capable of performing a denitrification pathway, it is partic-      mate diffusivity based on air-filled pore volume (Millington
ularly widespread among bacteria, but also several fungi and        and Quirk, 1960, 1961; Moldrup et al., 1999; Deepagoda et
even archaea can denitrify (Shoun et al., 1992; Cabello et al.,     al., 2011). All of these metrics are only indirect metrics of
2004).                                                              the anaerobic soil volume fraction (ansvf) as direct measure-
   N2 O emissions from soils are often considered to be er-         ments are difficult to obtain. It is measured either locally via
ratic in nature due to their high variability in space and          oxygen sensors with needle-type microsensors (Sexstone et
time (Butterbach-Bahl et al., 2013). The low predictability         al., 1985; Højberg et al., 1994; Elberling et al., 2011) or with
is caused by the mechanisms that regulate microbial denitri-        foils (Elberling et al., 2011; Keiluweit et al., 2018), which re-
fication at the pore scale, which are concealed from measure-       quire averaging or extrapolating measured O2 saturation for
ment techniques that average across larger soil volumes. This       the entire soil volume. Or it is estimated for the entire sample
experimental study is designed to reveal the drivers of oxy-        volume from pore distances in X-ray computed tomography
gen (O2 ) supply and demand at the microscale that govern           (X-ray CT) images of soil structure assuming that there is a
microbial denitrification at the macroscale.                        direct relationship between pore distances and anaerobiosis
   In general, there are several controlling factors for micro-     (Rabot et al., 2015; Kravchenko et al., 2018).
bial denitrification in soil. Proximal factors, such as N and          Completeness of denitrification is another important con-
carbon (C), are needed to ensure the presence of electron           trolling factor that modulates the relationship between O2
acceptors and electron supply. In addition, the absence of          availability and N2 O emissions (Morley et al., 2014), which
oxygen is required to express the enzymes for the reduc-            has previously been neglected in similar incubation studies
tion in reactive nitrogen. Distal factors, i.e. physical and bio-   (Rabot et al., 2015; Porre et al., 2016; Kravchenko et al.,
logical factors like soil structure, soil texture, pH, or micro-    2018). Since the N2 background of air (78 %) is very high, di-
bial community, on the other hand affect the proximal fac-          rect N2 measurement from denitrification in soil is very chal-
tors (Groffman and Tiedje, 1988; Tiedje, 1988). The main            lenging (Groffman et al., 2006; Mathieu et al., 2006). The
physical controlling factors that regulate O2 supply are wa-        15 N-labelling technique is a method successfully applied to

ter saturation and soil structure because they determine the        determine N2 O and also N2 production from denitrification
pathways through which gaseous and dissolved oxygen but             from 15 N-amended electron acceptors (NO−      3 ) (Mathieu et al.,
also NO− 3 and dissolved organic matter may diffuse towards         2006; Scheer et al., 2020). Complete denitrification gener-
the location of their consumption. Likewise they determine          ates N2 as the final product, although it is assumed that 30 %
the pathways through which denitrification products may dif-        of denitrifying organisms lack the N2 O reductase (Zumft,
fuse away from these locations. In addition, both saturation        1997; Jones et al., 2008; Braker and Conrad, 2011). Thus
and soil structure contribute to the regulation of O2 demand        the denitrification product ratio [N2 O / (N2 O + N2 )] (pr) was
through their impact on substrate accessibility and thus mi-        found to be very variable in soil studies covering the whole
crobial activity (Keiluweit et al., 2016). Studies have shown       range between 0 and 1 (Senbayram et al., 2012; Buchen et
microbial activity, described by microbial respiration, to in-      al., 2016). Decreasing pr, i.e. relative increasing N2 fraction
crease with increasing water saturation, but it also decreased      compared to that of N2 O, was found with lower oxygen avail-
when water saturation exceeded a certain optimal value under        ability as a consequence of higher water saturations and den-
intermediate conditions (Davidson et al., 2000; Reichstein          itrification activities in soil (van Cleemput, 1998).
and Beer, 2008; Moyano et al., 2012). Low water saturation             In this paper, we reconcile all these metrics, i.e. soil struc-
causes C substrate limitations, whereas high water saturation       ture, bulk respiration, diffusivity, O2 distribution, ansvf, and
causes limited oxygen diffusion (Davidson et al., 2000). This       pr, to assess their suitability to predict denitrification activity.
observation goes along with an increase in anaerobic respi-         This requires well-defined laboratory experiments that either
ration in microbial hot spots when O2 demand exceeded O2            control or directly measure important distal controlling fac-
supply, and denitrification is favoured (Balaine et al., 2015).     tors of denitrification activity like microbial activity, anaero-
   These physical processes that govern denitrification at the      bic soil volume, and denitrification completeness.
microscale have to be effectively described by macroscopic             To this end the current study presents a comprehensive ex-
bulk soil properties in order to improve the predictability of      perimental set-up with well-defined experimental conditions
denitrification activity at larger scales. It has been shown re-    but also microscale measurements of oxygen concentrations,
peatedly that soil diffusivity can be used to predict the im-       soil structure, and the air and water distribution at the pore
pact of O2 supply on N2 O and N2 emissions (Andersen and            scale. The 15 N tracer application was used to estimate the
Petersen, 2009; Balaine et al., 2016). First N2 O emissions in-     N2 O reduction to N2 and the N2 O fraction originating from
crease with decreasing diffusivity, but then they dramatically      denitrification. To our knowledge this is the first experimen-

Biogeosciences, 18, 1185–1201, 2021                                                     https://doi.org/10.5194/bg-18-1185-2021
L. Rohe et al.: Denitrification in soil as a function of oxygen availability at the microscale                                1187

tal set-up analysing N2 O and (N2 O + N2 ) fluxes in combina-       ing into two different aggregate size fractions in order to in-
tion with X-ray-CT-derived structure. Other important fac-          duce variations in O2 supply: small (2–4 mm) and large (4–
tors controlling denitrification like temperature, pH, nitrate      8 mm). Care was taken to remove free particulate organic
limitation, saturation changes, microbial community struc-          matter (POM) like plant residues and root fragments during
ture, or plant–soil interactions were either controlled or ex-      sieving. Other aggregate size classes were not considered as
cluded in this study.                                               sieving yielded too low an amount of larger aggregates that
   The general objective of the present study is to systemati-      contained too much irremovable POM, whereas smaller ag-
cally explore bulk respiration and denitrification as a function    gregate classes resulted in too fragmented a pore space at the
of O2 supply and demand in repacked soils under static hy-          chosen scan settings.
draulic conditions. O2 demand was controlled by incubating             The soil material was pre-incubated at 50 % water-holding
soils with different soil organic matter (SOM) content. O2          capacity (WHC) for 2 weeks to induce microbial activity af-
supply was controlled by different water saturations and dif-       ter the long dry spell and let the flush in carbon mineraliza-
ferent aggregate sizes. A novel approach is explored to assess      tion pass that occurs after rewetting the soil. Three different
microscopic O2 supply directly from ansvf estimates based           saturation treatments were prepared for subsequent incuba-
on the distribution and continuity of air-filled pores within       tion experiments (70 %, 83 %, and 95 % WHC) to control the
the wet soil matrix.                                                O2 supply and thus provoke differences in denitrification ac-
   We hypothesize that the combination of at least one proxy        tivity. A 15 N solution was prepared by mixing 99 at. % 15 N–
for O2 supply (e.g. ansvf, diffusivity, air content) and one for    KNO3 (Cambridge Isotope Laboratories, Inc., Andover, MA,
O2 demand (CO2 production) is required to predict complete          USA) and unlabelled KNO3 (Merck, Darmstadt, Germany)
denitrification (N2 O + N2 ), whereas pr as a proxy for den-        to reach 50 mg N kg−1 soil with 60 at. % 15 N–KNO3 in each
itrification completeness is required in addition to predict a      water saturation treatment. Hence, for the two higher water
single component (N2 O). The specific aims of our study were        saturations the stock solution was more diluted in order to
(a) to investigate the potential of microscopic metrics for O2      reach the same target concentration in the soil. In a first step
supply, such as ansvf to predict complete denitrification ac-       the soil was adjusted to 70 % WHC before packing.
tivity, and (b) to explore the extent to which a substitution          This 15 N-labelled soil was filled in 2 cm intervals into
of these predictors by classical, averaged soil properties re-      cylindrical PVC columns (9.4 cm inner diameter × 10 cm
quired for larger-scale denitrification models is acceptable.       height) (Fig. 1) and compacted to a target bulk density that
                                                                    corresponded to site-specific topsoil bulk densities (Jäger et
                                                                    al., 2003; John et al., 2005). Packing in five vertical inter-
2     Materials and methods                                         vals achieved a uniform porosity across the column. How-
                                                                    ever, there were inevitable porosity gradients within intervals
2.1    Incubation                                                   (Fig. S4 in the Supplement) that affected the air and water
                                                                    distribution and thus air continuity at high water saturations.
Fine-textured topsoil material was collected from two differ-       This packing resulted in 902 and 694 g dry weight of RM and
ent agricultural sites in Germany (from a depth of 10–20 cm         GI soil, respectively. For the latter two saturation levels, the
in Rotthalmünster (RM) and 3–15 cm in Gießen (GI) as rep-           rest of the NO− 3 solution was sprayed sequentially onto each
resentatives for agricultural mid-European soils; Table 1).         layer after packing. The incubation of such repacked soils in-
To our knowledge, N2 O field measurements only exist for            stead of intact soil columns was chosen to (i) systematically
GI soil, which amounted to N2 O emissions up to approxi-            investigate the effect of aggregate size and to (ii) guarantee
mately 160 µg N2 O–N m−2 h−1 after fertilization (Müller et         thorough mixing of the 15 N tracer with the soil.
al., 2004; Kammann et al., 2008; Regan et al., 2011). Deni-            In this way, a full factorial design with 12 treatments and
trification potential, however, exists in both soils, as recently   three factors (soil: RM, GI; aggregate size: large, small; sat-
investigated by Malique et al. (2019) in a laboratory experi-       uration: 70 %, 83 %, 95 % WHC) was prepared in triplicates
ment with both soils. Higher denitrification activity with GI       for incubation. WHC was additionally measured for both soil
soil was found compared to that of RM soil (Malique et al.,         materials in parallel soil cores. For a better comparability
2019). According to this, these soils were chosen for the           with previous studies, the results are presented in terms of
contrast in properties potentially affecting denitrification and    water-filled pore space (WFPS), which is derived from the
respiration (SOM contents, pH, texture, bulk density), which        known mass of soil and water and their respective densi-
induces a large difference in microbial respiration and hence       ties. A detailed description of the experimental set-up can
O2 demand under identical incubation settings. The rationale        be found in the Supplement.
was that soil texture and bulk density should mainly govern            The columns containing the packed soil aggregates were
air content and thus O2 supply at a certain water saturation,       closed tightly and were equipped with an inlet and outlet
whereas SOM content should mainly govern microbial ac-              in the headspace (Fig. 1). To analyse O2 saturation, needle-
tivity and thus O2 demand. The soils were sieved (10 mm),           type (40×0.8 mm) oxygen microsensors with < 140 µm flat-
air-dried, and stored at 6 ◦ C for several months before siev-      broken sensor tips (NFSG-PSt1, PreSens Precision Sensing

https://doi.org/10.5194/bg-18-1185-2021                                                    Biogeosciences, 18, 1185–1201, 2021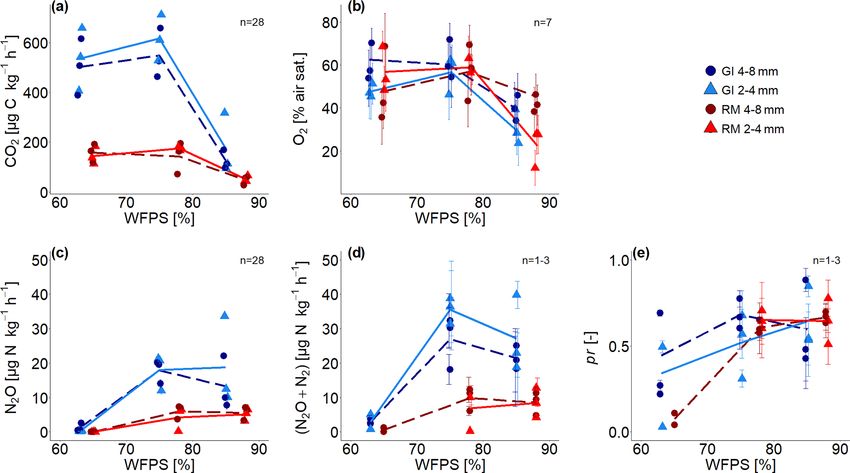
1188                               L. Rohe et al.: Denitrification in soil as a function of oxygen availability at the microscale

Table 1. Basic description of soil materials used for incubation (SOM: soil organic matter; WRB: World Reference Base for the classification
of soil).

                Site                      Land use      Soil type   Bulk density      Clay   Silt   SOM    C:N         pH
                                                        (WRB)          [g cm−3 ]       [%]   [%]     [%]           (CaCl2 )
                Rotthalmünster (RM)       Arable        Luvisol                1.3      19    71    1.21    8.7         6.7
                Gießen (GI)               Grassland     Gleysol                1.0      32    41    4.46   10.0         5.7

                                                                         time was 192 h. Additional information of a parallel incuba-
                                                                         tion where atmospheric conditions were switched from oxic
                                                                         to anoxic conditions to calculate the anaerobic soil volume
                                                                         fraction (ansvfcal ) can be found in the Supplement.

                                                                         2.2     Gas analysis

                                                                         2.2.1       Gas chromatography (GC)

                                                                         The column outlet was directly connected to a gas chromato-
                                                                         graph (Shimadzu 14B) equipped with an electron capture de-
                                                                         tector (ECD) to analyse N2 O and two flame ionization detec-
                                                                         tors (FIDs) to analyse methane (not reported) and CO2 . GC
Figure 1. Schematic of the column for repacked soil showing the          measurements were taken online every 6.5 min using GC So-
dimensions (10 × 9.4 cm), the lid with inlet and outlet for technical    lution software (Shimadzu, GCSolution 2.40). The detection
gas (21 % O2 and 2 % N2 in helium), O2 microsensors (in black),          limit was 0.25 ppm N2 O and 261.90 ppm CO2 , with a preci-
and the temperature sensor (in grey) located in soil core. The out-      sion of at least 2 % and 1 %, respectively. The N2 O and CO2
let of the lid was directly connected to a gas chromatograph and         data were aggregated to 6 h means for further analysis in or-
allowed sampling for isotope ratio mass spectrometry (IRMS).
                                                                         der to eliminate the high-frequency noise from the otherwise
                                                                         gradually changing gas concentrations under static incuba-
                                                                         tion conditions. The measurements during an equilibration
GmbH, Regensburg, Germany) were pinched through sealed                   phase of 24 h were excluded. N2 O fluxes derived from GC
holes in the lid and PVC column at seven well-defined po-                analysis may include N2 O from processes other than deni-
sitions. Three sensors were located at the top by inserting              trification and are thus referred as the total net N2 O fluxes
vertically into the soil through the lid and headspace down to           (N2 O_total).
approximately 20 mm depth, whereas four sensors were in-
serted laterally at the centre of the column at about 36 mm              2.2.2       Isotopic analysis
depth with angular intervals of 90◦ . The microsensors were
coupled to a multi-channel oxygen meter (OXY-10 micro,                   Samples for isotopic analysis of 15 N in N2 O and N2 were
PreSens Precision Sensing GmbH, Regensburg, Germany),                    taken manually after 1, 2, 4, and 8 d of incubation in
and O2 measurements were stored in 15 min intervals. The                 12 mL Exetainers® (Labco Limited, Ceredigion, UK). To
O2 data were aggregated to 6 h means for further analy-                  elute residual air from the 12 mL Exetainer it was flushed
sis. The columns were placed in a darkened, temperature-                 3 times with helium (helium 6.0, Praxair, Düsseldorf, Ger-
controlled 20 ◦ C water bath (JULABO GmbH, Seelbach,                     many) prior to evacuating the air to 180 mbar. The Exetainers
Germany). Two flow controllers (G040, Brooks® Instrument,                were flushed with headspace gas for 15 min, which amounts
Dresden, Germany) served to flush the columns with tech-                 to a sixfold gas exchange of the Exetainer volume. At the end
nical gas (21 % O2 and 2 % N2 in helium; Praxair, Düs-                   of the incubation, technical gas was also sampled to analyse
seldorf, Germany) through the inlet of the columns at a                  the isotopic signature of the carrier gas.
rate of 5 mL min−1 . This artificial atmosphere with low-N2                  These gas samples were analysed using an automated gas
background concentration was used to increase sensitivity                preparation and introduction system (GasBench II, Thermo
for N2 fluxes (Lewicka-Szczebak et al., 2017). Initially, the            Fisher Scientific, Bremen, Germany; modified according to
headspace was flushed with technical gas for approximately               Lewicka-Szczebak et al., 2013) coupled to an isotope ra-
3 to 5 h under six cycles of mild vacuum (max. 300 mbar)                 tio mass spectrometer (MAT 253, Thermo Fisher Scien-
to bring down the N2 concentration within the soil column                tific, Bremen, Germany) that measured m/z 28 (14 N14 N), 29
approximately to that of the technical gas (2 %) and to en-              (14 N15 N), and 30 (15 N15 N) of N2 and simultaneously iso-
sure comparable initial conditions for incubation. Incubation            tope ratios of 29 R (29 N2 / 28 N2 ) and 30 R (30 N2 / 28 N2 ). All

Biogeosciences, 18, 1185–1201, 2021                                                            https://doi.org/10.5194/bg-18-1185-2021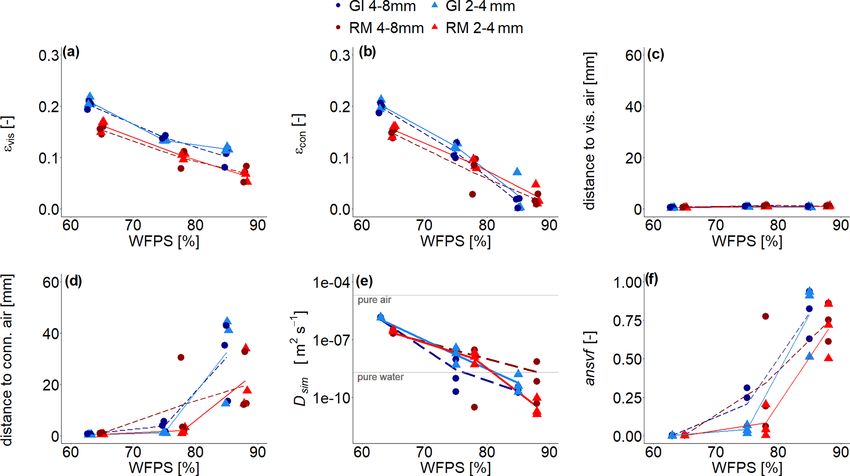
L. Rohe et al.: Denitrification in soil as a function of oxygen availability at the microscale                                1189

three gas species (N2 O, (N2 O + N2 ), and N2 ) were analysed      (Schlüter et al., 2019), and (3) the ansvf which corresponds
as N2 gas after N2 O reduction in a Cu oven. Details of mea-       to the volume fraction of air distance larger than a certain
surement and calculations for fractions of different pools (i.e.   threshold. Therefore, in a sensitivity test, air distance thresh-
N in N2 O (fp _N2 O) or N2 (fp _N2 ) originating from 15 N-        olds of 0.6, 1.3, 2.5, 3.8, and 5.0 mm were used to estimate
labelled NO−3 pool) are described elsewhere and are provided       the ansvf and to find the best correlation between ansvf and
in the Supplement (Fig. S3) (Spott et al., 2006; Lewicka-          N2 O as well as (N2 O + N2 ) fluxes. This was found with an
Szczebak et al., 2013; Buchen et al., 2016).                       ansvf at a critical air distance of 5 mm when pooling GI and
   The product ratio (pr) [N2 O / (N2 O + N2 )] was calculated     RM soils (Fig. 2c, d).
for each sample:                                                       In summary, the εcon is a proxy for the supply with gaseous
                                                                   oxygen coming from the headspace, whereas the connected-
                fp _N2 O
pr [–] =                     .                              (1)    air distance and ansvf are proxies for the supply limitation
           fp _N2 O + fp _N2                                       of dissolved oxygen by diffusive flux through the wet soil
The calculated average pr [N2 O / (N2 O + N2 )] of each treat-     matrix. In addition to these averages for entire soil cores,
ment was also used to calculate the average total denitrifica-     both εcon and average air distance were also computed locally
tion fluxes (N2 O + N2 fluxes) during the incubation:              in the vicinity of oxygen sensor tips (Fig. 2b–c) to compare
                                                                   these metrics with measured oxygen concentrations. Spheri-
                                  N2 O_total
(N2 O + N2 ) [µg N h−1 kg−1 ] =              .              (2)    cal regions of interest (ROIs) with different diameters from
                                      pr                           3.6 to 10.8 mm were tested with respect to the highest corre-
2.3   Microstructure analysis                                      lation of εcon and average air distance with average oxygen
                                                                   concentration of individual sensors. This was found to occur
Due to the experimental set-up, it was only possible to            at a diameter of 7.2 mm when centred on the sensor tip.
scan the soil cores with X-ray CT (X-tek XTH 225, Nikon                In addition to scans of the entire core, four individual ag-
Metrology) once directly after the incubation experiment.          gregates (4–8 mm) of each soil were also scanned with X-ray
The temperature sensor was removed, but the oxygen micro-          CT (80 kv, 75 µA, 1 s exposure time, no filter, 2400 projec-
sensors remained in place during scanning. The scan settings       tions, two frames per projection), reconstructed in 8 bit at a
(190 kV, 330 µA, 708 ms exposure time, 1.5 mm Cu filter,           voxel resolution of 5 µm, filtered with a 2D non-local means
2800 projections, two frames per projection) were kept con-        filter, and segmented into pores and background with the
stant for all soils and saturations. The projections were re-      Otsu thresholding method (Otsu, 1975). The largest cuboid
constructed into a 3D tomogram with 8 bit precision and a          fully inscribed in an aggregate was cut and used for subse-
spatial resolution of 60 µm using the filtered back projection     quent diffusion modelling as described below.
algorithm in X-tek CT-Pro. Only macropores twice this nom-
inal resolution were clearly detectable in the soil core images.   2.4   Diffusivity simulations
Hence, at the lowest water saturation, not all air-filled pores
can be resolved, which is discussed below. The 3D images           Diffusivity was simulated for individual aggregates as well
were processed with the Fiji bundle for ImageJ (Schindelin et      as for the entire soil core (bulk diffusivity) directly on seg-
al., 2012) and associated plugins. The raw data were filtered      mented X-ray CT data by solving the Laplace equation
with a 2D non-local means filter for noise removal. A radial       with the DiffuDict module in the GeoDict 2019 software
and vertical drift in grayscale intensities had to be removed      (Math2Market GmbH, Kaiserslautern, Germany). A hierar-
(Iassonov and Tuller, 2010; Schlüter et al., 2016) before these    chical approach was used to (1) estimate the effective dif-
corrected greyscale images (Fig. 2a) were segmented into           fusivity of the wet soil matrix by simulating Laplace dif-
multiple material classes using the histogram-based thresh-        fusion on individual soil aggregates with the explicit-jump
olding methods (Schlüter et al., 2014). The number of ma-          solver (Wiegmann and Bube, 2000; Wiegmann and Zemitis,
terials varied between two (air-filled pores, soil matrix) and     2006) and (2) model diffusivity (Dsim ) with the explicit-jump
four (air-filled pores, water-filled pores, soil matrix, mineral   solver on the entire soil core (1550 × 1550 × [1500–1600]
grains), depending on saturation and soil material. By means       voxels). The latter was based on the visible 3D pore space
of connected-component labelling implemented in the Mor-           and using the effective diffusion coefficient of the soil matrix
pholibJ plugin (Legland et al., 2016), the air-filled pore space   as obtained from the simulation of soil aggregates. We as-
was further segmented into isolated and connected-air-filled       sumed an impermeable exterior, impermeable mineral grains
porosity, depending on whether there was a continuous path         (GI only), and the diffusion coefficient of oxygen in air and
to the headspace (Fig. 2b). Average oxygen supply in the core      water (≥ 75 % WFPS only) in the respective material classes
was estimated by three metrics: (1) visible-air-filled porosity    (see detailed information in the Supplement).
(εvis ) and connected-air content (εcon ) determined by voxel
counting (Fig. 2b), (2) average air distance derived from
the histogram of the Euclidean distances between all non-
air voxels and their closest connected-air voxel (Fig. 2c, d)

https://doi.org/10.5194/bg-18-1185-2021                                                   Biogeosciences, 18, 1185–1201, 2021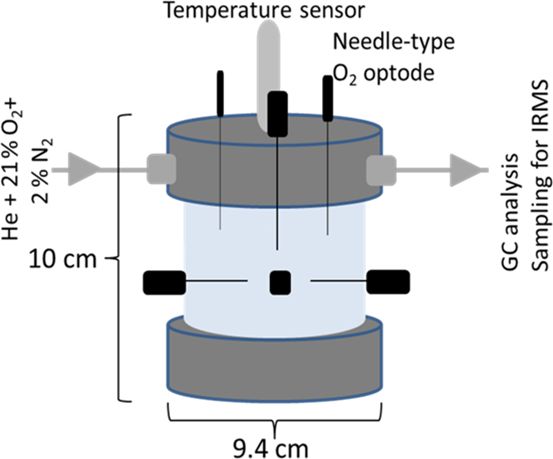
1190 L. Rohe et al.: Denitrification in soil as a function of oxygen availability at the microscale
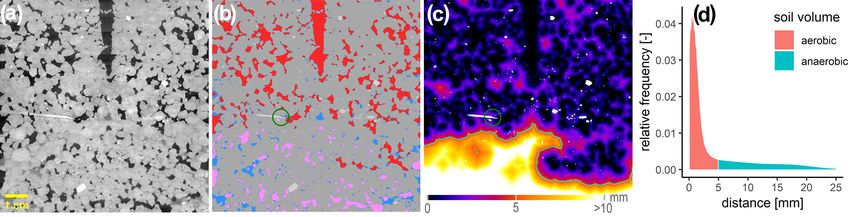
Figure 2. A 2D slice of one soil core packed with large aggregates (4–8 mm) from Gießen soil (GI) incubated at 75 % WFPS to illustrate grey
value contrast between materials. (a) One oxygen microsensor is shown on the left (white needle) and the hole of the temperature sensor at
the top (black) within the soil matrix (grey), stones (white), and pores that are filled either with air (black) or water (light grey). (b) Material
classes after segmentation including soil matrix (grey), water (blue), mineral grains (light grey), connected air (red), and isolated air (rose).
The green circle around the light-grey sensor tip depicts the diameter of 7.2 mm that is used to characterize its environment. (c) The 3D
Euclidean distance to the closest connected-air voxel (mineral grains are excluded) in each soil matrix or water voxel. The closest air voxel
might be outside of the 2D plane. The green line depicts the connected-air distance threshold of 5 mm that differentiates between an anaerobic
soil volume fraction (light colours) and aerated volume (dark colours). (d) Relative frequency of soil volume as a function of distance to
closest connected air [mm] divided into aerobic (red) and anaerobic (green) soil volume.
2.5 Statistical analysis important independent explanatory variables (six predictors:
CO2 fluxes, O2 saturation, Dsim , εcon , ansvf, and pr) to pre-
dict the response variables N2 O or (N2 O + N2 ) fluxes. It has
Statistical analysis was conducted with R (R Core Team, to be emphasized that N2 O fluxes and pr were measured in-
2018). Figures were produced with the package ggplot2 dependently of each other using different measuring meth-
(Wickham, 2016). In order to estimate the correlation be- ods (gas chromatography and isotopic analysis), which justi-
tween various variables that do not exhibit a normal distri- fies pr as a predictor variable for N2 O fluxes. In contrast to
bution (average values of N2 O fluxes, (N2 O + N2 ) fluxes, this, (N2 O + N2 ) fluxes were calculated from pr, and there-
CO2 fluxes, O2 saturation, Dsim , εcon , ansvf, and pr), Spear- fore pr was not included in PLSR for the response variable
man’s rank correlations with pairwise deletion of missing (N2 O + N2 ) fluxes (resulting in five explanatory variables).
values were performed, pooling data for GI and RM soils. Bootstrapping was used to provide confidence intervals that
The p values were corrected for multiple comparison ac- are robust against deviations from normality (R package boot
cording to Benjamini and Hochberg (1995) and adjusted p v. 1.3-24) (Davison and Hinkley, 1997; Canty and Ripley,
values ≤ 0.05 were considered to be significant. 2019). Given the relatively small sample size (36 incuba-
As described before, there were four missing values for tions in total), the smoothed bootstrap was used by resam-
pr due to limitation of the isotopic measurement at the low- pling from multivariate kernel density (R package kernelboot
est saturation. For further statistical analysis of the data set, v. 0.1.7) (Wolodzko, 2020). The BCa bootstrap confidence
any missing pr values were imputed using the chained ran- interval of 95 % of R 2 was a measure to explain the variabil-
dom forest using more than 100 regression trees in terms ity in each response variable (Efron, 1987). Components that
of overall variable pattern as this method can handle nonlin- best explained N2 O and (N2 O + N2 ) fluxes were identified
ear relationships between variables (Breiman, 2001; Nengsih by permutation testing.
et al., 2019). It was also required to standardize the data of To address the second research question of this study
very different value ranges for further analysis. Since N2 O concerning substitutions of predictors by classical, averaged
and/or (N2 O + N2 ) were not detectable for a few samples soil properties, additional and simplified models with the
at the lowest saturation, a constant of 1 was added to N2 O PLSR approach described above were performed using vari-
and (N2 O + N2 ) fluxes prior to transformation. This changes ous variables to substitute the most important predictors for
the mean value but not the variance of data. In order to N2 O or (N2 O + N2 ) fluxes. A detailed description of the sub-
get normal distributions and linear relationships, a logarith- stitution is provided in Sect. 3.4 and Sect. 4.2.
mic transformation was applied to metric data (CO2 , N2 O
and (N2 O + N2 ) fluxes, Dsim ), whereas a logistic transform
logit (x) = log(x/(1 − x)) was applied to dimensionless ra-
tios between 0 and 1 (ansvf).
Since there was a high collinearity among most variables,
a partial least square regression (PLSR) with leave-one-out
cross-validated R 2 was the best method to identify the most
Biogeosciences, 18, 1185–1201, 2021 https://doi.org/10.5194/bg-18-1185-2021L. Rohe et al.: Denitrification in soil as a function of oxygen availability at the microscale 1191
3 Results of samples due to lacking data of pr (Tables S1, S4). SOM
content and aggregate size had no effect on pr. Time series
3.1 Bulk respiration of pr showed a gradual reduction for all treatments as the
N2 emissions grew faster than the N2 O emissions (Fig. S5).
Time series of CO2 and N2 O fluxes (Fig. S1) show aggre- With water saturations > 75 % WFPS, the pr decreased with
gated values for 6 h steps over the complete incubation time time and was in most cases < 0.5 at the end of incubation
of approximately 192 h, ignoring the first 24 h due to initial (Fig. S5). In summary, for each soil all samples with satura-
equilibration of the system (i.e. redistribution of water, ex- tion ≥ 75 % WFPS showed similar pr (Fig. 3e) and N2 O re-
pression of all denitrification enzymes, fast mineralization lease (Fig. 3c). This agreed well with subsequent X-ray CT
of labile carbon). Averages for the whole incubation are re- estimates of air connectivity as shown below.
ported in Fig. 3a, c and in Tables S1 and S4 in the Supple-
ment. The 3.7 times higher SOM content in GI soil than in 3.2 Pore system of soil cores
RM soil resulted in higher microbial activity so that CO2
fluxes were approximately 3 times higher for all saturations. Due to lower target bulk density in GI soil (1.0 g cm−3 ) com-
The variability in CO2 fluxes between replicates is much pared to that of RM soil (1.3 g cm−3 ), visible-air content
higher than the temporal variability during incubation. This (εvis ; depicted in red and pink in Fig. 2c) was higher inde-
is probably explained by small differences in the packing of pendent of aggregate size (Fig. 4a). The εvis decreased with
the columns that can have large consequences for soil aera- increasing water saturation but not linearly, as would be ex-
tion. CO2 production in both soils was lowest with the high- pected. The air contents in the very wet range are in fact
est water saturation but was quite similar for both treatments higher (16 %–17 %) than the target air saturation of approx-
with saturations < 80 % WFPS (Fig. 3a). Aggregate size had imately 11 % or 15 % for RM and GI soil, respectively. It
a negligible effect on CO2 production. was not possible to remove air more efficiently during pack-
Substantial N2 O and (N2 O+N2 ) emissions were detected ing, and some ponding water might have accidentally been
for saturations ≥ 75 % WFPS and were again approximately removed with vacuum application during purging at the be-
3 times higher in SOM-rich GI soil than in RM soil (Fig. 3c, ginning of incubation. Additionally, the GI soil was rich in
d). The variability between replicates is again higher than vermiculite and swelled upon wetting. This increase in soil
the temporal variability (e.g. in Fig. 3d and time series in volume at the end of incubation resulted in a relative decline
Fig. S1), and the effect of aggregate size is inconsistent in water content. For increasing water content the air con-
due to the large variability among replicates. Mineral N tent that is connected to the headspace (εcon ; depicted in red
was not analysed after the incubation, and therefore cumu- in Fig. 2b) was reduced much more strongly as compared
lative (N2 O + N2 ) fluxes were used to estimate the N loss to the total εvis . This was observed for both soils and aggre-
after 192 h of incubation. Considering the N addition of gate sizes and indicates that a substantial amount of air is
50 mg N kg−1 as NO− −
3 and an average natural NO3 back- trapped (Fig. 4b). According to this observation, average dis-
ground of 34 mg kg−1 , substantial N loss was observed for tance to visible air was very small (Fig. 4c) and remained be-
both soils at ≥ 75 % WFPS. The N converted to N2 O or N2 low 1.5 mm even for the highest water saturation, with gener-
represents a proportion equal to ≤ 2.6 % with RM soil and ally smaller distances for smaller aggregates. Yet, the average
≤ 8.0 % with GI soil for both aggregate sizes and saturations. distance to the pore system connected with headspace esca-
Average O2 saturation was lowest with the highest wa- lates in the wet range (Fig. 4d). The huge variability among
ter saturation and roughly the same for saturations < 80 % replicates comes from the fact that trapping by complete wa-
WFPS (Fig. 3b). Some sensors showed a gradual decline in ter blockage typically occurs in the slightly compacted upper
O2 concentration, whereas some showed a drastic reduction part of a packing interval, but the specific interval where this
or increase in a short period of time, probably due to water re- happens varies among samples (Fig. S4). The different ag-
distribution (Fig. S2). The average of the final 24 h was taken gregate sizes did not affect the distance to connected air as
for all subsequent analysis as this probably best reflects the the long-range continuity of air is controlled by bottlenecks
water distribution scanned with X-ray CT. Standard errors in the pore space and not by aggregate size.
among the seven O2 microsensors were high in each treat- Water saturation had a dramatic impact on Dsim (Fig. 4e),
ment due to very local measurement of O2 that probed very leading to a reduction by 5 orders of magnitude in a rather
different locations in the heterogeneous pore structure. small saturation range. At high saturations it fell below the
The pr, i.e. the N2 O / (N2 O + N2 ) as a measure of denitri- oxygen diffusion coefficient in pure water due to the tor-
fication completeness, showed a similar behaviour as a func- tuosity of the pore system. The ansvf (Fig. 4f) is directly
tion of water saturation as N2 O release, with a plateau for linked to connected-air distance and shows the same escalat-
saturations ≥ 75 % WFPS at 0.6 and a lower but somewhat ing behaviour at the highest saturation up to a volume frac-
more erratic pr for the lowest saturation due to a generally tion of 50 %–90 %. The ansvf is highly correlated with CO2
low 15 N gas release (Fig. 3e). Thus, the (N2 O + N2 ) fluxes at emissions (Spearman’s R > −0.7 and p = 0.04), which ex-
≤ 65 % WFPS could only be calculated for a small number hibit the same tipping point behaviour, yet with very different
https://doi.org/10.5194/bg-18-1185-2021 Biogeosciences, 18, 1185–1201, 20211192 L. Rohe et al.: Denitrification in soil as a function of oxygen availability at the microscale Figure 3. (a) Average CO2 fluxes, (b) average O2 saturation, (c) average N2 O and (d) (N2 O + N2 ) fluxes, and (e) average product ratio (pr) [N2 O / (N2 O + N2 )] as a function of water-filled pore space (WFPS) for two repacked aggregate sizes (2–4 and 4–8 mm) from Rotthalmün- ster (RM) and Gießen (GI) soil. Symbols depict the average values for each of the three individual replicates, with error bars showing the standard error in the mean; standard error in (a) and (c) are of fluxes measured during incubation, in (b) the standard error from measure- ments of seven sensors located within the soil core, and in (d) and (e) of three measurements during incubation time (after 2, 4, and 8 d with detectable R 29 and R 30 ; n = 3 for two highest WFPSs). The number of measurements (n) considered for averaging is displayed in each subfigure. The lines (dashed and solid) connect the average value of three replicates at each saturation (large and small aggregates, respectively). Figure 4. (a) Visible-air content (εvis ), (b) connected-air content (εcon ), (c) average distance to visible air, (d) average distance to connected visible air, (e) simulated diffusivity (Dsim ), and (f) anaerobic soil volume fraction (ansvf) as a function of water-filled pore space (WFPS) for two repacked aggregate sizes (2–4 and 4–8 mm) from Rotthalmünster (RM) and Gießen (GI) soil and three replicates each depicted by symbols. The lines (dashed and solid) connect the average value of three replicates (large and small aggregates, respectively). The horizontal grey lines in (e) reflect material properties. The experiment was performed at 20 ◦ C and according to that diffusivity was calculated at 20 ◦ C. Biogeosciences, 18, 1185–1201, 2021 https://doi.org/10.5194/bg-18-1185-2021
L. Rohe et al.: Denitrification in soil as a function of oxygen availability at the microscale                                  1193

slopes in the regression for the different soils due to differ-        The PLSR identified two principal components that best
ent microbial activity (Fig. S6). The correlation of ansvf is       explained N2 O and (N2 O + N2 ) fluxes, while most variables
weaker with N2 O (Spearman’s R 0.6 < R < 0.77, p < 0.1)             contributed to the first component (Comp1), and almost ex-
and negligible with (N2 O + N2 ) (p > 0.2), suggesting that         clusively CO2 release contributed to the second component
denitrification is more complexly controlled. The full regres-      (Comp2) (see Fig. S8 in the Supplement). These principal
sion analysis of ansvf with different gases and for differ-         components revealed a vastly different ability of individual
ent soils and aggregate sizes is presented in the Supplement        explanatory variables to explain the observed variability in
(Fig. S6).                                                          N2 O and (N2 O + N2 ) release. The importance of explanatory
                                                                    variables to predict N2 O and (N2 O + N2 ) fluxes varied as fol-
3.3   Microscopic oxygen distribution                               lows: CO2 > (pr) > ansvf > Dsim > εcon > O2 (see Fig. S8).
                                                                    Hereinafter pr shown in brackets illustrates its contribution
The local measurements of O2 using microsensors are                 to PLSR analysis for N2 O fluxes only. The explanatory vari-
demonstrated as an example for two selected sensors from            ability, expressed in the text as R 2 · 100 [%], was 82 % for
the same soil column (GI soil incubated at 75 % WFPS).              N2 O fluxes and 78 % for (N2 O + N2 ) fluxes when consider-
They are located at the same depth with a separation distance       ing the complex model with all explanatory variables (CO2
of < 2 cm. Sensor 1 detected low O2 concentrations (18 %            flux, O2 saturation, εcon , Dsim , ansvf (and pr)) (Fig. 7). The
air saturation) because it was located in a compact area with       resulting regression equations can be found in the Supple-
low εcon (4 %) and a rather large distance to the closest air-      ment (Eqs. S7–S8).
filled pore (1.6 mm) (Fig. 5a, b, d). Sensor 2 detected fairly         Starting from this complex model, a series of simplifica-
high O2 concentrations (76 % air saturation) as it happened         tions and substitutions of explanatory variables were con-
to pinch into a macropore with a high εcon (15 %) and a short       ducted to assess the extent to which the resulting loss in pre-
distance to connected air (0.8 mm) in its vicinity (Fig. 5a–c).     dictive power is acceptable. Reducing the number of explana-
The green or violet circle with a diameter of 7.2 mm depicts        tory variables to the most important variables resulted in CO2
the spherical averaging volume for εcon and distance to con-        and ansvf for (N2 O + N2 ) release (83 % explained variability,
nected air that correlated best with the average O2 concentra-      simplified model in Fig. 7). In other words, the combination
tions when lumped over all soils and saturations (Fig. 5b–d).       of these two predictors (ansvf and CO2 ) is crucial as CO2 re-
    The treatment-specific correlations between distance to         lease explains the different denitrification rates between the
connected air and average O2 concentrations are shown in            two soils, whereas ansvf explains the differences within a soil
Fig. 6. At the lowest saturation level there is no correlation at   due to different saturations. To predict N2 O emissions, the
all (Spearman’s R −0.4  R < 0.1 and p ≥ 0.38; Fig. 6a, d)          simplified model with the most important explanatory vari-
because some unresolved pores (< 120 µm) within the aggre-          ables CO2 , ansvf, and pr as a third predictor resulted in 81 %
gates are air-filled so that oxygen availability is not limited     of explained variability (Fig. 7). Average O2 saturation could
by visible air. At the intermediate saturation level the corre-     be omitted for its small correlation with N2 O or (N2 O + N2 )
lations were best (Spearman’s R < −0.7 and p ≤ 0.02) be-            release in general, whereas εcon and Dsim could be omitted
cause all unresolved pores are water-filled (Fig. 6b, e). At the    because of the high correlation with ansvf (Fig. S7).
highest water saturation the correlation was highest for large         The regression equations with R 2 values and a confidence
aggregates (Spearman’s R = −0.6 and p = 0.08) because               interval of 95 % in square brackets resulting from PLSR, with
the local effect of soil structure might become stronger rela-      CO2 and ansvf (and pr) identified as the most important ex-
tive to the non-local effect of air entrapment. With the other      planatory variables to predict N2 O or (N2 O + N2 ) fluxes of
three treatments the correlations were worse again (Spear-          the present study for data after log or logit transformation:
man’s R between −0.01 and −0.3 and p ≥ 0.58; Fig. 6c,
f) because distance to connected air ignores all trapped air,       log (N2 O) = 0.65 log (CO2 ) + 0.74 logit (ansvf) + 0.75 pr;
which may still contribute a lot to oxygen supply.                  R 2 = 0.81 [0.67–0.89]
                                                                                                                                   (3)
3.4   Explanatory variables for denitrification
                                                                    log (N2 O + N2 ) = 1.14 log (CO2 ) + 1.60 logit (ansvf) ;
So far the correlations among different explanatory variables       R 2 = 0.83 [0.71–0.90].                                        (4)
and between explanatory variables and N gas release have
been shown for individual treatments, i.e. separately for each      Various variables were used to substitute best predictors
combination of soil and aggregate size, in order to focus on        (CO2 or ansvf) (Fig. 7) in PLSR. The substitution of CO2
the effect of water saturation. However, the true potential of      by SOM or ansvf by εt , Dsim , or empirical diffusivity (Demp )
explanatory variables to predict denitrification can only be        based on total porosity and air content (Deepagoda et al.,
explored with the entire pooled data set so that the variability    2011) is explained in Sect. 4.2.
in denitrification is captured more representatively.

https://doi.org/10.5194/bg-18-1185-2021                                                      Biogeosciences, 18, 1185–1201, 2021
1194 L. Rohe et al.: Denitrification in soil as a function of oxygen availability at the microscale
Figure 5. Local oxygen distribution in one soil core packed with small aggregates (2–4 mm) from Gießen soil (GI) incubated at 75 % water-
filled pore space (WFPS) to illustrate as an example the very local measurement of O2 . Shown here are (a) O2 saturations measured by
two microsensors as a function of incubation time; (b) a 3D subvolume shown from the top, with connected air depicted in red and both
sensors depicted with their respective spherical support volume in colours corresponding to (a); and 2D greyscale slices through the sensor
tip depicting soil matrix in light grey, water in dark grey, and air in black for (c) the sensor measuring high and for (d) the sensor measuring
low O2 saturations. The violet and green circles depict the proximity of the sensor tip (7.2 mm diameter) used to calculate the averaged local
metrics.
Figure 6. Average O2 saturation (at the end of incubation experiment) measured with four sensors, each located at the centre of the soil
core, as a function of distance to visible connected air for two repacked aggregate sizes (2–4 and 4–8 mm) from Gießen (GI; a–c; blue) and
Rotthalmünster (RM; d–f; red) soil. Panels (a) and (d) show results for the lowest (63 % or 65 % WFPS with GI and RM soil, respectively),
(b, e) for medium (75 % or 78 % WFPS with GI and RM soil, respectively), and (c, f) for the highest (85 % or 88 % WFPS with GI and
RM soil, respectively) water saturation. The insets in (a), (b), and (d) show a reduced distance range. The distance to visible connected air is
averaged in a spherical region around the sensor tip (7.2 mm diameter). The Spearman’s rank correlation coefficient (R) indicates the extent
of monotonic relation between the ranks of both variables. The associated p values (p) were corrected for multiple comparison according to
Benjamini and Hochberg (1995).
4 Discussion sizes and different water saturations. Other factors that would
have affected O2 demand and energy sources for denitrifiers
4.1 Which processes govern denitrification in soil? (quality of organic matter, temperature, pH, plant–soil inter-
actions), O2 supply (oxygen concentration in the headspace,
The onset and magnitude of denitrification are controlled by temperature), or other drivers of denitrification (NO− 3 con-
O2 supply and O2 consumption, which in turn depend on centration, pH, denitrifier community structure) were either
processes in soil occurring at microscopic scales. This study controlled or excluded in this study.
was designed to examine different levels of O2 consump- N2 O release from soil can be low because denitrification
tion by comparing soils with different SOM contents and dif- does not occur under sufficient oxygen supply, because it is
ferent levels of O2 supply by comparing different aggregate
Biogeosciences, 18, 1185–1201, 2021 https://doi.org/10.5194/bg-18-1185-2021L. Rohe et al.: Denitrification in soil as a function of oxygen availability at the microscale 1195
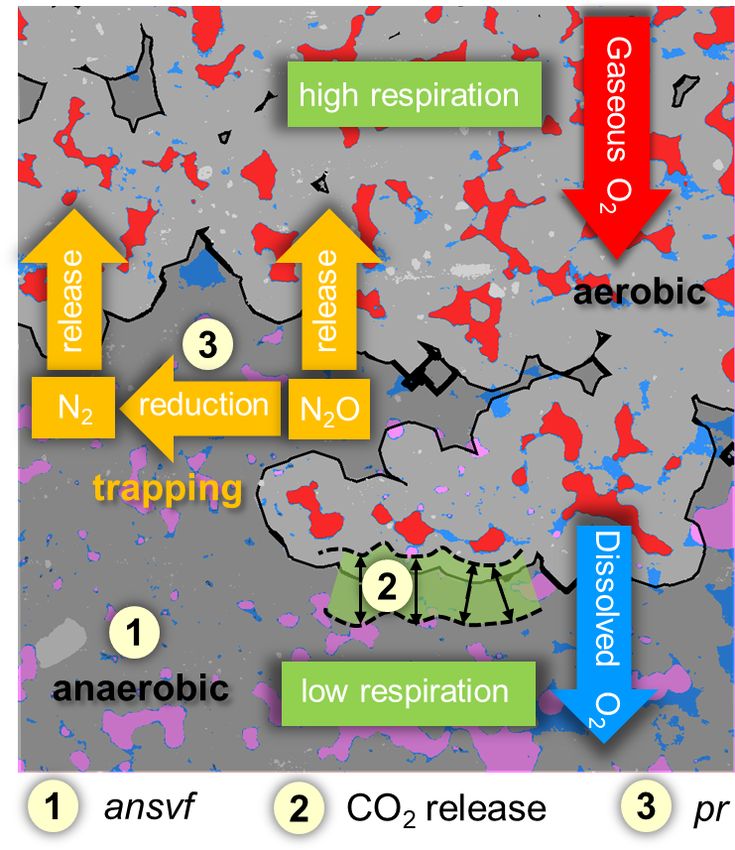
Figure 7. Explained variability expressed as R 2 with a confi- Figure 8. Conceptual scheme of oxygen (O2 ) supply and demand
dence interval of 95 % resulting from partial least square regres- and its effect on denitrification. Material classes include soil matrix
sion (PLSR) with leave-one-out cross-validation and bootstrapping (grey area), water (blue), mineral grains (light grey), connected air
for response variables N2 O (green symbols) or (N2 O + N2 ) fluxes (red), and isolated air (rose). The black line divides between aero-
(violet symbols) for pooled data of both soils (from Rotthalmün- bic (light-grey area) and anaerobic (dark-grey area) conditions. O2
ster (RM) and Gießen (GI)), WFPS treatments, and aggregate sizes supply and demand regulate the formation of anaerobic soil vol-
(n = 36). The yellow area shows a complex model including all ume fraction (ansvf) as an imprint of the spatial distribution of con-
explanatory variables of the present study (CO2 , O2 , connected- nected air (item number 1), respiration (item number 2) that would
air content (εcon ), diffusivity (Dsim ), anaerobic soil volume frac- move the boundary between oxic and anoxic zones in the soil ma-
tion (ansvf), and product ratio (pr) [N2 O / (N2 O + N2 )]) (all) and trix closer towards the pore when soil respiration is high (and vice
a simplified model including only the most important predictors versa), and N2 O reduction to N2 (expressed by the product ratio
(CO2 + ansvf (+ pr); predictor (+ pr) was only used for N2 O emis- (pr); item number 3). The numbered items show how the explana-
sions). The blue area shows additional simplified models with sub- tory variables that best describe N2 O release affect denitrification.
stitutions of the most important predictor for O2 supply (ansvf)
by Dsim or diffusivity calculated from an empirical model (Demp )
(Deepagoda et al., 2011) or theoretical air content (εt ). The red area
structural properties related to O2 supply. The dependence of
shows a simplified model with substitutions of the most important
denitrification on diffusion constraints was demonstrated by
predictor for O2 demand (CO2 ) by soil organic matter (SOM; mea-
sured in bulk soil). Substitution of the two most important predictors several models that were developed to predict the formation
(CO2 and ansvf) by SOM and Demp is shown in the violet area. of anoxic centres within soil aggregates (Greenwood, 1961;
Arah and Smith, 1989; Arah and Vinten, 1995; Kremen et
al., 2005). The distance threshold for anoxic conditions to
emerge was set on an ad hoc basis at 5 mm from connected
formed in wet soil but reduced to N2 before it can escape to air at the end of incubation but is likely to vary with O2 de-
the atmosphere, or because it is trapped in isolated air pock- mand by local microbial activity (CO2 release represented
ets (Braker and Conrad, 2011). Trapped N2 O is thought to by the green fringe area, item 2) during the incubation (Kre-
likely be reduced to N2 eventually if gaseous N2 O is not re- men et al., 2005; Rabot et al., 2015; Ebrahimi and Or, 2018;
leased after a saturation change, which would open up a con- Keiluweit et al., 2018; Kravchenko et al., 2018; Schlüter et
tinuous path to the headspace. This is shown in the schematic al., 2019). Because we could only conduct X-ray CT scans at
on the balance between O2 supply and demand and its effect the end of incubation, redistribution of water during the in-
on denitrification (Fig. 8). cubation time cannot be ruled out. This could have changed
To our knowledge, the experimental set-up of the present ansvf and thus might explain some of the temporal variabil-
study combined for the first time microstructure analysis of ity in gaseous fluxes. In repacked soils it might be distributed
soil (X-ray CT) with measurements of N2 O and (N2 O + N2 ) rather uniformly and therefore be correlated with bulk CO2
fluxes to explore controlling factors of the complete deni- release (Aon et al., 2001; Ryan and Law, 2005; Herbst et
trification process including N2 formation. The explanatory al., 2016). The fact that aggregate size had no effect on den-
variables that contributed the highest predictive power with itrification indicates that critical distances were larger than
(N2 O + N2 ) release were ansvf and CO2 release (Fig. 8). The the aggregate radii and rather controlled by air distribution in
estimated ansvf (item 1) is a sole function of the spatial distri- the macropore system. When air content was high, all visi-
bution of connected air in soil and therefore only reflects soil ble macropores were air-filled so that this critical air distance
https://doi.org/10.5194/bg-18-1185-2021 Biogeosciences, 18, 1185–1201, 20211196 L. Rohe et al.: Denitrification in soil as a function of oxygen availability at the microscale was hardly exceeded anywhere. When air content was low 4.2 How to substitute microscale information by bulk (close to full water saturation), the patchy distribution of air properties and water in the macropore system was governed by subtle layering in the pore structure and not by aggregate size. This means that both aggregate sizes used in the present study The aims of this study were to find a minimum set of vari- might have been too small to provoke differences in O2 avail- ables that explain the regulation of microbial denitrification ability and thus in CO2 , N2 O, and (N2 O + N2 ) fluxes. The at microscopic scales in a simplified experimental set-up and large distance found here is in contrast to the very short crit- to explore the extent to which this microscopic information ical distances of 180 µm for sufficient soil aeration estimated can be substituted by readily available bulk properties that by Kravchenko et al. (2018) and Kravchenko et al. (2019) for are feasible to measure in a field campaign. The interplay of intact soil cores containing crop residues for which soil res- O2 supply and O2 demand resulted in CO2 emissions and piration was not determined but is likely to be much higher. CT-derived ansvf being the most important predictors for A somewhat surprising result is that oxygen concentration (N2 O + N2 ) fluxes, while for N2 O fluxes pr was also im- measurements did not have an added value for predicting ei- portant (Figs. 7, S8). Simplified models with the most im- ther N2 O release or total denitrification. The best correlation portant predictors only (CO2 + ansvf (+ pr)) were sufficient of local O2 concentration with εcon was with a radial extent of to achieve similar explained variabilities (81 % and 83 % 3.6 mm used for averaging around the microsensor (Fig. 6). for N2 O and (N2 O + N2 ) fluxes, respectively) compared to Thus, with seven microsensors per column we only probed the complex models. The downside of using CO2 and CT- 0.2 % of the total soil volume. This is too small to capture derived ansvf as predictors for denitrification is that these aerobic and anaerobic conditions representatively, especially proxies are often unavailable, and reasonable substitutions since they may switch within short distances (Fig. 5). More by easily available variables would be desirable. sensors or sensors with larger support volume could be a The ansvf could have been replaced with alternative prox- means to improve the predictive power of local oxygen mea- ies for O2 supply like Dsim , Demp , and εt , which would have surements. However, there is always a trade-off between re- led to a reduction in explained variability in (N2 O + N2 ) trieving more information and disturbing the soil as little as fluxes to 52 %–78 % and an even larger drop for N2 O fluxes possible. to 46 %–59 % (Table S2). The substitution of ansvf by Dsim If only N2 O release is concerned, pr as an independent would avoid the requirement for an ad hoc definition of a crit- proxy for N2 O consumption (Fig. 8, item 3) was benefi- ical pore distance threshold, but it is gained with the caveat cial to predict N2 O emissions together with CO2 and ansvf of very time-consuming 3D simulations or laborious mea- (Fig. 7). The N2 O reduction to N2 and thus the pr are com- surements. Therefore, the substitution of ansvf with diffu- plexly controlled, where besides physical factors microbial sivity estimated by empirical models (Demp ) seems more vi- (the structure of the denitrifier community) and chemical able. Diffusivity is mainly controlled by soil bulk density and properties (pH, N oxides, SOM, temperature, salinity) are water saturation (Balaine et al., 2013; Klefoth et al., 2014). relevant (Smith et al., 2003; Clough et al., 2005; Müller These empirical models predict diffusivity based on empiri- and Clough, 2014). With respect to physical factors, de- cal relationships with total porosity (8) and air-filled poros- creasing diffusivity enhances N2 O residence time and N2 O ity (ε) (Millington and Quirk, 1961; Moldrup et al., 2000; concentration in the pore space, thus favouring N2 O reduc- Resurreccion et al., 2010; Deepagoda et al., 2011, 2019). As tion. According to this, Bocking and Blyth (2018) assumed expected the discrepancy between calculated Demp and sim- a very small pr in wet soils because N2 O may be trapped in ulated Dsim was highest at water saturation > 75 % WFPS, the soil or completely reduced to N2 . This assumption may where discontinuity due to packing procedure took full ef- also support results of the present study, where the average fect as described earlier (Figs. S9, S4). The substitution of (N2 O + N2 ) fluxes peaked at the medium water saturation CT-derived ansvf by Demp derived from empirical models (particularly with GI soil), while Dsim decreased with in- (Fig. 7, Table S2) is perhaps unacceptable for a genuine un- creasing water saturations (Fig. 4), which may indicate an derstanding of N2 O or (N2 O + N2 ) emissions from individ- entrapment of (N2 O + N2 ) in isolated soil pores (Clough et ual samples since estimated diffusivity ignores the actual tor- al., 2005; Harter et al., 2016). However, N2 release increased tuosity and continuity of the air-filled pore space. However, more strongly with time than the N2 O release, resulting in it may be a promising approach to reasonably predict aver- decreasing pr with time (Fig. S5). The chance of N2 O to be age N2 O or (N2 O + N2 ) fluxes under natural conditions with released before it is reduced to N2 depends on the diffusion readily available soil characteristics (Fig. 7, Table S2). In this distance of dissolved (and gaseous) N2 O between its forma- particular study, Dsim could even be replaced with the theo- tion sites and the atmosphere. Although diffusion pathways retical air content (εt ) adjusted during packing (together with for O2 and N2 O are similar, just in the opposite direction, CO2 (+ pr)) without a reduction in explained variability in ansvf and pr might be a good combination of proxies to pre- N2 O and (N2 O + N2 ) fluxes (Fig. 7, Table S2) due to the dict N2 O emissions to capture physical and microbial prop- very strong log-linear relationship between the εt and Dsim erties. (Fig. 4e). However, totally neglecting any proxy for O2 sup- Biogeosciences, 18, 1185–1201, 2021 https://doi.org/10.5194/bg-18-1185-2021
You can also read