Exendin 4 alleviates steatosis in an in vitro cell model by lowering FABP1 and FOXA1 expression via the Wnt/ catenin signaling pathway - Nature
←
→
Page content transcription
If your browser does not render page correctly, please read the page content below
www.nature.com/scientificreports
OPEN Exendin‑4 alleviates steatosis
in an in vitro cell model by lowering
FABP1 and FOXA1 expression
via the Wnt/‑catenin signaling
pathway
Olfa Khalifa1, Neyla S. AL‑Akl1, Khaoula Errafii1,2 & Abdelilah Arredouani1,2*
Non-alcoholic fatty liver disease (NAFLD) is the leading chronic liver disease worldwide. Agonists
of the glucagon-like peptide-1 receptor (GLP-1R), currently approved to treat type 2 diabetes, hold
promise to improve steatosis and even steatohepatitis. However, due to their pleiotropic effects, the
mechanisms underlying their protective effect on NAFLD remain elusive. We aimed to investigate
these mechanisms using an in vitro model of steatosis treated with the GLP-1R agonist Exendin-4
(Ex-4). We established steatotic HepG2 cells by incubating the cells with 400 µM oleic acid (OA)
overnight. Further treatment with 200 nM Ex-4 for 3 h significantly reduced the OA-induced lipid
accumulation (p < 0.05). Concomitantly, Ex-4 substantially reduced the expression levels of Fatty Acid-
Binding Protein 1 (FABP1) and its primary activator, Forkhead box protein A1 (FOXA1). Interestingly,
the silencing of β-catenin with siRNA abolished the effect of Ex-4 on these genes, suggesting
dependency on the Wnt/β-catenin pathway. Additionally, after β-catenin silencing, OA treatment
significantly increased the expression of nuclear transcription factors SREBP-1 and TCF4, whereas Ex-4
significantly decreased this upregulation. Our findings suggest that direct activation of GLP-1R by Ex-4
reduces OA-induced steatosis in HepG2 cells by reducing fatty acid uptake and transport via FABP1
downregulation.
Non-alcoholic fatty liver disease (NAFLD), defined as the excessive accumulation of lipids in the liver, is the
most common cause of chronic liver disease in industrialized nations1 and the most frequent indication for liver
transplantation2,3. NAFLD refers to a group of liver diseases that includes simple steatosis (benign fatty infiltra-
tion), non-alcoholic steatohepatitis (NASH) (fatty infiltration plus inflammation), fibrosis, and cirrhosis, which
occasionally progresses to hepatocellular c arcinoma4. NAFLD is associated with several comorbidities, including
type 2 diabetes (T2D), cardiovascular diseases (CVD), and chronic kidney disease (CKD)5. The mechanisms
underlying the above associations remain elusive. However, given the liver’s crucial role in many aspects of the
metabolism of lipids, carbohydrates, and proteins, it is appreciated that any injury to the liver will potentially
impact several o rgans6. NAFLD’s etiology is not fully elucidated. However, it is accepted that visceral adiposity,
insulin resistance, T2D, hypertension, and dyslipidemia are significant contributors to NAFLD development7.
There is currently no approved pharmacotherapy for NAFLD. Hitherto, weight loss is the only intervention
proven to be significantly beneficial for NAFLD p atients8. Losing 5% of one’s bodyweight improves abnormal
liver tests and reduces liver f at9, whereas losing 7 to 10% of one’s body weight appears to reduce inflammation
and injury to liver cells and may even reverse some fibrosis damage10. Unfortunately, most people find it difficult
to lose the weight they need to improve NAFLD and much more challenging to keep it off. Hence, there is an
urgent need for novel therapeutic approaches to improve NAFLD independently of weight loss.
Agonists of the glucagon-like peptide-1 receptor (GLP-1R) have recently been investigated to treat NAFLD
due to their bodyweight-lowering e ffects11. GLP-1 is a multifaceted hormone secreted by the L cells of the
intestine12. Among other things, GLP1 regulates blood glucose levels by stimulating glucose-dependent insulin
release and decreasing glucagon secretion, promotes proliferation of pancreatic b-cells, slows gastric emptying,
1
Diabetes Research Center, Qatar Biomedical Research Institute, Hamad Bin Khalifa University, Qatar Foundation,
PO Box: 34110, Doha, Qatar. 2College of Health and Life Sciences, Hamad Bin Khalifa University, Qatar
Foundation, Doha, Qatar. *email: aarredouani@hbku.edu.qa
Scientific Reports | (2022) 12:2226 | https://doi.org/10.1038/s41598-022-06143-5 1
Vol.:(0123456789)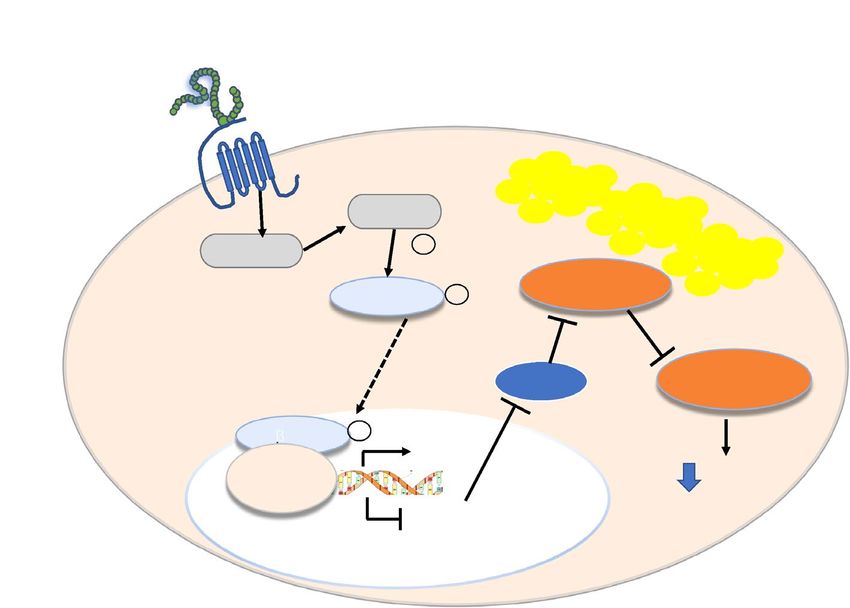
www.nature.com/scientificreports/
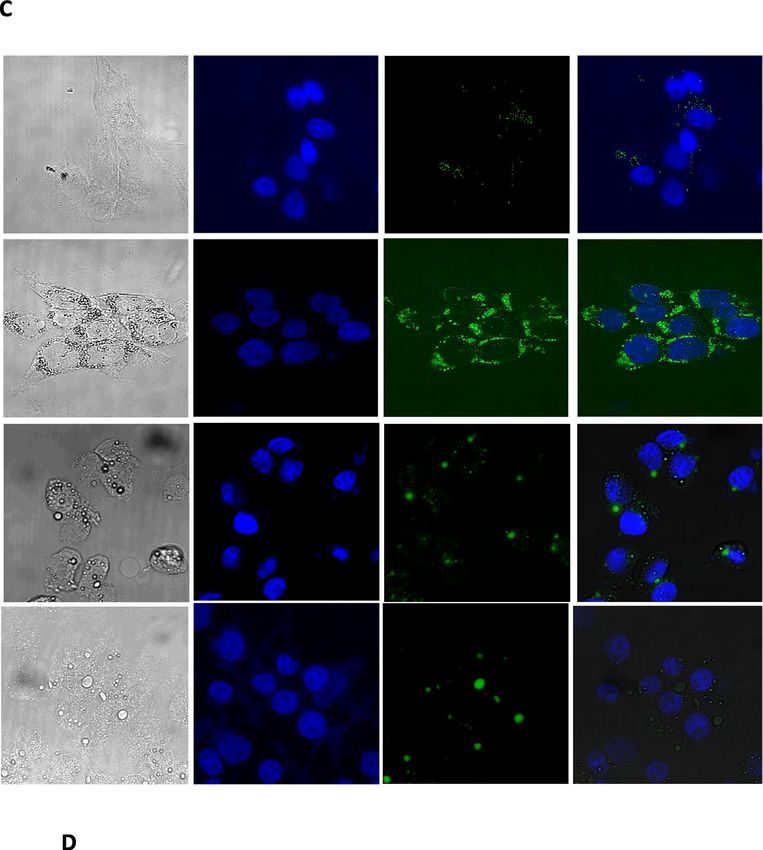
Figure 1. Exendin-4 reduces Oleic acid-induced lipid accumulation in HepG2 cells. Except from the ▸
experiment in panel (A), in all other experiments, HepG2 cells were starved for 6 h and then treated with Oleic
acid (OA; 400 μM) for 16 h followed by 3 h treatment with OA with or without Exendin-4 (Ex-4; 200 nM).
(A) OA dose-dependent TGs accumulation in HepG2 cells. (B) Exendin-4 significantly reduces OA-induced
rise in TGs content in HepG2 cells. (C) Confocal imaging of lipid droplets after staining with 0.2 mM
BODIPY 493/503 (green) and DAPI (blue). The white dots in the bright field images indicate lipid droplets
(D) Quantification of the lipid content with the BODIPY/DAPI fluorescence ratio in the presence of OA or
OA + EX-4. We analyzed 200 cells for each condition. (E) Quantification of mRNA expression levels of perilipin
1 (Plin1), perilipin 2 (Plin2) and perilipin 3 (Plin3). The expression levels were normalized to the level of
β-actin. All values are expressed as the mean ± SE (n = 6). *p < 0.05, **p < 0.01, ***p < 0.001.
and inhibits satiety and food intake through effects on central nervous system centers13,14. This pleiotropic effect
is due to the expression of the GLP-1 receptor by various organs such as the pancreas, brain, kidney, gut, lung,
heart, muscle, and liver15. Some GLP-1R agonists, like Liraglutide (taken once daily) or Dulaglutide (taken once
weekly), are already licensed for T2D and obesity management in humans due to their ability to mimic the
effects of GLP-116–18.
Given their weight loss-inducing effect, by reducing satiety and food intake, the impact of the GLP-1R ago-
nists on liver fat content has been investigated in numerous in vivo studies and yielded promising results19–35.
As a result, these drugs are suggested as potential options for treating and slowing the progression of NAFLD.
Nonetheless, it is unclear whether the protective effect of GLP-1R agonists on fat content stems from weight loss,
which, among other things, increases insulin sensitivity and improves glycemia and lipid profile, or from direct
activation of the hepatic GLP-1R. Gupta and c olleagues36 were the first to report GLP-1 receptor expression
in human hepatocytes and proposed that they play a direct role in reducing hepatic steatosis in vitro through
the modulation of effectors of the insulin signaling pathway. Recently, Seo and coworkers37 suggested that the
GLP-1R agonist Exendin-4 (Ex-4) reduces fat content in an in vitro cell model of steatosis by inhibiting hepatic
lipogenesis through activation of β-catenin signaling and modulation of the expression of several lipogenesis
genes. β-catenin was also suggested to mediate the effect of GLP-1 receptor agonist Exenatide on ameliorating
hepatic steatosis induced by a high fructose diet in r ats38. The β-catenin is an intracellular signal transducer in the
Wnt signaling pathway, which maintains hepatic homeostasis and contributes to specific hepatic characteristics,
including liver m etabolism39 and metabolic zonation r egeneration40.
Hepatic lipid content and homeostasis are determined by: (a) circulating free fatty acid uptake, (b) hepatic
de novo lipogenesis, (c) hepatic β-oxidation, and (d) hepatic lipid export via very-low-density lipoprotein
(VLDL)41,42. We used HepG2 cells treated with Oleic Acid (OA) as a model of hepatic steatosis in this study to
see if direct activation of the GLP-1R with Ex-4 affects any of the four processes listed above and thus improves
steatosis. The use of the in vitro model allows us to demonstrate the direct effect of Ex-4 on GLP-1R and to
overcome the pleiotropic effect of GLP-1R agonism in vivo.
Materials and methods
HepG2 culture. We obtained the human hepatoma HepG2 cell line (HB-8065, ATCC) from ATCC
(Manassa, Virginia, USA) and maintained it in Dulbecco’s modified Eagle’s medium (DMEM) (31966047, Gibco,
Massachusetts, USA) at 37 °C and 5% CO2. DMEM was supplemented with 10% FBS (10500064, Gibco, Mas-
sachusetts, USA) and 1% penicillin/streptomycin (15070063, Gibco, Massachusetts, USA). We performed all the
experiments with cells passaged fewer than 25 times.
Preparation of oleic acid. We prepared the oleic acid solution as in43. Briefly, we dissolved the powder
OA (O-1008 Sigma-Aldrich, Germany) at a final concentration of 12 mM in phosphate-buffered saline (PBS;
137 mM NaCl, 10 mM phosphate, 2.7 mM KCl, and pH 7.4) that contained 11% fatty acid-free bovine serum
albumin (FFA-BSA; 0215240110, MP Biomedicals, Santa Ana, CA, USA). The solution was then sonicated and
shaken at 37 °C overnight using an OM10 Orbital Shaking Incubator (Ratek Instruments Pty, Ltd., Boronia,
Australia). The OA solution was filtered using a 0.22 µm filter, aliquoted, and stored at 4 °C. We used a fresh
aliquot for each experiment.
Induction of steatosis. To establish the steatosis cell model, we first determined the optimal concentration
of OA needed to obtain saturating levels of triglycerides (TGs). To this aim, we cultured HepG2 cells in 6-well
plates at a density of 4 × 10⁵ cells/well until 70% confluence. We then starved the cells for 6 h in DMEM contain-
ing 1% fatty-acid-free bovine serum albumin. Following the starvation, a 16-h incubation in DMEM containing
increasing concentrations of OA (0–500 µM) at 37 °C was performed, and steatosis was quantified (Fig. 1A).
Treatment with exendin‑4. After steatosis induction, the cells were washed and incubated in fresh
DMEM containing 400 μM OA in the absence or presence of Ex-4 (E7144-0.1MG, Tocris, Minneapolis, Min-
nesota). To determine the optimal concentration of Ex-4, we treated the steatotic cells with increasing concentra-
tions of Ex-4 from 0 to 1 mM and with different incubation periods (3, 6, 12, and 24 h). We then quantified the
TG content as above. We used a fresh aliquot of EX-4 for each experiment.
Scientific Reports | (2022) 12:2226 | https://doi.org/10.1038/s41598-022-06143-5 2
Vol:.(1234567890)www.nature.com/scientificreports/
D
Scientific Reports | (2022) 12:2226 | https://doi.org/10.1038/s41598-022-06143-5 3
Vol.:(0123456789)www.nature.com/scientificreports/
Gene GenBank IDs Forward sequence (5′ 3’) Reverse sequence (5′ 3’) PCR product sizes (pb)
SREBP-1 U00968.1 GGCTCCTGCCTACAGCTTCT CAGCCAGTGGATCACCACA 109
PPARγ AB247367.1 GACCTCAGACAGATTGTCAC AGTCCTTGTAGATCTCCTGC 106
SCD1 NM_005063.5 CACCACATTCTTCATTGATTGCA ATGGCGGCCTTGGAGACT 75
FAS BC063242.1 TATGCTTCTTCGTGCAGCAGTT GCTGCCACACGCTCCTCTAG 94
ACC NM_198838.2 CAGAAGTGACAGACTACAGG ATCCATGGCTTCCAGGAGTA 125
DGAT1 NM_012079.6 AACTGGTGTGTGGTGATGCT CCTTCAGGAACAGAGAAACC 112
DGAT2 AY358532.1 CTACAGGTCATCTCAGTGCT GAAGTAGAGCACAGCGATGA 120
β-catenin NM_001330729.2 GCAAGCTCATCATACTGGCT CTTGCATTCCACCAGCTTCT 162
PLIN1 NM_001145311.2 GATCATGAGGACCAGACAGA CTGCTACCTCACTGAACTTG 91
PLIN2 NM_001122.4 ACAGACCATTTCTCAGCTCCAT TATCCAATGCTCCTTTTCCACT 141
PLIN3 NM_001164194.2 GAACAGAGCTACTTCGTACG CAGTTTCCATCAGGCTTAGG 151
FOXA1 NM_004496.5 GCAATACTCGCCTTACGGCT TACACACCTTGGTAGTACGCC 128
ApoB NM_000384.3 TGCTCCACTCACTTTACCGTC TAGCGTCCAGTGTGTACTGAC 199
FABP1 NM_001443.3 ATGAGTTTCTCCGGCAAGTAC CTCTTCCGGCAGACCGATT 81
GLP-1R 2740 TTG GGG TGA ACT TCC TCA TC CTT GGC AAG TCT GCA TTT GA 74
β-actin NM_001101.5 TCATGAAGATCCTCACCGAG CATCTCTTGCTCGAAGTCCA 116
Table 1. Primer list and sequences.
Quantification of steatosis. We used three methods to quantify steatosis in HepG2 cells:
1) Quantification of triglycerides
We measured total TGs levels using a commercial fluorometric assay kit (Abcam TG quantification assay
kit, ab65336) and a microplate reader (Infinite F200 Pro; Tecan, Switzerland). The kit converts triglycerides
to free fatty acids and glycerol. Glycerol is then oxidized to generate a product that reacts with a probe to
generate fluorescence when excited at 535 nm. The emitted fluorescence is collected at 587 nm. We calcu-
lated the TGs content from a standard curve prepared for each assay using known TGs concentrations. We
normalized the data to total cellular protein content.
2) Staining of neutral lipids with BODIPY 493/503
To visualize the accumulation of lipids in response to OA treatment, we used boron-dipyrromethene
(BODIPY) 493/503 (D3922, Thermo Fisher Scientific, MA, USA), which labels specifically intracellular
neutral lipids44. Briefly, we grew HepG2 on 12 mm coverslips until 70% confluence, starved them, and then
treated them with OA and Ex-4 as needed. After a quick wash, we fixed the cells with 4% paraformaldehyde
for 7 min, washed them with PBS, and then incubated them for 10 min with 0.2 μM BODIPY 493/503. We
further labeled the nuclei by incubating the cells with 1 μM DAPI for 1 min. After a final wash with PBS, we
mounted the coverslips on microscope slides used for imaging on a Zeiss LSM 870 confocal microscope,
as we reported r ecently45. To analyze the images, we used ImageJ software (version 1.8.0, NIH, USA). The
intracellular lipid accumulation was calculated by dividing the BODIPY fluorescence intensity by that of
DAPI. Two independent researchers analyzed 200 individual cells for each condition (untreated, steatotic,
and Ex-4-treated steatotic cells) from three different experiments.
3) Relative expression of perilipin genes
Perilipin family proteins, with five recognized members (PLIN1-5), are found on the surfaces of intracel-
roplets46. We used qRT-PCR to quantify the relative expression of PLIN1, 2, and 3 and estimate
lular lipid d
the lipid accumulation in response to OA and EX-4 treatments. The primers we utilized for the genes are
listed in Table 1.
Quantification of lipogenesis gene expression. To quantify gene expression, we used the Pure Link
RNA Mini kit (12183025, Invitrogen, USA), Hilden, Germany) to extract total RNA from untreated and treated
HepG2 cells and used High-Capacity cDNA Reverse Transcription kit (4368813, Applied Biosystems, Foster City,
CA, USA) and 2 μg total RNA to prepare cDNA. We quantified gene expression by qRT-PCR on QuantStudio 6
Flex system (ThermoFisher, Waltham, MA), using PowerUp™ SYBR™ Green Master Mix (A25780, Applied Bio-
systems, USA). We normalized the data to β-actin as an internal control and used the comparative 2-ΔΔCT method
to calculate the relative expression. We have quantified the expression level of the following genes: Fatty Acid
Synthase (FAS), Acyl-CoA Dehydrogenase Long Chain (ACADL), Carnitine Palmitoyltransferase 1A (CPT1A),
Stearoyl-CoA Desaturase 1 (SCD-1), Acetyl-CoA Carboxylase Alpha (ACC), Diacylglycerol O-acyltransferase 1
(DGAT1), Diacylglycerol O-acyltransferase 2 (DGAT2), Sterol Regulatory Element Binding Transcription Fac-
tor 1 (SREBP-1), Peroxisome Proliferator-Activated Receptor Gamma (PPARγ), Fatty Acid Binding Protein 1
(FABP1), Forkhead box A1 (FOXA1) and Apolipoprotein B (APOB). Table 1 lists the sequences of the primers
we used in this study. We used Primer-BLAST (https://www.ncbi.nlm.nih.gov/tools/primer-blast/) to design
specific primers that met the following criteria: (1) Primer pairs are unique. They will not bind to other locations
in the genome except the intended gene or DNA fragment. (2) Primer pairs do not bind to each other (forming
primer dimer): self-or hetero-dimer. (3) The possibility of forming the secondary structure of the primers, which
Scientific Reports | (2022) 12:2226 | https://doi.org/10.1038/s41598-022-06143-5 4
Vol:.(1234567890)www.nature.com/scientificreports/
may cause difficulties for PCR amplification, is very low. (4). Tm (temperature of mismatch) of two primers is
designed to be close to each other. (5) TA (Annealing temperature) is much lower than Tm. Moreover, our prim-
ers were analyzed by ’OligoAnalyzer 3.1’ program from IDT company (http://www.idtdna.com/calc/analyzer).
Gene silencing with siRNA. For siRNA-mediated β-catenin gene silencing, we transfected HepG2 cells
with 5 nM of β-catenin-specific siRNA or Stealth siRNA negative control, obtained from Dharmacon (Lafayette,
Colorado, USA), using Lipofectamine RNAiMAX transfection kit (13,778–075; Invitrogen, MA, USA) accord-
ing to the manufacturer’s instructions. After transfection, cells were cultured under normal growth conditions
(37 °C, 5% CO2) for 24 h without antibiotics. The silencing efficiency was checked by quantifying the expres-
sion of β-catenin with qRT-PCR. For GLP-1R gene silencing, we used the Dicer-Substrate Short Interfering
RNAs (DsiRNAs) and TriFECTa® Kits (http://www.idtdna.com/calc/analyzer) and the Lipofectamine RNAiMAX
transfection kit (13778-075; Invitrogen, MA, USA) to transfect HepG2 cells with 20 nM of GLP-1R specific
siRNA or negative scrambled siRNA, according to the manufacturer’s instructions. The DsiRNAs-TriFECTa®
kit contains three Dicer-substrate 27-mer RNA duplexes specific for a single target gene. A pool of the three
duplexes was used to silence GLP-1R. After the silencing of GLP-1R, a qRT-PCR was performed for the follow-
ing genes: PPARγ, FAS, DGAT1, DGAT2, and ACC. We normalized the data to β-actin as an internal control
and used the comparative 2-ΔΔCT method to calculate the relative expression.
Western blotting. After treating HepG2 cells with OA and Ex-4, we extracted nuclear and cytoplasmic pro-
teins using the PARIS™ Kit (AM1921, Ambion® PARIS™, Invitrogen, MA, USA). We resolved 20 mg of proteins
on 10% Tris–Glycine Mini Gels (Novex, XP00100BOX, Thermo Fisher Scientific) and then transferred them to
a 0.2 mM polyvinylidene difluoride (PVDF) membrane using the Trans-Blot Turbo (Bio-Rad, California, USA).
After the transfer, we incubated the membranes for 1 h at room temperature with the following primary antibod-
ies: anti-β-catenin (#9582; Cell signaling, Danvers, MA, USA), anti-TCF4 (#2569; Cell signaling, Danvers, MA,
USA), anti-SREBP-1 (sc-365513; Santa Cruz Biotechnology, Texas, USA), anti-β-actin (#4970; Cell signaling,
Danvers, MA, USA), anti-Lamin B1 (ab16048; Abcam, MA, USA), anti-FOXA1 (ab23738; Abcam, MA, USA),
anti-FABP1 (13368S, Cell Signaling, Ma, USA and anti-ACC (3676S, cell signalling, MA, USA) . After 3 × 10 min
washes with PBS, we incubated the membranes with the appropriate horseradish peroxidase-conjugated second-
ary antibody. We developed the membranes with the super signal west Femto Maximum Sensitivity Substrate
(34094, Thermo Fisher Scientific, USA), and Immunoreactive bands were detected by chemiluminescence on
Biorad ChemiDOC XRS (Biorad, CA, USA) machine. We normalized the results to β-actin as an internal control
for total proteins and Lamin-B1 for nuclear proteins. We used the dilutions recommended by the manufacturer
for all antibodies unless otherwise stated.
Statistical analysis. We performed the statistical analysis and the graphing with GraphPad Prism 9.0 soft-
ware (GraphPad Prism v9, La Jolla, CA, USA). Data are presented as the mean ± SEM. We used unpaired one-
way ANOVA analysis (ANOVA) to assess the significance of differences in mean values between experimental
groups, and Tukey’s posthoc test was used to adjust multiple comparisons between experimental groups. When
we silenced β-catenin, we used a two-way analysis of variance (ANOVA) to evaluate the significance of differ-
ences between the mean values of different experimental groups. Unless otherwise specified, a p-value of < 0.05
was considered significant.
Results
Exendin‑4 reduces lipid content in OA‑treated HepG2 cells. By treating HepG2 cells with increas-
ing OA concentrations for 16 h and measuring TG accumulation, we determined the optimal concentration of
OA required to induce steatosis (Fig. 1A). With 200 mM OA, we obtained a significant accumulation of TGs,
but with 400 mM, we obtained saturating levels of TGs (p < 0.001, relative to untreated). As a result, we used
400 mM OA to induce steatosis in all our experiments. On the other hand, we found that treating steatotic cells
with 200 nM Ex-4 for 3 h is optimal for reducing lipid accumulation significantly (data not shown). We then
compared TGs content between untreated cells, steatotic cells, i.e., cells treated with OA alone (400 µM /16 h),
and steatotic cells treated with Ex-4 (200 nM /3 h) in the continuous presence of 400 µM OA (OA + EX-4).
Figure 1B shows that in the presence of Ex-4, the TGs content was significantly lower than OA alone (p < 0.05),
suggesting that Ex-4 reduces the OA-induced lipid accumulation. Furthermore, confocal microscopy analysis of
BODIPY-stained untreated, steatotic, and Ex-4-treated steatotic cells showed that Ex-4 significantly decreases
the number of lipid droplets (Fig. 1C), confirming the significant reduction of the OA-induced accumulation of
lipids (p < 0.01) (Fig. 1D). We have also looked at the effect of Ex-4 on BODIPY staining in the absence of OA
and found that it is also significantly lower than OA alone (Fig. 1C,D).
PLIN proteins play a role in forming lipid droplets and regulating lipid storage47. PLIN4 is absent in the liver
and expressed weakly in the heart and skeletal m uscle48, whereas PLIN5 is expressed at a low level in the l iver49.
Previously, Carr and c olleagues50 reported that PLIN1 and PLIN2 proteins are upregulated in hepatic steatosis
and adult NASH. Since PLINs are associated with lipid droplets, their relative expression is proportional to the
number of lipid droplets.
We quantified gene expression of the lipid droplet binding proteins PLIN1, 2, and 3 and found that OA sig-
nificantly increases the expression of these genes (Fig. 1E), suggesting an increase in the number of lipid droplets.
Scientific Reports | (2022) 12:2226 | https://doi.org/10.1038/s41598-022-06143-5 5
Vol.:(0123456789)www.nature.com/scientificreports/
Scientific Reports | (2022) 12:2226 | https://doi.org/10.1038/s41598-022-06143-5 6
Vol:.(1234567890)www.nature.com/scientificreports/
◂Figure 2. Exendin-4 affects hepatocyte lipid metabolism genes by stimulating the GLP-1R. HepG2 cells were
starved for 6 h and then treated with Oleic acid (OA; 400 μM) for 16 h followed by 3 h treatment with OA
with or without exendin-4 (Ex-4; 200 nM). The expression levels of different genes were quantified with qRT-
PCR and normalized to the level of β-actin. (A–C) The mRNA expression levels of FAS (Fatty acid synthase),
ACADL (acyl-CoA dehydrogenase long chain), CPT1A (carnitine palmitoyltransferase 1A), SCD1(stearoyl-
CoA desaturase), ACC (acetyl-CoA carboxylase alpha), DGAT1 (diacylglycerol O-acyltransferase 1), DGAT2
(diacylglycerol O-acyltransferase 2), SREBP-1 (sterol regulatory element-binding transcription factor 1), PPARγ
(peroxisome proliferator-activated receptor-gamma), FABP1(fatty acid-binding protein 1 ), FOXA1 (forkhead
box A1), and APOB (apolipoprotein B) after treatment with OA alone or OA + Ex-4. (D) Silencing of GLP-1R.
HepG2 cells were transfected with 20 nM siRNA directed against GLP-1R for 24 h , GLP-1R mRNA expression
was quantified with qRTPCR. (E,F) GLP-1R proteins expression was quantified with western blot in HepG2.
Full-length blots are displayed in Supplementary Fig.S.1. (G,H) mRNA expression levels of PPARγ, FAS,
SCD1, DGAT1, and DGAT2 after transfection with scrambled GLP-1R siRNAs. All values are expressed as the
mean ± SE (n = 6). * p < 0.05, ** p < 0.01, *** p < 0.001.
However, in the presence of Ex-4, the expression of PLIN2 and PLIN3, but not PLIN1, was significantly lower
than OA alone, indicating that Ex-4 reduces the number of lipid droplets, and thus the lipid content.
Exendin‑4 counteracts the effect of OA on the expression of lipogenesis genes in HepG2
cells. Compared to untreated HepG2 cells, steatotic cells showed a significant upregulation of the lipogenesis
genes SREBP-1, PPARγ, FAS, CPT1A, SCD1, DGAT1, and DGAT2 (Fig. 2A,B), while ACADL expression was
significantly downregulated and ACC expression was unaffected. Interestingly, when compared to OA alone,
the presence of Ex-4 significantly decreased the expression of SREBP-1, PPARγ, CPT1A, ACC, DGAT1, and
SCD1 while the expression of ACADL, DGAT2 and FAS remained unaffected (Fig. 2A,B). Furthermore, while
OA treatment did not significantly change the expression levels of FABP1 and FOXA1 relative to untreated cells,
Ex-4 treatment significantly reduced the expression of these genes compared to OA treatment alone (Fig. 2C).
The ApoB expression, on the other hand, was significantly increased by OA treatment, but this increase was
significantly reversed by Ex-4 treatment (Fig. 2C). We then looked into whether the Ex-4’s impact on some of
these genes is mediated via the GLP-1R. To that purpose, we used specific siRNA to silence the GLP-1R and then
examined the expression of PPARγ, FAS, SCD1, DGAT1, and DGAT2 genes under the different treatment set-
tings. As illustrated in Fig. 2D–F, we achieved about 70% (p < 0.01) and 65% (p < 0.01) GLP-1R silencing at the
mRNA and protein levels, respectively. Furthermore, whereas GLP-1R silencing did not affect gene expression
in the presence of OA alone, we observed that the effect of Ex-4 on gene expression with scrambled siRNA is
reversed by GLP-1R silencing (Fig. 2G,H), indicating that GLP-1R is required for the action of Ex-4.
Exendin‑4 activates the β‑catenin pathway in HepG2 steatotic cells. Seo and c olleagues37 previ-
ously reported the activation of the β-catenin pathway in response to Ex-4. Here we confirm this activation
by silencing the β-catenin with siRNA and testing the effect of Ex-4 on the expression of the nuclear factors
SREPB-1 and TCF4, master transcription factors involved in the Wnt/β-catenin signaling. The knockdown effi-
ciency at the mRNA level was 70% and 65% for the cytoplasmic and nuclear fractions, respectively (Fig. 3A).
Similar results were obtained at the protein level (Fig. 3B,C). After silencing β-catenin, the significant OA-
induced upregulation of both SREPB-1 and TCF4 was reversed by Ex-4 (Fig. 3D–F), indicating the involvement
of the β-catenin pathway in the effect if Ex-4.
Exendin‑4 reduces FABP1 and FOXA1 expression through the activation of β‑catenin signal-
ing. To better understand the potential role of β-catenin as a molecular determinant through which Ex-4
mediates its beneficial effect on steatosis, we quantified the expression of FABP1, FOXA1, and ApoB after
β-catenin silencing. Compared to the scrambled siRNA transfection (Fig. 3G), the OA significantly increased
FABP1 mRNA expression, relative to untreated cells, following β-catenin knockdown (Fig. 3H, p = 0.032). How-
ever, the effect of OA on FOXA1 and ApoB expression, relative to untreated cells, was comparable between
scrambled transfection and by β-catenin knockdown (Fig. 3G,H). Interestingly, Ex-4 significantly reduces the
expression of FABP1, FOXA1, and ApoB, relative to OA alone, after scrambled transfection (Fig. 3G), but this
downregulation is reversed after β-catenin knockdown, (Fig. 3H). We then looked into the effect of β-catenin
silencing on the expression of PPARγ, FAS, CPT1A, SCD1, DGAT1, and DGAT2 mRNAs and found no signifi-
cant effect (Fig. 3I).
We further tested the effect of β-catenin silencing on the expression of FABP1, FOXA1 at the protein level
(Fig. 4A–C). We could not detect FABP1 with the antibody we used, despite using up to 60 mg of protein
and 1/200 antibody dilution (the company recommends 1/1000 dilution). Unlike the mRNA expression lev-
els (Fig. 3H), OA significantly downregulated the level of FOXA1 protein level following β-catenin silencing
(Fig. 4B). This downregulation was significantly reversed with Ex-4 (Fig. 4B). Together, these observations suggest
a posttranslational regulation that implicates the β-catenin pathway. Furthermore, we tested the effect of β-catenin
silencing on ACC. ACC catalyzes the ATP-dependent carboxylation of acetyl-CoA to malonyl-CoA in a multistep
reaction. It’s the first committed step in fatty acid synthesis, is rate-limiting for the pathway, and is tightly regu-
lated. As shown in Fig. 4A,C, after β-catenin silencing, OA significantly increases the expression of ACC at the
protein level, and Ex-4 further enhances this increase. The impact of Ex-4 on the the AC protein level contracts
with its impact on the mRNA, suggesting a posttranslational regulation that implicates the β-catenin pathway.
Scientific Reports | (2022) 12:2226 | https://doi.org/10.1038/s41598-022-06143-5 7
Vol.:(0123456789)www.nature.com/scientificreports/
Figure 3. Ex-4 downregulates the expression of lipogenic transcription factors via the β-catenin pathway.
Cytosolic and nuclear extracts were prepared from HepG2 cells transfected with 5 nM siRNA directed against
β-catenin for 24 h and then treated with 400uM OA in the absence or presence of 200 nM Ex-4. (A–C) Silencing
and quantification of β-catenin expression in cytoplasmic and nuclear fractions Full-length blots are displayed in
Supplementary Fig.S.2 and S.3. (D–F) western blotting and quantification of the transcription factors SREBP-1
and TCF4. Nuclear proteins were normalized against Lamin-B1. All values are expressed as the mean ± SE
(n = 6). * p < 0.05, ** p < 0.01, *** p < 0.001. Full-length blots are displayed in Supplementary Fig.S.4.
Scientific Reports | (2022) 12:2226 | https://doi.org/10.1038/s41598-022-06143-5 8
Vol:.(1234567890)www.nature.com/scientificreports/
Figure 4. Effect of EX-4 on the protein expression of FOXA1 and ACC implicates β-catenin pathways. (A)
Expression of FOXA1 and ACC was analyzed by western blotting in HepG2 cells transfected with 5 nM
scrambled siRNA or β-catenin specific siRNA and then treated with 400 mM OA or 400 mM OA + 200 nM Ex-4
as indicated. (B,C) Quantification of the blots in (A). For ACC, beta-actin was employed as a loading control,
while Lamin-B1 was used for FOXA1. All values are expressed as the mean ± SE (n = 3). * p < 0.05, ** p < 0.01, ***
p < 0.001. Full-length blots are displayed in Supplementary Fig.S.5.
Discussion
In this study, we investigated the possible mechanisms underlying the protective effect of the GLP-1R agonist
Ex-4 on hepatic steatosis in an in vitro cell model. We used the HepG2 cell line treated with oleic acid as a stea-
tosis model and confirmed that Ex-4 significantly reduces OA-induced lipid accumulation. GLP-1R agonists
have a wide range of complex physiological effects due to the widespread expression of the GLP-1 receptors
throughout the body14. Because of this pleiotropic effect, distinguishing between direct, i.e., via agonist-receptor
interaction, and indirect effects of these agonists in vivo is challenging. Therefore, it remains unclear whether
the reduction of steatosis observed in animal and human trials in response to treatment with GLP-1R agonists
results from direct activation of hepatic GLP-1R or the indirect impact such as weight loss, increased insulin
sensitivity, brain-liver signals such as brain leptin51, or other hormonal signals that these agonists might trigger14.
To overcome this challenge, we opted for the in vitro model to ascertain that Ex-4’s effect on steatosis results
from direct activation of the GLP-1R.
We found that the effect of Ex-4 on different lipid metabolism genes is abrogated following the silencing of
the GLP-1R (Fig. 2G,H), indicating that Ex-4’s effect is mediated through GLP-1R. The most important finding
of our study is the significantly lower expression of FABP1 (also known as liver-type fatty acid-binding protein
or L-FABP) in Ex-4-treated cells compared to steatotic cells (Fig. 2C). Fatty acid‐binding proteins (FABPs) are
small cytoplasmic proteins involved in intracellular lipid metabolisms such as fatty acid uptake, transport to
mitochondria or peroxisome for oxidation, lipid synthesis, storage in lipid droplets, and regulation of nuclear
receptors52. FABP1 is highly expressed in hepatocytes and is required for FFA uptake and shuttling53. Previously,
Wolfrum and c oworkers54 elegantly showed that increasing the FABP1 expression by treating HepG2 cells with
the potent peroxisome proliferators bezafibrate and Pirinixic acid leads to increased uptake of radio-labeled
oleic acid by 38% and 78%, respectively. Conversely, decreasing FABP1 expression by antisense FABP1 mRNA
to one-sixth of its regular expression reduces the ratio-labeled oleic acid uptake rate by 66%. Similar results were
obtained in F ABP1–/– mice following intravenous bolus administration of O A55. These findings indicate a direct
correlation between FABP1 expression and fatty acid uptake in the liver.
The Ex-4-induced FABP1 downregulation correlates with the significant reduction in TGs content observed
under the same treatment (Fig. 2C). Interestingly, the silencing of β-catenin with siRNA abrogates the effect of
Ex-4 on FABP1 expression (Fig. 3G,H), indicating its dependency on β-catenin signaling. To our knowledge,
Scientific Reports | (2022) 12:2226 | https://doi.org/10.1038/s41598-022-06143-5 9
Vol.:(0123456789)www.nature.com/scientificreports/
this is the first time a reduced FABP1 expression in response to direct activation of the GLP-1R is shown in
hepatocytes. Previously, Panjwani and colleagues reported significantly reduced levels of TGs and FABP1 in
liver cells from high-fat diet-fed male A poE(-/-) mice treated with taspoglutide, a long-lasting GLP-1R a gonist56.
However, the authors suggested the effect of taspoglutide was indirect as they could detect neither the protein
nor the mRNA of GLP-1R in liver cells. However, it is worth noting that several studies have reported GLP-1R
expression in both human and rodent hepatocytes36,57. We have also detected GLP-1R expression in HepG2
cells by western blotting and quantitative PCR (data not shown). Additionally, a recent study investigating the
effect of the GLP-1R agonist liraglutide on obesity-induced chronic kidney injury in obese rats showed that the
agonist significantly reduced the lipid content and, concomitantly, the expression level of FABP1 protein in the
obese kidney, relative to untreated r ats58.
In principle, four separate mechanisms may lead to hepatic lipid accumulation: (a) enhanced uptake of cir-
culating free fatty acids, (b) increased hepatic de novo lipogenesis, (c) diminished hepatic β-oxidation, and (d)
decreased hepatic lipid export via VLDL41,42. Therefore, one explanation for the Ex-4-induced improvement in
steatosis observed in our model could be a decreased fatty acid uptake by FABP1. This explanation is consistent
with the fact that FABP1 silencing in mice reduces liver weight and hepatic TG c ontent59,60, whereas FABP1
overexpression increases hepatic fatty acid u ptake61. Moreover, the expression of FABP1 is significantly higher
in the liver in obese patients with simple steatosis than in the obese healthy g roup62.
We have also observed that the presence of Ex-4 decreases the expression of ACC and DGAT1 (Fig. 2A),
which are critical rate‐limiting enzymes for fatty acid biosynthesis and TG formation, r espectively63,64. Previous
research on DGAT1-/- mice demonstrated that DGAT1 was required for hepatic steatosis caused by a high-fat
diet or fasting, both of which promote hepatic uptake of exogenous FAs, but not for hepatic steatosis caused
by upregulation of endogenous de novo FA s ynthesis65. As a result, the low DGAT1 expression observed in the
presence of Ex-4 is most likely a response to reduced FAs uptake rather than reduced de novo lipogenesis, ruling
out a role for reduced de novo lipogenesis in the Ex-4-induced steatosis improvement.
A decrease in ACC expression stimulates lipid β-oxidation by reducing the production of the β-oxidation
inhibitor malonyl-CoA66. Thus, an increased β-oxidation might explain the improved steatosis we observe in
the presence of Ex-4. Nevertheless, this possibility is ruled out by the fact that Ex-4 decreases the expression of
CPT1, the rate-limiting enzyme for mitochondrial β-oxidation67.
OA treatment significantly increases the expression of ApoB, an essential protein for the assembly and secre-
tion of TG-rich ApoB-containing lipoproteins, such as VLDL68. This increase in ApoB expression likely reflects
a compensatory mechanism to enhance the secretion of VLDL and hence reduce the content of TGs. Nonethe-
less, Ex-4 significantly reduces the OA-induced upregulation of ApoB (Fig. 2C). This finding is in line with a
previous study, which reported that continuous administration of fat diet-fed APOE*3-Leiden transgenic mice
with Ex-4 or CNTO3649, a GLP-1 peptide analog, results in reduced hepatic TGs, cholesterol, and phospho-
lipids in addition to down-regulation of ApoB expression69. Thereby, this observation excludes the significant
contribution of enhanced lipid export to the Ex-4-induced steatosis reduction. Interestingly, the Ex-4-induced
reduction of ApoB expression was blunted by the silencing of β-catenin (Fig. 3G,H), indicating its dependency
on β-catenin signaling.
The transcription factor FOXA1 is among the most effective activators of human F ABP170. We show that the
presence of Ex-4 significantly reduces the FOXA1 expression relative to OA alone (Fig. 2C), which may, in turn,
decrease FABP1 expression. Interestingly, FOXA1 is downregulated in liver samples from humans and rats with
simple steatosis71, probably as a feedback mechanism to reduce FAs uptake by FABP1. Furthermore, FOXA1
promotes fatty acid breakdown by inducing peroxisomal fatty acid b-oxidation71. Nonetheless, given the reduced
FOXA1 expression induced by Ex-4 in our study, it is unlikely that the observed Ex-4-induced TG content reduc-
tion is due to the stimulation of peroxisomal fatty acid -oxidation. Ex-4 induces a significant downregulation
of FOXA1 (Fig. 2C) compared to steatotic cells. However, this downregulation is abrogated upon silencing of
β-catenin (Fig. 3G,H), suggesting a role of the Wnt/β-catenin pathway in this process.
The involvement of the β-catenin signaling in the Ex-4-induced improvement in hepatic steatosis was sug-
gested previously by Seo and c oworkers37 who showed that the β-catenin inhibitor IWR-1 abrogates the pro-
tective effect of Ex-4 against palmitate-induced steatosis. Our results also indicate the potential involvement
of the β-catenin signaling pathway by showing the impact of Ex-4 on the expression of nuclear transcription
factors SREBP-1, a key regulator of lipid metabolism in the liver72, and TCF4, a central transcription factor in
the β-catenin pathway, when β-catenin is silenced. Hence, after β-catenin knockdown, OA treatment signifi-
cantly upregulates both SREBP-1 and TCF4 (Fig. 3D–F). However, the presence of Ex-4 drastically reduces this
upregulation. Interestingly, in the context of Wnt/β-catenin signaling-dependent liver tumorigenesis, it was
suggested that TCF4 might act in concert with the FOXA factors to regulate hepatocellular carcinoma-specific
Wnt target gene expression73. Therefore, GLP-1R stimulation may activate the β-catenin pathway, which may
result in a concerted action by TCF4 and FOXA1 to regulate the expression of FABP1 and hence prevent the
lipid accumulation induced by OA (Fig. 5). It is worth noting that FABP1was suggested as a critical driver gene
in hepatitis B X-protein-induced hepatic lipid accumulation74. However, further investigations are warranted to
decipher the complete mechanism underlying the protective effect of GLP1R agonists against hepatic steatosis.
Scientific Reports | (2022) 12:2226 | https://doi.org/10.1038/s41598-022-06143-5 10
Vol:.(1234567890)www.nature.com/scientificreports/
Figure 5. Proposed simplified signaling mechanism for Exendin-4-induced steatosis improvement.
Exendin-4 action is mediated by directly binding to the Glucagon-Like Peptide-1 Receptor (GLP-1R) on the
plasma membrane. The activation of the GLP-1R, which is coupled positively to the adenylyl cyclase (AC)
system, stimulates AC and increases intracellular cAMP and activation of protein kinase A (PKA). The PKA
phosphorylates and activates β-catenin, which is subsequently translocated to the nucleus. Nuclear β-catenin
then binds to T-cell factor (Tcf) to form a bipartite transcription factor and facilitates the positive or negative
modulation of the Tcf-dependent genes, leading, among other effects, to reduced expression of the transcription
factor Forkhead Box A1 (FOXA1). The lower expression of FOXA1, one of the most effective activators of the
human Fatty Acid Binding Protein 1 (FABP1), results in downregulation of FABP1, which leads to reduced
uptake and transport of fatty acids and ultimately decreased steatosis.
In conclusion, the present study proposes that the direct activation of GLP-1R by Ex-4 reduces OA-induced
steatosis in HepG2 cells by stimulating the Wnt/β-catenin signaling pathway, which reduces FOXA1 expres-
sion. FOXA1 downregulation, in turn, reduces FABP1 expression, which ultimately leads to a decrease in FFAs
uptake. Targeting FABP1 expression in the liver could be beneficial as a medical treatment for fatty liver disease.
Received: 12 September 2021; Accepted: 24 January 2022
References
1. Younossi, Z. M. Non-alcoholic fatty liver disease—A global public health perspective. J. Hepatol. 70(3), 531–544 (2019).
2. Haldar, D. et al. Outcomes of liver transplantation for non-alcoholic steatohepatitis: A european liver transplant registry study. J.
Hepatol. 71(2), 313–322 (2019).
3. Cotter, T. G. & Rinella, M. Nonalcoholic fatty liver disease 2020: The state of the disease. Gastroenterology 158(7), 1851–1864
(2020).
4. Perumpail, B. J. et al. Clinical epidemiology and disease burden of nonalcoholic fatty liver disease. World J. Gastroenterol. 23(47),
8263–8276 (2017).
5. Glass, L. M., Hunt, C. M., Fuchs, M. & Su, G. L. Comorbidities and nonalcoholic fatty liver disease: The chicken, the egg, or both?.
Fed. Pract. 36(2), 64–71 (2019).
6. Alves-Bezerra, M. & Cohen, D. E. Triglyceride metabolism in the liver. Compr. Physiol. 8(1), 1–8 (2017).
7. Lonardo, A., Mantovani, A., Lugari, S. & Targher, G. NAFLD in some common endocrine diseases: Prevalence, pathophysiology,
and principles of diagnosis and management. Int. J. Mol. Sci. 20, 11 (2019).
8. Yoo, E. R. et al. When to initiate weight loss medications in the NAFLD population. Diseases 6, 4 (2018).
9. Hsu, C. C., Ness, E. & Kowdley, K. V. Nutritional approaches to achieve weight loss in nonalcoholic fatty liver disease. Adv. Nutr.
8(2), 253–265 (2017).
10. van der Windt, D. J., Sud, V., Zhang, H., Tsung, A. & Huang, H. The effects of physical exercise on fatty liver disease. Gene Expr.
18(2), 89–101 (2018).
11. Sargeant, J. A. et al. A Review of the effects of glucagon-like peptide-1 receptor agonists and sodium-glucose cotransporter 2
inhibitors on lean body mass in humans. Endocrinol. Metab. (Seoul). 34(3), 247–262 (2019).
12. Müller, T. D. et al. Glucagon-like peptide 1 (GLP-1). Mol. Metab. 30, 72–130 (2019).
13. Nadkarni, P., Chepurny, O. G. & Holz, G. G. Regulation of glucose homeostasis by GLP-1. Prog. Mol. Biol. Transl. Sci. 121, 23–65
(2014).
Scientific Reports | (2022) 12:2226 | https://doi.org/10.1038/s41598-022-06143-5 11
Vol.:(0123456789)www.nature.com/scientificreports/
14. Rowlands, J., Heng, J., Newsholme, P. & Carlessi, R. Pleiotropic effects of GLP-1 and analogs on cell signaling, metabolism, and
function. Front. Endocrinol. (Lausanne). 9, 672 (2018).
15. Campbell, J. E. & Drucker, D. J. Pharmacology, physiology, and mechanisms of incretin hormone action. Cell Metab. 17(6), 819–837
(2013).
16. Takase, T. et al. Improvement in treatment satisfaction after switching from liraglutide to dulaglutide in patients with type 2
diabetes: A randomized controlled trial. J. Diabet. Investig. 10(3), 699–705 (2019).
17. Nagaike, H. et al. Effect of dulaglutide versus liraglutide on glucose variability, oxidative stress, and endothelial function in type
2 diabetes: A prospective study. Diabet. Ther. 10(1), 215–228 (2019).
18. Prasad-Reddy, L. & Isaacs, D. A clinical review of GLP-1 receptor agonists: Efficacy and safety in diabetes and beyond. Drugs
Context. 4, 212283 (2015).
19. Armstrong, M. J. et al. Glucagon-like peptide 1 decreases lipotoxicity in non-alcoholic steatohepatitis. J. Hepatol. 64(2), 399–408
(2016).
20. Dougherty, J. A., Guirguis, E. & Thornby, K. A. A systematic review of newer antidiabetic agents in the treatment of nonalcoholic
fatty liver disease. Ann. Pharmacother. 55(1), 65–79 (2021).
21. Bouchi, R. et al. Reduction of visceral fat by liraglutide is associated with ameliorations of hepatic steatosis, albuminuria, and
micro-inflammation in type 2 diabetic patients with insulin treatment: A randomized control trial. Endocr. J. 64(3), 269–281 (2017).
22. Hupa-Breier, K. L. et al. Dulaglutide alone and in combination with empagliflozin attenuate inflammatory pathways and micro-
biome dysbiosis in a non-diabetic mouse model of NASH. Biomedicines. 9, 4 (2021).
23. Yamamoto, T. et al. Glucagon-like peptide-1 analogue prevents nonalcoholic steatohepatitis in non-obese mice. World J. Gastro-
enterol. 22(8), 2512–2523 (2016).
24. Han, X. et al. Liraglutide ameliorates obesity-related nonalcoholic fatty liver disease by regulating Sestrin2-mediated Nrf2/HO-1
pathway. Biochem. Biophys. Res. Commun. 525(4), 895–901 (2020).
25. Mantovani, A. et al. Glucagon-like peptide-1 receptor agonists for treatment of nonalcoholic fatty liver disease and nonalcoholic
steatohepatitis: An updated meta-analysis of randomized controlled trials. Metabolites. 11, 2 (2021).
26. Yang, M. et al. Liraglutide attenuates non-alcoholic fatty liver disease in mice by regulating the local renin-angiotensin system.
Front. Pharmacol. 11, 432 (2020).
27. Kuchay, M. S. et al. Effect of dulaglutide on liver fat in patients with type 2 diabetes and NAFLD: Randomised controlled trial
(D-LIFT trial). Diabetologia 63(11), 2434–2445 (2020).
28. Zhou, R. et al. Liraglutide alleviates hepatic steatosis and liver injury in T2MD rats via a GLP-1R dependent AMPK pathway. Front
Pharmacol. 11, 600175 (2020).
29. Song, T. et al. Effects of liraglutide on nonalcoholic fatty liver disease in patients with type 2 diabetes mellitus: A systematic review
and meta-analysis. Diabetes Ther. 12(6), 1735–1749 (2021).
30. Gao, H. et al. The Glucagon-like peptide-1 analogue liraglutide inhibits oxidative stress and inflammatory response in the liver of
rats with diet-induced non-alcoholic fatty liver disease. Biol. Pharm. Bull. 38(5), 694–702 (2015).
31. Valdecantos, M. P. et al. Differential effects of a glucagon-like peptide 1 receptor agonist in non-alcoholic fatty liver disease and
in response to hepatectomy. Sci. Rep. 8(1), 16461 (2018).
32. Wewer Albrechtsen, N. J. Glucagon receptor signaling in metabolic diseases. Peptides 100, 42–47 (2018).
33. Feng, W. H. et al. Effects of liraglutide, metformin and gliclazide on body composition in patients with both type 2 diabetes and
non-alcoholic fatty liver disease: A randomized trial. J. Diabet. Investig. 10(2), 399–407 (2019).
34. Somm, E. et al. The GLP-1R agonist liraglutide limits hepatic lipotoxicity and inflammatory response in mice fed a methionine-
choline deficient diet. Transl. Res. 227, 75–88 (2021).
35. Petit, J. M. & Vergès, B. GLP-1 receptor agonists in NAFLD. Diabetes Metab. 43(Suppl 1), 28–33 (2017).
36. Gupta, N. A. et al. Glucagon-like peptide-1 receptor is present on human hepatocytes and has a direct role in decreasing hepatic
steatosis in vitro by modulating elements of the insulin signaling pathway. Hepatology 51(5), 1584–1592 (2010).
37. Seo, M. H. et al. Exendin-4 inhibits hepatic lipogenesis by increasing β-catenin signaling. PLoS ONE 11(12), e0166913 (2016).
38. Gao, Z. et al. β-catenin mediates the effect of GLP-1 receptor agonist on ameliorating hepatic steatosis induced by high fructose
diet. Eur. J. Histochem. 64, 3 (2020).
39. Monga, S. P. Role of Wnt/β-catenin signaling in liver metabolism and cancer. Int. J. Biochem. Cell Biol. 43(7), 1021–1029 (2011).
40. Russell, J. O. & Monga, S. P. Wnt/β-catenin signaling in liver development, homeostasis, and pathobiology. Annu. Rev. Pathol. 13,
351–378 (2018).
41. Petta, S. et al. Pathophysiology of non alcoholic fatty liver disease. Int. J. Mol. Sci. 17, 12 (2016).
42. Geisler, C. E. & Renquist, B. J. Hepatic lipid accumulation: Cause and consequence of dysregulated glucoregulatory hormones. J.
Endocrinol. 234(1), R1-r21 (2017).
43. Alkhatatbeh, M. J., Lincz, L. F. & Thorne, R. F. Low simvastatin concentrations reduce oleic acid-induced steatosis in HepG(2)
cells: An in vitro model of non-alcoholic fatty liver disease. Exp. Ther. Med. 11(4), 1487–1492 (2016).
44. Qiu, B. & Simon, M. C. BODIPY 493/503 staining of neutral lipid droplets for microscopy and quantification by flow cytometry.
Bio Protoc. 6, 17 (2016).
45. Errafii, K., Al-Akl, N. S., Khalifa, O. & Arredouani, A. Comprehensive analysis of LncRNAs expression profiles in an in vitro model
of steatosis treated with Exendin-4. J. Transl. Med. 19(1), 235 (2021).
46. Itabe, H., Yamaguchi, T., Nimura, S. & Sasabe, N. Perilipins: a diversity of intracellular lipid droplet proteins. Lipids Health Dis.
16(1), 83 (2017).
47. Kimmel, A. R. & Sztalryd, C. The perilipins: Major cytosolic lipid droplet-associated proteins and their roles in cellular lipid stor-
age, mobilization, and systemic homeostasis. Annu. Rev. Nutr. 36, 471–509 (2016).
48. Chen, W. et al. Inactivation of Plin4 downregulates Plin5 and reduces cardiac lipid accumulation in mice. Am. J. Physiol. Endocrinol.
Metab. 304(7), E770–E779 (2013).
49. Zhong, W., Fan, B., Cong, H., Wang, T. & Gu, J. Oleic acid-induced perilipin 5 expression and lipid droplets formation are regulated
by the PI3K/PPARα pathway in HepG2 cells. Appl. Physiol. Nutr. Metab. 44(8), 840–848 (2019).
50. Carr, R. M. et al. Perilipin staining distinguishes between steatosis and nonalcoholic steatohepatitis in adults and children. Clin.
Gastroenterol. Hepatol. 15(1), 145–147 (2017).
51. Hackl, M. T. et al. Brain leptin reduces liver lipids by increasing hepatic triglyceride secretion and lowering lipogenesis. Nat. Com-
mun. 10(1), 2717 (2019).
52. Furuhashi, M. & Hotamisligil, G. S. Fatty acid-binding proteins: Role in metabolic diseases and potential as drug targets. Nat. Rev.
Drug Discov. 7(6), 489–503 (2008).
53. Wang, G., Bonkovsky, H. L., de Lemos, A. & Burczynski, F. J. Recent insights into the biological functions of liver fatty acid binding
protein 1. J. Lipid Res. 56(12), 2238–2247 (2015).
54. Wolfrum, C., Buhlmann, C., Rolf, B., Börchers, T. & Spener, F. Variation of liver-type fatty acid binding protein content in the
human hepatoma cell line HepG2 by peroxisome proliferators and antisense RNA affects the rate of fatty acid uptake. Biochim.
Biophys. Acta. 1437(2), 194–201 (1999).
55. Martin, G. G. et al. Decreased liver fatty acid binding capacity and altered liver lipid distribution in mice lacking the liver fatty
acid-binding protein gene. J. Biol. Chem. 278(24), 21429–21438 (2003).
Scientific Reports | (2022) 12:2226 | https://doi.org/10.1038/s41598-022-06143-5 12
Vol:.(1234567890)www.nature.com/scientificreports/
56. Panjwani, N. et al. GLP-1 receptor activation indirectly reduces hepatic lipid accumulation but does not attenuate development
of atherosclerosis in diabetic male ApoE(-/-) mice. Endocrinology 154(1), 127–139 (2013).
57. Yokomori, H. & Ando, W. Spatial expression of glucagon-like peptide 1 receptor and caveolin-1 in hepatocytes with macrovesicular
steatosis in non-alcoholic steatohepatitis. BMJ Open Gastroenterol. 7, 1 (2020).
58. Wang, C. et al. GLP-1 receptor agonist ameliorates obesity-induced chronic kidney injury via restoring renal metabolism homeo-
stasis. PLoS ONE 13(3), e0193473 (2018).
59. Mukai, T., Egawa, M., Takeuchi, T., Yamashita, H. & Kusudo, T. Silencing of FABP1 ameliorates hepatic steatosis, inflammation,
and oxidative stress in mice with nonalcoholic fatty liver disease. FEBS Open Bio. 7(7), 1009–1016 (2017).
60. Newberry, E. P. et al. Diet-induced obesity and hepatic steatosis in L-Fabp / mice is abrogated with SF, but not PUFA, feeding and
attenuated after cholesterol supplementation. Am. J. Physiol. Gastrointest. Liver Physiol. 294(1), G307–G314 (2008).
61. Wang, Y. et al. Fatty acid-binding protein 1 increases steer fat deposition by facilitating the synthesis and secretion of triacylglycerol
in liver. PLoS ONE 14(4), e0214144 (2019).
62. Charlton, M. Medical hurricane: Health care reform and hepatology. Hepatology 50(5), 1339–1340 (2009).
63. Kim, K. H. Regulation of mammalian acetyl-coenzyme A carboxylase. Annu. Rev. Nutr. 17, 77–99 (1997).
64. Cases, S. et al. Identification of a gene encoding an acyl CoA:diacylglycerol acyltransferase, a key enzyme in triacylglycerol syn-
thesis. Proc. Natl. Acad. Sci. U.S.A. 95(22), 13018–13023 (1998).
65. Villanueva, C. J. et al. Specific role for acyl CoA: Diacylglycerol acyltransferase 1 (Dgat1) in hepatic steatosis due to exogenous
fatty acids. Hepatology 50(2), 434–442 (2009).
66. Savage, D. B. et al. Reversal of diet-induced hepatic steatosis and hepatic insulin resistance by antisense oligonucleotide inhibitors
of acetyl-CoA carboxylases 1 and 2. J. Clin. Invest. 116(3), 817–824 (2006).
67. Lee, K., Kerner, J. & Hoppel, C. L. Mitochondrial carnitine palmitoyltransferase 1a (CPT1a) is part of an outer membrane fatty
acid transfer complex. J. Biol. Chem. 286(29), 25655–25662 (2011).
68. Davidson, N. O. & Shelness, G. S. APOLIPOPROTEIN B: mRNA editing, lipoprotein assembly, and presecretory degradation.
Annu. Rev. Nutr. 20, 169–193 (2000).
69. Parlevliet, E. T. et al. GLP-1 receptor activation inhibits VLDL production and reverses hepatic steatosis by decreasing hepatic
lipogenesis in high-fat-fed APOE*3-Leiden mice. PLoS ONE 7(11), e49152 (2012).
70. Guzmán, C. et al. The human liver fatty acid binding protein (FABP1) gene is activated by FOXA1 and PPARα; and repressed by
C/EBPα: Implications in FABP1 down-regulation in nonalcoholic fatty liver disease. Biochim. Biophys. Acta. 1831(4), 803–818
(2013).
71. Moya, M. et al. Foxa1 reduces lipid accumulation in human hepatocytes and is down-regulated in nonalcoholic fatty liver. PLoS
ONE 7(1), e30014 (2012).
72. Shimano, H. & Sato, R. SREBP-regulated lipid metabolism: convergent physiology—divergent pathophysiology. Nat. Rev. Endo-
crinol. 13(12), 710–730 (2017).
73. Wang, J. et al. TRIB2 acts downstream of Wnt/TCF in liver cancer cells to regulate YAP and C/EBPα function. Mol. Cell. 51(2),
211–225 (2013).
74. Wu, Y. L. et al. Hepatitis B virus X protein induces hepatic steatosis by enhancing the expression of liver fatty acid binding protein.
J. Virol. 90(4), 1729–1740 (2016).
Acknowledgements
We are grateful to Qatar Biomedical Research Institute for supporting this work.
Author contributions
A.A.: Conceptualization of the study. O.K.: Design and conceptualization of the experiments, qRT-PCR experi-
ments, protein assays, data collection, curation and analysis. N.A.: confocal imaging, protein assays and lipid
assays and data analysis. K.E.: Optimization of experiments. O.K. and A.A.: Interpretation of the results and
writing of the manuscript. All the authors read, edited, and approved the last version.
Funding
Open access funding provided by the Qatar National Library.
Competing interests
The authors declare no competing interests.
Additional information
Supplementary Information The online version contains supplementary material available at https://doi.org/
10.1038/s41598-022-06143-5.
Correspondence and requests for materials should be addressed to A.A.
Reprints and permissions information is available at www.nature.com/reprints.
Publisher’s note Springer Nature remains neutral with regard to jurisdictional claims in published maps and
institutional affiliations.
Open Access This article is licensed under a Creative Commons Attribution 4.0 International
License, which permits use, sharing, adaptation, distribution and reproduction in any medium or
format, as long as you give appropriate credit to the original author(s) and the source, provide a link to the
Creative Commons licence, and indicate if changes were made. The images or other third party material in this
article are included in the article’s Creative Commons licence, unless indicated otherwise in a credit line to the
material. If material is not included in the article’s Creative Commons licence and your intended use is not
permitted by statutory regulation or exceeds the permitted use, you will need to obtain permission directly from
the copyright holder. To view a copy of this licence, visit http://creativecommons.org/licenses/by/4.0/.
© The Author(s) 2022
Scientific Reports | (2022) 12:2226 | https://doi.org/10.1038/s41598-022-06143-5 13
Vol.:(0123456789)You can also read