Glycolysis and Fatty Acid Oxidation Inhibition Improves Survival in Glioblastoma
←
→
Page content transcription
If your browser does not render page correctly, please read the page content below
ORIGINAL RESEARCH
                                                                                                                                                published: 29 March 2021
                                                                                                                                          doi: 10.3389/fonc.2021.633210

                                              Glycolysis and Fatty Acid Oxidation
                                              Inhibition Improves Survival in
                                              Glioblastoma
                                              Kelly J. McKelvey 1*, Erica B. Wilson 2 , Susan Short 2 , Alan A. Melcher 3 , Michael Biggs 4 ,
                                              Connie I. Diakos 1,5,6 and Viive M. Howell 1
                                              1
                                                Bill Walsh Translational Cancer Research Laboratory, Faculty of Medicine and Health, The University of Sydney, St Leonards,
                                              NSW, Australia, 2 Translational Neuro-Oncology, Leeds Institute of Medical Research at St James’s, University of Leeds,
                                              Leeds, United Kingdom, 3 Translational Immunotherapy, Division of Radiotherapy and Imaging, Institute for Cancer Research,
                                              London, United Kingdom, 4 Department of Neurosurgery, North Shore Private Hospital, St Leonards, NSW, Australia,
                                              5
                                                Department of Medical Oncology, Northern Sydney Cancer Centre, Royal North Shore Hospital, St Leonards, NSW,
                                              Australia, 6 Northern Clinical School, Faculty of Medicine and Health, The University of Sydney, St Leonards, NSW, Australia

                                              Glioblastoma (GBM) is the most aggressive adult glioma with a median survival of 14
                                              months. While standard treatments (safe maximal resection, radiation, and temozolomide
                           Edited by:
             Sara Rodriguez-Enriquez,
                                              chemotherapy) have increased the median survival in favorable O(6)-methylguanine-DNA
                 Instituto Nacional de        methyltransferase (MGMT)-methylated GBM (∼21 months), a large proportion of patients
                  Cardiología, Mexico
                                              experience a highly debilitating and rapidly fatal disease. This study examined GBM
                      Reviewed by:
                                              cellular energetic pathways and blockade using repurposed drugs: the glycolytic inhibitor,
                          Jian Jian Li,
       University of California, Davis,       namely dicholoroacetate (DCA), and the partial fatty acid oxidation (FAO) inhibitor, namely
                       United States          ranolazine (Rano). Gene expression data show that GBM subtypes have similar glucose
                   Hiroaki Wakimoto,
 Massachusetts General Hospital and
                                              and FAO pathways, and GBM tumors have significant upregulation of enzymes in
           Harvard Medical School,            both pathways, compared to normal brain tissue (p < 0.01). DCA and the DCA/Rano
                       United States
                                              combination showed reduced colony-forming activity of GBM and increased oxidative
                  *Correspondence:
                                              stress, DNA damage, autophagy, and apoptosis in vitro. In the orthotopic Gl261 and
                     Kelly J. McKelvey
        kelly.mckelvey@sydney.edu.au          CT2A syngeneic murine models of GBM, DCA, Rano, and DCA/Rano increased median
                                              survival and induced focal tumor necrosis and hemorrhage. In conclusion, dual targeting
                   Specialty section:
                                              of glycolytic and FAO metabolic pathways provides a viable treatment that warrants
         This article was submitted to
                   Cancer Metabolism,         further investigation concurrently or as an adjuvant to standard chemoradiation for GBM.
               a section of the journal
                                              Keywords: glioblastoma, cancer metabolism, ranolazine, dichloroacetate, radiation, temozolomide
                 Frontiers in Oncology

       Received: 24 November 2020
        Accepted: 10 February 2021
         Published: 29 March 2021
                                              INTRODUCTION
                             Citation:        Glioblastoma (GBM) is a biologically heterogeneous and uniformly fatal disease. Verhaak et al.
   McKelvey KJ, Wilson EB, Short S,           (1) describe classical, mesenchymal, neural, and proneural subtypes of GBM based on an 840
 Melcher AA, Biggs M, Diakos CI and
                                              gene signature. These have been adopted as clinically relevant molecular subtypes with different
Howell VM (2021) Glycolysis and Fatty
   Acid Oxidation Inhibition Improves
                                              disease progression and prognosis. While brain cancer makes up 1.3% of all new cancer diagnoses
             Survival in Glioblastoma.        in Australia, it accounts for 3.2% of cancer-related deaths (2). GBM accounts for 54% of brain
            Front. Oncol. 11:633210.          cancer cases and has a 5-year survival rate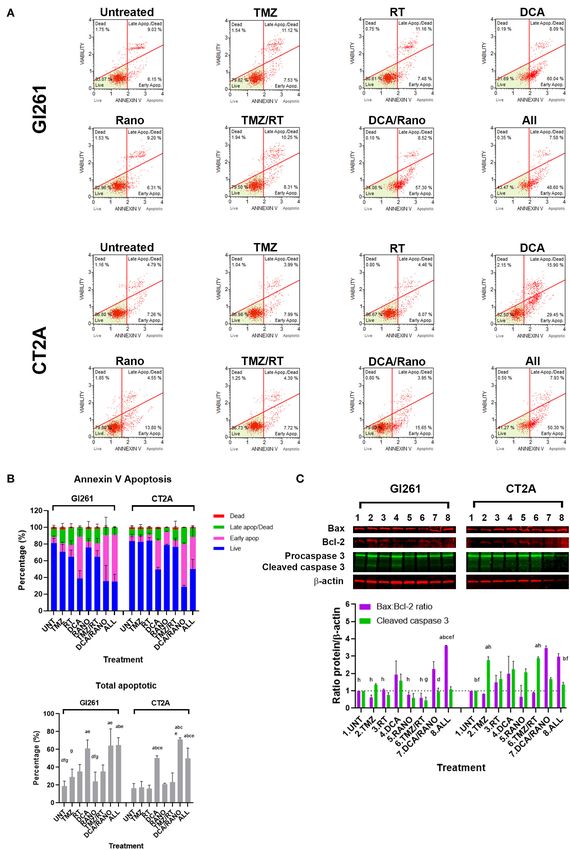
McKelvey et al.                                                                                      Metabolic Blockade Improves GBM Survival

(6); and metabolism (7), the current treatment for GBM                 MATERIALS AND METHODS
remains maximal safe surgical resection, followed by external
beam radiation therapy (RT) with concurrent and adjuvant               Human Gene Expression Data
temozolomide (TMZ) (8). This increases median overall survival         Gene lists for human glucose (#RAH49R3) and FAO metabolism
from 14 months for TMZ-resistant O(6)-methylguanine-DNA                (#RPKA3DE) were obtained from Taqman R Arrays (https://
methyltransferase (MGMT) promoter unmethylated GBMs to                 www.thermofisher.com). Gene expression and GBM subtype
21.2 months for TMZ-sensitive MGMT promoter methylated                 data from 48 primary GBM cell lines were acquired from the
GBMs (9).                                                              human glioblastoma cell culture (HGCC) Affymetrix Human
   In addition to a uniform reliance of cancer cells on aerobic        Exon 1.0 ST Array (NCBI Gene Omnibus GSE72217; https://
glycolysis, recent studies have demonstrated the dependence            www.ncbi.nlm.nih.gov/geo/) (20). Classical, mesenchymal,
of GBM cells on fatty acid oxidation (FAO) (7). Human                  proneural, and neural GBM subtyping was performed by HGCC
gliomas express the FAO enzymes medium-chain acyl-CoA                  (20) using the gene signatures described by Verhaak et al.
dehydrogenase (MCAD), short-chain L-3-hydroxyacyl-                     (1). Data were analyzed using Gene Cluster 3.0 for Windows,
CoA dehydrogenase (SCHAD), very-long-chain acyl-CoA                    Department of Genetics, Stanford University, CA, USA (21)
dehydrogenase (VLCAD), hydroxyacyl-CoA dehydrogenase                   and TreeView 3.0 beta1 for Windows, Department of Genetics,
(HADH)/3-ketoacyl-CoA          thiolase/enoyl-CoA     hydratase        Stanford University, CA, USA (22) with the Pearson’s correlation
(ECH), and carnitine palmitoyltransferase 1a (CPT1a)                   proximity-based hierarchical clustering. The Cancer Genome
and demonstrate decreased oxygen consumption in the                    Atlas (TCGA; https://www.cancer.gov/tcga) GBM, TCGA
presence of an FAO inhibitor, etomoxir (10). Genomic,                  normal, and the Genotype-Tissue Expression (GTEx; https://
metabolomic, and functional analyses by Prabhu et al. (7)              www.gtexportal.org/home/) data box plots were acquired
show that FAO is a key driver of progression from low-                 through the Gene Expression Profiling Interactive Analysis
grade gliomas into GBM. In a syngeneic glioma model                    (23) (GEPIA; available at http://gepia.cancer-pku.cn/). Data
(oncogenic neural stem cells), etomoxir increased survival             are expressed as the log2 fold change (FC) [defined as median
(10), whereas, the combination of etomoxir, glucose analog,            (tumor) – median (normal)].
and glycolytic inhibitor 2-deoxy-D-glucose (2-DG) led to
metabolic lethality in vitro and increased median survival             Cells
in MES93 mesenchymal GBM tumor-bearing mice (11).                      Murine glioma Gl261 cells were donated by Géza Safrany
Ranolazine (Rano), a partial FAO inhibitor, has shown                  (Frederic Joliot-Curie National Research Institute for Radiology
neuroprotective effects on healthy astrocytes and neurons              and Radiohygiene, Budapest, Hungary) and CT2A by Tomas
in rodent cell cultures (12). Targeting FAO in GBM also                Seyfried (Boston College, Boston, MA, USA). U-87 MG, U-
shows promise in alleviating the immunosuppressive tumor               251 MG, and T98G from the CellBank Australia, Westmead,
microenvironment as FAO ameliorates the tolerogenic and                NSW, Australia. Cell lines were authenticated by the Satellite
immunosuppressive mechanisms of tumor myeloid-derived                  Tandem Repeat profiling (Garvan Institute of Medical Research,
suppressor cells (MDSC) and reduces tumor growth in the                Sydney, NSW, Australia) and mycoplasma negative by the
syngeneic murine models of lung (3LL) and colon (MCA-38)               MycoProbe R Mycoplasma Detection Kit (R&D Systems, Inc.,
cancer (13).                                                           Minneapolis, MN, USA). Cells were cultured in Dulbecco’s
   Glycolytic inhibitor dichloroacetate (DCA) induces apoptosis        modified Eagle’s medium (DMEM) containing 10% v/v fetal
in GBM and putative GBM stem cells in vitro and in vivo                bovine serum (FBS) in a humidified incubator with 5% CO2 at
(14) and has demonstrated clinical efficacy in a small cohort          37◦ C with 60% relative humidity.
of patients with GBM (15). In addition, DCA sensitizes
GBM to radiation (16) and has synergistic effects on GBM               Treatments
growth and survival induced by mitochondrial oxidative                 Drugs used in this study were DCA (sodium DCA #347795;
stress, when combined with mitochondrial inhibitor 4-[N-               Sigma-Aldrich, St. Louis, MO, USA), TMZ (#T2577; Sigma-
(S-penicillaminylacetyl)amino] phenylarsonous acid (17) and            Aldrich St. Louis, MO, USA), and Rano (Rano dihydrochloride
when inhibiting stem cell self-renewal in combination with             #R6152; Sigma-Aldrich St. Louis, MO, USA) dissolved in
metformin (18).                                                        complete media for in vitro studies and in sterile water for in
   Glucose metabolism and reactive oxygen species (ROS)                vivo studies at stock concentrations of 40, 5, and 10 mg/ml,
are bidirectionally linked, and cancer cells are metabolically         respectively. X-ray radiation was delivered using the Small
adaptive to the changing oxygen and nutrient microenvironment          Animal Radiation Research Platform (SARRP; Xstrahl Inc.,
(19). Therein, it was hypothesized that dual blockade of the           Suwanee, GA, USA) at a dose rate of 2.97 Gy/min as described
glycolysis and FAO pathways would inhibit GBM tumor                    earlier (24). In all experiments, the drug treatment preceded
growth by increasing oxidative phosphorylation and enhancing           irradiation by 1 h to enable the drugs to act on their respective
chemoradiation-induced ROS. In the present study, we                   cellular targets. The cells were detached with 0.5% v/v and
investigative the novel combination of the glycolytic inhibitor,       trypsin/0.2% v/v ethylenediaminetetraacetic acid in phosphate-
DCA, and the partial FAO inhibitor, Rano, in two syngeneic             buffered saline (PBS) and counted by MUSE R cell count and
immune-competent models of GBM, against “standard of care”             viability assay (Luminex Corp., Austin, TX, USA) according to
chemoradiation.                                                        the instructions of the manufacturer.

Frontiers in Oncology | www.frontiersin.org                        2                                   March 2021 | Volume 11 | Article 633210
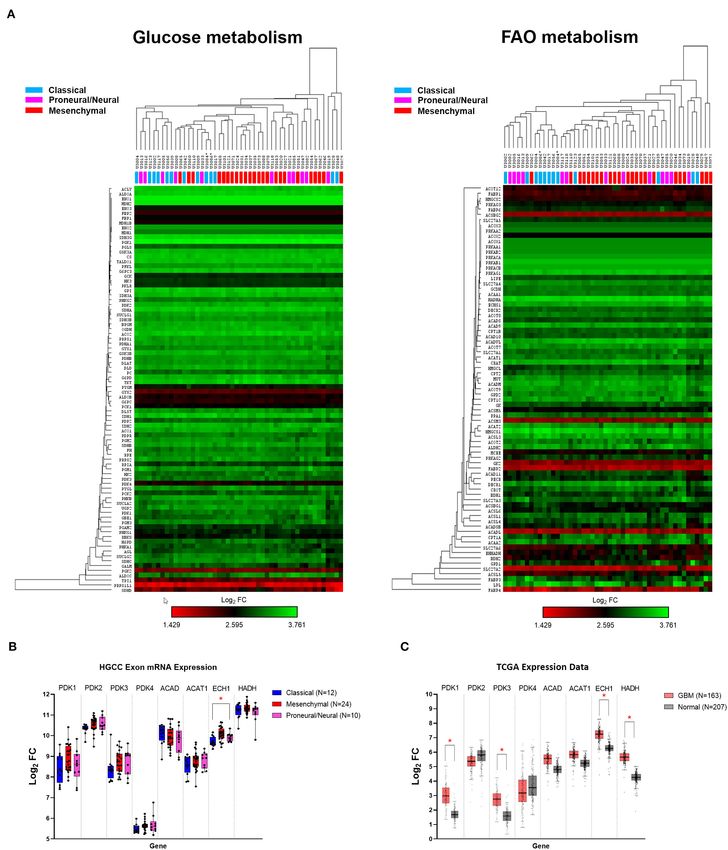
McKelvey et al.                                                                                                       Metabolic Blockade Improves GBM Survival

 FIGURE 1 | Human gene expression of glucose and fatty acid oxidation (FAO) pathways. (A) Heat map and hierarchical clustering of genes associated with the
 glucose and FAO metabolic pathways. (B) Human glioblastoma cell culture (HGCC) glioblastoma (GBM) subtype gene expression of selected targetable enzymes
 involved in glycolytic and β-oxidation pathways. (C) The Cancer Genome Atlas (TCGA) GBM vs. normal gene expression. Data are expressed as median ±
 interquartile range of log2 fold change [median (tumor) − median (normal)]. *p < 0.01 by the Kruskal–Wallis test with the Dunn’s multiple comparison test.

Frontiers in Oncology | www.frontiersin.org                                    3                                         March 2021 | Volume 11 | Article 633210
McKelvey et al.                                                                                                            Metabolic Blockade Improves GBM Survival

 FIGURE 2 | Sensitivity and survival of murine glioma cell lines to drug and radiation therapy (RT) treatment combinations. (A) Drug IC50s for temozolomide (TMZ),
 dicholoroacetate (DCA), and ranolazine (Rano) were determined from confluency at 72 h and for RT by clonogenic assay at 10 days post-treatment using a
 four-parameter logistic model. Symbols show mean survival (%) ± SEM for six replicates per experiment (N = 3). (B) Heat maps of the cell survival for TMZ/RT and
 DCA/Rano combinations. Black boxes represent the best synergy combination indices as calculated using the CompuSyn Software (Paramus, NJ, USA).

Frontiers in Oncology | www.frontiersin.org                                       4                                           March 2021 | Volume 11 | Article 633210
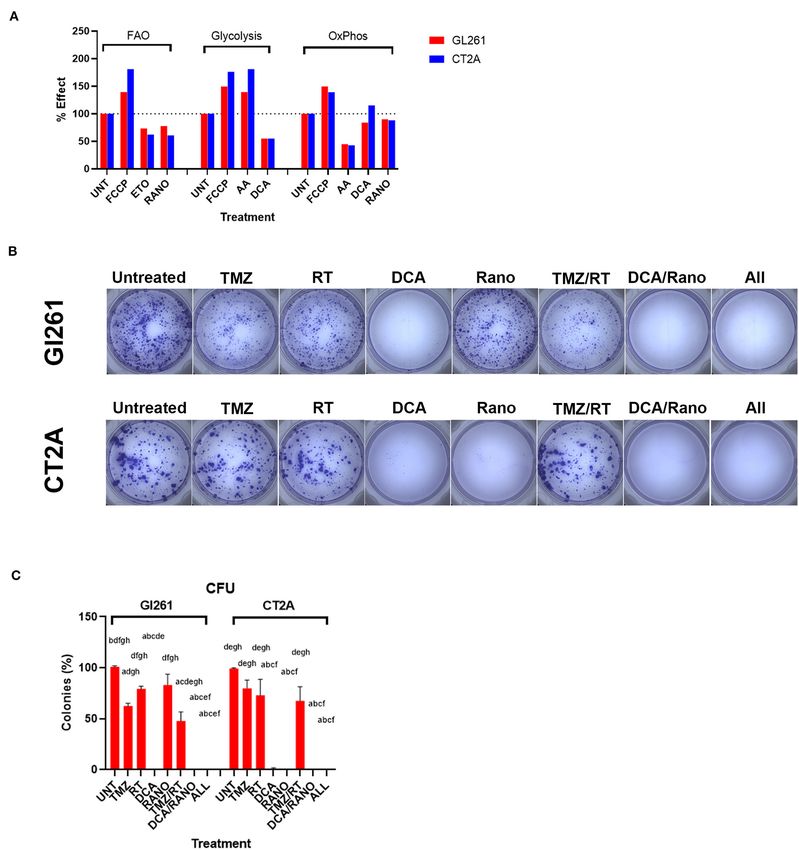
McKelvey et al.                                                                                                             Metabolic Blockade Improves GBM Survival

 FIGURE 3 | Temozolomide (TMZ), RT, DCA, and their combination reduce GBM cell proliferation. (A) Percentage effect of dual-read time-resolved fluorescent lifetime
 at 60-min post-treatment relative to untreated control (Unt) for fatty acid oxidation (FAO) and glycolytic and oxidative phosphorylation (OxPhos) metabolism. Carbonyl
 cyanide-4-(trifluoromethoxy)phenylhydrazone (FCCP; 2.5 µm), etomoxir (Eto; 40 µm), and antimycin A (AA; 1 µm) were used as positive and negative controls where
 appropriate. Data are expressed as mean of triplicates. (B) Micrographs of colonies (>50 cells) 10-day post-treatment. (C) Column graphs show mean ± SEM of
 triplicates from three independent experiments. Column graphs show the mean ± SEM from three independent experiments a p < 0.05 vs. Unt; b p < 0.05 vs. TMZ; c p
 < 0.05 vs. RT; d p < 0.05 vs. DCA; e p < 0.05 vs. ranolazine (Rano); f p < 0.05 vs. TMZ/RT; g p < 0.05 vs. DCA/Rano; and h p < 0.05 vs. All-combined treatments were
 determined by Kruskal–Wallis test alongwith the Dunn’s multiple comparison test.

Frontiers in Oncology | www.frontiersin.org                                        5                                           March 2021 | Volume 11 | Article 633210
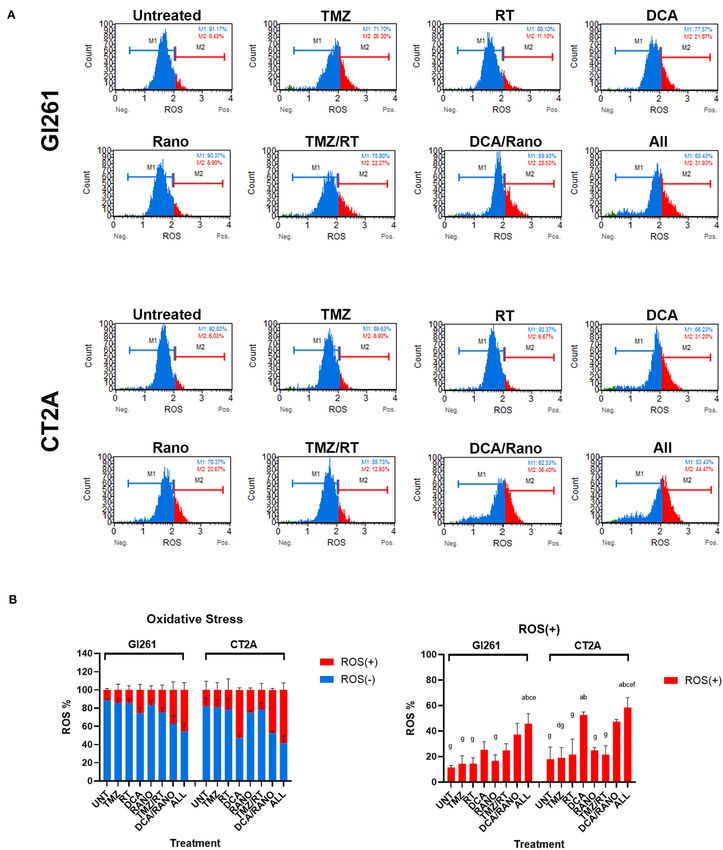
McKelvey et al.                                                                                                              Metabolic Blockade Improves GBM Survival

 FIGURE 4 | DCA/ranolazine (Rano) increases reactive oxygen species (ROS) levels in murine GBM cells. (A) Representative Luminex® histograms (Luminex Corp.,
 Austin, TX, USA) show the ROS fluorescent intensity as ROS− (M1; blue) and ROS+ (M2; red) in Gl261 and CT2A GBM lines. (B) Column graphs showing the mean ±
 SEM from three independent experiments as in (A). a p < 0.05 vs. Unt; b p < 0.05 vs. temozolomide (TMZ); c p < 0.05 vs. radiation therapy (RT); d p < 0.05 vs. DCA; e p
 < 0.05 vs. Rano; f p < 0.05 vs. TMZ/RT; and g p < 0.05 vs. All-combined treatments were determined by the two-way ANOVA test along with the Tukey’s multiple
 comparison test.

Frontiers in Oncology | www.frontiersin.org                                        6                                            March 2021 | Volume 11 | Article 633210
McKelvey et al. Metabolic Blockade Improves GBM Survival
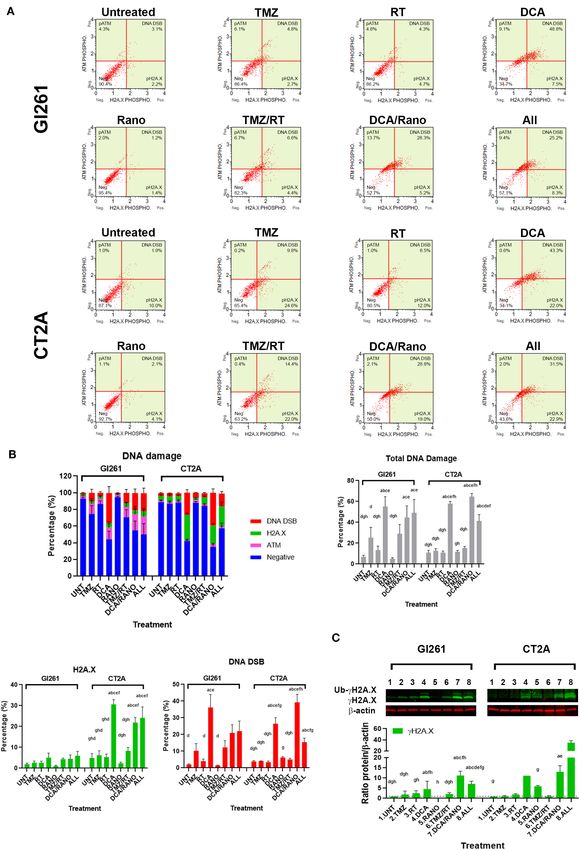
FIGURE 5 | TMZ and DCA increase DNA damage in GBM cell lines. (A) Representative Luminex® dot plots (Luminex Corp., Austin, TX, USA) depict increased
phosphoryated ataxia telangiectasia mutated (ATM) (upper left), phosphoryated H2A.X (lower right), or both (DSB; upper right). (B) Column graphs show mean ± SEM
from three independent experiments as in (A). a p < 0.05 vs. Unt; b p < 0.05 vs. TMZ; c p < 0.05 vs. RT; d p < 0.05 vs. DCA; e p < 0.05 vs. Rano; f p < 0.05 vs.
(Continued)
Frontiers in Oncology | www.frontiersin.org 7 March 2021 | Volume 11 | Article 633210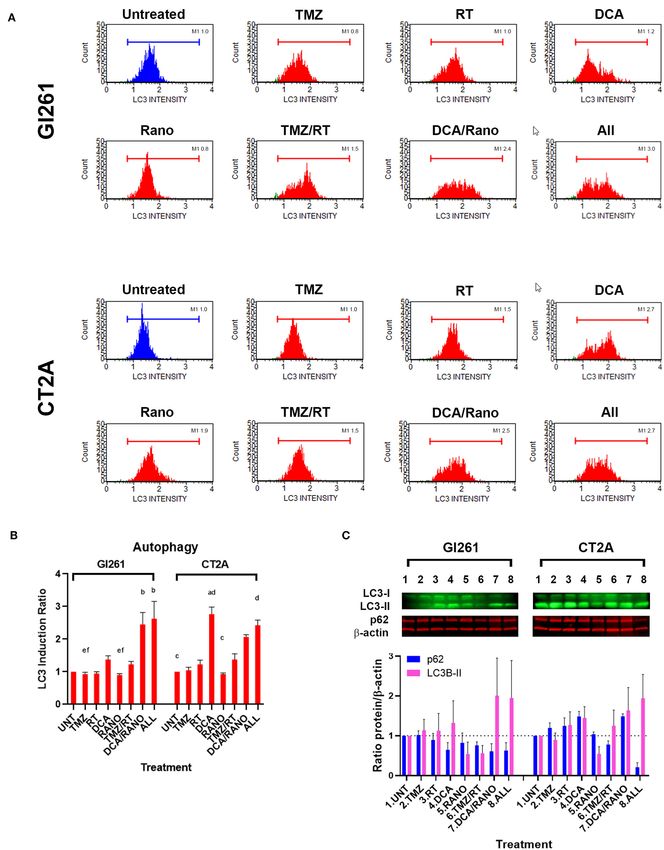
McKelvey et al.                                                                                                          Metabolic Blockade Improves GBM Survival

 FIGURE 5 | TMZ/RT; g p < 0.05 vs. DCA/Rano; and h p < 0.05 vs. All-combined treatments were determined by the two-way ANOVA test along with the Tukey’s
 multiple comparison test. (C) Western blot immunoblot (top) and densitometric analysis (bottom) of γH2A.X (S139) and β-actin in Gl261 and CT2A GBM cell lines (N =
 5). The protein expression was normalized to reference the protein β-actin expression.

Cell Survival                                                                        Western Blot
Cells were plated at 8,000 cells per well in a 96-well plate with 100                About 50 µg protein was loaded on Any kDaTM Mini-
µl of medium per well, which were left overnight to equilibrate,                     PROTEAN R TGXTM Precast protein gels and transferred
and assessed for confluency (%) after 72 h following the drug                        to low-autofluorescence polyvinylidene fluoride (PVDF)
treatments. Five images per 96 wells (×10 objective) were                            membranes (Bio-Rad, Hercules, CA, USA). For autophagy
acquired using the IncuCyte R Live Imaging System (IncuCyte R                        Western blots, cells were treated with a 100 nM Bafilomycin
Software (v2019B), Sartorius, Gottingen, Germany) and analyzed                       A1 (B1793; Sigma-Aldrich St. Louis, MO, USA) 4 h before
using the imaging analysis software. Six wells were used per                         collection to accumulate LC3B in the cytoplasm. Primary
treatment per experimental replicate.                                                antibodies were γH2A.X (1:1,000; ab11174; Abcam, Cambridge,
                                                                                     UK), cyclin-dependent kinase 2 (Cdc2) (1:1,000; 28439S; Cell
Energy Metabolism Assays                                                             Signaling Technology, Danvers, MA, USA), cyclin B1 (1:1,000;
Cells were plated at 40,000 cells per well in a 96-well plate                        4138S; Cell Signaling Technology, Danvers, MA, USA), p21
with 200 µl of medium per well and left overnight to                                 (1:1,000; ab188224; Abcam, Cambridge, UK), Bax (1:1,000;
equilibrate. The Glycolysis (extracellular acidification; ab197244;                  ab3191; Abcam, Cambridge, UK), Bcl-2 (1:1,000; ab16904;
Abcam, Cambridge, UK), FAO Complete (ab222944; Abcam,                                Abcam, Cambridge, UK), caspase 3 (1:1,000; ab188224; Abcam,
Cambridge, UK), and Extracellular Oxygen Consumption                                 Cambridge, UK), SQSTM1/p62 (1:1,000; ab56416; Abcam,
(ab197243; Abcam, Cambridge, UK) assays were performed as                            Cambridge, UK), LC3B (1:1,000; PM036; MBL International
per the instructions of the manufacturer and detected using                          Corp., Woburn, MA, USA), and β-actin (1:10,000; A1978;
the dual-read time-resolved fluorescence (FLUOstar Omega;                            Sigma-Aldrich St. Louis, MO, USA). Immunoblots were detected
BMG LABTECH, Ortenberg, Germany). For FAO metabolism,                                with 1:10,000 goat-anti-mouse DyLightTM 680 conjugated or
cells were glucose deprived overnight. Carbonyl cyanide 4-                           donkey-anti-rabbit DyLightTM 800 conjugated using an Odyssey
(trifluoromethoxy) phenylhydrazone (FCCP; 2.5 µm), etomoxir                          CLx Near-Infrared Fluorescence Imaging System (LI-COR
(40 µm), and antimycin A (1 µm) were used as positive and                            Biosciences, Lincoln, NE, USA).
negative controls where appropriate. Data are expressed as
percentage effect of Lifetime (µs; Equation (1)) for the treatment
relative to the untreated control.                                                   In vivo Glioma Models
                                                                                   The murine survival study was reviewed, approved, and
                                                  W1                                 performed in accordance with the guidelines of the Northern
           Lifetime (µs) [T] = (D2−D1) /ln                      (1)
                                                  W2                                 Sydney Local Health District Animal Ethics Committee, Royal
                                                                                     North Shore Hospital, St Leonards, NSW, Australia (Approval
where, W1 and W2 are the times for the dual measurement
                                                                                     #RESP/17/205), which enforces the New South Wales Animal
windows and D1 and D2 are the delay times prior to W1 and
                                                                                     Research Act 1985.
W2, respectively.
                                                                                         Eight-week-old male C57Bl/6 mice (20–26 g) were provided
Clonogenic/Colony Forming Unit Assay                                                 by the Kearn’s Animal Facility, Australia. Mice were housed
Cells were seeded at 1,500 cells per well in 6-well plates with                      in Allentown individually ventilated cages (3–5 per cage)
2 ml of DMEM/10% v/v FBS. After 10 days, colonies were                               with cellulose bedding under specific pathogen-free conditions.
stained with crystal violet (0.5% w/v, 1:1 methanol:distilled water)                 Enrichment was provided in the form of autoclaved ice block
and then imaged and quantitated using a vSpot R Spectrum                             sticks or straws. Rooms were temperature-controlled (22◦ C)
ELISpot/FluoroSpot Reader System (Autoimmun Diagnostika                              and were kept on a 12-h light/dark cycle (7:00/19:00 h) with a
Gmbh, Straßberg, Germany). Three wells were used per                                 standard chow and water ad libitum.
treatment per experimental replicate.                                                    Mice were inoculated with 1 × 10⁵ /2 µl murine glioma
                                                                                     Gl261 or CT2A cells using a stereotactic frame, a microinjection
Functional Assays                                                                    unit (David Kopf Instruments, Tujunga, CA, USA), and a 5 µl
Cells were plated at 500,000 cells per T25 flask, equilibrated                       syringe with custom 32-G needle (Hamilton Company, Reno,
overnight, and then treated for 72 h. The Luminex R Oxidative                        NV, USA) into the right caudoputamen (striatum) at 2 mm in
Stress (ROS; Luminex Corp., Austin, TX, USA), DNA Damage                             mediolateral, 0.1 mm in anteroposterior, 2.6 mm in dorsoventral
[ataxia telangiectasia mutated (ATM)/histone 2A family member                        bregma under isoflurane anesthesia (2% v/v per 1 L oxygen i.h.)
× (H2A.X)], Cell Cycle, Annexin-V, and Dead Cell, and                                as described earlier (6). Mice were randomly assigned into one of
Autophagy LC3 assays were carried out according to the                               the eight treatment groups (six mice per group). Treatments were
instructions of the manufacturer. Cell events (1,000–5,000 assay                     administered five times a week for 2 weeks commencing at day 7
dependent) were acquired and analyzed using the Guava R                              postinoculation: TMZ (50 mg/kg/day i.p.), DCA (200 mg/kg/day
Muse R Cell Analyser (Luminex Corp., Austin, TX, USA).                               i.p.), and Rano (50 mg/kg/day i.p.). External beam irradiation of

Frontiers in Oncology | www.frontiersin.org                                      8                                          March 2021 | Volume 11 | Article 633210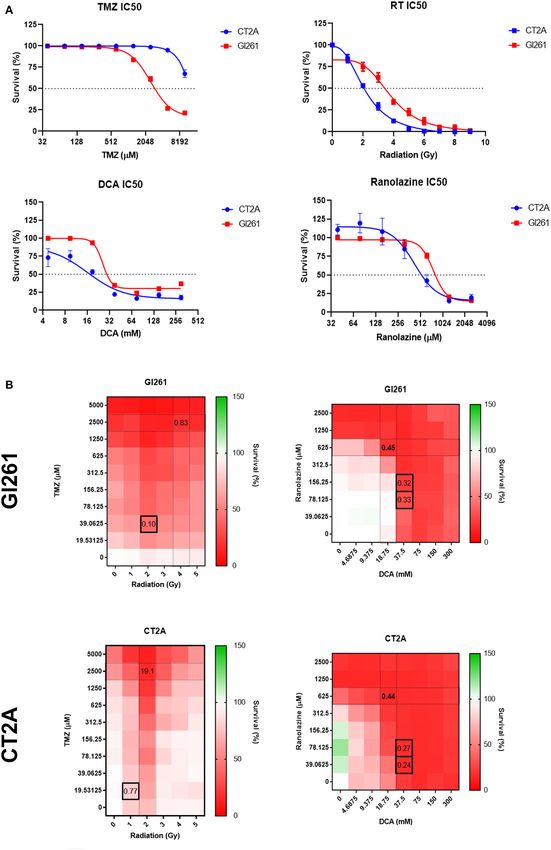
McKelvey et al. Metabolic Blockade Improves GBM Survival
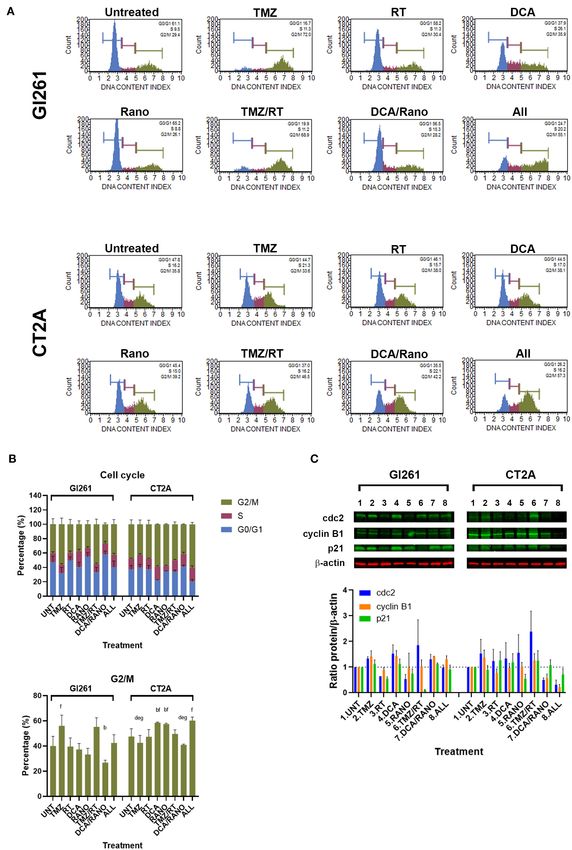
FIGURE 6 | TMZ alone or combined with RT arrests Gl261 cells in the G2/M phase. (A) Representative Luminex® cell cycle histograms (Luminex Corp., Austin, TX,
USA) show fluorescent intensity as the G0/G1 phase in blue, the S phase in purple, and the G2/M phase in green. (B) Column graphs show mean ± SEM from three
independent experiments as in (A). a p < 0.05 vs. Unt; b p < 0.05 vs. TMZ; c p < 0.05 vs. RT; d p < 0.05 vs. DCA; e p < 0.05 vs. Rano; f p < 0.05 vs. DCA/Rano;
(Continued)
Frontiers in Oncology | www.frontiersin.org 9 March 2021 | Volume 11 | Article 633210McKelvey et al. Metabolic Blockade Improves GBM Survival
FIGURE 6 | and g p < 0.05 vs. All-combined treatments were determined by the two-way ANOVA test along with the Tukey’s multiple comparison test. (C) Western
blot immunoblot (top) and densitometric analysis (bottom) of the expression of cyclin-dependent kinase 2 (cdc2), cyclin B1, p21, and β-actin in GBM cell lines
following treatment (N = 5). The protein expression was normalized to reference protein β-actin expression.
20 Gy/10 (i.e., 2 Gy per dose; RT) was performed using the Image- genetic mutations (e.g., EGFR and IDH1). This contrasts a
Guided SARRP (Xstrahl Inc., Suwanee, GA, USA) using a 5 × recent report of 498 GBM IDH wildtype tumours which
5 mm collimator and 60◦ (30◦ to –30◦ ) Arc beam at a dose rate of demonstrated increased glycolytic activity in the mesenchymal
3.71 Gy/min (24). For combination treatment groups, radiation subtype (27).
was delivered 1-h post-drug administration. Further examination showed that the expression of selected
Animal weight and well-being were assessed two times every targetable enzymes in the glycolytic pathway, pyruvate
week and euthanized by cardiac puncture under isoflurane dehydrogenase kinase (PDK) 1–4, and the FAO pathways,
anesthesia (2% v/v per 1 L oxygen i.h.) followed by cervical acetyl CoA dehydrogenase (ACAD), thiolase [acetyl-coenzyme A
dislocation at the humane endpoint or a long-term survival (100 acetyltransferase (ACAT)], cronotase (ECH), and HADH, were
days postinoculation). No adverse events were encountered. similarly expressed across the GBM subtypes, except ECH was
significantly higher in proneural/neural compared to classical
Histopathological Analyses tumors (p = 0.0022; Figure 1B). To confirm the role of PDKs and
Four-micron sections of paraffin-embedded tissues were stained FAO enzymes in GBM, we compared the gene expression using
with Mayer’s H&E Y/erythrosine B staining, Ki67 (0.084 µg/ml; the TCGA GBM and normal brain. The expression of PDK1,
12202S; Cell Signaling Technologies, Danvers, MA, USA), PDK3, ECH, and HADH were ∼1.5-fold higher in the GBM
and γH2A.X (0.06 µg/ml; ab11174; Abcam, Cambridge, UK) tumors compared to the normal tissue (all p < 0.01; Figure 1C).
as described earlier (6, 24) and terminal deoxynucleotidyl These data confirm that targetable metabolic pathways exist
transferase dUTP nick end labeling (TUNEL) apoptosis by within GBM.
immunohistochemical staining [ab206386; Abcam, Cambridge, From these results, we sought to investigate whether the
UK) with Mayer’s hematoxylin nuclear stain. Slides were imaged combination of PDK inhibitor, DCA, and FAO enzyme inhibitor,
using an Aperio XT slide scanner and captured using Aperio Rano, can inhibit GBM cellular metabolism and cell growth and
ImageScope (Leica Biosystems, Wetzlar, Germany), and five can increase survival in the syngeneic Gl261 and CT2A models
high-power images were assessed per sample (N = 4–6 brains of GBM.
per treatment group] using ImmunoRatio (Seinajoki, Finland) as
described earlier (24). Gl261 and CT2A Demonstrate Different
Statistical Analyses Sensitivities to Treatment
Drug IC50 concentrations were calculated using a four- To determine the IC50 for drug and RT treatment, murine
parameter response vs. drug concentration non-linear regression, GBM cell lines were treated with a 2-fold increase in drug
and synergistic doses were calculated using the CompuSyn concentrations, and cell survival was assessed as either %
Software (Paramus, NJ, USA) (25, 26). To determine the confluency at 72 h for drug treatment or colony-forming units
statistical difference between treatments, the two-way ANOVA (CFUs) at 10 days for RT.
test along with the Tukey’s multiple comparison test were Gl261 was more TMZ-sensitive compared to CT2A (IC50;
performed for Annexin-V, DNA Damage, Oxidative Stress, and 2,526 vs. >10,000 µM) but less sensitive to DCA (25.9 vs.
Cell Cycle MUSE R assays (Luminex Corp., Austin, TX, USA); 16.0 mM), Rano (766.2 vs. 423.9 µM), and RT (4.0 vs. 2.2 Gy;
and the one-way ANOVA test was performed with the Dunn’s Figure 2A). Comparative IC50 for human immortalized GBM
multiple comparison test for Autophagy LC3, Western blot cell lines U87-MG, U251-MG, and T98G is provided in
fluorescent intensity, and CFU assays. Murine survival studies are Supplementary Figure 1. Synergistic drug concentrations for
expressed as Kaplan–Meier curves. All statistics were performed TMZ/RT and DCA/Rano were determined using the CompuSyn
using the Prism version 8 for Windows (GraphPad Software Inc., Software (Paramus, NJ, USA) (25, 26). Combination indices
San Diego, CA, USA), considering a significant p-valueMcKelvey et al. Metabolic Blockade Improves GBM Survival
FIGURE 7 | TMZ/RT and DCA/Rano induce autophagy in GBM cell lines. (A) Representative Luminex® histograms (Luminex Corp., Austin, TX, USA) of LC3
fluorescent intensity in Unt (blue) and treatment (red). (B) Column graphs show mean ± SEM from four independent experiments as in (A). a p < 0.05 vs. Unt; b p <
0.05 vs. TMZ; c p < 0.05 vs. DCA; d p < 0.05 vs. Rano; e p < 0.05 vs. TMZ/RT; and f p < 0.05 vs. All-combined treatments were determined by the Kruskal–Wallis test
(Continued)
Frontiers in Oncology | www.frontiersin.org 11 March 2021 | Volume 11 | Article 633210McKelvey et al. Metabolic Blockade Improves GBM Survival
FIGURE 7 | along with the Dunn’s multiple comparison test. (C) Western blot immunoblot (top) and densitometric analysis (bottom) of the expression of p62, LC3-II,
and β-actin in GBM cell lines following treatment as indicated (N = 5). The protein expression was normalized to reference protein β-actin expression.
providing a more stable and greater dynamic range than the cells in non/early-dividing (G0/G1), synthesis (S), and late-
traditional signal intensity measurements. Fluorescence lifetime dividing/mitosis (G2/M) were assessed (Figure 6A). Treatment
was calculated as described in “Energy Metabolism Assays” of Gl261 with TMZ or TMZ/RT led to an increase of 40% of
section, and data were expressed relative to untreated controls cells in the G2/M phase, whereas the same treatment in CT2A
(Unt). Each drug decreased its respective metabolic pathway by had no effect (Figures 6A,B). This is consistent with an observed
23–45% at 60 min post-treatment (Figure 3A). reduction in the size of individual TMZ and RT-treated colonies
To assess the delayed impact on cell growth/survival, CFU for Gl261 but not CT2A colonies in Figure 3B. TMZ/RT also
assays were performed (Figure 3B). Using the synergistic doses showed a trend toward upregulated Cdc2, which is necessary for
identified in Figure 2B, DCA, Rano, and their combination S/G2 and G2/M transition, but not cyclin B1 or p21 (Figure 6C).
significantly reduced colony formation compared to Unt (all p However, in both cell lines, the DCA/Rano reduced G2/M
< 0.0001; Figure 3C), indicating no escape from the treatment arrest, with a trend toward greater S-phase arrest, but did not
control or emergence of resistance. In contrast, TMZ and RT reach significance.
alone and in combination with reduced CFU ∼50% showed
incomplete lethality. This suggests that DCA/Rano metabolic
targeting is a viable strategy that did not induce a resistant
DCA and DCA/Rano Induce Autophagy in
population. We next sought to investigate potential chemo- GBM Cells Lines
radio-enhancement in oxidative stress, DNA damage, cell cycle, DNA damage-induced autophagy can delay apoptotic cell death
autophagy, and apoptotic mechanisms. by mediating the degradation of specific cell cycle proteins,
regulation of cell division, and promotion of DNA damage
DCA/Rano Increases ROS Levels in Murine repair. To determine whether DCA and Rano induce autophagy,
GBM Cells the expression of markers of the autophagosomal membrane,
microtubule-associated protein light chain 3-II (LC3), was
The ability of RT to induce DNA damage is dependent on the
assessed by Luminex R assay (Luminex Corp., Austin, TX, USA),
generation of ROS (via radiolysis of water in cells). Inhibition
and Western blotting. In Gl261 cells, DCA/Rano, and all-
of glycolysis and FAO by DCA and Rano, respectively, should
combined treatments induced the expression of LC3 (Figure 7A)
increase the dependency of GBM cells on oxygen, thus increasing
and 2.5-fold greater that LC3 induction of autophagy compared
the ROS levels. In both cell lines, DCA and DCA/Rano induced
to Unt (p < 0.0001) (Figure 7B). This was accompanied by a
an increase in ROS levels at 72-h post-treatment (Figure 4A).
decrease in the autophagy substrate p62 at 72-h post-treatment
However, this was not significantly greater than TMZ/RT
(Figure 7C), though it did not reach significance. Similarly, in
(Figure 4B). While all-combined treatments induced ROS
CT2A cells, DCA, DCA/Rano, and all-combined treatments
generation, DCA was the primary single-treatment contributor,
showed a trend toward a 2-fold increase in LC3-autophagic
indicating that it may lead to increased DNA damage.
induction (p = 0.0211; Figure 7B). In CT2A cells, DCA, and
DCA and TMZ Increase DNA Damage in DCA/Rano showed increased p62 levels (Figure 7C). Although
p62 is recognized for its role in autophagic flux, it also has
Murine GBM Cells roles in the anti-oxidative stress response, nutrient sensing, and
To determine whether the increased ROS levels led to increased
apoptosis (28), consistent with the increased ROS (Figure 4B)
DNA damage, phosphorylation of ATM (pATM) and H2A.X
and the Bax:Bcl-2 ratio (Figure 8C) noted in CT2A cells. These
(pH2A.X) were assessed as early indicators of DNA double-
results suggest that DCA induces autophagy in GBM cells but
strand breaks (DSB; Figure 5A). In both cell lines, DCA alone
may be more effective when combined with Rano in Gl261 cells,
and DCA/Rano significantly increased total DNA damage to
as observed in the Gl261 DCA/Rano and all-combined groups.
∼6-fold compared to Unt (p = 0.0059) and above that for
TMZ/RT (CT2A; p < 0.0001). In Gl261, this was reflected in
increased H2A.X phosphorylation and ATM activation (DNA DCA Alone or Combined Increases
DSB) at 72 h, whereas CT2A cells showed predominantly Apoptosis in GBM Cell Lines
increased H2A.X phosphorylation (Figure 5B). Western blot of If GBM cells fail to overcome the increased ROS, DNA damage,
γH2A.X protein expression confirmed upregulation at 72-h post- cell cycle arrest, and autophagy, they will finally undergo
treatment (Figure 5C). apoptotic cell death. To assess the levels of apoptosis in Unt
Gl261 and CT2A, the membrane-impermeable DNA dye 7-
DCA and Rano Do Not Significantly Alter aminoactinomycin (7-AAD) and Annexin-V were assessed by
Cell Cycle Progression Luminex R assay (Luminex Corp., Austin, TX, USA; Figure 8A).
The cell cycle contains several checkpoints to prevent the In DCA, DCA/Rano, and all-combined treatments, the total
proliferation of cells with DNA damage. To determine the number of apoptotic cells increased 2- to 3-fold compared to Unt
effect of DCA and Rano on cell cycle, the percentage of (p = 0.0273; Figure 8B). In both cell lines, the total apoptosis was
Frontiers in Oncology | www.frontiersin.org 12 March 2021 | Volume 11 | Article 633210McKelvey et al. Metabolic Blockade Improves GBM Survival
FIGURE 8 | DCA alone or in combination increases early apoptosis in GBM cell lines. (A) Representative Luminex® dot plots (Luminex Corp., Austin, TX, USA) show
live (lower left) annexin V(AV–)/7AAD(–) cells, early apoptotic (lower right) AV(+)/7AAD(–) cells, late apoptotic (upper right) AV(+)/7AAD(+) cells, and dead cells (upper
left) AV(–)/7AAD(+) cells. (B) Column graphs show mean ± SEM from three independent experiments as in (A). a p < 0.05 vs. Unt; b p < 0.05 vs. TMZ;
(Continued)
Frontiers in Oncology | www.frontiersin.org 13 March 2021 | Volume 11 | Article 633210McKelvey et al. Metabolic Blockade Improves GBM Survival
FIGURE 8 | c p < 0.05 vs. RT; d p < 0.05 vs. DCA; e p < 0.05 vs. Rano; f p < 0.05 vs. DCA/Rano; and g p < 0.05 vs. All-combined treatments were determined by the
two-way ANOVA test along with the Tukey’s multiple comparison test. (C) Western blot immunoblot (top) and densitometric analysis (bottom) of the expression of Bax,
Bcl-2, caspase 3, and β-actin in GBM cell lines following treatment (N = 5). The protein expression was normalized to reference protein β-actin expression.
mostly manifested in increased early apoptotic events [annexin- brain, lung, and colon tissues (24). As the patterning is
V+ /7-AAD− (viability); Figure 8B]. Consistent with the CFU not observed in unirradiated (untreated) brains, we believe
data (Figure 3B), TMZ/RT did not significantly induce apoptosis that it indicates radiotoxicity to the “healthy” cells, including
(Figure 8B). To assess the nature of the apoptotic signal, we radiosensitive oligodendrocytes, which have shown limited
determined the expression of early proapoptotic protein Bax and regenerative capacity out to 18-month postirradiations (29). In
anti-apoptotic protein Bcl-2 and late apoptotic cleaved caspase 3 brain tissue where tumors resolved, TUNEL staining was limited
(Figure 3C) by immunoblotting. In both cell lines, the Bax:Bcl-2 to immune cells present along the wound tract (Figure 9B) and
ratio, and caspase 3 in CT2A were increased by DCA, DCA/Rano, therein not quantitated.
and all-combined treatments (Figure 8C), suggesting that DCA
induces the mitochondrial (intrinsic) apoptotic pathway in GBM
cell lines. In CT2A cells, TMZ, and TMZ/RT increased caspase 3 DISCUSSION
in the absence of increased annexin V and Bax:Bcl-2 (Figure 8C).
Contrary to a recent report by Duraj and colleagues (27), we
For explanation, see “Discussion” section.
show that glucose and FAO metabolic pathways are similar
among GBM subtypes, and enzymes of the glycolytic and FAO
DCA/Rano Increases in vivo Murine GBM pathways are upregulated in GBM tumors compared to normal
Survival brain tissues. While many therapies aim to target the genetic
Our in vitro data shows that DCA induces ROS generation, differences in GBM tumors (e.g., EGFR, IDH, FGFR, and TACC),
DNA damage, autophagy, and apoptosis, whereas, the effects of the inhibition of GBM cellular energetics is a potentially wide
Rano were minimal. Some of the effects of Rano treatment have ranging approach with impact irrespective of GBM subtype.
been shown to affect the immune and tumor microenvironment Chemoradiation forms part of the “standard of care” for
and the function of normal astrocytes and neurons (12, 13). patients with GBMs; therefore, we compared the effects of DCA,
To determine the clinical effect of Rano and combination Rano, and DCA/Rano in relation to chemoradiation and their
treatments, we use two orthotopic syngeneic murine models known mechanism of action; ROS > DNA damage > cell cycle
(Supplementary Figure 2). Mice were injected intracranially > apoptosis/autophagy, as well as in vivo efficacy. DCA and
with 1 × 10⁵ /2 µl Gl261 or CT2A cells on day 0 and TMZ (50 Rano induced oxidative stress, DNA damage, autophagy, and
mg/kg/day i.p.), DCA (200 mg/kg/day i.p.), Rano (50 mg/kg/day apoptosis (summarized in Supplementary Figure 3). At 72 h,
i.p.), and/or RT (20 Gy/10) treatment were administered daily the CT2A cells had lower ROS levels and less ATM activation
from day 7 to 18. For both Gl261 and CT2A tumor models, compared to Gl261 cells. The subtle disparity in the response
DCA, Rano, and DCA/Rano significantly increased survival; of Gl261 and CT2A cells may be partially attributable to
up to 20% in Gl261 tumor-bearing mice (median survival; 21 differences in TP53 with Gl261 (P53MUT ) and CT2A (P53WT )
vs. 17.5 days; p < 0.0001) and 40% in CT2A tumor-bearing (30). TP53 is one of the most commonly dysregulated genes
mice compared to Unt tumor-bearing controls (29.5 vs. 21 days; in GBM, with up to 54% of patients with TP53MUT depending
p < 0.0001; Figure 9A). No significant differences in toxicity on the GBM subtype (1). However, it is reported that P53WT
(as assessed by weight of animals) between treatments were inhibits lipid synthesis and glycolysis in normal and tumor cells,
observed (data not shown). Consistent with our in vitro IC50 whereas T53MUT promotes lipid synthesis and glycolysis (31). In
data (Figure 2A), the median survival for CT2A tumor-bearing tumor cells, it is not that simple. Not all P53 mutants increase
mice demonstrated greater TMZ resistance and RT sensitivity glycolysis (32) and wild-type P53 can promote the metabolic
than Gl261 tumor-bearing mice (Figure 9A). The TMZ/RT switch from oxidative phosphorylation to glycolysis by inducing
combination in both models was superior to DCA/Rano with p53 upregulated modulator of apoptosis (PUMA)-mediated
50% median survival, thus not reaching the 100-day period disruption of mitochondrial pyruvate uptake in cancer cells (33).
(indicating long-term survival). Therein where we would have expected Gl261 (P53MUT ) to be
The histopathological analysis of the tumor morphology more sensitive to DCA, we instead observed higher IC50s for
revealed that DCA and DCA/Rano induced focal regions of both DCA and Rano in the Gl261 line due to its precedence. In
necrosis and hemorrhage with increased Ki67 proliferation normal cells, wild-type P53 positively regulates ferroptosis, yet
indices and DNA fragmentation (cell death; TUNEL staining) in in tumor cells, TP53MUT sensitizes tumor cells to ferroptosis, a
Gl261 tumors (Figure 9B); Rano significantly decreased Ki67 in process noted to have a role in TMZ resistance and is associated
Gl261 tumors but increased TUNEL in CT2A tumors. Tumors with GBM autophagy and apoptotic mechanisms (31). Further,
treated with TMZ and/or RT and all-combined treatment examination of the P53 mutant and wild-type regulation of
showed increased DNA damage (γH2A.X; p < 0.001; Figure 9C). glycolytic and FAO pathways in GBM is needed.
We have previously observed this phenomenon of prolonged One point of difference in our study was that in both cell lines,
γH2A.X at 28 days after RT treatment in noncancerous DCA increased annexin V, Bax:Bcl-2 ratio, and CT2A caspase
Frontiers in Oncology | www.frontiersin.org 14 March 2021 | Volume 11 | Article 633210McKelvey et al. Metabolic Blockade Improves GBM Survival
FIGURE 9 | DCA and Rano increased median survival but were not more efficacious than chemoradiation. Mice were injected intracranially with 1 × 10⁵ /2 µl murine
GBM cells on day 0 and TMZ (50 mg/kg/day i.p.), DCA (200 mg/kg/day i.p.), Rano; 50 mg/kg/day i.p.), and/or RT (20 Gy/10) treatment administered daily from day 7
to day 21. (A) The Kaplan–Meier plots show median survival per treatment and are indicated in the graph legend. Six mice per treatment were monitored for 100-day
(Continued)
Frontiers in Oncology | www.frontiersin.org 15 March 2021 | Volume 11 | Article 633210McKelvey et al. Metabolic Blockade Improves GBM Survival
FIGURE 9 | postinoculation or until humane endpoint. (B) Endpoint Gl261 (top) and CT2A (bottom) tumors were immunohistochemically stained for cell proliferation
marker, Ki67, DNA damage marker, γH2A.X (S139), and apoptotic marker, terminal deoxynucleotidyl transferase dUTP nick end labeling (TUNEL) stain. (C) Column
graphs of the quantitation of positively stained cells in treated mice compared to controls. Data are expressed as mean ± SEM for five high-power fields (N = 6
tumors per treatment group). a p < 0.05 vs. Unt; b p < 0.05 vs. TMZ; c p < 0.05 vs. RT; d p < 0.05 vs. DCA; e p < 0.05 vs. Rano; f p < 0.05 vs. TMZ/RT; g p < 0.05 vs.
DCA/Rano; and h p < 0.05 vs. All-combined treatments were determined by the two-way ANOVA test along with the Tukey’s multiple comparison test. n.d., not
determined.
3, indicating that DCA induces the mitochondrial (intrinsic) Further, elucidation of the best dose regimen and sequencing
apoptotic pathway in GBM cell lines. Yet, in CT2A, but not of the novel or repurposed therapeutics to target cancer cell
Gl261 cells, TMZ increased caspase 3 without increased annexin metabolism will improve efficacy.
V or Bax:Bcl-2. A study by Roos et al. (34) proposed that, in In GBM, the peripheral neuropathy of the patient from DCA
glioma cells, O6 -methylating agents, such as TMZ, induce the has been noted, albeit transient and dose-dependent (15). The
accumulation of DNA DSBs. In P53WT cells (e.g., CT2A), this computational modeling reveals that the docking binding energy
induction activates the extrinsic apoptotic pathway via FasR values of DCA are PDK2 > PDK1 > PDK4 > PDK3 (37),
and caspase 8, whereas in P53MUT cells (e.g., Gl261) the same suggesting that DCA has greatest binding affinity for PDK2,
response triggers the intrinsic apoptotic pathway via Bax:Bcl-2 for which we showed no significant difference in PDK2 gene
and caspase 9. Both apoptotic pathways led to increased caspase expression between GBM tumors and normal brain tissue in
3 cleavage. Therein in our study, DCA and TMZ may trigger the the TCGA dataset. Of equal concern is the fact that in vitro
intrinsic and extrinsic apoptotic pathways in CT2A, respectively, concentrations of DCA are in the millimolar range, raising the
which was not observed in Gl261 cells due to differences in P53 notion that DCA derivatives, novel or repurposed drugs with
status; however, we cannot account for the absence of membrane selective PDK1/3 binding affinity, and micromolar or nanomolar
translocation for TMZ-treated CT2A cells in this study. IC50s may be better therapeutic avenues to explore.
In line with other murine models examining glycolytic In conclusion, the present study shows that dual glycolytic and
inhibitors, 2-DG, and/or FAO inhibitors, etomoxir or Rano, in FAO targeting with and without concomitant chemoradiation
GBM, lung and colon cancers, median survival, or tumor growth warrants further investigation in immunocompetent syngeneic
were minimally affected (11, 13). However, the combination models for GBM.
strategy showed an enhanced antitumor effect (13). The observed
20–40% increase in median survival in syngeneic murine
models using DCA/Rano (Gl261: 17.5 vs. 21 days, p < 0.0001
DATA AVAILABILITY STATEMENT
and CT2A: 21 vs. 28 days, p < 0.0001) was comparable to The datasets presented in this study can be found in online
an immunocompromised model of GBM (MES93) using 2- repositories. The names of the repository/repositories and
DG/etomoxir, which increased median survival from 17 to 24 accession number(s) can be found below: https://www.ncbi.
days (p < 0.001) (11). It is noted that the effects of Rano on nlm.nih.gov/geo/, GSE72217; https://www.ncbi.nlm.nih.gov/
the cell may not be limited to FAO inhibition. Although, noted gap/, phs000178.
as a partial FAO inhibitor, Rano was found to lack the FAO-
interfering activity in complete media with or without serum
(35), despite showing FAO-inhibiting ability in our FAO assay ETHICS STATEMENT
utilizing glucose-deprivation and a single FAO source (18C
unsaturated fatty acid oleate). The animal study was reviewed and approved by Northern
In GBM, DCA has shown promising results across a range Sydney Local Heath District Animal Ethics Committee, Royal
of preclinical studies, yet these data have not translated into North Shore Hospital, St Leonards, Australia.
pronounced improvements in the few clinic trials undertaken
thus far. Although, we demonstrated in vitro that DCA and Rano AUTHOR CONTRIBUTIONS
induced ROS, DNA damage, autophagy, and apoptosis, our in
vivo survival data did not reflect this. In vivo dose, regimen, and KM, EW, MB, SS, AM, CD, and VH contributed to the
sequencing of drugs may have limited therapeutic efficacy. In conception and design of the study. KM performed the in
the present study, we administered DCA and Rano concurrently vitro and in vivo experimentation and statistical analyses
with chemoradiation. As most DNA damage from RT is due and wrote the first draft of the manuscript. All authors
to indirect ionization of oxygen and increased ROS (peaking contributed to the manuscript revision and read and approved
at ∼30–120 min post-RT) and FDA clinical pharmacokinetic the submitted version.
data available for TMZ, DCA, and Rano indicating that they
reach peak plasma concentrations (Cmax ) at 1–2 h, we elected FUNDING
to deliver RT at ∼1-h post-drug administration. This contrasts
phase I clinical trials in recurrent GBM, wherein, patients KM was supported by the Matt Callander Beanie for Brain
received DCA monotherapy two times daily for 30 days, without Cancer Hunter Medical Research Institute (HMRI) Fellowship
chemoradiation (36), and Rano monotherapy is FDA approved funded by the Mark Hughes Foundation (MHF; HMRI 780) and
for administration two times daily for the treatment of angina. the work supported by an MHF Innovation Grant (HMRI 1357).
Frontiers in Oncology | www.frontiersin.org 16 March 2021 | Volume 11 | Article 633210McKelvey et al. Metabolic Blockade Improves GBM Survival
ACKNOWLEDGMENTS Supplementary Figure 1 | Sensitivity and survival of murine and human glioma
cell lines to drug and RT treatment combinations. Drug IC50s for TMZ, DCA, and
The authors acknowledge the technical assistance of BMG Rano were determined from confluency (%) at 72 h, and RT by clonogenic assay
LABTECH, Ortenberg, Germany for the dual-read time-resolved at 10-day post-treatment using the four-parameter logistic model. Symbols show
mean survival (%) ± SEM for six replicates per experiment (N = 3). U-87 MG did
fluorescence energy metabolism assays, and the services of the
not form colonies in the RT assessment.
Histology Core Facility at HMRI, New Lambton Heights, NSW,
Australia, and Sydney Microscopy and Microanalysis Facility Supplementary Figure 2 | Experimental timeline for Gl261 and CT2A
at The Charles Perkins Centre, The University of Sydney, tumor-bearing mice. Drugs and radiation therapy (RT) were assessed individually
and in combination; RT 2 Gy/10, 50 mg/kg i.p. TMZ, 200 mg/kg i.p. DCA, and/or
Camperdown, NSW, Australia. 50 mg/kg i.p. Rano five times per week for 2 weeks commencing at day 7
post-intracranial injection of 1 × 10⁵ /2 µl Gl261 or CT2A cells. Mice were
SUPPLEMENTARY MATERIAL euthanized at humane endpoints or at day 100 postinoculation (considered
long-term survival).
The Supplementary Material for this article can be found Supplementary Figure 3 | Schematic representation of DCA and Rano inhibition
online at: https://www.frontiersin.org/articles/10.3389/fonc. on murine GBM cell lines. Drugs and chemoradiation were assessed individually
2021.633210/full#supplementary-material and in combination. PS, phosphatidylserine.
REFERENCES 14. Moher D, Liberati A, Tetzlaff J, Altman DG. Preferred reporting
items for systematic reviews and meta-analyses: the PRISMA
1. Verhaak RG, Hoadley KA, Purdom E, Wang V, Qi Y, Wilkerson MD, statement. PLoS Med. (2009) 6:1–6. doi: 10.1371/journal.pmed.
et al. Integrated genomic analysis identifies clinically relevant subtypes of 1000097
glioblastoma characterized by abnormalities in PDGFRA, IDH1, EGFR, and 15. Michelakis ED, Sutendra G, Dromparis P, Webster L, Haromy A, Niven E,
NF1. Cancer Cell. (2010) 17:98–110. doi: 10.1016/j.ccr.2009.12.020 et al. Metabolic modulation of glioblastoma with dichloroacetate. Sci Transl
2. Health AIo, Welfare. Cancer Data in Australia. Canberra: AIHW (2020). Med. (2010) 2:31–4. doi: 10.1126/scitranslmed.3000677
3. Dolecek TA, Propp JM, Stroup NE, Kruchko C. CBTRUS statistical 16. Shen H, Hau E, Joshi S, Dilda PJ, McDonald KL. Sensitization of glioblastoma
report: primary brain and central nervous system tumors diagnosed in cells to irradiation by modulating the glucose metabolism. Mol Cancer Ther.
the United States in 2005-2009. Neuro Oncol. (2012) 14(Suppl. 5):v1– (2015) 14:1794. doi: 10.1158/1535-7163.MCT-15-0247
49. doi: 10.1093/neuonc/nos218 17. Shen H, Decollogne S, Dilda PJ, Hau E, Chung SA, Luk PP, et al. Dual-targeting
4. Parker NR, Hudson AL, Khong P, Parkinson JF, Dwight T, Ikin of aberrant glucose metabolism in glioblastoma. J Exp Clin Cancer Res. (2015)
RJ, et al. Intratumoral heterogeneity identified at the epigenetic, 34:14. doi: 10.1186/s13046-015-0130-0
genetic and transcriptional level in glioblastoma. Sci Rep. (2016) 18. Jiang W, Finniss S, Cazacu S, Xiang C, Brodie Z, Mikkelsen
6:22477. doi: 10.1038/srep22477 T, et al. Repurposing phenformin for the targeting of glioma
5. Olar A, Aldape KD. Using the molecular classification of stem cells and the treatment of glioblastoma. Oncotarget. (2016)
glioblastoma to inform personalized treatment. J Pathol. (2014) 7:56456–70. doi: 10.18632/oncotarget.10919
232:165–77. doi: 10.1002/path.4282 19. Goetzman ES, Prochownik EV. The role for Myc in coordinating
6. McKelvey KJ, Hudson AL, Prasanna Kumar R, Wilmott JS, Attrill GH, Long glycolysis, oxidative phosphorylation, glutaminolysis, and fatty acid
GV, et al. Temporal and spatial modulation of the tumor and systemic metabolism in normal and neoplastic tissues. Front Endocrinol. (2018)
immune response in the murine Gl261 glioma model. PLoS ONE. (2020) 9:129. doi: 10.3389/fendo.2018.00129
15:e0226444. doi: 10.1371/journal.pone.0226444 20. Xie Y, Bergström T, Jiang Y, Johansson P, Marinescu VD, Lindberg
7. Prabhu AH, Kant S, Kesarwani P, Ahmed K, Forsyth P, Nakano I, N, et al. The human glioblastoma cell culture resource: validated cell
et al. Integrative cross-platform analyses identify enhanced heterotrophy models representing all molecular subtypes. EBioMedicine. (2015) 2:1351–
as a metabolic hallmark in glioblastoma. Neuro Oncol. (2019) 21:337– 63. doi: 10.1016/j.ebiom.2015.08.026
47. doi: 10.1093/neuonc/noy185 21. de Hoon MJ, Imoto S, Nolan J, Miyano S. Open source clustering software.
8. Stupp R, Mason WP, van den Bent MJ, Weller M, Fisher B, Taphoorn MJ, et al. Bioinformatics. (2004) 20:1453–4. doi: 10.1093/bioinformatics/bth078
Radiotherapy plus concomitant and adjuvant temozolomide for glioblastoma. 22. Keil CLR, Faizaan SM, Bezawada S, Parsons L, Baryshnikova A. Treeview
N Engl J Med. (2005) 352:987–96. doi: 10.1056/NEJMoa043330 3 (beta 1) - Visualization and Analysis of Large Data Matrices. Meyrin:
9. Gilbert MR, Wang M, Aldape KD, Stupp R, Hegi ME, Jaeckle KA, Zenodo (2016).
et al. Dose-dense temozolomide for newly diagnosed glioblastoma: a 23. Tang Z, Li C, Kang B, Gao G, Li C, Zhang Z. GEPIA: a web server for cancer
randomized phase III clinical trial. J Clin Oncol. (2013) 31:4085– and normal gene expression profiling and interactive analyses. Nucleic Acids
91. doi: 10.1200/JCO.2013.49.6968 Res. (2017) 45:W98–102. doi: 10.1093/nar/gkx247
10. Lin H, Patel S, Affleck VS, Wilson I, Turnbull DM, Joshi AR, et al. Fatty acid 24. McKelvey KJ, Hudson AL, Prasanna Kumar R, Eade T, Clarke SJ, Wheeler
oxidation is required for the respiration and proliferation of malignant glioma HR, et al. Sub-acute toxicity in non-cancerous tissue and immune-related
cells. Neuro Oncol. (2017) 19:43–54. doi: 10.1093/neuonc/now128 adverse events of a novel combination therapy for cancer. Front Oncol. (2020)
11. Kant S, Kesarwani P, Prabhu A, Graham SF, Buelow KL, Nakano I, et al. 9:1504. doi: 10.3389/fonc.2019.01504
Enhanced fatty acid oxidation provides glioblastoma cells metabolic plasticity 25. Chou T-C, Talalay P. Quantitative analysis of dose-effect relationships: the
to accommodate to its dynamic nutrient microenvironment. Cell Death Dis. combined effects of multiple drugs or enzyme inhibitors. Adv Enzyme Regul.
(2020) 11:253. doi: 10.1038/s41419-020-2449-5 (1984) 22:27–55. doi: 10.1016/0065-2571(84)90007-4
12. Aldasoro M, Guerra-Ojeda S, Aguirre-Rueda D, Mauricio MD, Vila JM, 26. Chou TC. Theoretical basis, experimental design, and computerized
Marchio P, et al. Effects of ranolazine on astrocytes and neurons in primary simulation of synergism and antagonism in drug combination studies.
culture. PLoS ONE. (2016) 11:e0150619. doi: 10.1371/journal.pone.0150619 Pharmacol Rev. (2006) 58:621–81. doi: 10.1124/pr.58.3.10
13. Hossain F, Al-Khami AA, Wyczechowska D, Hernandez C, Zheng L, Reiss 27. Duraj T, Garcia-Romero N, Carrión-Navarro J, Madurga R, de Mendivil
K, et al. Inhibition of fatty acid oxidation modulates immunosuppressive AO, Prat-Acin R, et al. Beyond the warburg effect: oxidative and glycolytic
functions of myeloid-derived suppressor cells and enhances cancer therapies. phenotypes coexist within the metabolic heterogeneity of glioblastoma. Cells.
Cancer Immunol Res. (2015) 3:1236–47. doi: 10.1158/2326-6066.CIR-15-0036 10:202. doi: 10.3390/cells10020202
Frontiers in Oncology | www.frontiersin.org 17 March 2021 | Volume 11 | Article 633210McKelvey et al. Metabolic Blockade Improves GBM Survival
28. Sánchez-Martín P, Komatsu M. p62/SQSTM1 – steering the cell through 35. Ma Y, Wang W, Devarakonda T, Zhou H, Wang X-Y, Salloum
health and disease. J Cell Sci. (2018) 131:jcs222836. doi: 10.1242/jcs.22 FN, et al. Functional analysis of molecular and pharmacological
2836 modulators of mitochondrial fatty acid oxidation. Sci Rep. (2020)
29. Begolly S, Olschowka JA, Love T, Williams JP, O’Banion MK. Fractionation 10:1450. doi: 10.1038/s41598-020-58334-7
enhances acute oligodendrocyte progenitor cell radiation sensitivity and leads 36. Dunbar EM, Coats BS, Shroads AL, Langaee T, Lew A, Forder JR, et al. Phase
to long term depletion. Glia. (2018) 66:846–61. doi: 10.1002/glia.23288 1 trial of dichloroacetate (DCA) in adults with recurrent malignant brain
30. Oh T, Fakurnejad S, Sayegh ET, Clark AJ, Ivan ME, Sun MZ, et tumors. Invest New Drugs. (2014) 32:452–64. doi: 10.1007/s10637-013-0047-4
al. Immunocompetent murine models for the study of glioblastoma 37. Fereidoonnezhad M, Faghih Z, Mojaddami A, Sakhteman A, Rezaei Z. A
immunotherapy. J Transl Med. (2014) 12:107. doi: 10.1186/1479-5876-12-107 comparative docking studies of dichloroacetate analogues on four isozymes of
31. Gnanapradeepan K, Basu S, Barnoud T, Budina-Kolomets A, Kung C-P, pyruvate dehydrogenase kinase in humans. Indian J Pharm Educ Res. (2016)
Murphy ME. The p53 tumor suppressor in the control of metabolism and 50:S32–8. doi: 10.5530ijper.50.2.15
ferroptosis. Front Endocrinol. (2018) 9:124. doi: 10.3389/fendo.2018.00124
32. Eriksson M, Ambroise G, Ouchida AT, Lima Queiroz A, Smith D, Gimenez- Conflict of Interest: The authors declare that the research was conducted in the
Cassina A, et al. Effect of mutant p53 proteins on glycolysis and mitochondrial absence of any commercial or financial relationships that could be construed as a
metabolism. Mol Cell Biol. (2017) 37:e00328-17. doi: 10.1128/MCB.00328-17 potential conflict of interest.
33. Kim J, Yu L, Chen W, Xu Y, Wu M, Todorova D, et al. Wild-Type
p53 promotes cancer metabolic switch by inducing PUMA-dependent Copyright © 2021 McKelvey, Wilson, Short, Melcher, Biggs, Diakos and Howell.
suppression of oxidative phosphorylation. Cancer Cell. (2019) 35:191– This is an open-access article distributed under the terms of the Creative Commons
203.e8. doi: 10.1016/j.ccell.2018.12.012 Attribution License (CC BY). The use, distribution or reproduction in other forums
34. Roos WP, Batista LF, Naumann SC, Wick W, Weller M, Menck is permitted, provided the original author(s) and the copyright owner(s) are credited
CF, et al. Apoptosis in malignant glioma cells triggered by the and that the original publication in this journal is cited, in accordance with accepted
temozolomide-induced DNA lesion O6-methylguanine. Oncogene. (2007) academic practice. No use, distribution or reproduction is permitted which does not
26:186–97. doi: 10.1038/sj.onc.1209785 comply with these terms.
Frontiers in Oncology | www.frontiersin.org 18 March 2021 | Volume 11 | Article 633210You can also read