How do intermittency and simultaneous processes obfuscate the Arctic influence on midlatitude winter extreme weather events? - the NOAA ...
←
→
Page content transcription
If your browser does not render page correctly, please read the page content below
TOPICAL REVIEW • OPEN ACCESS

How do intermittency and simultaneous processes obfuscate the Arctic
influence on midlatitude winter extreme weather events?
To cite this article: J E Overland et al 2021 Environ. Res. Lett. 16 043002

View the article online for updates and enhancements.

                               This content was downloaded from IP address 137.75.80.24 on 24/03/2021 at 17:53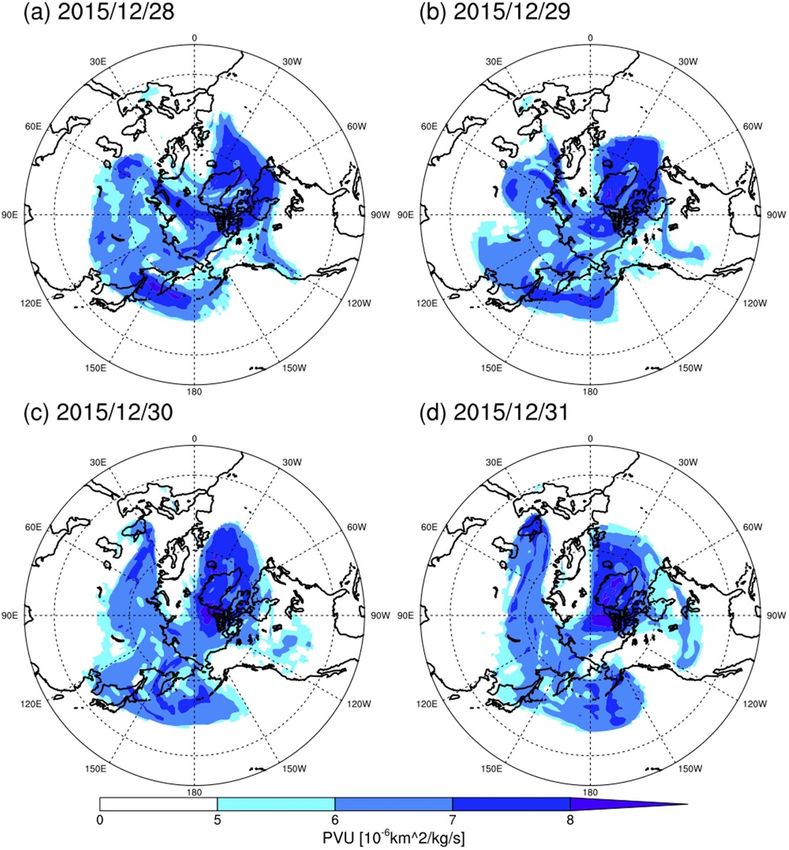
Environ. Res. Lett. 16 (2021) 043002 https://doi.org/10.1088/1748-9326/abdb5d
TOPICAL REVIEW
How do intermittency and simultaneous processes obfuscate the
OPEN ACCESS
Arctic influence on midlatitude winter extreme weather events?
RECEIVED
16 September 2020 J E Overland1, T J Ballinger2, J Cohen3,12, J A Francis4, E Hanna5, R Jaiser6, B -M Kim7,
REVISED S -J Kim8, J Ukita9, T Vihma10, M Wang1,11 and X Zhang2
30 December 2020
1
ACCEPTED FOR PUBLICATION
NOAA/Pacific Marine Environmental Laboratory, Seattle, WA, United States of America
2
13 January 2021 International Arctic Research Center and Department of Atmospheric Science, University of Alaska Fairbanks, Fairbanks, AK, United
States of America
PUBLISHED 3
18 March 2021 Atmospheric and Environmental Research,Inc., Lexington, MA, United States of America
4
Woodwell Climate Research Center, Falmouth, MA, United States of America
5
School of Geography and Lincoln Centre for Water and Planetary Health, University of Lincoln, Lincoln, United Kingdom
Original content from 6
Atmospheric Physics, Alfred-Wegener-Institut, Helmholtz Centre for Polar and Marine Research, Potsdam, Germany
this work may be used 7
under the terms of the Pukyong National University, Busan, Republic of Korea
8
Creative Commons Korea Polar Research Institute, Incheon, Republic of Korea
Attribution 4.0 licence. 9
Niigata University, Niigata, Japan
10
Any further distribution Finnish Meteorological Institute, Helsinki, Finland
of this work must 11
The Cooperative Institute for Climate, Ocean, and Ecosystem Studies, University of Washington, Seattle, WA, United States of America
maintain attribution to 12
Department of Civil and Environmental Engineering, MIT, Cambridge, MA, United States of America
the author(s) and the title
of the work, journal E-mail: james.e.overland@noaa.gov
citation and DOI.
Keywords: Arctic, jet stream, polar vortex, climate change, extreme weather, sea ice, Arctic amplification
Abstract
Pronounced changes in the Arctic environment add a new potential driver of anomalous weather
patterns in midlatitudes that affect billions of people. Recent studies of these Arctic/midlatitude
weather linkages, however, state inconsistent conclusions. A source of uncertainty arises from the
chaotic nature of the atmosphere. Thermodynamic forcing by a rapidly warming Arctic
contributes to weather events through changing surface heat fluxes and large-scale temperature
and pressure gradients. But internal shifts in atmospheric dynamics—the variability of the
location, strength, and character of the jet stream, blocking, and stratospheric polar vortex
(SPV)—obscure the direct causes and effects. It is important to understand these associated
processes to differentiate Arctic-forced variability from natural variability. For example in early
winter, reduced Barents/Kara Seas sea-ice coverage may reinforce existing atmospheric
teleconnections between the North Atlantic/Arctic and central Asia, and affect downstream
weather in East Asia. Reduced sea ice in the Chukchi Sea can amplify atmospheric ridging of high
pressure near Alaska, influencing downstream weather across North America. In late winter
southward displacement of the SPV, coupled to the troposphere, leads to weather extremes in
Eurasia and North America. Combined tropical and sea ice conditions can modulate the variability
of the SPV. Observational evidence for Arctic/midlatitude weather linkages continues to
accumulate, along with understanding of connections with pre-existing climate states. Relative to
natural atmospheric variability, sea-ice loss alone has played a secondary role in Arctic/midlatitude
weather linkages; the full influence of Arctic amplification remains uncertain.
1. Introduction as noted by the recent Year of Polar Prediction
project [7]. Understanding the potential influence
If and how recent Arctic changes influence broader of disproportionate Arctic warming on frequency
hemispheric weather continues to be an active and and persistence of extreme winter weather events
controversial research topic [1–6]; e.g. Cohen et al in midlatitudes is societally relevant, as continued
[5] noted 146 papers on the subject. It remains Arctic amplification (AA) of temperature increase
a significant research challenge and a potential is an inevitable aspect of anthropogenically forced
opportunity to improve extended-range forecasts, global change (e.g. [8, 9]). Severe and aberrant winter
© 2021 The Author(s). Published by IOP Publishing Ltd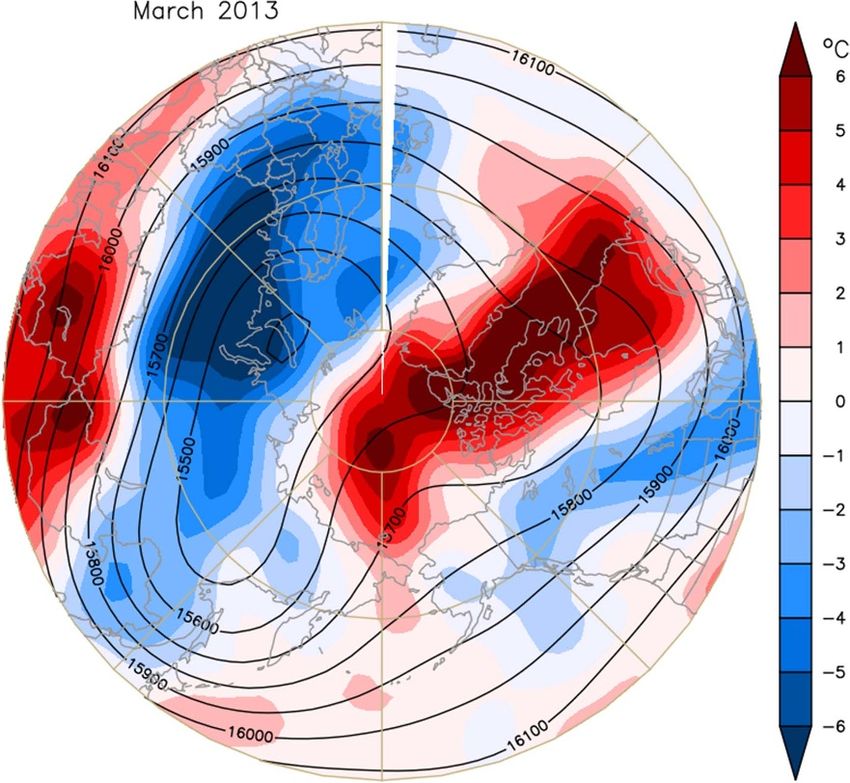
Environ. Res. Lett. 16 (2021) 043002                                                                J E Overland et al

weather has major impacts on infrastructure, trans-        also on the location, amplitude, and movement of
portation, agriculture, productivity, recreation, pub-     meanders in the polar jet stream [22, 35–37]. That this
lic health, and ecosystems. The influence of Arctic        connection does not appear in all years or all months
change on global weather patterns is already motiv-        is an argument for the intermittency of weather link-
ating efforts to mitigate climate change [10].             ages despite continued AA. Spatial and temporal vari-
     Reviews [5, 11] and international workshops,          ations in AA patterns also contribute to intermittency
sponsored by the World Climate Research Pro-               [38]. Inspection of year-to-year variability reported
gramme’s Climate & Cryosphere project, Interna-            in studies claiming weak multi-decadal trends in
tional Arctic Science Committee (IASC), and the            linkages (e.g. [39]), suggests such intermittency. In
U.S. Climate Variability and Predictability program,       fact, amplified Arctic warming may not initiate mid-
reached divergent conclusions on the relative import-      latitude connections, but instead intensify intrinsic
ance in Arctic/midlatitude linkages between AA-            linkages by enhancing the amplitude of existing
forced changes and atmospheric internal variability,       large-scale Rossby waves—subject to the influences
based on model simulations and observational data.         of sea-surface temperature (SST) anomaly patterns
While many recent studies have identified associ-          and geographic features—and therefore contribute
ations and mechanisms linking sea-ice loss and/or AA       to the formation of stationary blocking anticyclones
with various winter extreme weather regimes in mid-        [37, 40]. Amplified Rossby waves lead to increased
latitudes (e.g. [5, 12], and references therein), some     northward warm advection as well as southward cold
conclude that thermodynamic forcing due to recently        advection between the subarctic and midlatitudes.
sea-ice-free Arctic regions is insignificant relative to   Some metrics of jet-stream waviness (e.g. sinuos-
internal atmospheric variability [2, 6, 12–21]. Sev-       ity, meridional circulation index, local wave activ-
eral implicate a particular dominance of an upstream       ity flux) have indicated an increased frequency of
teleconnection forcing from the Atlantic that ampli-       high-amplitude jet stream days since AA emerged in
fies warming over the Barents/Kara Sea (BK) region,        the mid-1990s, embedded within large year-to-year
regional ridging of high pressure systems, and then        winter natural variability [41–46]. Because cold and
downstream cooling over Asia [22–26]. A subset of          warm extreme events often occur simultaneously in
these investigations focuses on warm air advection         adjacent regions, according to the axis and amplitude
into the BK region [23, 27]. Other forcings include        of jet-stream waves as they progress, metrics based
local heating of the atmosphere, not necessarily from      on averages over a season, across large regions, or
the loss of sea ice [12, 28], and tropical influences      over many model ensemble members tend to produce
[29–31]. A large number of papers (27 [5]) based           insignificant composite signals [3, 47]. This fact is one
on climate model simulations do not support sea-ice        source of discrepancy among studies.
loss as a significant mechanism for Arctic/midlatitude          Three Arctic processes are potentially involved
weather linkages. Recent work suggests that models         in feeding back to dynamic longwave atmospheric
can underestimate the atmospheric response to AA           patterns: (a) local thermodynamic surface forcing,
[12, 32–34]. Potential Arctic influences remain unre-      often associated with loss of sea ice; (b) north-
solved, but it is generally accepted that possible Arc-    ward warm air advection into an existing long-
tic/midlatitude weather linkages are not always dir-       wave ridge; and (c) internal atmospheric block-
ect, can be overwhelmed by internal variability, and       ing processes that add to the persistence of the
are often subject to multiple, simultaneous, and time-     wavy jet stream pattern. The state and balance of
lagged ocean-atmosphere processes.                         these three regional factors comes from a qualitative
     An advance in understanding high-latitude cli-        interpretation of the geopotential height tendency
mate change is that Arctic/midlatitude weather link-       equation in pressure coordinates (from [48], which
ages depend not only on the magnitude of AA, but           is a modified version of equation (6.14) from [49]):

                                       (   )        [       (    )]           (      )
                                   1 2        f02 ∂           ∂Φ      f02 Rd ∂ dQ/dt
                    χ ∝ f0 V g · ∇    ∇ Φ+f +        Vg · ∇         +
                                   f0         σ ∂p            ∂p       σcp ∂p    p                                (1)
                                       (A)                 (B)                        (C)

                                                           f (f 0 ) is the Coriolis parameter (at 45◦ ), Vg is the
where χ = ∂Φ/∂t is defined as the geopotential tend-       geostrophic wind, Rd is the gas constant for dry air,
ency, and the static-stability parameter σ is defined      cp is the specific heat at constant pressure, and Q is
as σ = −(α/θ)(∂θ/∂p), θ is potential temperature, α        the external heating. Geopotential heights rise and
is specific volume, Φ denotes the geopotential height,     fall proportional to negative and positive absolute

                                              2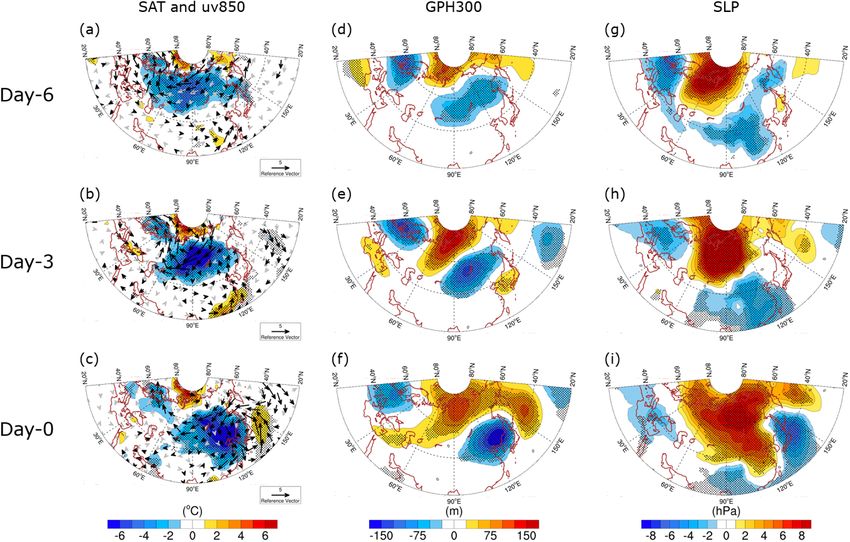
Environ. Res. Lett. 16 (2021) 043002                                                                                J E Overland et al

   Figure 1. Linear trend of November sea-ice concentration (SIC) in the period 1979–2019. This pattern highlights the delay of
   sea-ice freeze-up in the Barents/Kara Seas (BK), Chukchi/Beaufort Seas (CB), and Baffin Bay (BB). SIC data are obtained from the
   National Snow and Ice Data Center (NSIDC), https://nsidc.org/data.

vorticity advection (Term A), vertical variation of                 occurrence of stratospheric polar vortex (SPV) dis-
geopotential thickness (heat) advection (Term B), and               ruptions and displacements over the continents.
low-level diabatic heating (Term C). Authors discuss-               Accordingly, improved understanding of factors
ing Arctic/midlatitude connections often focus on the               causing SPV disruptions is required. A cluster ana-
third element, ocean-to-atmosphere heat flux owing                  lysis of daily, pan-Arctic 100 hPa geopotential height
to the loss of sea ice associated with AA, but the first            anomalies derived from ERA-Interim Reanalysis
two factors are important in midlatitude linkages.                  during January/February 1979–2018 suggests five
Tying midlatitude weather regimes to internal atmo-                 dominant circulation patterns (figure 2, from [52]).
spheric variability of the regional jet stream, which               Cluster 1 is a pole-centered region of lower-than-
can be modulated by Arctic forcing, provides physical               average 100 hPa heights that represents a strong SPV.
insight into linkage theory.                                        The corresponding time series indicates a decrease
    The delay of fall freeze-up of sea ice is one of                in the seasonal-mean frequency of this pattern since
the most conspicuous manifestations of the changing                 2000. Other clusters represent progressively weaker
Arctic. It occurs regionally with the largest changes in            states of the SPV, in terms of mean polar-cap geopo-
BK, Baffin Bay (BB), and the Chukchi/Beaufort Seas                  tential heights. Cluster 5 exhibits a positive height
(CB) (figure 1). Owing to increased turbulent and                   anomaly centered over Greenland/central Arctic,
radiative fluxes from the surface to the atmosphere in              indicative of a weak SPV related to sudden strato-
ice-free Arctic areas during early winter, one would                spheric warmings (SSWs). Clusters 2 and 4 represent
expect some direct tropospheric geopotential thick-                 an SPV center shifted southward over North America
ness increases in these regions through at least Janu-              and west of Greenland and occur in more than 40%
ary, the typical time when freeze-up tends to be com-               of the record. As discussed by [52], configurations
plete across the Arctic Ocean and its marginal seas.                classified as cluster 5 were more frequent during the
Two studies that link surface turbulent fluxes to atmo-             last decade, while clusters 2 and 4 occurred relat-
spheric circulation are [50] and [51].                              ively frequently during the last 5 years of the analysis
    During late winter when the Arctic Ocean is gen-                (figure 2).
erally frozen over, Arctic/midlatitude connections are                   This review focuses on the differences between
generally less attributable to direct ocean-atmosphere              early- and late-winter processes involved in Arc-
heat fluxes related to sea-ice loss, although as the                tic/midlatitude linkages and acknowledges that not
ice thins, heat fluxes increase in influence. A major               all Arctic/midlatitude weather connections necessar-
controlling factor for classic late-winter cold-air                 ily originate from recent AA. We consider open sci-
outbreaks into midlatitudes is the linkage to the                   ence questions, address recent studies, and note the

                                                      3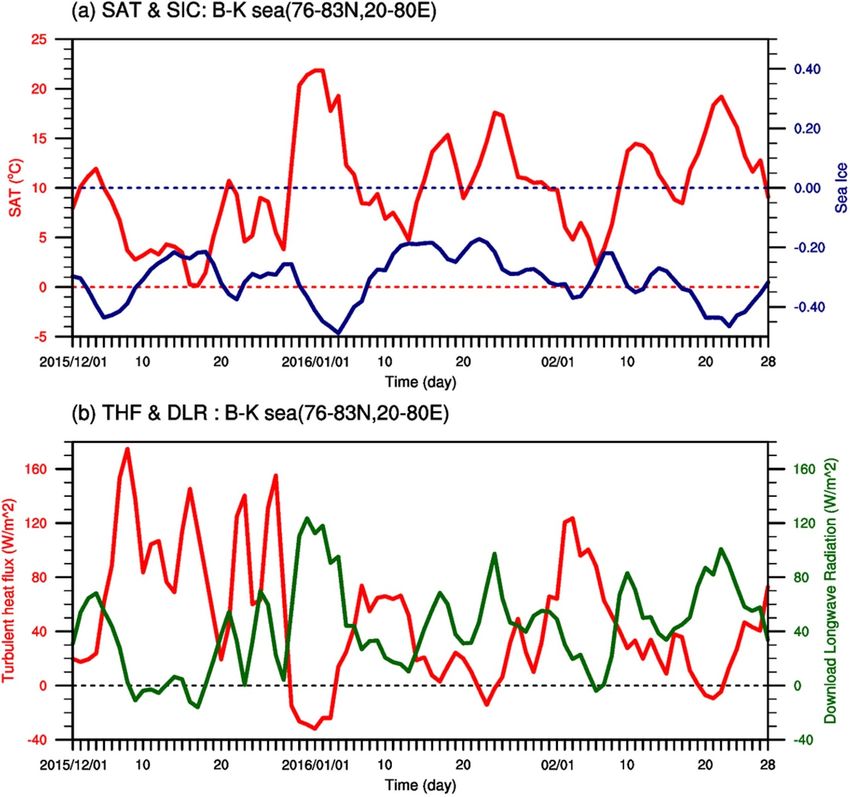
Environ. Res. Lett. 16 (2021) 043002                                                                                J E Overland et al

   Figure 2. Representative clusters of 100 hPa geopotential height anomalies (m) during winter (JF) from 1979 to 2018. Numbers in
   parentheses above each map reflect the percentage of occurrence. Bar plots present seasonal-mean normalized frequency of
   occurrence during each year. Reprinted from [52]. Copyright © 2018, The Author(s). CC BY 4.0.

interaction of multiple processes that have received                Further, the same atmospheric circulation that results
less attention in the literature. We organize the review            in a cold Eurasian continent also directly contributes
geographically as follows: (a) East Asian weather                   to BK sea ice loss, as Ural blocking results in advection
connections to BK sea-ice loss, (b) North Amer-                     of southerly air masses over the BK [65].
ican weather events and their relationship with early-                   Two main pathways, a tropospheric pathway and
winter ridging and late-winter SPV disruptions, (c)                 a stratospheric pathway, have been proposed that
European severe weather, and (d) possible SPV mod-                  provide plausible explanations for the statistical rela-
ulations based on tropical connections.                             tionships between Arctic change and midlatitude
                                                                    weather [11]. Numerous observational and modeling
                                                                    studies relate BK sea-ice co-variability to winter mid-
2. Linkages affecting Asia
                                                                    latitude circulation patterns in both the troposphere
                                                                    and stratosphere; some studies find no robust con-
Since the beginning of the 21st century, cold spells
                                                                    nection (see [5, 66, 67] for comprehensive reviews).
over East Asia occurred not only more frequently, but
they were stronger and more persistent than during
previous decades [53–55]. In December 2009, 2012;                   2.1. Early-winter tropospheric processes
January 2008, 2010, 2013, 2016; and February 2008,                  The tropospheric pathway is pronounced in Novem-
2018, bitter cold periods and heavy snowfall accom-                 ber to December and is discussed in conjunction with
panied by freezing rain in some areas struck East Asia,             a stationary Rossby wave train excited by anomalous
resulting in severe economic and societal disruption                diabatic surface forcing, partly from sea-ice loss in the
[56, 57]. Previous studies based on statistical ana-                BK region (e.g. [5, 59], and references therein). When
lyses of reanalysis data, as well as sensitivity experi-            looking at a broader spatial area, a wave train ori-
ments using both atmosphere-only and atmosphere–                    ginating in the northern North Atlantic Ocean and
ocean coupled models, provided evidence supporting                  extending to Eurasia is common, in part associated
a relationship between negative surface air temperat-               with positive SST anomalies along the eastern sea-
ure (SAT) anomalies over East Asia and lower-than-                  board of North America [23] and extending eastward
average sea-ice extent in the central Arctic Ocean                  to the Ural Mountains (figure 4, far left).
and/or the BK [11, 32, 35, 39, 58–62]. Recent cool-                     A description of the dominant atmospheric circu-
ing in Central Asia accompanied by Arctic warming is                lation patterns over the extended winter season under
called warm Arctic/cold Eurasia (WACE) pattern [32,                 low (2001/2002–2013/2014) and high (1978/1979–
60, 63]. According to the WACE index, the positive                  1999/2000) Arctic sea-ice conditions was provided
WACE coincides with an anomalously low BK sea-ice                   in [68]. In early winter, an anticyclonic pattern over
cover with a correlation coefficient of −0.52 at 99%                Scandinavia that extends toward Siberia, referred to
confidence level (figure 3). The connections between                as the positive phase of the Scandinavian pattern
WACE and BK sea-ice cover can be a consequence                      (SCAN), occurs significantly more often under low
of an interactive process mediated by a changing                    Arctic sea-ice conditions (figure 5, tall red bars for
atmospheric circulation [64], in which the BK sea-ice               SCAN). During SCAN blocking episodes the crests
anomaly is a response to regional internal variability              of planetary waves extend into the Arctic causing
and/or BK can force the atmospheric circulation [63].               high baroclinicity; northward ocean advection into

                                                      4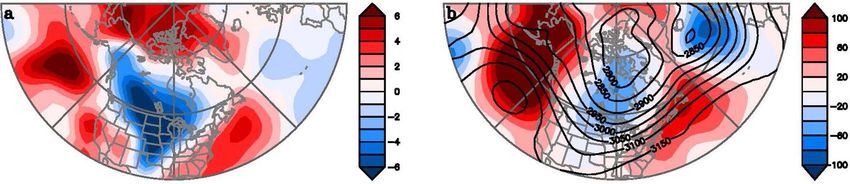
Environ. Res. Lett. 16 (2021) 043002                                                                                 J E Overland et al

   Figure 3. Time variation of the mean sea-ice concentration anomaly over the BK (black) and WACE index (green) in early winter
   (November and December). Blue (red) dots represent the years when the sea-ice cover was more than 0.5 standard deviation (gray
   dashed lines) above (below) the mean during 1979–2019 (black dashed line). Sea-ice concentration data are from HadISST
   (www.metoffice.gov.uk/hadobs/hadisst/), and the WACE index is estimated as the difference in surface air temperature between
   the BK (65◦ N–82◦ N, 10◦ E–100◦ E) and central Asia (40◦ N–60◦ N, 70◦ E–120◦ E) using the NCEP-DOE Reanalysis 2 data
   (https://psl.noaa.gov/data/gridded/data.ncep.reanalysis2.html).

   Figure 4. Regression maps of monthly averaged geopotential heights at 300 hPa from November to February for winters from
   1978/79 to 2014/15, regressed onto the detrended and normalized November-averaged BK (70–85◦ N, 15–90◦ E) SIC index. The
   sign of the coefficients is reversed, such that positive (negative) height anomalies are associated with negative (positive) SIC
   anomalies. Heavy black contours indicate where statistical significance exceeds the 95% level. The analysis is based on
   geopotential heights from the Japan Meteorological Agency JRA-55 reanalysis (www.jra.kishou.go.jp/JRA-55/) and the Met Office
   Hadley Centre HadISST2 sea ice data (www.metoffice.gov.uk/hadobs/hadisst2/).

the Barents Sea should add to loss of sea ice as a for-              when the BK sea-ice cover was more than 0.5 stand-
cing [69]. The appearance of the SCAN pattern often                  ard deviations below the climatological mean during
coincides with the occurrence of the North Atlantic-                 early winter (November and December) (figure 3).
BK-Asia wave train [70–72]. Lack of BK sea ice and                   The onset and termination of the cold event are
extensive autumn snowfall anomalies over Siberia are                 defined when daily mean SAT over East Asia (35◦ –45◦
not necessarily causes for the atmospheric wave train                N; 120◦ –130◦ E) exceeded −1.5 standard deviations
across Eurasia but may contribute to the initiation                  over 2 d (onset), then the daily mean SAT recovered
and reinforcement of a Ural blocking pattern [23, 60],               to the climatological mean (termination). From day
which can further reduce the BK sea-ice cover [70]. In               −6 to day 0, the area of anomalously low SATs relat-
early winter all three mechanisms (equation (1)) are                 ive to the climatological mean, high sea-level pressure
involved: surface heat flux, warm-air advection, and                 (SLP), and geopotential height at 300 hPa all moved
blocking.                                                            southeastward from the BK and Ural Mountains to
    On seasonal timescales, blocking in the Ural                     East Asia. The negative SAT anomaly occurred due to
region can establish a cold reservoir in central                     cold advection from the expansion of the high geo-
Siberia, which can affect subsequent downstream                      potential height anomaly [59, 73, 74]. From days −6
synoptic weather events that advect cold air-masses                  to 0, an upper-level atmospheric wave pattern con-
into eastern Asia. The figure 6 composite of winter                  sisted of negative geopotential height anomalies over
anomaly maps from 1979 to 2019 captures synoptic                     northern Europe and Lake Baikal and its surround-
conditions during November–March over Eurasia                        ings, and positive height anomalies over the BK and
prior to the onset of cold surge events in East Asia,                the Ural Mountains. A strong east–west SLP gradient

                                                      5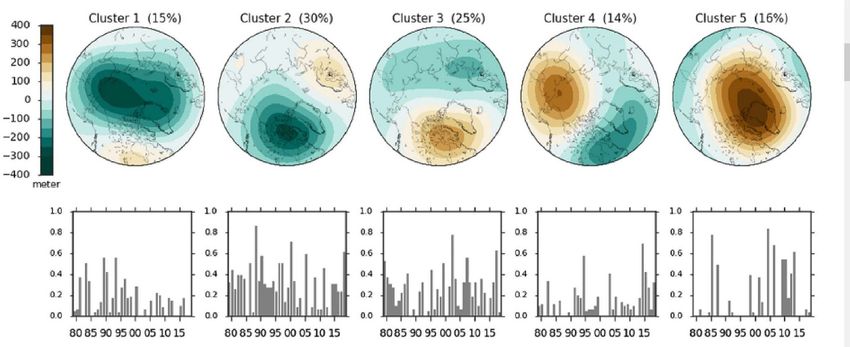
Environ. Res. Lett. 16 (2021) 043002                                                                                       J E Overland et al

   Figure 5. Relative frequency of five large-scale atmospheric patterns during December, January, February, and March 1979–2019
   with respect to Arctic sea-ice conditions from ERA-Interim. Blue bars represent the relative frequency of occurrence for high ice
   conditions, and red bars for low ice conditions. The five patterns, resolved through cluster analysis on sea-level pressure fields, are
   identified as North Atlantic Oscillation (NAO+), SCAN, ATL−, NAO−, and dipole (reprinted from [68]. ©2017 The Authors.
   Published by Elsevier B.V. CC BY 4.0.). Note the frequent occurrence of the SCAN pattern in early winter and the NAO− pattern
   in later winter for low sea ice conditions.

formed (figure 6(i)), promoting northerly winds and                     with a well resolved stratosphere and/or interactive
cold surges across East Asia (figure 6(c)).                             stratospheric chemistry more realistically simulate
    A record event occurred in late December 2020                       observed linkages between BK sea-ice loss and a
representing a classic Ural High and a deep coastal                     weakened SPV [5, 81].
Asia/North Pacific low, with a 1094 hPa high, 920 hPa                       During late winter, a circulation pattern sim-
low, and a major eastern Asia cold event.                               ilar to the negative phase of the NAO is preferred
                                                                        when low-ice conditions occur, indicated by the taller
2.2. Late winter pathway                                                red bars than blue bars in February and March for
The second mechanism, termed the stratospheric                          NAO− in figure 5. A negative NAO is the most com-
pathway, has a longer timescale extending from                          mon response following weak SPV events along with
mid- to late-winter (e.g. [5, 11, 58, 61, 75, 76]).                     the corresponding downward propagation of posit-
It is characterized by a series of dynamically con-                     ive polar cap geopotential height anomalies from the
sistent, time-lagged relationships, i.e. enhanced ver-                  stratosphere to the surface [61, 82, 83]. The time-lag
tical propagation of planetary-scale Rossby waves that                  regression of February 300 hPa geopotential height
weaken the SPV, followed by a downward progression                      anomalies on the November BK sea ice anomaly (far-
of connections to the troposphere and a resultant neg-                  right of figure 4) provides supporting evidence for a
ative North Atlantic/Arctic Oscillation (NAO/AO) in                     NAO shift toward the negative phase in late winter,
January through March (figure 4, right) [58, 77–80].                    with a high/low dipole of anomalous heights over
Observational studies link the recent increase in weak                  the Nordic Seas and the North Atlantic. Anomal-
SPV events (cluster 5 pattern in figure 2) to negative                  ously extensive snow cover and cold soil temperat-
sea-ice anomalies in the BK (figure 3), and negat-                      ures during fall can influence winter weather in Asia
ive NAO in February and March (figure 5) [58].                          by preconditioning (albedo and temperature) and
However, modeling studies provide only mixed sup-                       through positive feedbacks [84–87], although some
port for these relationships, although some models                      studies question these interactions (e.g. [70, 75]).

                                                         6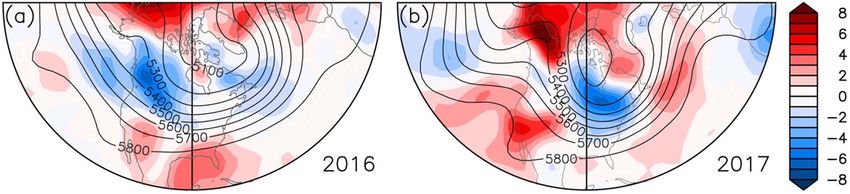
Environ. Res. Lett. 16 (2021) 043002                                                                                  J E Overland et al

   Figure 6. Composite anomaly maps of winter (November through March from 1979 to 2019) for (left) surface air temperature
   (SAT, ◦ C) with wind vectors (m s−1 ) at 850 hPa, (middle) 300 hPa geopotential height anomalies (m), and (right) sea-level
   pressure anomalies (hPa), when the BK sea-ice concentration is at least 0.5 standard deviation lower than normal in early winter
   (November and December), as shown in figure 3. Top to bottom: 6 d before, 3 d before, and the day of cold-surge occurrence.
   Wind vectors and SAT, 300 hPa geopotential height anomalies, and sea level pressure anomalies significant at 95% confidence
   level are represented as dark arrows and dots, respectively, from student’s t-test. Data are from NCEP/NCAR reanalysis.

    Challenges remain in understanding how the                       Forecasts, high Arctic SAT exceeded 0 ◦ C in early
wave train over the North Atlantic-Eurasian sector                   January 2016, a value 25 ◦ C above the winter clima-
and the phase shift to the negative NAO evolve over                  tological mean with a record high daily temperature
the extended winter season (November to March).                      since 1950 [91]. Following this warm event, a large
Table 1 summarizes the potential impacts of BK sea-                  reduction in the Arctic sea-ice extent occurred in the
ice loss on weather in Asia during early- versus late-               middle of the cold season [92–95], and a cold wave
winter. Despite evidence of Arctic/midlatitude link-                 struck much of East Asia in late January 2016, bring-
ages during some SSW events, not all such episodes                   ing record low SATs and snowfall to many parts of
result in strong troposphere cooling, as was the case                southeast and central Asia [90, 96, 97].
with the marked SPV weakening of February/March                          Figure 7 presents daily isentropic PV fields for
2019 [88].                                                           28–31 December 2015, when an abrupt temperature
                                                                     increase began over the BK. On 28 December 2015,
2.3. A case study for the impacts of local heat fluxes               a lobe of low PV (less than 5 PV units on the 330 K
Here we use a recent case study to better under-                     isentropic surface, approximately 300 hPa) intruded
stand underlying physical mechanisms between BK                      into the Arctic with a corresponding warm air flow
sea-ice/SAT and atmospheric conditions over Asia,                    into the Arctic (figure 7(a)). At the same time, an area
augmenting previous discussions based on statist-                    of high PV developed and amplified to the south on
ical approaches. To demonstrate the usefulness of                    both sides of the low PV over the North Atlantic. Dur-
synoptic-scale analysis, we present potential vorticity              ing 29–31 December 2015, the low PV region reached
(PV) fields and a daily evolution of anomalies in SAT,               its minimum value over the BK (figures 7(b)–(d)).
turbulent heat fluxes, sea-ice concentrations (SICs),                The warm and humid air intrusion from lower lat-
and downward longwave radiation fluxes (DLR) for                     itudes reached the central Arctic, showing an active
the remarkable amplification of the Arctic warm                      role in the initiation of the extreme warming event.
anomaly that occurred in late December 2015 to early                 The high PV to the south developed to its max-
January 2016 [65, 89, 90] followed by an exceptional                 imum value and a gradual reversal of the PV gradient
cold spell in East Asia during late January.                         occurred, indicating a cyclonic wave-breaking event,
    According to the operational analysis from                       which is a typical initial indicator of block forma-
the European Centre for Medium-Range Weather                         tion. A precursor to the warm BK event was thus

                                                      7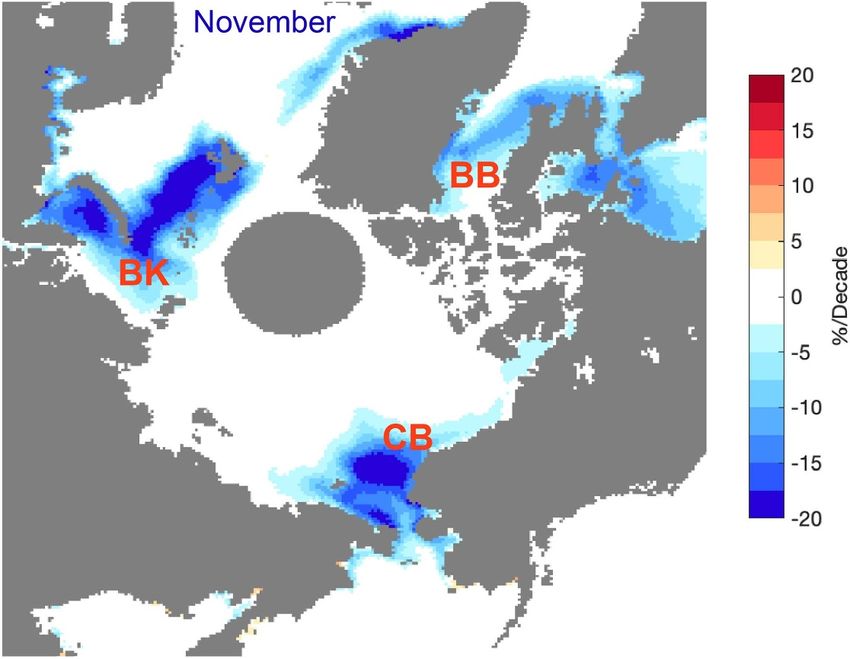
Environ. Res. Lett. 16 (2021) 043002                                                                                    J E Overland et al

Table 1. Summary of sea-ice related anomalies from the lagged-regression analysis using the detrended November-averaged
Barents-Kara (30–90◦ E and 65–85◦ N) sea-ice concentration time series, such as in figure 4 for 300 hPa geopotential height data.
Supporting information: ∗ : results are similar to figure 2 but using an analysis based on monthly averaged sea level pressure (SLP) and
surface air temperature (T-2m) fields. ∗∗ : similar to figure 4 but the analysis is based on the daily zonal-mean zonal winds at 60◦ N and
the vertical Eliassen-Palm flux (i.e. EP-flux) component averaged over 40–80◦ N at 100 hPa. The analyses are for the winters from
1979/80–2016/17. The features listed are also discussed by [5, 58, 59, 61, 80].

                                         Early winter                              Late winter
                              Nov                    Dec                Jan                        Feb                    Ref. and Notes

Tropospheric circulation • Wave train from North            • NAO becomes more negative                                   Figures 6 and 7
anomalies                   Atlantic to Eurasia                 in Feb
                         • Deeper Icelandic Low in Nov
                                                                                                                          ∗
Surface conditions in    • Siberian high becomes stronger and is expanded eastward and westward
Siberia                  • Surface temperature becomes lower
                                                                                                                          ∗∗
Stratospheric polar                                         Progressively weaker
vortex (SPV)
                                                                                                                          ∗∗
Vertical EP-flux         Increase in Dec                    A large peak in Jan and
component                                                   subsequent weak SPV

internal atmospheric variability from vorticity advec-                 due to sea-ice loss, while warm-air advection is epis-
tion (Term A in equation (1)).                                         odic (figure 8(b)).
    After the initiation of the abrupt warming by
the intrusion of a low-PV airmass, a WACE pattern
developed during the first 10 d of January 2016. Over                  3. North America
the following 10 d, positive SAT anomalies over the
BK decreased. During the evolution of this extreme                     3.1. Early winter tropospheric pathway
event, a stationary positive geopotential height anom-                 Over North America in early winter, loss of sea
aly persisted for nearly a month over the Ural Moun-                   ice in CB may reinforce an existing climatological
tains region, a Ural blocking event [74, 98, 99].                      ridge/trough jet stream pattern [36, 39, 51, 63, 103,
    We examined the BK regional co-variability of                      104], although it is clear that the connection does
daily SAT and sea ice anomalies (figure 8(a)), along                   not occur in every year despite continuing AA. It
with area-averaged turbulent heat fluxes and DLR                       is thus worthwhile to investigate year-to-year shifts
during this event (figure 8(b)). Here, the BK region is                in the background jet stream pattern. The pattern
defined by 76◦ N–83◦ N, 20◦ E–80◦ E. In figure 8(a),                   in December 2016 contrasts with December 2017
the local temperature variation leads SIC variation                    (figure 9). During both years, sea-ice freeze-up was
by 1 or 2 d. Note that SAT increases abruptly on                       delayed in association with abnormally warm SAT in
28–29 December 2015 (figure 8(a)), coincident with                     the CB; in 2017 the anomalously warm SAT rein-
the PV analysis shown in figures 7(a) and (b),                         forced the climatological wavy jet stream over North
which indicates intrusion of a low-PV airmass to                       America [51] and downstream trough with cold east-
BK from lower latitudes [92]. The DLR anomaly in                       ern U.S. temperatures [39, 63, 105] (figure 9(b)),
figure 8(b) is strongly correlated with the SAT anom-                  while in 2016 (figure 9(a)) the more zonal prevail-
aly in figure 8(a) (r = 0.92). On daily time scales,                   ing jet stream was located too far south to tap into
the anomalies in turbulent heat flux and SIC are                       the surface heat source north of Alaska. During 2016
not identifiably correlated. Nevertheless, the turbu-                  the northeast Pacific also featured a cold SST anom-
lent heat flux exhibits an anti-correlation with DLR                   aly that stretched latitudinally along ∼45◦ N, which
on daily time scales (r = −0.69), with DLR slightly                    favored an enhancement of the southern located
leading the turbulent heat flux. This suggests periods                 zonal jet.
of warmer SAT and humid air flow, illustrating the                         To put December 2017 in context, figure 10 shows
active role of warm and moist air advection (Term B                    the time series of December cold and warm temper-
in equation (1)) in driving both surface warming and                   ature events over the eastern U.S. and the indices of
sea-ice melt over the BK [22, 28, 100–102]. Assum-                     ridging (500 hPa geopotential heights) over Green-
ing that a positive DLR anomaly is indicative of a                     land/Baffin Bay (GBB) and Alaska ridging (AR). AR
warm-air intrusion, we note that the several events                    was associated with the 2017 pattern, GBB block-
occurred with less than a 10 d life cycle (figure 8(b)).               ing was influential in 2010, and ridging in both
At the same time, the overall sea-ice cover of the                     regions was coincident with the eastern U.S. cold
BK during winter of 2015/16 was well below normal                      event in 2000. During warm Decembers, AR and/or
(figure 8(a)). In summary, integrating through the                     GBB indices tend to be negative. Note that five
entire period from 20 December 2015 to 10 Febru-                       major cold events in the 1980s occurred before the
ary 2016, the turbulent heat flux anomaly is positive                  emergence of significant AA, dominated by internal
(upward), contributing to amplified Arctic warming                     atmospheric variability [51]. showed quantitatively

                                                        8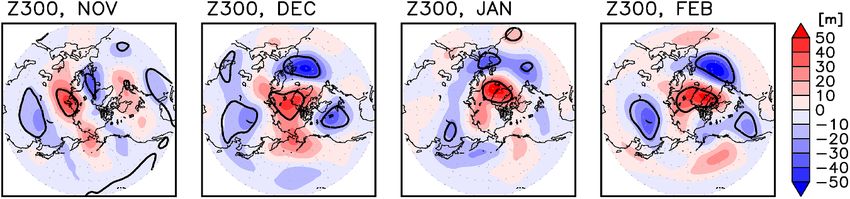
Environ. Res. Lett. 16 (2021) 043002                                                                                J E Overland et al

   Figure 7. Evolution of daily-mean potential vorticity (PV) at 330 K in the Northern Hemisphere for the period of extreme Arctic
   amplification that occurred during late December 2015 (a)–(d). For better visualization, only areas with PV over 5 PV units
   (PVU) are shaded (1 PVU = 10−6 km2 kg−1 s−1 ). Data are from the Japan Meteorological Agency JRA-55 reanalysis
   (www.jra.kishou.go.jp/JRA-55/).

that all three potential linkage mechanisms contrib-                south of the Arctic but with a slight ridge as seen in
uted to the North American weather pattern during                   the height anomaly pattern due to warm near surface
early winter 2017 (equation (1)): direct ocean surface              temperatures (figure 11(a)). Warm Arctic temper-
fluxes (their figure 6(b)), warm air advection, and a               atures contribute to a separate height anomaly and
wavy background jet stream. A key implication from                  ridging over Alaska (figure 11(b)). The combination
figure 10 is that the jet stream configuration was not              of the North Pacific and Alaskan ridging supports
favorable for an early-winter monthly weather linkage               the North American ridge/trough pattern with record
between the Arctic and North America in most recent                 October cold temperatures in the central plains of the
years [106] with the notable example of extreme                     U.S. and southern Canada.
warmth in 2015 accompanied by negative AR and
GBB. Also apparent is that wavy jet stream patterns                 3.2. Late winter pathway
were associated with cold winters in eastern North                  In late winter conditions leading to persistent cold
America before the start of AA due to the connection                spells in central and eastern North America are often
between an AR or GBB index and the cold temper-                     associated with enhancement of the climatological
ature anomalies. Individual cold spells can span less               tropospheric western ridge/eastern trough jet-stream
than a month preceded or followed by warm anom-                     pattern across the continent that can be instigated
alies, thus monthly averaging may obscure linkage                   and maintained by SPV displacements. A signific-
events with durations on sub-monthly timescales.                    ant shift of the SPV away from the central Arctic is
    While the direct connection with the fall-early                 evident as an elongated pattern, with a negative geo-
winter jet stream is in December, an interesting new                potential height center in the vicinity of Greenland
case is late October 2020 (figure 11). Figure 11(b)                 (clusters 2 and 4 in figure 2). A connection may also
shows the jet across the eastern North Pacific well                 exist between higher geopotential heights north of

                                                      9
Environ. Res. Lett. 16 (2021) 043002 J E Overland et al
Figure 8. Time-series of anomalies in (a) surface air temperature (SAT; red) and sea-ice concentration (SIC; blue); (b) turbulent
heat flux (THF; red) and downward longwave radiation (DLR; green) from 20 December 2015 to 10 February 2016 over BK Seas
(76–83◦ N, 20–80◦ E). Note that positive (negative) DLR (THF) is directed downward. The analysis is based on the variables
downloaded from Japan Meteorological Agency JRA-55 reanalysis (www.jra.kishou.go.jp/JRA-55/).
Figure 9. Mean 500 hPa geopotential heights (contours in m) and 925 hPa temperature anomalies (shading in ◦ C) for (a) 3–28
December 2016 and (b) 8–31 December 2017. The jet stream approximately follows the strongest gradient in the height contours.
In 2017 positive temperature anomalies align well with the ridge in Alaska, and cold anomalies are located under the trough in
eastern North America. Data from NCEP/NCAR reanalysis.
East Asia and lower heights over Greenland involving nearly vertically collocated (figures 12(b) and (d))
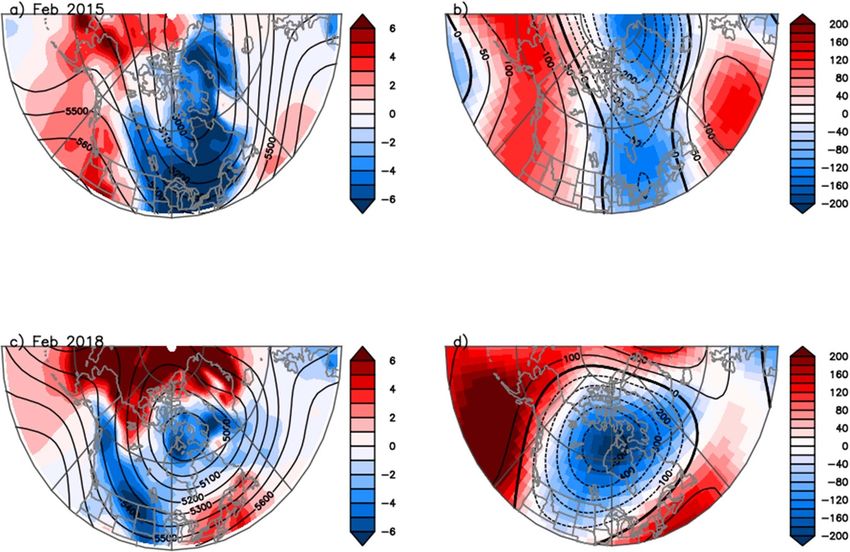
tropospheric/stratospheric coupling [52, 107, 108]. [109]. During the winter of 2018 associated with
During February 2015 and 2018, for example, a pos- this SPV disruption, record persistence of anomalous
itive temperature anomaly occurred in Alaska, while open water in the Bering and Chukchi Seas—and the
cold conditions persisted in eastern or central North resulting ocean-to-atmosphere heat transfer—helped
America (figures 12(a) and (c)). Negative geopoten- to anchor and amplify a ridge in the polar jet stream,
tial height anomalies at 500 hPa and 100 hPa were with a strong southerly flow aloft bringing unusually
10Environ. Res. Lett. 16 (2021) 043002 J E Overland et al
Figure 10. Time series of surface air temperature anomalies (T2m, grey bars) averaged over eastern U.S., indices of
Greenland-Baffin Blocking (GBB, blue circles), and Alaska ridging (AR, red squares) for the month of December. GBB and AR are
defined as the areal-averaged geopotential height anomaly at 700 hPa over domains: GBB: 60–75◦ N, 70–50◦ W; AR: 60–75◦ N,
150–130◦ W; NE America: 36–46◦ N, and 85–70◦ W. Data are based on NCEP/NCAR reanalysis, obtained from
https://psl.noaa.gov/data/gridded/data.ncep.reanalysis.surface.html.
Figure 11. (a) 925 hPa temperature anomalies for 16–31 October 2020. (b) 700 hPa geopotential height field (contours) and
anomalies (color shading; both in m). Data are from NCEP/NCAR reanalysis.
warm conditions to those regions [103]. Downstream snow events typically affect eastern North America,
(east) of this ridge, a deep trough persisted over including the densely populated I-95 corridor from
Hudson Bay and western Canada, causing a pro- Boston to New York City and as far south as Washing-
longed and intense late-winter cold spell across cent- ton, D.C [112]. Existence of an enhanced west-coast
ral North America [110]. This pattern occurred again ridge also intensifies drought conditions in Califor-
in January/February 2019, though in 2019 the pattern nia [105]. When an amplified ridge/trough pattern
was shifted even farther westward relative to 2018. exists over North America, the eastward propagation
In 2015 (figures 12(a) and (b)) the trough was dis- of the longwave jet-stream pattern tends to stagnate,
placed east, resulting in anomalously cold temperat- thereby slowing the migration of weather systems
ures across eastern North America. across the continent and creating persistent weather
Evidence suggests that late winters (JFM) dur- conditions. Some studies [36, 39, 51] argue that the
ing the AA era (since ∼1990) featured more fre- pattern is favored when low sea ice in the CB region
quent amplified tropospheric ridge-trough longwave occurs in combination with anomalously warm SSTs
circulation patterns over North America [41, 110]. in the eastern North Pacific, as has been the case dur-
Extreme cold events (Environ. Res. Lett. 16 (2021) 043002 J E Overland et al
Figure 12. Averaged February 2015 and February 2018 (a) and (c) 500 hPa geopotential height (m) and 2 m air temperature
anomalies (◦ C, shading), and (b) and (d) geopotential height anomalies (m) at 500 hPa (shading) and 100 hPa (contour). Data
are from the NCEP/NCAR reanalysis.
hypothesized to act in concert to amplify an existing suggests that NE Pacific SST anomalies are helping
wavy jet pattern in recent decades [39, 51, 116]. Here to drive the start of current jet stream sequencing,
we focus on the within-season timing of ridging in with the strengthening of the ABI due to constructive
the vicinity of Alaska versus Greenland from 1989 interference between the ridge and AA in the Pacific
through 2019. The frequency of both of these fea- sector of the Arctic.
tures has increased during this period (figure 13), but The timeseries analyses above (figures 10 and 13)
the temporal behavior is dominated by interannual [51], SPV disruptions, stratospheric congruence with
variability. A metric defined as the Alaska Blocking tropospheric events (figure 12 [109]), recent anom-
Index (ABI) [117] describes the mean 500 hPa geo- alously warm SSTs in the northeast Pacific, and con-
potential height field across greater Alaska: 54–76◦ N tinued record low CB SICs during winter combine to
and 125–180◦ W; note the ABI (late winter) has a support the hypothesis that background, pre-existing
slightly different domain than AR (December) from state-dependence of the longwave geopotential height
earlier discussion (figure 10). The maximum daily pattern combined with warm air advection (Term B
ABI value within each month is compared with the in equation (1)), are all factors helping to drive Arc-
lowest Greenland blocking index (GBI) value within tic/midlatitude linkages that lead to extreme winter
±14 d of that anomaly (figure 12); note that the GBI’s weather events over North America [35]. There has
center is slightly east of the GBB used in figure 10. The always been a connection among the jet stream, SPV,
Greenland trough (negative GBI) developed roughly and U.S. cold spells (figures 10 and 13), and we
one week before the Alaskan ridge for cases high- argue that the connection may been further modu-
lighted from 1989 to 2007, with the exception of con- lated by AA in certain wavy jet stream configurations.
current ridge-trough extremes during late February Other possible factors include time-lagged interac-
of 1995. Since 2014, however, the Pacific ridge (i.e. tions involving thinner sea ice in winter, anomal-
ABI maximum) has strengthened [117] and has con- ous land-surface cooling rates, and Eurasian fall snow
sistently preceded the formation of the Greenland coverage; these phenomena create linkage mechan-
trough by ∼10 d (figure 13). This change in behavior isms that involve anomalous surface/atmosphere tur-
coincides with the shift in the PDO from its negat- bulent heat fluxes, transient eddy activity, eddy–
ive to positive phase [113], with anomalously warm mean flow interactions, and vertical wave activity
SSTs in the northeastern North Pacific that favors fluxes that can trigger or amplify SPV disruptions
development of a ridge in this location [36, 39]. This [36, 84, 118, 119].
12Environ. Res. Lett. 16 (2021) 043002 J E Overland et al
Figure 13. Daily occurrence of the February/March Alaska Blocking Index (ABI) maximum (i.e. ridge) and Greenland blocking
index (GBI) minimum (i.e. trough) since 1989. Years of anomalous monthly ABI values (>0.5σ) are listed (1989, 1993, 1994,
1995, 2003, 2007, 2014, 2015, 2018, 2019) and the daily GBI minimum (green circles) are shown with respect to ±14 d of the ABI
maximum (black squares) within those years. Red dashed line indicates the switch from negative to positive Pacific Decadal
Oscillation (PDO) in winter 2013/14. The ABI maximum and GBI minimum overlap in 1995. Data are from ERA-Interim
Reanalysis.
4. European weather extremes Atlantic polar jet stream (negative AO/NAO) gen-
erally coincided with high geopotential heights over
Extreme European winter weather is often related to Greenland, indicated by a positive GBI [126, 127].
the weakening of the SPV, seen as cluster 5 of figure 2. These cases illustrate that different and some-
Table 2 lists recent anomalously cold winter months times multiple factors are associated with extreme
for Central England temperature (CET [120]) rep- cold spells in Europe. In March 2013, for example,
resenting northwest Europe, defined by anomalies of extensive cold SATs persisted across northern Eurasia
at least 1.0 ◦ C below the respective monthly mean coincident with the SPV displaced to northern
for 1981–2010. The Table highlights the year-to-year Siberia (figure 14). The evolution of the earlier
intermittency of such events. The positive anom- events in table 2 (December–February 2009/10 and
alies of the average 100 hPa polar cap geopotential November–December 2010) contrasts with March
height field anomaly (PCA) north of 60◦ N is an 2013. During January/February 2010, blocking began
indicator of weakening of the SPV (table 2 right, over the Barents Sea, moved southward, then com-
figure 2 right), as is the proxy indicator, the neg- bined with a block that had developed in the west-
ative AO. Winters in the United Kingdom during ern North Atlantic before shifting north over Green-
2013/14, 2015/16, and 2019/20 were exceptionally land, and finally moving west toward Canada. During
mild, wet, and stormy, while winters during 2009/10 Nov/Dec 2010, which featured a record high Decem-
and 2010/11 were unusually cold with record snow- ber GBI value since the record began in 1850 and
falls [121]; March 2013 was the coldest March in the coldest December CET value since 1890, a pos-
England since 1962. In late-winter 2018, extremely itive 500 hPa geopotential height anomaly formed
cold air invaded Europe from Siberia in an event over Scandinavia then moved west to form an intense
known as the ‘Beast from the East’ following a SSW Greenland block.
and disrupted SPV, giving the coldest March day For the Beast-from-the-East case, in late February
in over a century over much of England and Wales 2018 the SPV was displaced over northeast Canada
[122, 123]. These events correspond with observed similar to the pattern resolved by cluster 2 in figure 2
increases in interannual variability in the AO, NAO, along with anomalously high stratospheric geopoten-
jet latitude, and Greenland Blocking during winter tial heights over Europe and associated tropospheric
[124, 125]. Synchrony exists among various large- high pressure settling over Scandinavia and the Bar-
scale indices for some of these events, such as the ents Sea. During March 2018 in contrast, observed
AO/NAO and the GBI; a southward-shifted North 100 hPa geopotential heights featured a strong SPV
13Environ. Res. Lett. 16 (2021) 043002 J E Overland et al
Table 2. North Atlantic/Arctic atmospheric circulation indices, Arctic Oscillation (AO), North Atlantic Oscillation (NAO), and
Greenland blocking index (GBI), for recent anomalously cold winter months between winters (NDJFM) 2010 and 2020 inclusive in
northwest Europe (defined by Central England Temperature (CET [120],) anomalies of at least 1.0 ◦ C below the respective monthly
mean for 1981–2010). AO is from the CPC website . NAO is from NCAR Climate data guide, and average polar cap height anomaly
(PCA) north of 60◦ N is from NCAR/NCEP reanalysis.
Year Month CET anom. AO NAO GBI PCA
2009 December −1.5 −3.41 −3.01 2.39 1.50
2010 January −3.0 −2.59 −2.13 1.59 0.79
2010 February −1.6 −4.27 −3.99 2.41 3.10
2010 November −1.9 −0.38 −1.61 1.92 0.10
2010 December −5.3 −2.63 −3.61 3.15 0.73
2013 February −1.2 −1.01 −1.00 0.79 1.82
2013 March −3.9 −3.18 −4.12 2.37 0.46
2016 November −1.5 −0.61 −0.09 0.74 1.48
2018 February −1.5 0.11 0.52 −1.06 1.34
2018 March −1.7 −0.94 −2.29 1.33 0.88
Figure 14. Air temperature anomalies at 925 hPa (◦ C, shading) and 100 hPa geopotential heights (m, contours) for March 2013.
Data are from the NCEP/NCAR reanalysis.
center that shifted to Arctic Eurasia, also evident midlatitude weather linkages [1, 126, 128]. In sum-
at 500 hPa. The time sequence of the late winter mary, European winter cold air outbreaks are often
Beast-from-the-East case illustrates that internal vari- related to the weakening of the SPV and SSW [129].
ability of the SPV, and remote drivers including mid- In contrast to figure 2 that implies stationarity of SPV
and high-latitude blocking [123], were responsible patterns, these studies show the importance of the
for different forcing of the severe cold spells over movement of the SPV location, and forming daughter
Europe during February and March 2018. vortices in the case of splitting, within a winter season.
Taken together, these four European examples
(early and late 2010, March 2013, and February/- 5. Potential tropical modulation of
March 2018) indicate the sometimes importance of Arctic–midlatitude linkages
Greenland for reinforcing blocking, but blocking can
initially develop elsewhere, typically either in the Nor- The SSW event in February 2018 has also been stud-
wegian or Siberian Arctic. High-latitude Greenland ied in conjunction with circulation and temperat-
and SCAN blocks tend to be associated with an anom- ure anomalies arising from the Madden–Julian oscil-
alous meridional circulation in the polar jet stream, lation (MJO), the quasi-biennial oscillation (QBO),
thus providing an important conduit for poleward and El Niño-Southern Oscillation (ENSO). We briefly
temperature and moisture advection and high to describe the MJO, QBO and ENSO and discuss their
14Environ. Res. Lett. 16 (2021) 043002 J E Overland et al
possible roles in the context of the Arctic-midlatitude circulation model was used to investigate the influ-
linkage. ence of the QBO, a weakening of the SPV was a
The MJO is the dominant mode of intra-seasonal response to sea ice loss under the easterly phase of
variability in the tropical troposphere on timescales the QBO through strengthened upward propagation
typically around 40–50 d [130]. It consists of eastward of planetary-scale wave [146].
propagation of large-scale circulation cells and organ- We analyzed the polar cap height (PCH) anomaly,
ized cloud complexes from the Indian Ocean to the defined as the averaged geopotential height anomaly
Pacific Ocean. The phase of MJO is captured by the for the area northward 60◦ N at the 50 hPa level,
EOF-based multivariate MJO index [131], which has as a measure of the SPV strength and its relation
eight phases closely matching the geographical loca- with the QBO phase and BK ice conditions. Figure 15
tion of the MJO-related enhancement of convection. shows how the PCH varies under different QBO
Two phases are relevant to our discussion; the MJO and sea ice conditions. There is an apparent shift
phases 2–3 and 5–6 correspond to conditions with towards negative values (stronger SPV) for the QBO-
high convection activity in the tropical Indian Ocean west (QBOW) compared with the QBO-east (QBOE)
and the western Pacific, respectively. (figure 15(b)). A similar shift within the QBOW
The QBO is an oscillation of zonal winds in high/low (H/L) ice composites is seen but is not sig-
the equatorial stratosphere at about 2 year intervals nificant (figure 15(c)). There is no clear difference in
(see [132] for a review). During its easterly (west- PCH anomalies between the high and low ice com-
erly) phase, the SPV in the Northern Hemisphere posites within the QBOE.
tends to be weaker (stronger), known as the Holton– To ascertain whether the above description indic-
Tan relation [133, 134]. Through modulating stabil- ates joint influence from the QBO and sea ice on the
ity in the tropical tropopause layer, the easterly QBO strength of the SPV, we invoke dynamical evidence.
phase is associated with enhanced convective activity A recent study found that weak SPV events, includ-
in the warm pool region, which generates a Rossby ing SSWs, have distinct characteristics in upward
wave train that propagates into the midlatitude tro- propagation of planetary-scale waves depending on
posphere [135, 136]. the sea ice condition, i.e. increased wavenumber-1
ENSO is an interannual oscillation of the ocean- and wavenumber-2 E-P flux components in high and
atmosphere coupled system over the tropical Pacific, low sea conditions, respectively [80]. The anomalous
occurring typically at 3–5 year intervals, with related structure in the wavenumber space under low sea ice
climate anomalies in many parts of the globe and weak SPV conditions is similar to that under the
[137, 138]. During its warm phase (El Niño), a strong low sea ice condition only, e.g. [147]. This is inter-
convective region moves eastward from its climato- preted as indicating a sea ice influence on the SPV is
logical position in the tropical western Pacific with constructive with respect to QBOE.
positive SST and negative SLP anomalies to the trop- ENSO and its connection to the extratropics has
ical central/eastern Pacific. been studied in a tropospheric and stratospheric
The MJO, QBO and ENSO have timescales longer context [148, 149]. Both observational and mod-
than synoptic, making them potential sources of elling studies document that during El Niño (La
improved sub-seasonal to seasonal prediction [139]. Niña) events the SPV is weakened (strengthened)
A study of the MJO in the 2018 SSW event sugges- by enhanced (reduced) upward planetary-scale wave
ted the importance of the record-breaking strength of propagation [150–152]. However, this relation is not
MJO phase 6, with the amplification of wavenumber- always clear owing to the short observational record
2 planetary wave and associated teleconnection to and the relatively long and irregular intervals between
this SSW [140]. Evidence is presented for the MJO ENSO events [153, 154]. The tropospheric pathway
phase 3 and 6 being precursors of the NAO regimes is more active during El Niño, while the stratospheric
[141–143]. Low sea ice coverage in the BK is pathway is more active during La Niña [155].
linked with a weaker SPV through enhanced upward Tropical variability, such as the MJO, QBO, ENSO,
propagation of planetary-scale waves. and stratospheric/tropospheric vertical propagation,
Not only the MJO but ENSO and QBO phases can influence Arctic sea ice, the NAO, and SPV, and
favored a weak SPV for the 2018 SSW event [144]. modify sub-seasonal weather.
MJO amplitude is significantly larger in the east-
erly phase of QBO, presumably with stronger signals
in the extra-tropics via teleconnection [145]. Even 6. Summary
without a joint influence with the MJO, the QBO has
control on SPV strength, e.g. [132]. A first concern In this review we discuss four aspects of Arctic/mid-
is the stratospheric pathway and downward influence latitude connections that have so far received relat-
of the weak SPV on the lower troposphere. A second ively little attention: (a) the differences between early-
part addresses if and how sea-ice variability influ- and late-winter processes, (b) details of factors that
ences the SPV that is already under strong influence can amplify synoptic cold events in Asia, North Amer-
by the QBO. When a high-top atmospheric general ica, and Europe, (c) the role of SPV disruptions,
15Environ. Res. Lett. 16 (2021) 043002 J E Overland et al
Figure 15. Frequency distributions of monthly mean polar cap height (PCH) anomalies (m) at 50 hPa for 1972/73- 2018/19
winter (DJF) months for (a) all winter months; (b) QBOW (red) and QBOE (blue) composites; (c) high-ice (red) and low-ice
(yellow) groups within the QBOW composite; (d) high-ice (blue) and low-ice (light blue) groups within the QBOE composite.
The QBOW and QBOE were defined using the criterion of ±3 m s−1 applied to the tropical (5◦ S–5◦ N mean) zonal-mean zonal
wind at the 40 hPa level. For the sea ice condition, daily BK SIC anomalies were used after applying the second-order polynomial
fitting and averaged for December with the ±0.5 sigma criterion. Data are from the JRA-55 reanalysis and the HadISST2 sea ice
data that includes the compilation of the National Ice Center sea ice chart.
and (d) tropical modulation of Arctic/midlatitude frequent potential progenitor of Greenland blocking.
linkages. The role of direct forcing from recent sea-ice-free
Early winter Arctic/midlatitude weather linkages areas appears secondary in this process relative to
are more likely to involve reinforcement of tele- internal atmospheric variability, as modeling exper-
connection patterns for Eurasia and climatological iments forced by sea-ice variability alone produce
jet-stream patterns for North America by surface weak atmospheric responses; but these experiments
enhancement related to delayed fall sea-ice freeze- have been shown to understate AA and the corres-
up primarily in the BK, CB, and BB, where early ponding responses (e.g. [12, 33],). Empirical and
winter sea-ice reduction has been substantial. Upward model evidence suggests that decreasing CB sea ice
surface energy flux over newly ice-free areas and can strengthen ridging in the northeastern Pacific
poleward temperature advection (Terms C and B in under the right atmospheric background conditions,
equation (1)) increase the geopotential thickness and thereby increasing persistence of the downstream
thus augment regional AA. Warm anomalies and trough and cold spells over central or eastern North
positive geopotential height anomalies in both BK America [51]. Constructive interaction between jet-
and CB initiate changes in existing large-scale atmo- stream ridging along North America’s west coast and
spheric dynamics (Term A in equation (1)). During regional heating is more likely when northeastern
the early winter in Eurasia, an increase in the fre- Pacific SSTs are anomalously warm, as was the case
quency of SCAN/Ural blocking is observed (figure 5) when the PDO phase shifted to a predominantly pos-
in association with the loss of BK sea ice [68, 128] itive phase in 2014. Varying positions of the trough
and serves as a downstream forcing of individual axis along with overall global warming reduces the
synoptic weather events in East Asia, as well as a more likelihood of breaking cold records; both of these
16You can also read