Long-term column-averaged greenhouse gas observations using a COCCON spectrometer at the high-surface-albedo site in Gobabeb, Namibia - Recent
←
→
Page content transcription
If your browser does not render page correctly, please read the page content below

Atmos. Meas. Tech., 14, 5887–5911, 2021
https://doi.org/10.5194/amt-14-5887-2021
© Author(s) 2021. This work is distributed under
the Creative Commons Attribution 4.0 License.

Long-term column-averaged greenhouse gas observations
using a COCCON spectrometer at the high-surface-albedo
site in Gobabeb, Namibia
Matthias M. Frey1,a , Frank Hase1 , Thomas Blumenstock1 , Darko Dubravica1 , Jochen Groß1 , Frank Göttsche1 ,
Martin Handjaba2 , Petrus Amadhila2 , Roland Mushi2 , Isamu Morino3 , Kei Shiomi4 , Mahesh Kumar Sha5 ,
Martine de Mazière5 , and David F. Pollard6
1 Karlsruhe Institute of Technology (KIT), Institute for Meteorology and Climate Research (IMK-ASF), Karlsruhe, Germany
2 Gobabeb   Namib Research Institute, Gobabeb, Namibia
3 National institute for Environmental Studies (NIES), Tsukuba, Japan
4 Japan Aerospace Exploration Agency (JAXA), Tsukuba, Japan
5 Royal Belgian Institute for Space Aeronomy (BIRA-IASB), Brussels, Belgium
6 National Institute of Water and Atmospheric Research (NIWA), Lauder, New Zealand
a now at: National institute for Environmental Studies (NIES), Tsukuba, Japan

Correspondence: Matthias M. Frey (frey.matthias.max@nies.go.jp)

Received: 6 November 2020 – Discussion started: 27 January 2021
Revised: 7 June 2021 – Accepted: 21 June 2021 – Published: 31 August 2021

Abstract. In this study, we present column-averaged dry-          and Réunion Island operate at roughly the same latitude. The
air mole fractions of CO2 (XCO2 ), CH4 (XCH4 ) and CO             Lauder station is the southernmost TCCON station and func-
(XCO) from a recently established measurement site in Gob-        tions as a background site without a pronounced XCO2 sea-
abeb, Namibia. Gobabeb is a hyperarid desert site at the          sonal cycle. We find a good agreement for the absolute Xgas
sharp transition zone between the sand desert and the gravel      values, apart from an expected XCH4 offset between Gob-
plains, offering unique characteristics with respect to surface   abeb and Lauder due to significantly different tropopause
albedo properties. Measurements started in January 2015 and       height, as well as representative intraday variability between
are performed utilizing a ground-based Fourier transform in-      TCCON and COCCON. Together with the absence of long-
frared (FTIR) EM27/SUN spectrometer of the COllaborative          term drifts, this highlights the quality of the COCCON mea-
Carbon Column Observing Network (COCCON). Gobabeb                 surements. In the southern hemispheric summer, we observe
is the first measurement site observing XCO2 and XCH4 on          lower XCO2 values at Gobabeb compared to the TCCON
the African mainland and improves the global coverage of          stations, likely due to the influence of the African biosphere.
ground-based remote-sensing sites. In order to achieve the        We performed coincident measurements with the Green-
high level of precision and accuracy necessary for meaning-       house Gases Observing Satellite (GOSAT), where GOSAT
ful greenhouse gas observations, we performed calibration         observed three nearby specific observation points, over the
measurements for 8 d between November 2015 and March              sand desert south of the station, directly over Gobabeb and
2016 with the COCCON reference EM27/SUN spectrome-                over the gravel plains to the north. GOSAT H-gain XCO2
ter operated at the Karlsruhe Institute of Technology. We de-     and XCH4 agree with the EM27/SUN measurements within
rived scaling factors for XCO2 , XCH4 and XCO with respect        the 1σ uncertainty limit. The number of coincident sound-
to the reference instrument that are close to 1.0. We compare     ings is limited, but we confirm a bias of 1.2–2.6 ppm between
the results obtained in Gobabeb to measurements from the          GOSAT M-gain and H-gain XCO2 retrievals depending on
Total Carbon Column Observing Network (TCCON) sites at            the target point. This is in agreement with results reported by
Réunion Island and Lauder. We choose these TCCON sites            a previous study and the GOSAT validation team. We also
because, while 4000 km apart, the instruments at Gobabeb          report a bias of 5.9–9.8 ppb between GOSAT M-gain and H-

Published by Copernicus Publications on behalf of the European Geosciences Union.
5888                                                         M. M. Frey et al.: Setup of a COCCON spectrometer in Namibia

gain XCH4 measurements which is within the range given              monly validated against ground-based remote-sensing instru-
by the GOSAT validation team. Finally, we use the COC-              ments, as these measurements are not influenced by surface
CON measurements to evaluate inversion-optimized CAMS               albedo effects and only minimally affected by aerosols (Dils
model data. For XCO2 , we find high biases of 0.9 ± 0.5 ppm         et al., 2014; Wunch et al., 2017). The Total Carbon Column
for the Orbiting Carbon Observatory-2 (OCO-2) assimilated           Observing Network (TCCON) is a ground-based network
product and 1.1 ± 0.6 ppm for the in situ-driven product with       retrieving total columns of GHGs with reference precision
R 2 > 0.9 in both cases. These biases are comparable to re-         and accuracy utilizing high-resolution solar-viewing Fourier
ported offsets between the model and TCCON data. The                transform infrared (FTIR) spectrometers (Wunch et al., 2011;
OCO-2 assimilated model product is able to reproduce the            Washenfelder et al., 2006). TCCON is the reference network
drawdown of XCO2 observed by the COCCON instrument                  and primary validation source for current satellites (Inoue
at the beginning of 2017, as opposed to the in situ-optimized       et al., 2016; Wu et al., 2018; Borsdorff et al., 2018; Sha et al.,
product. Also, for XCH4 , the observed biases are in line with      2021).
prior model comparisons with TCCON.                                    Recently, in an effort to further improve the global cover-
                                                                    age of ground-based observations, the COllaborative Carbon
                                                                    Column Observing Network (COCCON) was established
                                                                    (Frey et al., 2019). This network employs compact, portable
1   Introduction                                                    FTIR spectrometers. The spectrometers used have been de-
                                                                    veloped by KIT in cooperation with Bruker (Gisi et al.,
The concentrations of the most important anthropogenic              2012; Hase et al., 2016) and have been commercially avail-
greenhouse gases (GHGs), carbon dioxide (CO2 ) and                  able since 2014 (type designation EM27/SUN spectrome-
methane (CH4 ), have risen to values unprecedented since            ter). Lately, a COCCON spectrometer was used in combi-
the beginning of high-frequency observational records               nation with two TCCON instruments to validate OCO-2 (Ja-
(Dlugokencky et al., 2019a, b). Additionally, recently              cobs et al., 2020) and study boreal forests (Tu et al., 2020),
fossil CO2 emissions exceeded 10 Gt C yr−1 for the first            and Velazco et al. (2019) performed a campaign to validate
time in history (Friedlingstein et al., 2019). Precise and          GOSAT in central Australia. Apart from these studies, un-
accurate global observations of GHGs are therefore im-              til now, the major activity of the emerging network was to
portant for the estimation of emission strengths, flux              create the capability of permanent COCCON measurements
changes (Olsen and Randerson, 2004) and model evaluation.           at remote sites as a supplement to the existing TCCON sta-
Furthermore, these measurements can be used for the                 tions. To this end, procedures for ensuring proper calibra-
verification of climate mitigation actions as demanded by           tion were developed and evidence of the long-term stability
international treaties, e.g., the Paris Agreement (COP21)           of the EM27/SUN spectrometer was provided (Frey et al.,
(https://unfccc.int/files/essential_background/convention/          2015, 2019; Sha et al., 2020). Tasks that can be accomplished
application/pdf/english_paris_agreement.pdf, last access:           by performing differential measurements using several spec-
15 October 2020).                                                   trometers which can be calibrated side by side in the frame-
   Satellites like the Greenhouse Gases Observing Satel-            work of campaigns are easier to achieve. Many successful
lite (GOSAT) (Kuze et al., 2009; Morino et al., 2011;               campaigns for quantifying GHG emission strengths from re-
Yoshida et al., 2013), Orbiting Carbon Observatory-2 (OCO-          gions of interest, like cities, coal mines, large dairy farms,
2) (Frankenberg et al., 2015; Crisp et al., 2017; Eldering          etc., by arranging several spectrometers around the source
et al., 2017), Orbiting Carbon Observatory-3 (OCO-3) (El-           have been performed successfully using EM27/SUN spec-
dering et al., 2019), Sentinel-5 Precursor (S5P) (Veefkind          trometers in the recent past (Hase et al., 2015; Vogel et al.,
et al., 2012) or Greenhouse Gases Observing Satellite-2             2019; Makarova et al., 2021; Viatte et al., 2017; Kille et al.,
(GOSAT-2) (Suto et al., 2021) are well-suited candidates for        2019; Butz et al., 2017; Luther et al., 2019). In this work, we
this task, as they retrieve total column abundances of atmo-        introduce a COCCON station in Gobabeb, Namibia, where
spheric GHGs on a global scale. However, current satellites,        measurements have been conducted since January 2015. We
while offering quasi-global spatial coverage, have coarse           demonstrate the excellent long-term stability of the COC-
temporal resolution. The OCO-2 repeat cycle is 16 d; the            CON instrument and its usefulness for satellite and model
GOSAT-2 repeat cycle is 6 d. S5P offers daily global cover-         validation studies. The remainder of this paper is structured
age of CH4 and CO; however, the measurements are mostly             as follows. In Sect. 2, we describe the measurement site, used
around local noontime. Future geostationary satellites will         instrumentation and data analysis, focusing on the COCCON
likely help to overcome this shortcoming (Moore et al., 2018;       EM27/SUN spectrometer. In Sect. 3, we present the mea-
Nivitanont et al., 2019). Due to the fact that satellites measure   surement results obtained over the last 4 years. In Sect. 4,
backscattered sunlight from the surface of the Earth and its        a comparison with respect to TCCON stations at Réunion Is-
atmosphere, retrievals of GHGs are complicated and biases           land and Lauder is conducted to illustrate the feasibility of
can easily occur, which need to be recognized and – if possi-       our results. Additionally, the COCCON instrument is used
ble – corrected. Therefore, satellite measurements are com-         to validate specific target mode observations from GOSAT,

Atmos. Meas. Tech., 14, 5887–5911, 2021                                               https://doi.org/10.5194/amt-14-5887-2021
M. M. Frey et al.: Setup of a COCCON spectrometer in Namibia                                                                    5889

confirming a previously reported bias between GOSAT M-              (the mirror substrate is aluminum, so the operation was con-
gain and H-gain soundings for XCO2 (Velazco et al., 2019)           tinued with aluminum mirrors since then). Finally, the me-
and for the first time also reporting a bias in XCH4 for the        chanical parts of the solar tracker attached to the spectrome-
different gain settings. We also compare our measurements           ter were serviced, as the very fine wind-blown dust particles
to CAMS inversion-optimized model data. In Sect. 5, we in-          tend to enter the motor stages during longer operation in the
vestigate the influence of the African biosphere on the ob-         desert.
servations performed in Gobabeb. In Sect. 6, the results are           The retrieved total column abundances of the trace gases
discussed and an outlook for further studies is given.              are converted into column-averaged dry-air mole fractions
                                                                                                                             VC
                                                                    (DMFs), where the DMF of a gas is denoted Xgas = VCgas      O2
                                                                                                                                    ×
2     Gobabeb site description, instrumentation and data            0.2095. Here, both the column amounts of the target gas and
      analysis                                                      O2 are derived from the same spectroscopic observation re-
                                                                    ducing several potential error sources (Wunch et al., 2010).
2.1    Gobabeb site description                                     Furthermore, the dependence on the ground pressure is re-
                                                                    duced, improving comparability between different sites. A
In 2015, we installed an EM27/SUN spectrometer of the               sensitive measure of the stability of a spectrometer is the
COCCON network at the Gobabeb Namib Research Institute              column-averaged amount of dry air (Xair ) because for Xair
in Namibia (23.561◦ S, 15.042◦ E; 410 m a.s.l.); see the inset      there is no compensation of possible instrumental problems,
of Fig. 1. Gobabeb is located at the center of the hyperarid        in contrast to Xgas , where errors can partially cancel out. Xair
Namib Desert. Moreover, Gobabeb is positioned next to the           compares the measured oxygen column (VCO2 ) with surface
Kuiseb River, which marks the sharp transition zone between         pressure measurements (PS ):
the gravel plains to the north and the sand desert to the south
of the station; see Fig. 1. Gobabeb is situated 60 km east                   g      VCO2 · µ
                                                                    Xair =      ·             + VCH2 O · µH2 O .                   (1)
of the Atlantic Ocean and the site is approximately 80 km                   PS       0.2095
southeast of the closest town, Walvis Bay, with a popula-
tion of about 50 000. The site is uninfluenced by nearby lo-        Here, µ and µH2 O denote the molecular masses of dry air and
cal emission sources of GHGs. Southwesterly winds prevail           water vapor, respectively, g is the column-averaged gravita-
during austral summer, whereas in winter easterly winds are         tional acceleration, and VCH2 O is the total column of water
predominant. The maximum temperature in summer can ex-              vapor. The correction with VCH2 O is necessary as the surface
ceed 40 ◦ C. Gobabeb is a high-albedo station, with a surface       pressure instruments measure the pressure of the total air col-
albedo derived from GOSAT retrievals at 1.6 µm of 0.4 for           umn, including water vapor. Sudden changes in Xair indicate
the sand desert and 0.45 for the gravel plains. Together with       instrumental problems, e.g., errors with the surface pressure,
the changing terrain, this results in unique site characteristics   pointing errors, timing errors or changes in the optical align-
desirable especially for satellite validation studies. In Fig. 2,   ment of the instrument.
we show the COCCON Gobabeb station in a broader context                Frey et al. (2019) present a comprehensive characteriza-
on a global map together with the TCCON Réunion Island              tion for EM27/SUN spectrometers used by the COCCON
and Lauder stations used in this study.                             network, which included the instrument with serial num-
                                                                    ber 51 deployed in Gobabeb. In short, the instrumental line
2.2    Description and history of the COCCON                        shape (ILS) of the EM27/SUN was optimized and charac-
       spectrometer operated at Gobabeb                             terized using open-path measurements as described in Frey
                                                                    et al. (2015), using version 14.5 of the LINEFIT retrieval
The EM27/SUN spectrometer as used by COCCON has                     software (Hase et al., 1999). Other detrimental effects, for
been described in great detail in the works of Gisi et al.          example, double-passing or channeling, were corrected if
(2012), Frey et al. (2015) and Hase et al. (2016). As a             found. For more details, see Sect. 4.2 of Frey (2018). After
concise summary, the EM27/SUN is a solar-viewing FTIR               this initial check in December 2014, side-by-side measure-
spectrometer measuring in the near-infrared spectral range          ments with the reference EM27/SUN and the nearby TC-
(5500–11 000 cm−1 ) with a spectral resolution of 0.5 cm−1 .        CON instrument were performed on the observation plat-
One measurement takes 58 s and consists of 10 individual            form of the Institute for Meteorology and Climate Research
double-sided scans. This allows the retrieval of total column       (IMK-ASF) at the Karlsruhe Institute of Technology (KIT),
abundances, VCgas , of the target gases O2 , CO2 , CH4 and          Campus North (CN) near Karlsruhe (49.100◦ N, 8.439◦ E;
H2 O. In 2018, the spectrometer used in this study was up-          133 m a.s.l.). These measurements took place from Novem-
graded in Karlsruhe and a second, extended room temper-             ber 2015 to March 2016 and once more in 2018 and 2019 in
ature (RT) indium, gallium and arsenide (InGaAs) detector           order to trace the results to TCCON (and thereby the WMO
(4000–5500 cm−1 ) was added, allowing the detection of CO.          scale). This rigorous calibration routine is necessary in or-
During this service at KIT, the gold coating of the tracker         der to fulfill the high precision and accuracy requirements
mirrors was found to be degraded and therefore was removed          for GHG measurements. After the initial alignment check,

https://doi.org/10.5194/amt-14-5887-2021                                              Atmos. Meas. Tech., 14, 5887–5911, 2021
5890                                                         M. M. Frey et al.: Setup of a COCCON spectrometer in Namibia

Figure 1. © Google Earth image (map data: Google, Maxar technologies) of the measurement site at Gobabeb, Namibia. The blue pin
denotes the position of the COCCON instrument. The yellow points show the positions of the GOSAT target observation points. A black
circle with a radius of 10 km has been drawn around the COCCON site for visual reference. The inset in the upper right corner shows the
EM27/SUN spectrometer at Gobabeb.

                                                                      and a fast Fourier transformation including a phase correc-
                                                                      tion routine and resampling scheme is implemented. Several
                                                                      quality filters are applied, for example, requiring a minimum
                                                                      DC level of 5 % of the maximum detector signal level, re-
                                                                      stricting the tolerable DC variation to 10 % of the measured
                                                                      level, checking the centerburst location in the IFG and the
                                                                      centerburst amplitudes of forward and backward scans and
                                                                      the relative amplitude of out-of-band artifacts. All quality fil-
                                                                      ters are summarized in Table 1.
                                                                         For the retrieval of the EM27/SUN spectra, we do not use
                                                                      the PROFFIT 9.6 retrieval algorithm (Schneider and Hase,
Figure 2. Global map showing the COCCON Gobabeb, TCCON                2009; Kiel et al., 2016; Chen et al., 2016). Here, we use
Réunion Island and Lauder sites used in this study.                   the recently developed non-linear least-squares PROFFAST
                                                                      retrieval algorithm, which fits atmospheric spectra by scal-
                                                                      ing a priori trace gas profiles. PROFFAST is a source-open
no realignment was performed during the whole observation             code for quantitative trace gas analysis, mainly intended
period.                                                               for the use with low-resolution FTIR spectrometers. Par-
   The data analysis is performed differently from Frey               ticular attention has been paid to achieve high processing
et al. (2019). Spectra are generated from the raw interfero-          speed without compromising the high level of accuracy re-
grams (IFGs) using a FORTRAN 2003 preprocessing tool                  quired in the analysis of column-averaged greenhouse gas
developed in the framework of the COCCON-PROCEEDS                     abundances. For achieving this goal, several measures are
project and extensions (http://www.imk-asf.kit.edu/english/           taken: (1) PROFFAST uses daily precalculated and tabulated
COCCON.php, last access: 30 July 2021) of the European                molecular cross sections derived from line-by-line calcula-
Space Agency (ESA). The IFGs are read from the OPUS file,             tions. (2) Instead of storing the cross sections per discrete
the solar position is calculated, a correction for direct cur-        layers, the cross sections are expanded as function of solar
rent (DC) fluctuations following Keppel-Aleks et al. (2007)           zenith angle (SZA), which allows downsizing of the lookup
is performed, the IFGs are truncated to the nominal resolu-           tables by a factor of about 5 and accelerating the subsequent
tion of 0.5 cm−1 , a numerical apodization function is applied,       calculation of atmospheric spectral transmission as a func-

Atmos. Meas. Tech., 14, 5887–5911, 2021                                                https://doi.org/10.5194/amt-14-5887-2021
M. M. Frey et al.: Setup of a COCCON spectrometer in Namibia                                                                      5891

Table 1. This table summarizes the quality filters applied in the FORTRAN-based preprocessing tool.

                  Q1     Check of DC level as fraction of analogue–digital converter range, require 0.05
                  Q2     Check maximum variability of DC level (max. 10 % relative variation in interferogram resulting
                         from 10 co-added scans)
                  Q3     Check forward/backward centerburst amplitudes (should agree within 5 %)
                  Q4     Check centerburst location in interferogram record
                  Q5     Check relative amplitude of out-of-band artifacts
                  Q6     Check slope, curvature and change of curvature of phase spectrum
                  Q7     Check spectral calibration based on cross correlation of spectral structure w.r.t. a wavenumber-
                         calibrated reference spectrum
                  Q8     Compare spectra derived from forward and backward scans

tion of SZA. (3) The process of convolution of the monochro-            data products analyzed with PROFFAST and official TC-
matic spectrum with the instrumental line shape (ILS) is for-           CON data products from Karlsruhe (2014–ongoing) and So-
mulated as a two-step procedure; the first step thins the spec-         dankylä (2017–2019). In the future, it is planned to incor-
tral grid before the convolution is performed. (4) The state            porate comparisons from additional stations to improve the
vector of the previous solution is maintained for fitting the           basis of the bias correction. For Xair , a scaling factor of
next spectrum, as typically the atmospheric variations from             0.9737 is derived from the long-term observations performed
spectrum to spectrum are rather small. This strategy allows             in Karlsruhe and Sodankylä centering the Xair data around 1.
reducing the number of required iterations to typically two.
(5) PROFFAST provides averaging kernels not for each mea-               2.3   TCCON Réunion Island and Lauder
surement but as function of a set of SZA values for each
measurement day. Evaluation of data quality achieved with a             Measurement procedures and data analysis at both sites
COCCON spectrometer operated in Finland using the PROF-                 follow TCCON protocol (Wunch et al., 2011) using the
FAST data analysis chain has been investigated in the frame-            GGG2014 software package (Wunch et al., 2015). As re-
work of ESA’s FRM4GHG project and results are reported                  quired by TCCON, the instrumentation consists of a high-
by Sha et al. (2020). The analysis of 4 years of Gobabeb                resolution FTIR spectrometer, model BRUKER IFS 125HR,
data consisting of around 120 000 spectra took about 40 h,              which is routinely operated at a spectral resolution of
which is approximately 30 times faster than the previously              0.02 cm−1 . The instrument is housed inside a temperature-
used PROFFIT 9.6 retrieval algorithm. In order to be con-               controlled building. The TCCON station in Réunion Island,
sistent with TCCON, the GGG2014-generated a priori files                France (20.901◦ S, 55.485◦ E; 87 m a.s.l.) is located on the
(Wunch et al., 2015) are used for trace gases as well as for            university campus of the Université de La Réunion in St.
temperature and pressure. The ground pressure was recorded              Denis, approximately 2000 km east of the African main-
using a MHB-382SD data logger with a pressure accuracy of               land. The data are available via De Mazière et al. (2017).
3 hPa (> 1000 hPa) or 2 hPa (< 1000 hPa) and a precision of             The TCCON station in Lauder, New Zealand (45.038◦ S,
0.07 hPa. In order to increase the level of accuracy, we cali-          169.684◦ E; 370 m a.s.l.), is situated in a sparsely populated
brate our sensor against a co-located CS 100 pressure sensor            environment on the South Island of New Zealand (Pollard
from the Southern African Science Service Centre for Cli-               et al., 2017). The data are available via Sherlock et al. (2014)
mate Change and Adaptive Land Management (SASSCAL)                      and Pollard et al. (2019). In October 2018, a new TCCON
network with a long-term stability better than 0.1 hPa yr−1             instrument was installed at Lauder (Pollard et al., 2021). For
and a stated accuracy of 0.5 hPa at 20 ◦ C and 1.0 hPa for tem-         this study, we combine the datasets of both spectrometers,
peratures between 0 and 40 ◦ C. We do not directly use the              and for the overlap period (October 2018), we use the data
data from the CS 100 pressure sensor for our analysis as only           from the old TCCON instrument.
hourly data are available (http://www.sasscalweathernet.org/
weatherstat_infosheet_we.php?loggerid_crit=8893, last ac-               2.4   GOSAT specific target observations
cess: 7 May 2021).
   We use the spectroscopic line lists and retrieval windows            A detailed description of the GOSAT instrumental features
as described in Frey et al. (2019). The resulting XCO2                  and data analysis is given in Kuze et al. (2009) and Yoshida
and XCH4 products are bias-corrected with respect to TC-                et al. (2013). GOSAT detects shortwave-infrared radiation
CON based on long-term comparisons between COCCON                       in three narrow bands (0.76, 1.6 and 2.0 µm) with a reso-

https://doi.org/10.5194/amt-14-5887-2021                                                   Atmos. Meas. Tech., 14, 5887–5911, 2021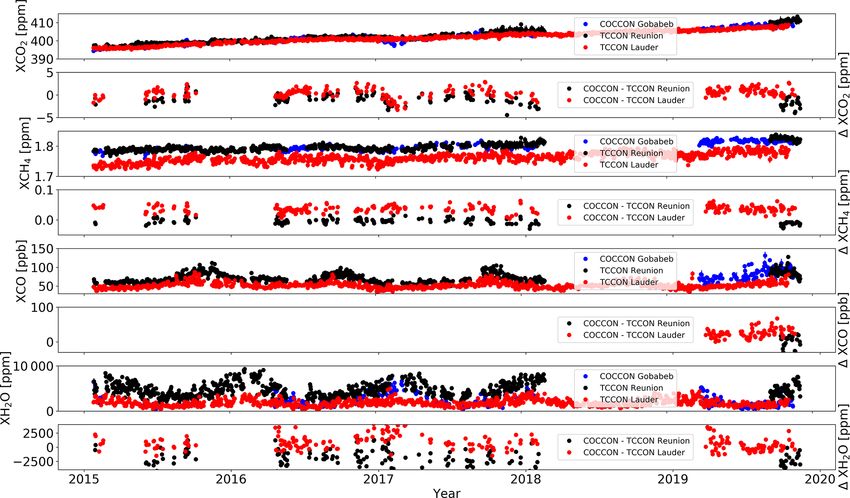
5892                                                       M. M. Frey et al.: Setup of a COCCON spectrometer in Namibia

lution of 0.2 cm−1 . Additionally, it is equipped with a sen-
sor measuring in the thermal infrared range. The Thermal
And Near infrared Sensor for carbon Observation Fourier
transform spectrometer (TANSO-FTS) footprint diameter is
about 10.5 km at sea level. The nominal single-scan acquisi-
tion time is 4 s. For this study, the GOSAT FTS shortwave
infrared (SWIR) level 2 data version V02.81 from NIES is
used. The satellite is flying at an altitude of 666 km with
a repeat cycle of 3 d. From May 2016, GOSAT performed
specific target mode observations over Gobabeb by perform-
ing observations at three distinct points (Fig. 1), directly at
the Gobabeb COCCON site, approximately 10 km northeast
over the gravel plains and around 10 km southwest over the
sand desert. These points were chosen because of their dif-
ferent surface reflectance in order to study the sensitivity of   Figure 3. Time series of the modulation efficiency at MOPD of the
the GOSAT retrieval with respect to the surface albedo. The       EM27/SUN used in this study. ILS measurements were performed
                                                                  during periods when the instrument was in Karlsruhe for mainte-
satellite performed measurements with different gain set-
                                                                  nance or detector upgrade. Yellow areas denote measurement pe-
tings: M gain and H gain. M-gain soundings are generally
                                                                  riods in Gobabeb. The black bar denotes the time of the detector
performed over surfaces that are bright in the near infrared.     upgrade.
For M-gain observations, other validation sites with ground-
based FTIR measurements are sparse. Yoshida et al. (2013)
found no suitable TCCON site for the validation of GOSAT          3     Measurement results
M-gain observations. In recent years, GOSAT M-gain sound-
ings are mainly compared to the Edwards TCCON station,            3.1    Side-by-side measurements at Karlsruhe
which was established 2013. More recently, Velazco et al.
(2019) performed a campaign to validate GOSAT in central          ILS measurements were carried out seven times since De-
Australia using an EM27/SUN.                                      cember 2014. This is depicted in Fig. 3. The modulation ef-
                                                                  ficiency (ME) at maximum optical path difference (MOPD)
2.5    CAMS global CO2 and CH4 atmospheric inversion              ranges between 0.979 and 0.986 with a mean value of 0.983
       products                                                   and a standard deviation of 0.002. The mean phase error is
                                                                  0.0019 ± 0.0003. No drift is apparent and the ILS is stable.
The CAMS model has been described previously in great             The spread in the ME is in good agreement with the error
detail, e.g., Agustí-Panareda et al. (2014), Massart et al.       budget of 0.003 given in Frey et al. (2019). This high in-
(2016) and Inness et al. (2019). Here, we utilize the CAMS        strumental stability is remarkable considering that between
global inversion-optimized column-averaged DMFs for CO2           measurements the EM27/SUN was shipped from Karlsruhe
and CH4 . For CO2 , we use an inversion product (FT19r1)          to Gobabeb, including airlift and transport by car on bumpy
(Chevallier, 2020a) assimilating OCO-2 satellite observa-         gravel roads.
tions (O’Dell et al., 2018; Kiel et al., 2019) as well as an         Between November 2015 and March 2016, side-by-side
in situ-driven inversion product (v18r3) (Chevallier, 2019).      comparison measurements with the reference EM27/SUN
More details can be found in Chevallier et al. (2019) and         were conducted on 8 d to derive calibration factors for the
Chevallier (2020b). For CH4 , an inversion product v18r1s         different trace gases for this spectrometer and thereby remov-
assimilating a combination of surface and GOSAT satellite         ing possible instrument-dependent biases. Some data had to
observations (Detmers and Hasekamp, 2016) as well as one          be filtered out for different reasons. Because most measure-
product v18r1s using only surface observations are analyzed       ments were performed during winter, the solar elevation was
(Segers and Houweling, 2020a). A description of the inver-        low, which sometimes led to a partially obstructed view due
sion procedure together with comparisons against indepen-         to railings and a metal frame on the terrace where the obser-
dent observational datasets is given in Segers and Houweling      vations took place. In the morning, the first measurements
(2020b).                                                          were omitted due to unusually high scatter caused by the
                                                                  quickly changing temperature of the helium–neon (HeNe)
                                                                  laser, which is not frequency stabilized as already reported
                                                                  by Gisi et al. (2012). In rare cases, the tracking software
                                                                  failed, resulting in corrupted spectra that were also filtered
                                                                  out. For this analysis, only observations from the two instru-
                                                                  ments performed within 1 min and SZAs below 85◦ are taken
                                                                  into account, resulting in 1209 coincident measurements.

Atmos. Meas. Tech., 14, 5887–5911, 2021                                            https://doi.org/10.5194/amt-14-5887-2021
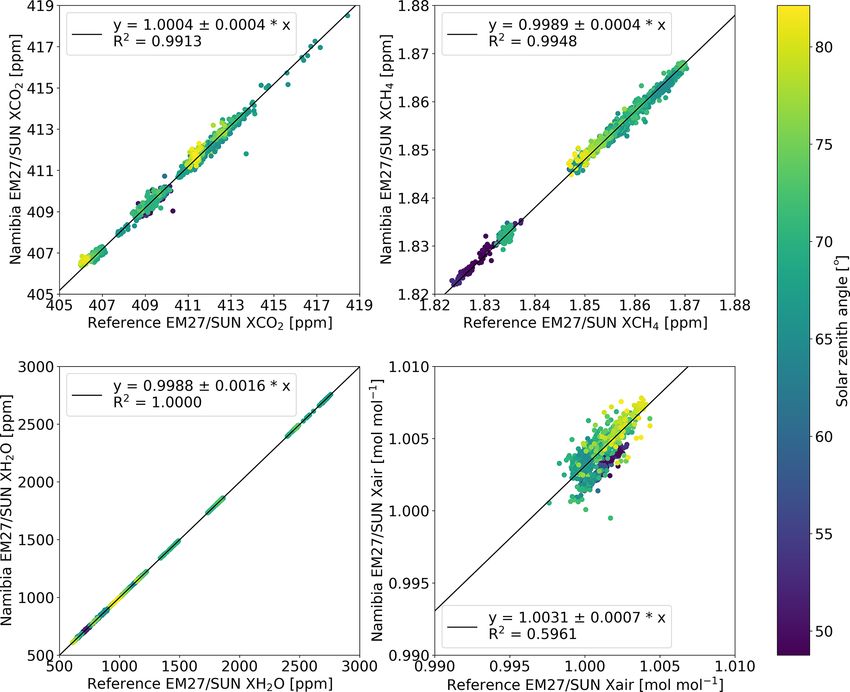
M. M. Frey et al.: Setup of a COCCON spectrometer in Namibia                                                                            5893

Figure 4. Side-by-side measurements between the reference EM27/SUN and the instrument deployed in Namibia performed between
November 2015 and March 2016 in Karlsruhe. From left to right, the panels show correlation plots for XCO2 (a), XCH4 (b), XH2 O (c)
and Xair (d). The coincident criterion is that measurements for both instruments occurred within 1 min. The color bar denotes the solar zenith
angle. For the analysis, only measurements with zenith angles below 85◦ are considered.

The results are shown in Fig. 4. The derived instrument-                 data, we will only use the mean calibration factors derived
specific calibration factors are 1.0002 ± 0.0003 for XCO2 ,              from these observation periods.
1.0005 ± 0.0004 for XCH4 , 1.0011 ± 0.0029 for XH2 O and                    In order to investigate if the difference in the calibration
0.9995 ± 0.0005 Xair between the reference instrument and                factors is linked to the upgrade of the EM27/SUN in 2018,
the instrument deployed in Namibia. Although the scaling                 we average the ME at MOPD obtained from the ILS mea-
factors are close to nominal for all species, to avoid biases            surements before (0.982) and after (0.985) the upgrade. The
due to instrumental differences, these calibration factors are           ME increased by 0.3 %, which is within the uncertainty bud-
taken into account in the analysis of the Namibia dataset.               get of 0.3 % using this method. Therefore, we conclude that
   Additional side-by-side measurements were performed in                the changes in the instrumental line shape due to the upgrade
February and March 2018 after the instrument came back                   of the COCCON instrument might contribute to the slightly
from Namibia as well as between November 2018 and Febru-                 different scaling factors, but they are not the main reason for
ary 2019 after the dual-channel upgrade and mirror ex-                   the changes.
change. The combined results are shown in Appendix A. A
slight variation in the calibration factors is detectable; for           3.2    Gobabeb Xgas time series
XCH4 and Xair , the change is significant at the 1σ level. The
numeric values for the scaling factors are 1.0004 ± 0.0004               For the subsequent analysis, only observations with SZAs not
for XCO2 , 0.9989 ± 0.0004 for XCH4 , 0.9988 ± 0.0016 for                exceeding 80◦ are taken into account, resulting in 113 049 in-
XH2 O and 1.0031 ± 0.0007 for Xair . For the period between              dividual measurements on 319 d between 2015 and 2019. In
November 2018 and February 2019, we also derive a calibra-               Fig. 5, we present the XCO2 , XCH4 , XCO, XH2 O and Xair
tion factor of 0.9940 ± 0.0050 for XCO. As the bias between              retrieval results from the COCCON Gobabeb observations.
the calibration factors obtained during the two side-by-side             For better visibility, daily mean values are shown. Error bars
measurement periods is within 0.1 ppm for XCO2 , 3 ppb for               denote the 1σ standard deviation of the daily mean values.
XCH4 and 3 ppm for XH2 O, for the analysis of the Namibia                Between February and May 2015, no measurements could

https://doi.org/10.5194/amt-14-5887-2021                                                     Atmos. Meas. Tech., 14, 5887–5911, 2021

5894                                                        M. M. Frey et al.: Setup of a COCCON spectrometer in Namibia

be performed due to software problems. In October 2015, the        and Lauder. Although this is not a side-by-side comparison,
spectrometer was shipped back to Karlsruhe due to customs          Réunion Island as the second closest TCCON station is ap-
requirements. Observations in Gobabeb were continued from          proximately 4000 km east of Gobabeb; this comparison will
April 2016. In February 2018, the spectrometer was shipped         give us a measure of the feasibility of our results. The ob-
to Karlsruhe for the dual-channel upgrade. COCCON mea-             servations should be comparable qualitatively as the varia-
surements were restarted in March 2019.                            tion of XCO2 is relatively low in the Southern Hemisphere
   For XCO2 , the underlying trend of about 2 ppm yr−1 can         compared to the Northern Hemisphere (Olsen and Rander-
be seen. Correspondingly, a daily minimum value was ob-            son, 2004). Moreover, Gobabeb (24◦ S) and Réunion Island
served at the beginning of the measurements on 24 January          (21◦ S) are at roughly the same latitude. The TCCON As-
2015 with 394.3 ± 0.2 ppm and the maximum daily value              cension Island station is slightly closer to Gobabeb with a
was observed on 15 October 2019 (410.6 ± 0.2 ppm). A sea-          distance of approximately 3600 km, but the latitudinal dif-
sonal cycle is also detectable, with a peak-to-peak amplitude      ference is larger. Due to the latitudinal gradient in XCH4 ,
of 5.3 ppm in 2017. Here, it is calculated as the difference       we chose to compare our COCCON measurements to Réu-
between the maximum monthly mean of 404.0 ± 1.1 ppm in             nion Island rather than Ascension Island. Lauder is the south-
September and the minimum monthly mean of 398.0 ± 0.5              ernmost TCCON station and functions as a background site
in March. This amplitude is higher than observed in other          without a pronounced XCO2 seasonal cycle.
Southern Hemisphere TCCON stations in Australia and New               Daily mean XCO2 , XCH4 , XCO and XH2 O results are
Zealand (Deutscher et al., 2014), owing to a rather sharp          shown in Fig. 6 from COCCON Gobabeb (blue dots), TC-
drawdown of XCO2 in February and March 2017. How-                  CON Réunion Island (black dots) and TCCON Lauder (red
ever, this is probably a real signal as the impact of the          dots) stations. Error bars denote the 1σ standard deviation of
biosphere in Africa might lead to a larger seasonal cycle          the daily mean values. Difference time series between the sta-
in Gobabeb. Also Olsen and Randerson predict a rather              tions are shown in separate panels. For XCO2 , we see a good
prominent XCO2 seasonal cycle on the order of 5 ppm in             agreement between the sites, given the fact that they are spa-
southern Africa; see Fig. 5 of Olsen and Randerson (2004).         tially far apart. The annual increase of XCO2 is similar for
For XCH4 , daily mean values range between 1759 ± 1 ppb            all stations. For Réunion Island and Lauder, no pronounced
(2 June 2015) and 1828 ± 1 ppb (25 June 2019). The trend is        seasonal cycle is visible. The most prominent difference is
roughly 0.01 ppm yr−1 . The XCH4 seasonal cycle has low-           the sharp decrease of XCO2 at Gobabeb beginning of 2017,
est values in southern hemispheric summer (January 2017:           most pronounced in March. This is not seen for the TCCON
1783 ± 5 ppb) and highest values throughout winter and             data at the two other sites. There is no conspicuous change
early spring (September 2017: 1808 ± 5 ppb) resulting in a         in Xair during this period for the COCCON instrument, and
peak-to-peak amplitude of 25 ppb. Regarding XCO, the time          the other gases do not deviate. We therefore do not think that
series is limited to 2019 due to the fact that the dual-channel    instrumental issues are the cause of the difference. As dis-
upgrade was only performed in 2018. At this point, it can al-      cussed in the previous section, this difference is probably due
ready be seen that this site observes highly variable amounts      to the impact of the African biosphere on the measurements
of carbon monoxide, ranging from very clean background             in Gobabeb. To a smaller extent, this difference can also be
conditions with daily mean XCO values as low as 49 ± 1 ppb         seen at the beginning of 2018. Despite the similarities, it can
(16 April 2019) to elevated results of up to 131 ± 9 ppb           also be seen that the Réunion Island values at the beginning
(4 September 2019). XH2 O is very low during large parts of        of 2018 and then at the end of 2019 somewhat diverge from
the year, as expected for a desert site. The lowest value was      the Gobabeb and Lauder values. XCH4 at the Gobabeb and
reached on 29 June 2015 (357 ± 10 ppm). During late south-         Réunion Island sites is similar, with lower absolute values
ern hemispheric summer and early spring, XH2 O can reach           at Lauder. The annual increase and the seasonal variability
up to several thousand ppm. As mentioned in Sect. 2.2, Xair        are similar at all sites. Unlike XCO2 , there is no conspicu-
is an important parameter to monitor the instrumental sta-         ous difference between the datasets at the beginning of 2017.
bility. For the whole time series, daily Xair results are stable   For XCO, the sites do not have a long observation overlap; it
within 1 %. No apparent drift of Xair is visible during the four   seems that the variability is slightly larger in the COCCON
years of measurements performed at the COCCON Gobabeb              data. Regarding XH2 O, the seasonality is similar between the
station.                                                           sites, with highest values at Réunion Island throughout the
                                                                   year.
                                                                      In a next step, we show correlation plots for the COC-
4     Gobabeb data comparisons                                     CON site with respect to the TCCON sites for XCO2 and
                                                                   XCH4 in Figs. 7 and 8. Error bars denote the 1σ standard
4.1    TCCON Réunion Island and Lauder                             deviation (SD) of the daily mean values. The color bar de-
                                                                   notes the measurement date. Focusing first on the compar-
In this section, we compare the results obtained in Goba-          ison between Gobabeb and Réunion Island in Fig. 7, we
beb with results from the TCCON stations at Réunion Island         find an agreement within 1 standard deviation of the aver-

Atmos. Meas. Tech., 14, 5887–5911, 2021                                             https://doi.org/10.5194/amt-14-5887-2021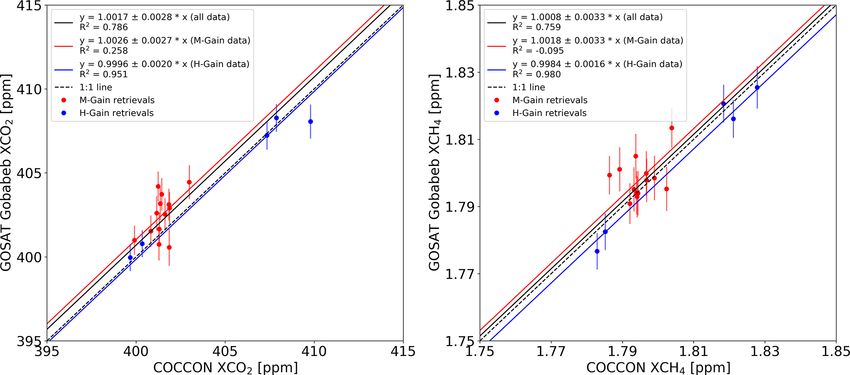
M. M. Frey et al.: Setup of a COCCON spectrometer in Namibia                                                                         5895

Figure 5. Column-averaged dry-air mole fraction time series for XCO2 , XCH4 , XCO, XH2 O and Xair measured at the COCCON site in
Gobabeb, Namibia, from January 2015 until November 2019. Daily mean values are shown for better visibility. Error bars denote the 1σ
standard deviation of the daily mean values. In 2018, the instrument was upgraded with a second channel. Therefore, XCO observations only
started in 2019.

aged daily mean values for both gases. For XCO2 , a scal-              Table 2. This table presents the results of the comparison be-
ing factor of 1.0027 ± 0.0028 and a correlation coefficient            tween the COCCON station in Gobabeb and the TCCON stations
R 2 of 0.911 are derived. For XCH4 , the scaling factor is             in Lauder and Réunion Island. Difference and SD are given as the
1.0028 ± 0.0045 and R 2 of 0.670. Bias and SD in absolute              mean difference and 1 standard deviation between the coincident
values are given in Table 2. Despite this good agreement, es-          daily TCCON and COCCON XCO2 and XCH4 values.
pecially for XCO2 , there is some divergence between the data
                                                                        Station          XCO2 difference   XCH4 difference     Number of
before and after 2018, corresponding to larger scatter in the                               ± SD (ppm)        ± SD (ppb)     coincidences
TCCON Réunion Island dataset, as can be seen by the larger
                                                                        Réunion Island         1.1 ± 1.1         5.1 ± 8.1           155
error bars for the 2018 and 2019 data. For 2018, the reason             Lauder                −0.4 ± 1.1      −35.9 ± 10.6           241
for the increased scatter was continued mirror degradation as
a result of sea salt deposition from the ocean. In Fig. 8, we
see an excellent agreement between the COCCON Gobabeb
and TCCON Lauder data for XCO2 with a scaling factor of
                                                                       tinct points with different surface albedo properties against
0.9990 ± 0.0027 and a correlation coefficient R 2 of 0.906.
                                                                       COCCON Gobabeb observations. Target mode measure-
The only discernible anomaly are the lower COCCON val-
                                                                       ments started in 2016 and are ongoing. The time series of
ues beginning of 2017, which is also seen in the time series in
                                                                       the GOSAT observations is shown in Fig. 9. Measurements
Fig. 6. Otherwise, no temporal drift between the two datasets
                                                                       over the gravel plains are displayed in red, observations di-
is apparent. For XCH4 , a scaling factor of 0.9800 ± 0.0060
                                                                       rectly at Gobabeb are in black, and measurements over the
with R 2 = 0.556 is found. The large bias is to be expected
                                                                       sand desert are presented in gold, with 59, 78 and 85 success-
due to the latitudinal gradient in atmospheric methane con-
                                                                       ful observations, respectively. In general, the agreement be-
centrations (Saeki et al., 2013).
                                                                       tween GOSAT observations and COCCON measurements is
                                                                       reasonable, GOSAT data seem to be slightly biased high both
4.2   GOSAT validation                                                 in XCO2 and XCH4 . An interesting anomaly is observed in
                                                                       the GOSAT data, there seems to be a small decrease both in
In this section, we validate specific target mode observa-             XCO2 and XCH4 during southern hemispheric winter, which
tions from the GOSAT satellite around Gobabeb at three dis-            is not observed by the COCCON instrument. However, for a

https://doi.org/10.5194/amt-14-5887-2021                                                  Atmos. Meas. Tech., 14, 5887–5911, 2021
5896                                                         M. M. Frey et al.: Setup of a COCCON spectrometer in Namibia

Figure 6. Column-averaged dry-air mole fraction daily mean time series for XCO2 , XCH4 , XCO and XH2 O measured at the COCCON
site in Gobabeb, Namibia (blue dots), and at the TCCON sites Réunion Island (black dots) and Lauder (red dots). Error bars denote the 1σ
standard deviation of the daily mean values. Additionally, the difference XCO2 , XCH4 , XCO and XH2 O time series between Gobabeb and
Réunion Island (black dots) and between Gobabeb and Lauder (red dots) are shown in separate panels.

Figure 7. Correlation plots between the COCCON Gobabeb and TCCON Réunion Island stations for XCO2 and XCH4 from 2015 to 2019.
Shown are daily mean values; error bars denote the 1σ standard deviation. The color bar denotes the date of the measurement.

rigorous assessment, the data are too sparse. An additional              For a quantitative analysis, we analyze coincident observa-
difference is that the drawdown of XCO2 values at the begin-          tions between GOSAT and COCCON. To make the datasets
ning of 2017 is more pronounced for COCCON compared to                comparable, we correct for the influence of the different a pri-
the satellite data.                                                   ori profiles following Rodgers and Connor (2003). We adjust
                                                                      the GOSAT values to the ensemble profile, which we assume

Atmos. Meas. Tech., 14, 5887–5911, 2021                                                 https://doi.org/10.5194/amt-14-5887-2021
M. M. Frey et al.: Setup of a COCCON spectrometer in Namibia 5897 Figure 8. Correlation plots between the COCCON Gobabeb and TCCON Lauder stations for XCO2 and XCH4 from 2015 to 2019. Shown are daily mean values; error bars denote the 1σ standard deviation. The color bar denotes the date of the measurement. Figure 9. Column-averaged dry-air mole fraction daily mean time series for XCO2 and XCH4 measured at the COCCON site in Gobabeb (blue dots) and GOSAT observations from the three specific target observation points with different surface albedos close to Gobabeb are shown (red dots: gravel plains, black dots: COCCON site, golden dots: sand desert). Error bars denote the 1σ standard deviation of the daily mean values for COCCON measurements and the measurement error for the GOSAT soundings. to be the GGG2014-generated a priori profile. In Fig. 10, we and 50◦ . Due to the similarities of the averaging kernels, we present the XCO2 and XCH4 COCCON and GOSAT averag- neglect the smoothing error in the following analysis. ing kernels for different SZAs. Although the COCCON av- The number of coincident measurements with COCCON eraging kernels are shown for SZAs in the range of 0 and observations is 13, 18 and 20 for the three specific obser- 85◦ , for all coincident overpasses, the SZA was between 10 vation points and the chosen coincidence criterion is that https://doi.org/10.5194/amt-14-5887-2021 Atmos. Meas. Tech., 14, 5887–5911, 2021
5898                                                          M. M. Frey et al.: Setup of a COCCON spectrometer in Namibia

Figure 10. XCO2 and XCH4 column-averaging kernels for the COCCON Gobabeb and GOSAT observations. The color bar denotes the SZA.
For the COCCON instrument, SZAs from 0 to 85◦ are depicted, whereas for GOSAT only the averaging kernels for the actual measurements
are shown, with SZAs approximately between 10 and 50◦ .

Figure 11. Correlation plots between coincident COCCON Gobabeb observations and GOSAT measurements over the gravel plains between
2016 and 2019. For this area, GOSAT only performed M-gain soundings (red dots). The solid red line is the best-fit line through all M-gain
data points. The dotted black line is the 1 : 1 line. Error bars denote the 1σ standard deviation of the hourly mean values for COCCON
measurements and the measurement error for the GOSAT soundings.

Atmos. Meas. Tech., 14, 5887–5911, 2021                                                  https://doi.org/10.5194/amt-14-5887-2021
M. M. Frey et al.: Setup of a COCCON spectrometer in Namibia                                                                                   5899

Figure 12. Correlation plots between coincident COCCON Gobabeb observations and GOSAT measurements over the COCCON site be-
tween 2016 and 2019. For this area, GOSAT performed M-gain (red dots) and H-gain (blue dots) soundings. The solid red line is the best-fit
line through all M-gain data points, the solid blue line is the best-fit line through all H-gain data points and the solid black line is the best-fit
line through all data points. The dotted black line is the 1 : 1 line. Error bars denote the 1σ standard deviation of the hourly mean values for
COCCON measurements and the measurement error for the GOSAT soundings.

Figure 13. Same as Fig. 12, with GOSAT observations over the sand desert.

COCCON observations were performed within 30 min of                             For the GOSAT observations over the gravel plains, only
the satellite overpass. Of these coincident measurements, the                GOSAT M-gain soundings were performed. The spread of
vast majority occurred in 2016. The correlation graphs for                   the dataset is relatively large, GOSAT is biased high and
these three target points are presented in Figs. 11, 12 and 13.              we derive a scaling factor with respect to the COCCON
GOSAT M-gain observations are color coded in red, while H-                   observations of 1.0062 ± 0.0026 and 1.0044 ± 0.0039 for
gain observations are shown in blue. Error bars denote the 1σ                XCO2 and XCH4 , where the difference is statistically sig-
standard deviation of the hourly mean values for COCCON                      nificant at the 1σ level. This corresponds to a high bias of
measurements and the measurement error for the GOSAT                         2.5 ± 1.1 ppm for XCO2 and 7.9 ± 7.1 ppb for XCH4 . In Ta-
soundings.                                                                   ble 3, the absolute values of the GOSAT – COCCON com-
                                                                             parison are summarized. Directly over Gobabeb, GOSAT M-

https://doi.org/10.5194/amt-14-5887-2021                                                         Atmos. Meas. Tech., 14, 5887–5911, 2021
5900 M. M. Frey et al.: Setup of a COCCON spectrometer in Namibia
Table 3. This table presents the results of the comparison between Table 4. This table presents the results of the comparison between
the COCCON station in Namibia and the GOSAT M-gain and H- the COCCON station in Namibia and the assimilated CAMS model
gain specific target observations. Bias and SD are given as the mean data. Bias and SD are given as the mean difference and 1 standard
difference and 1 standard deviation between the coincident GOSAT deviation between the coincident hourly pooled local noon COC-
and COCCON observations. CON and CAMS XCO2 and XCH4 values.
GOSAT target M-gain XCO2 M-gain XCH4 Number of Assimilation data XCO2 bias XCH4 bias Number of
point bias ± SD bias ± SD coincidences ± SD (ppm) ± SD (ppb) coincidences
(ppm) (ppb)
OCO-2 data 0.9 ± 0.5 – 263
Gravel plains 2.5 ± 1.1 7.9 ± 7.1 13 In situ data 1.1 ± 0.6 – 187
Gobabeb 1.0 ± 1.1 3.1 ± 6.0 13 In situ and GOSAT data – −2.4 ± 8.0 187
Sand desert 2.7 ± 1.1 12.5 ± 8.1 12 In situ data – −5.8 ± 4.8 187
GOSAT target H-gain XCO2 H-gain XCH4 Number of
point bias ± SD bias ± SD coincidences
(ppm) (ppb)
XCO2 , note that the OCO-2 assimilated data are available
Gravel plains – – 0 until 2019 and the in situ assimilated data are available un-
Gobabeb −0.2 ± 0.8 −2.8 ± 2.9 5 til 2018. For XCH4 , both CAMS datasets are available until
Sand desert 0.1 ± 0.3 2.7 ± 5.1 8 2018.
As was shown in Sect. 4.1, the COCCON measurements
exhibit a small but discernible parabola shape during the
gain as well as H-gain soundings were performed. Between day. For better comparability, we therefore only compare
COCCON and GOSAT M-gain data, we derive a scaling COCCON measurements around local noon with the CAMS
factor of 1.0026 ± 0.0027 for XCO2 and 1.0018 ± 0.0033 model data. Although using all COCCON data results in only
for XCH4 , corresponding to a high bias of 1.0 ± 1.1 ppm a small bias of 0.2 ppm for XCO2 and 2 ppb for XCH4 rela-
for XCO2 and 3.1 ± 6.0 ppb for XCH4 . For H-gain obser- tive to the noon-only data, we feel that this is the more con-
vations, we derive a scaling factor of 0.9996 ± 0.0020 for sistent comparison. The resulting correlation plots for XCO2
XCO2 and 0.9984 ± 0.0016 for XCH4 , corresponding to a and XCH4 are presented in Figs. 15 and 16. The left panel of
low bias of 0.2 ± 0.8 ppm for XCO2 and 2.8 ± 2.9 ppb for Fig. 15 shows the OCO-2 assimilated model data. We see an
XCH4 . The differences between GOSAT and COCCON are excellent agreement between the two datasets with a bias of
not statistically different at the 1σ level. Over the sand desert, 0.9 ± 0.5 ppm and a correlation coefficient R 2 of 0.983. This
the GOSAT M-gain data are biased high with respect to offset agrees well with the bias between CAMS model and
the COCCON data with a scaling factor of 1.0068 ± 0.0026 TCCON data presented in Chevallier (2020a). We do not ob-
for XCO2 and 1.0070 ± 0.0045 for XCH4 , corresponding to serve an increased bias at the beginning of 2017. This means
a high bias of 2.7 ± 1.1 ppm for XCO2 and 12.5 ± 8.1 ppb that the OCO-2 assimilated model reproduces the drawdown
for XCH4 . The H-gain data are in very good agreement of XCO2 seen in the COCCON time series in Fig. 5 dur-
with the COCCON observations with a scaling factor of ing this time. In contrast, we see an increased bias during
1.0003 ± 0.0008 for XCO2 and 1.0015 ± 0.0028 for XCH4 , the beginning of 2017 in the in situ assimilated data in the
corresponding to a high bias of 0.1 ± 0.3 ppm for XCO2 and right panel. Apart from this anomaly, the agreement between
a high bias of 2.7 ± 5.1 ppb for XCH4 . the two datasets is good. The CAMS model has a high bias
Although not always statistically significant at the 1σ of 1.1 ± 0.6 ppm and R 2 = 0.927. The biases between the
level, clear differences are discernible between the different CAMS model simulation and the COCCON Gobabeb mea-
GOSAT gain settings. This is in agreement with results re- surements are presented in Table 4.
ported by Velazco et al. (2019) and the GOSAT validation For XCH4 , both the combined GOSAT and in situ assim-
team. For the H-gain soundings, we report a good agree- ilated data and the in situ assimilated data are available until
ment with the COCCON observations within the 1σ level 2018. The GOSAT and in situ assimilated CAMS data ex-
for XCO2 as well as XCH4 with high correlation coefficients hibit a low bias of 2.4 ± 8.0 ppb, R 2 = 0.455. From the end
(R 2 > 0.9). of 2016 to the beginning of 2017, an anomaly is discernible
with higher CAMS values. This is not seen in the comparison
4.3 CAMS evaluation with the in situ assimilated dataset. The anomaly corresponds
to a period of increased scatter in the GOSAT and in situ as-
COCCON and CAMS XCO2 and XCH4 time series are pro- similated CAMS time series itself; see Fig. 14. Therefore, we
vided in Fig. 14. Hourly mean COCCON data are shown as attribute this anomaly to the influence of the GOSAT obser-
blue dots, CAMS data as red (satellite data assimilation) and vations. For the in situ assimilated data, we find a low bias
black dots (in situ data assimilation) with 3-hourly model of 5.8 ± 4.8 ppb and R 2 = 0.645. This is consistent with the
output for XCO2 and 6-hourly model output for XCH4 . For low bias of CAMS with respect to TCCON measurements in
Atmos. Meas. Tech., 14, 5887–5911, 2021 https://doi.org/10.5194/amt-14-5887-2021M. M. Frey et al.: Setup of a COCCON spectrometer in Namibia 5901
Figure 14. Column-averaged dry-air mole fraction daily mean time series for XCO2 and XCH4 at Gobabeb, Namibia. COCCON measure-
ments are shown as blue dots, CAMS model data as red and black dots. For COCCON, we show hourly pooled data; for CAMS, we show
3-hourly model output for XCO2 and 6-hourly model output for XCH4 .
Figure 15. XCO2 correlation plots between coincident COCCON Gobabeb observations and CAMS model data. The left panel shows the
OCO-2 assimilated model data; the right panel shows the in situ assimilated model data. Note that the OCO-2 assimilated data are available
until 2019 and the in situ assimilated data are available until 2018. Error bars denote the 1σ standard deviation of the hourly mean values for
COCCON measurements.
the latitude band between 20 and 30◦ S of around 10 ppb, as the reason, as Xair is stable and the other observed gases do
shown in Fig. 17 of Segers and Houweling (2020a). not show abnormal variations during this period. In order
to investigate whether the drawdown of XCO2 at the begin-
ning of 2017 at the Gobabeb station is linked to the African
5 Influence of the African biosphere on the Gobabeb biosphere, in Fig. 17, we present global OCO-2 assimilated
observations CAMS a posteriori surface carbon fluxes for 16 February
2017 at 12:00 UTC, the day with the lowest XCO2 values
From the end of 2016 until the beginning of 2017, the XCO2 in 2017. We find that in the direct vicinity of Gobabeb, no
values at the COCCON station at Gobabeb were significantly strong negative carbon fluxes are apparent. From this, we de-
lower compared to the TCCON stations Réunion Island and duce that air parcels with low CO2 concentrations are trans-
Lauder; see Sect. 4.1. We rule out instrumental problems as ported to Gobabeb from other regions of the African main-
https://doi.org/10.5194/amt-14-5887-2021 Atmos. Meas. Tech., 14, 5887–5911, 20215902 M. M. Frey et al.: Setup of a COCCON spectrometer in Namibia
Figure 16. XCH4 correlation plots between coincident COCCON Gobabeb observations and CAMS model data. The left panel shows the
model data assimilated with in situ and GOSAT data; the right panel shows the in situ assimilated model data. Error bars denote the 1σ
standard deviation of the hourly mean values for COCCON measurements.
land with negative surface fluxes. We therefore expect that Gobabeb ending at 1000 m above ground level. In contrast to
the drawdown of XCO2 is driven by low CO2 concentrations the trajectories at 5000 m, these originate from the ocean.
in higher layers of the atmosphere that are representative for
medium- or long-range transport. This is in agreement with
the results of Sect. 4.3, where a comparison between COC- 6 Conclusions and outlook
CON data with CAMS model data shows that the CAMS
model version assimilating total column data reproduces the We present measurements from a new ground-based remote-
XCO2 drawdown, in contrast to the version assimilating in sensing COCCON station in Namibia, the first FTIR site
situ data only. We grant the possibility that the discrepancy measuring GHGs on the African continent. We performed
between the different CAMS products could also stem from a thorough calibration scheme carried out in Karlsruhe in or-
imperfections of the CAMS model. der to make the results traceable to TCCON (and thereby the
In Fig. 18, we show 10 d backward trajectory ensemble WMO scale), including ILS measurements and side-by-side
simulations from the National Oceanic and Atmospheric Ad- comparisons with a reference COCCON spectrometer. The
ministration (NOAA) Hybrid Single-Particle Lagrangian In- results from Namibia show a typical global annual increase
tegrated Trajectory (HYSPLIT) model (Stein et al., 2016) for rate for both XCO2 as well as XCH4 . In contrast to compa-
16 February 2017. Initial 3-hourly meteorological input data rable FTIR measurements in the Southern Hemisphere, we
are provided by the NCEP Global Data Assimilation Sys- observe a pronounced seasonal variability for XCO2 with
tem (GDAS) model on a 1◦ latitude–longitude grid. The end a peak-to-peak amplitude of 5.3 ppm in 2017, in agreement
point of the trajectory analysis is chosen at a height of 5000 m with OCO-2 assimilated CAMS model data and global trans-
above ground level. All trajectories exhibit a long dwell time port model predictions (Olsen and Randerson, 2004). As ex-
over the African continent in regions with strong negative pected for a desert site, we observe very low values of XH2 O,
carbon surface fluxes; see Fig. 17. This corroborates the con- with a minimum value of 357 ppm. For the whole time series,
jecture that the low XCO2 values at Gobabeb are due to the daily Xair results are stable within 1 %. No apparent drift of
influence of the African biosphere. Most of the trajectories Xair is visible during the 4 years of measurements performed
that arrive at 5000 m height at Gobabeb originate from sig- at the COCCON Gobabeb station.
nificantly lower levels of the atmosphere, close to the sur- To put our results in the broader geophysical context, we
face, and are then uplifted, as can be seen in the lower panel compare the COCCON Namibia results to measurements
of Fig. 18. from the TCCON stations Réunion Island and Lauder. Given
In contrast, the backward trajectories for Réunion Island the fact that the stations are spatially far apart, the results
shown in Fig. 19 dwell almost exclusively over the ocean. are in good agreement. For XCO2 , both TCCON Lauder
In Fig. 20, we additionally provide backward trajectories for (−0.4 ± 1.1 ppm) and Réunion Island (1.1 ± 1.1 ppm) show
biases compared to COCCON Gobabeb within the 1σ uncer-
Atmos. Meas. Tech., 14, 5887–5911, 2021 https://doi.org/10.5194/amt-14-5887-2021You can also read