Machine learning based classification of mitochondrial morphology in primary neurons and brain
←
→
Page content transcription
If your browser does not render page correctly, please read the page content below
www.nature.com/scientificreports
OPEN Machine learning‑based
classification of mitochondrial
morphology in primary neurons
and brain
Garrett M. Fogo1,2,7, Anthony R. Anzell1,3,4,7, Kathleen J. Maheras1, Sarita Raghunayakula1,
Joseph M. Wider1, Katlynn J. Emaus1,2, Timothy D. Bryson1,5, Melissa J. Bukowski3,
Robert W. Neumar1, Karin Przyklenk3 & Thomas H. Sanderson1,2,5,6*
The mitochondrial network continually undergoes events of fission and fusion. Under physiologic
conditions, the network is in equilibrium and is characterized by the presence of both elongated
and punctate mitochondria. However, this balanced, homeostatic mitochondrial profile can change
morphologic distribution in response to various stressors. Therefore, it is imperative to develop a
method that robustly measures mitochondrial morphology with high accuracy. Here, we developed a
semi-automated image analysis pipeline for the quantitation of mitochondrial morphology for both
in vitro and in vivo applications. The image analysis pipeline was generated and validated utilizing
images of primary cortical neurons from transgenic mice, allowing genetic ablation of key components
of mitochondrial dynamics. This analysis pipeline was further extended to evaluate mitochondrial
morphology in vivo through immunolabeling of brain sections as well as serial block-face scanning
electron microscopy. These data demonstrate a highly specific and sensitive method that accurately
classifies distinct physiological and pathological mitochondrial morphologies. Furthermore,
this workflow employs the use of readily available, free open-source software designed for high
throughput image processing, segmentation, and analysis that is customizable to various biological
models.
Mitochondria are highly dynamic organelles that exist in a network that is constantly elongating and dividing.
Under normal conditions the mitochondrial network is in an equilibrium state of long, interconnected networks
and short punctate mitochondria, and maintaining this balanced state is critical for mitochondrial homeostasis,
cell stability, and cell survival1–3.
Mitochondrial fission (division) and fusion (elongation) events give rise to distinct morphologies. The ever-
changing state of mitochondrial morphology is regulated by a family of dynamin-like GTPases, which consist
of the fission protein dynamin-related protein 1 (Drp1) as well as the fusion proteins mitofusin (Mfn) 1&2 and
optic atrophy 1 (Opa1). Fission of mitochondria plays an important role in segregating unhealthy mitochondria
that contain dysfunctional proteins, destabilized membranes, and mutated or damaged mitochondrial DNA
(mtDNA)4–8. Alternatively, fusion aids in the equilibration of matrix metabolites, intact mtDNA, and membrane
components such as electron transport c omplexes4,9–11.
Dramatic alterations in mitochondrial network architecture have been observed in cell cycle progression,
cellular differentiation, oxidative stress, metabolic perturbation, and induction of programmed cell death
pathways1,12–18. Despite the effort to study the phenotypic heterogeneity of mitochondria under these various
conditions, investigations have been limited by their measures of mitochondrial morphology, often resorting
to manual classification of simple morphologic states, e.g. fused versus fragmented. Studies typically utilize a
1
Department of Emergency Medicine, University of Michigan Medical School, Ann Arbor, MI 48109,
USA. 2Neuroscience Graduate Program, University of Michigan Medical School, Ann Arbor, MI 48109,
USA. 3Department of Physiology, Wayne State University School of Medicine, Detroit, MI 48201,
USA. 4Department of Human Genetics, University of Pittsburgh, Pittsburgh, PA 15269, USA. 5Frankel
Cardiovascular Center, University of Michigan Medical School, Ann Arbor, MI 48109, USA. 6Department of
Molecular and Integrative Physiology, University of Michigan Medical School, Ann Arbor, MI 48109, USA. 7These
authors contributed equally: Garrett M. Fogo and Anthony R. Anzell. *email: thsand@umich.edu
Scientific Reports | (2021) 11:5133 | https://doi.org/10.1038/s41598-021-84528-8 1
Vol.:(0123456789)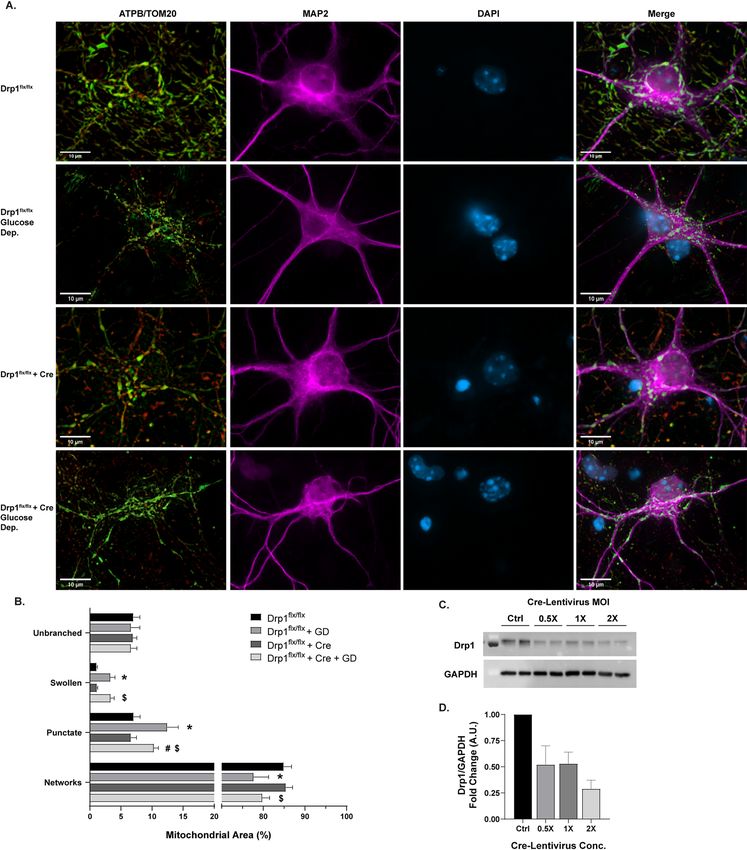
www.nature.com/scientificreports/
qualitative or semi-quantitative approach by developing a scoring system of fission/fusion profiles or binning
mitochondria based on length19–22, both of which lack, on a large-scale, sampling size, and an accurate and
precise assessment of physiologically relevant mitochondrial morphologies. To overcome this, recent studies
have shifted to utilizing computational image analysis, commonly referred to as image cytometry, which limits
observer and selection bias in morphological evaluations and demonstrates high throughput capabilities23–26.
Computational image analysis of mitochondrial morphology using machine learning techniques offers the
advantages of generating accurate classification and quantitation of different morphologies with fast and effi-
cient large-scale application. Although this method provides robust and accurate analysis of mitochondrial
morphology, the availability and expertise required to utilize machine learning software presents a barrier for
investigators. Here, we developed a semi-automated image analysis pipeline, that utilizes open-source software
for the quantitation of mitochondrial morphology for both in vitro and in vivo applications. Utilizing mouse
primary cortical neurons, our pipeline demonstrates a highly specific and sensitive method of efficiently clas-
sifying mitochondrial morphology that can be extended to 3D in vivo applications through immuno-labeling
of brain sections as well as serial block-face scanning electron microscopy (SBF-SEM) data.
Results
Identification of distinct mitochondrial morphologies. Mouse primary cortical neurons were cul-
tured on glass coverslips and immuno-labeled with antibodies targeting ATP synthase on the inner mitochon-
drial membrane and TOM20 on the outer mitochondrial membrane. Fluorescent microscopy revealed four
distinct mitochondrial morphologies: network, unbranched, swollen, and punctate that represent frequent mito-
chondrial size and shape parameters in neurons19,27 (Fig. 1A). Networks were defined as long sprawling mito-
chondrial objects (~ ≥ 5 µm2) with one or more branching points. Mitochondria were considered unbranched if
they were of intermediate size (~ 1–4 µm2), uniform thickness, and did not include a branching point. Punctate
objects were defined as small compact objects (~ ≤ 1 µm2). Swollen mitochondria were identified as intermediate
sized objects (~ 1–4 µm2) with high circularity and roundness.
To validate the independence of these observed morphologies, ATP synthase and TOM20 signals were
merged, processed together, and mitochondrial objects were segmented and analyzed using a semi-automated
image processing workflow in F IJI28 (Supplementary Fig. 1). Each mitochondrial object was classified using
32 size and shape descriptors and a principal component analysis (PCA) was applied to evaluate phenotypic
differences (Fig. 1B). Mitochondrial objects aggregated at discrete quadrants of the PCA plot (Fig. 1B), further
validating that mitochondrial segregate into distinct morphological phenotypes. Comparisons across individual
variables, namely roundness (Round) and interfacial density (Intfc D), also demonstrated the independence of
each morphology (Fig. 1C).
Machine learning prediction of morphology. Mitochondrial objects (1091 total) were segmented,
measured, and hand-classified for the development of a morphological classification model. This hand-classified
data set was split into the machine learning train and test sets (80% and 20%, respectively). The training set was
used to develop a random forest classification model using the R caret p ackage29,30. In this model, a mitochon-
drial object is classified through 500 parallel decision trees, in which each tree provides an output vote. Each
object is assigned a predicted morphology at the conclusion of all decision trees based on the morphology with
the majority of votes. The model accuracy over 25 training repetitions was 94.6%. For verification of model accu-
racy, the test set of mitochondrial objects was run through the completed decision tree model. Test accuracy was
95.4% on the 217 hand-classified objects in the test set (Fig. 1D). The R functions implemented for model train-
ing and evaluation are available on a GitHub repository (https://github.com/sanderson-lab/mitomorphology).
Physiological relevance of morphological phenotypes. To assess physiological relevance, the
in vitro machine learning classification workflow was applied to microscopy imaging data of primary neurons
after genetic and pharmacological disruption of mechanisms critical for regulating mitochondrial dynamics. The
morphologic state of mitochondria in each image is quantified as the percentage of mitochondrial area classified
into each morphological phenotype.
The dynamin-like GTPase Opa1 is critical for the remodeling of mitochondrial architecture, namely for its
role in mitochondrial inner membrane fusion4,18,31,32. Disruption of Opa1 prevents mitochondrial fusion, and,
based on previous studies using qualitative or semi-quantitative a nalyses19–22, this would be predicted to shift the
mitochondrial network toward mitochondrial fragmentation. Primary neurons with conditional knockout (cKO)
of Opa1 (Fig. 2A) were generated using primary cells from Opa1 floxed mice exposed to either lentiviral-Cre
(LV- EF1ɑ -Cre) or an empty vector lentivirus (LV- EF1ɑ -empty) as a control (Fig. 2C,D). Opa1 cKO produced a
fragmented state, with a decrease in mitochondrial networked area (p = .0175) and increases in swollen (p = .0015)
and punctate area (p = .0002; Fig. 2B). These changes in morphology are indicative of impaired mitochondrial
fusion and increased cellular s tress15,18,19,32,33. These results suggest the formation of mitochondrial networks is
at least partially dependent on Opa1-mediated fusion, as many others have s hown32–35.
To produce small punctate mitochondria, the GTPase Drp1 will excise and divide m itochondria13,36,37. Drp1
cKO was utilized to disrupt mitochondrial fission and shift the mitochondrial network toward a fused network
(Fig. 3C,D). Drp1 cKO alone did not have any significant effects on the distribution of morphological phenotypes
without cellular stressors (Fig. 3A)13,15,18,38. However, when cultures are subjected to 18 h glucose deprivation
(GD) as a stressor (Fig. 3A), wild -type (WT) cells show a significant decrease in mitochondrial networked area
(p = .0003) with concomitant increases in swollen (p < .0001) and punctate area (p < .0001) (Fig. 3B). Drp1 cKO
partially rescued normal mitochondrial morphology resulting in significantly lower percent area of punctate
Scientific Reports | (2021) 11:5133 | https://doi.org/10.1038/s41598-021-84528-8 2
Vol:.(1234567890)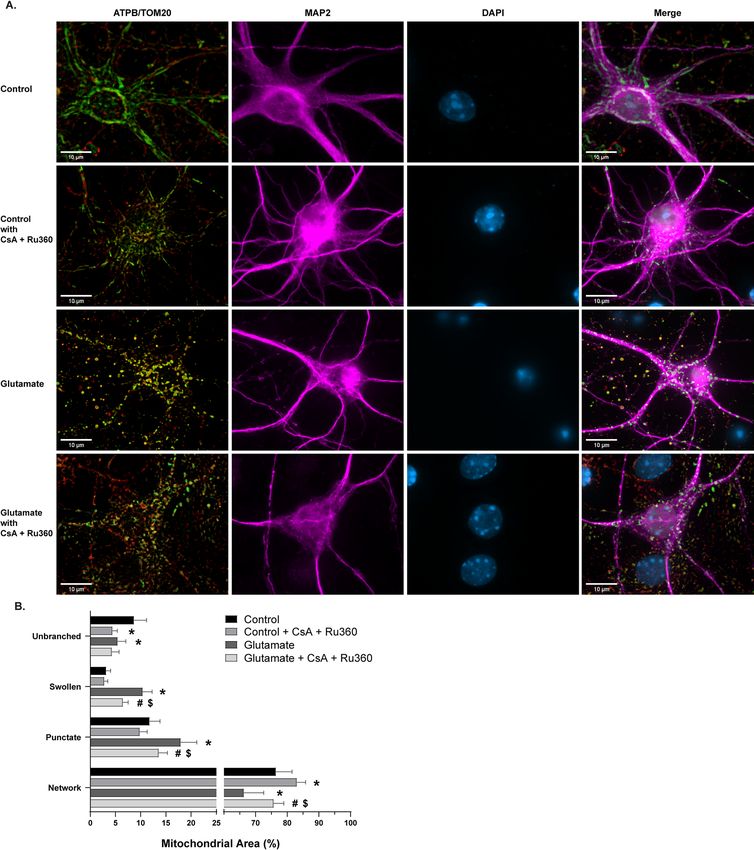
www.nature.com/scientificreports/
Figure 1. Identification of distinct mitochondrial morphologies in primary neurons. (A) Representative
immunofluorescent image of mitochondria labeled for ATP synthase (green) and TOM20 (red). Insert:
mitochondrial objects segmented and color coded by classified morphology. (B) Principal component analysis
(PCA) of hand-classified mitochondrial objects in the training and test sets combined. Individual objects are
color coded by morphology (n = 1091 mitochondrial objects). (C) Heatmap displaying the scaled 32 size and
shape measurements by morphology. (D) Confusion matrix displaying the results of model evaluation using the
hand-classified test set (217 objects).
mitochondria (p = .0116; Fig. 3B), demonstrating that the GD-induced punctate phenotype is related to Drp1-
mediated mitochondrial fission.
A major contributor to mitochondrial dysfunction and the induction of cell death is the formation and
activity of the mitochondrial permeability transition pore (mPTP)15,39–41. Ca2+-induced mitochondrial swelling
through the opening of mPTP is a hallmark of cell death in pathological conditions, such as ischemia/reperfu-
sion injury15,19,41–45. To assess the reliability of the swollen phenotype and the relevance of this phenotype to
pathological mPTP opening and Ca2+ influx, cells were exposed to pharmacological modulation of swelling
(Fig. 4A). Glutamate and activation of its N-Methyl-D-aspartate (NMDA) receptor are known stimulators of
mitochondrial swelling and transient mPTP opening46,47. Cells treated with 100 µM glutamate and 10 µM co-
agonist glycine caused an increase in swollen (p < .0001) and punctate mitochondrial area (p = .0002), along
with a subsequent decrease in networked (p = .0025) and unbranched area (p = .0118; Fig. 4B). To determine the
dependence of this observation on C a2+ handling and mPTP activity, cells were pre-treated and co-incubated
with glutamate and the mitochondrial calcium uniporter (MCU) inhibitor Ru360 and mPTP inhibitor cyclo-
sporin A (CsA)39,48–52. Treatment with the inhibitors alone decreased unbranched area (p = .0004) and increased
Scientific Reports | (2021) 11:5133 | https://doi.org/10.1038/s41598-021-84528-8 3
Vol.:(0123456789)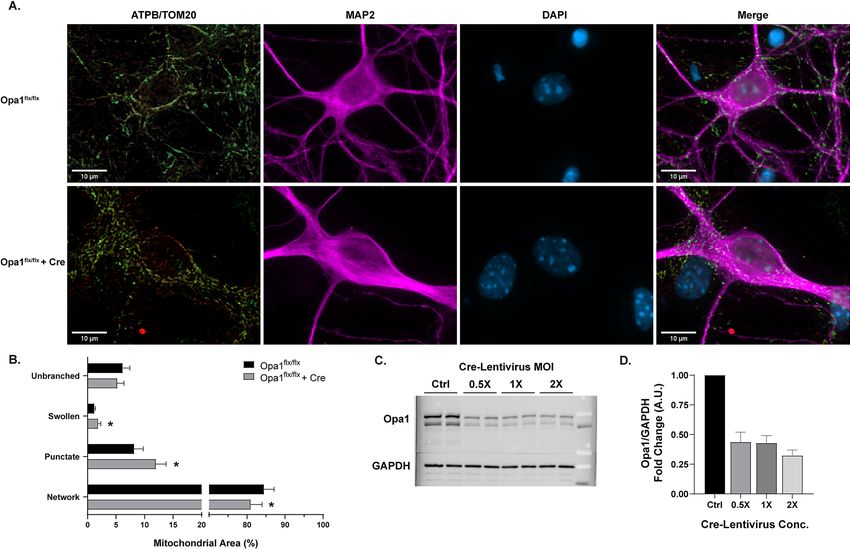
www.nature.com/scientificreports/
Figure 2. Morphological analysis of mitochondria in Opa1 conditional knockout. (A) Representative images
of primary Opa1flx/flx neurons (top) and Opa1flx/flx neurons with Cre (bottom). Panels (from left to right):
ATP synthase (green) and TOM20 (red) merged, MAP2 (magenta), DAPI (blue), all channels merged. Scale
bars = 10 µm. (B) Percentage of mitochondrial area per morphology in Opa1flx/flx cells (black) and Opa1flx/flx cells
with Cre (gray). Mean ± SD (n = 9 per group). * indicates p < .05. (C) Representative Western blot displaying
Opa1 and GAPDH protein levels across Cre-Lentivirus concentrations. Full-length blots are presented in
Supplementary Fig. 3. (D) Western blot quantification of Opa1 protein levels after Cre-Lentivirus treatment
(n = 3). For all Opa1 cKO experiments, 1 × MOI Cre-Lentivirus was used.
networked area (p = .0449; Fig. 4B), potentially due to the interconnected relationship between Ca2+ and Drp1
during remodeling of m itochondria3,4,53,54. Furthermore, Ru360 and CsA administration reduced glutamate-
induced mitochondrial swelling and fragmentation (Fig. 4B), suggesting the swollen morphological phenotype
is associated with mPTP opening and mitochondrial C a2+ homeostasis.
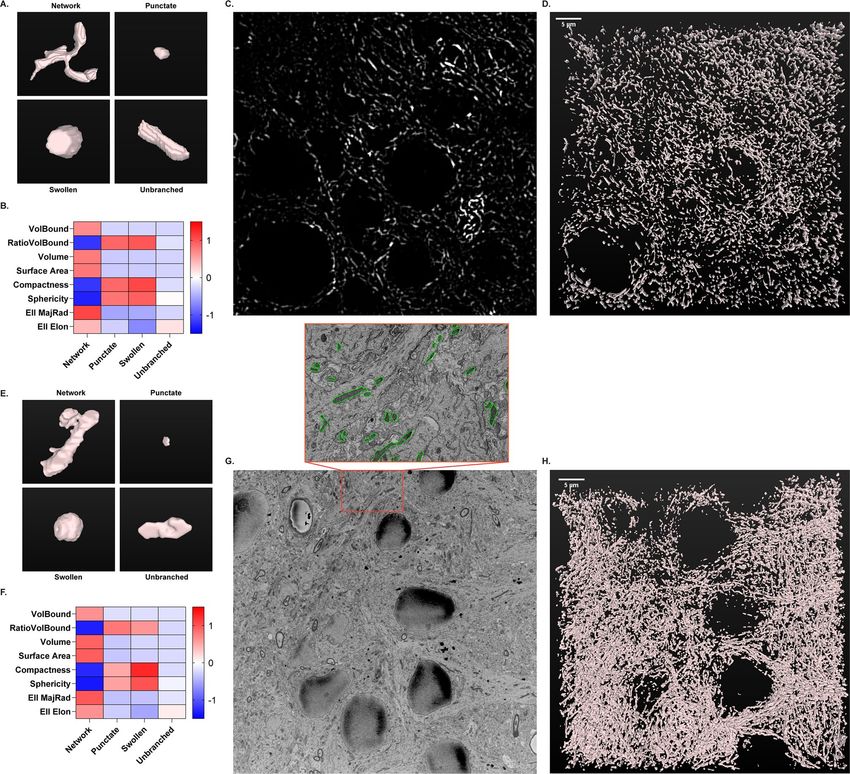
Workflow application to 3D resolution. A critical limitation of standard morphological analyses of
mitochondria, including the in vitro classification model, is the lack of 3D resolution. Cells and organelles have
complex three-dimensional architecture and morphology, and inclusion of this 3D resolution can add important
details to mitochondrial morphologic analysis. To address this concern, morphological classification workflow
was expanded from 2D resolution in cell culture to 3D resolution in tissue histology. Mouse brain tissue sec-
tions immuno-labeled for ATP synthase were imaged using fluorescent confocal microscopy of the CA1 hip-
pocampus. Mitochondrial objects were segmented in individual images over a z-series of 50 slices (5 µm total)
and stitched together for 3D reconstruction in FIJI using the MorphoLibJ Connected Components Labeling
plugin55 (Fig. 5A–D). Mitochondrial objects were then measured using 8 size and 3D shape descriptors (Fig. 5B).
Through inspection of 3D renderings, mitochondrial objects were hand-classified by morphology (Fig. 5A).
Identical to the method described for cell culture, a random forest model was constructed and evaluated using
170 hand-classified mitochondrial objects. Model training with 8 size and 3D descriptors had an accuracy of
76.6%, while the test set was classified with 84.9% accuracy. An expanded descriptor set can be implemented,
similar to the primary neuron model, to increase accuracy to meet the needs of each experimental objective.
The same methodology of 3D object measurement, rendering, and classification was applied to serial
block-face scanning electron microscopy (SBF-SEM) images of rat brain sections from the CA1 hippocampus
(Fig. 5E–H). Mitochondrial objects in individual images were segmented in an automated manner using trainable
Weka segmentation56 (Supplementary Fig. 2). SBF-SEM sections were analyzed in z-series stacks of 100 slices
each (7 µm total). A random forest model was trained and tested on 231 hand-classified mitochondrial objects.
The accuracy for training and testing was 74.7% and 86.4%, respectively. Our confocal and SBF-SEM imaging
Scientific Reports | (2021) 11:5133 | https://doi.org/10.1038/s41598-021-84528-8 4
Vol:.(1234567890)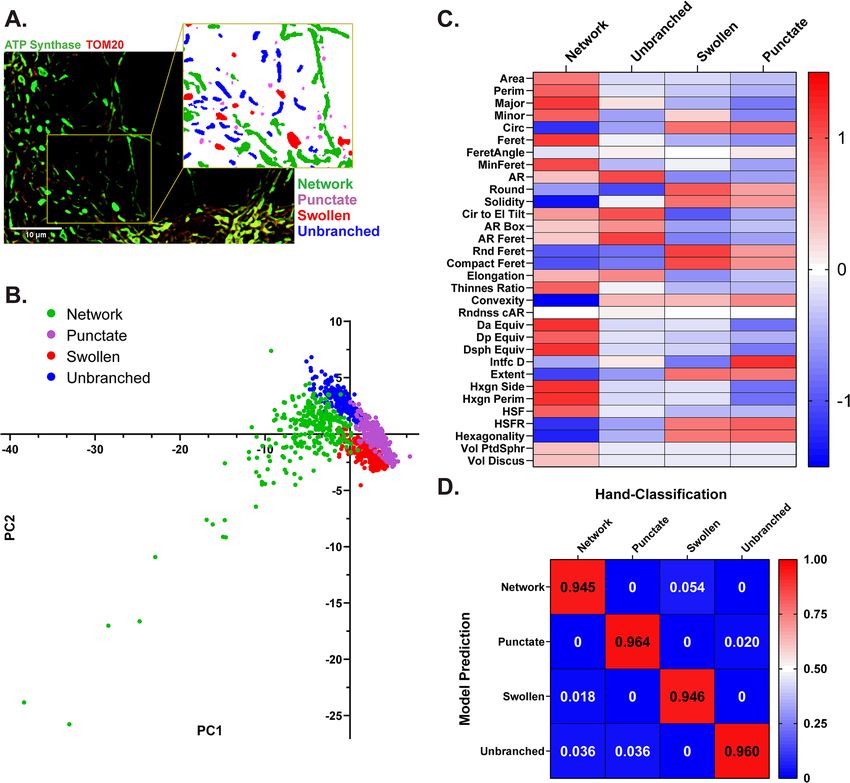
www.nature.com/scientificreports/
Figure 3. Morphological analysis of mitochondria in Drp1 conditional knockout (cKO) and glucose
deprivation (GD). (A) Representative images of primary Drp1flx/flx neurons. Rows (top to bottom): control
Drp1flx/flx, Drp1flx/flx after 18 hr GD, Drp1flx/flx with Cre, Drp1flx/flx with Cre after 18 hr GD. Untreated control
groups are shown on rows 1 and 3, 18 h GD groups are shown on rows 2 and 4. Panels (from left to right):
ATP synthase (green) and TOM20 (red) merged, MAP2 (magenta), DAPI (blue), all channels merged. Scale
bars = 10 µm. (B) Percentage of mitochondrial area per morphology in Drp1 cKO and GD experiments.
Mean ± SD (n = 5–8 per group). * indicates p < .05 versus Drp1flx/flx. # indicates p < .05 versus Drp1flx/flx + GD. $
indicates p < .05 versus Drp1flx/flx + Cre. (C) Representative Western blot displaying Opa1 and GAPDH protein
levels across Cre-Lentivirus concentrations. Full-length blots are presented in Supplementary Fig. 3. (D)
Western blot quantification of Drp1 protein levels after Cre-Lentivirus treatment (n = 3–4). For all Drp1 cKO
experiments, 2 × MOI Cre-Lentivirus was used.
Scientific Reports | (2021) 11:5133 | https://doi.org/10.1038/s41598-021-84528-8 5
Vol.:(0123456789)www.nature.com/scientificreports/
Figure 4. Morphological analysis of mitochondria in glutamate and cyclosporin A (CsA) + Ru360 experiments.
(A) Representative images of primary cortical neurons. Rows (top to bottom): vehicle-treated control group,
control cells treated with CsA + Ru360 only, vehicle-treated group with 30 min 100 µm glutamate exposure,
glutamate challenged group pre-treated and co-incubated with CsA + Ru360 Panels (from left to right):
ATP synthase (green) and TOM20 (red) merged, MAP2 (magenta), DAPI (blue), all channels merged.
Scale bars = 10 µm. (B) Percentage of mitochondrial area per morphology in glutamate and CsA + Ru360
experiments. Mean ± SD (n = 6–8 per group). * indicates p < .05 versus Control. # indicates p < .05 versus
Control + CsA + Ru360. $ indicates p < .05 versus Glutamate.
Scientific Reports | (2021) 11:5133 | https://doi.org/10.1038/s41598-021-84528-8 6
Vol:.(1234567890)www.nature.com/scientificreports/
Figure 5. 3D morphological classification of mitochondria using confocal (A–C) and electron microscopy
(D–F). (A) Representative 3D renderings of individual mitochondrial objects from mouse brain tissue immuno-
labeled for ATP synthase and imaged using confocal microscopy. (B) Heatmap displaying the scaled 8 size
and shape measurements by morphology for confocal microscopy. (C) Representative confocal image of ATP
synthase immunofluorescence from mouse hippocampus. (D) 3D rendering of mitochondria from the full
z-series (50 slices, 5 µm) of the image shown in (C), acquired via confocal microscopy. (E) Representative 3D
renderings of individual mitochondrial objects from rat brain tissue acquired via serial block-face scanning
electron microscopy (SBF-SEM). (F) Heatmap displaying the scaled 8 size and shape measurements by
morphology for SBF-SEM. (G) Representative single-plane image from SBF-SEM z-series. Insert: Enlarged
area of representative image with mitochondria traced (green). (H) 3D rendering of mitochondria from the full
z-series (100 slices, 7 µm) of the image shown in (G), acquired via SBF-SEM.
results serve as primary evidence that this analytical pipeline can be scaled to 3D resolution with versatility and
reliability.
Discussion
Mitochondrial morphology is a representative snapshot of the underlying processes of mitochondrial dynamics
and quality control. Emerging evidence suggests that the paradigm of mitochondria as effectors of injury extends
beyond the integrity of the organelle to encompass the balance between fission and fusion phenotypes and the
interface with processes responsible for cell death. Analyses of these morphologic alterations have tradition-
ally been performed using qualitative approaches or simple quantitative m easurements19–22. However, recent
advances in imaging techniques and the availability of computational resources make more advanced analysis of
morphology feasible. Several groups have developed software and codes/macros for the unbiased measurement
Scientific Reports | (2021) 11:5133 | https://doi.org/10.1038/s41598-021-84528-8 7
Vol.:(0123456789)www.nature.com/scientificreports/
and classification of mitochondrial morphology23–26. To further these efforts, we developed a machine-learning
based classification pipeline for the identification of distinct physiological and pathological morphologies using
free and open-source software with 2D and 3D capabilities.
Utilizing software and plugins freely and readily available to investigators in the biomedical sciences, we
designed a workflow for high throughput image processing, segmentation, and analysis that is customizable
to various biological m odels28,29,55,56. Starting in cell culture, we identified morphological phenotypes that we
hypothesized to be indicative of physiological and pathological mechanisms of mitochondrial dynamics. Using
a combination of size and geometric descriptors, we verified the distinct nature of these phenotypes and our
ability to classify them by visual observation. Through the application of machine learning in the R caret package,
we developed a classification model with high sensitivity and specificity for these morphological p henotypes29.
Implementation of machine learning classification and semi-automated image processing removes opportunity
for bias and inconsistency in morphological analysis, thereby increasing the rigor and reproducibility of these
procedures23,57. Furthermore, we have demonstrated the utility and versatility of our pipeline through 3D analysis
in confocal and SBF-SEM imaging. The applications of our workflow in 3D serves as proof-of-concept that high
throughput analyses of mitochondrial morphology can be accomplished with high sensitivity in larger biological
models. This technique has the potential to be a significant advancement to standard morphological analysis of
mitochondria in cell culture, intact tissue samples, and tissue in vivo live imaging.
Mitochondrial analyses in cell culture models have traditionally been performed with 2D resolution, as many
cell types grow in a monolayer in vitro. Imaging and analyzing in 2D reduces the need for advanced imaging
techniques and high computational power. However, cells and their organelles exist in 3D and therefore 2D
analyses may not provide precise results. To address this limitation, we utilized our 2D workflow as a foundation
for the construction of an adaptable 3D analysis methodology. Additionally, a critical limitation of the analyses
performed in this study is the lack of cell type specificity. The mitochondrial labeling strategies implemented
were not specific to neurons. It is therefore likely that mitochondria from surrounding glial cells and other cells of
neurovascular unit were included. The methodologies we have developed have tremendous utility for future stud-
ies with research questions relating to specific cell types. Our workflows are easily adaptable for cell type specific
mitochondrial labeling strategies, namely genetically encoded fluorescent reporters targeted to mitochondria.
Although our workflow will require evaluation and confirmation in other cell types, tissues, and disease
models, we believe our approach has the potential to be customizable for an investigator’s biological model of
interest and research question. This versatility is a great asset, but also presents its own limitations. As is always
the case with machine learning, a classification model is only as good as its training data. Development of a
reliable and sensitive model is dependent on consistent and accurate hand-classification of the train/test set and
useful input variables. Inappropriate selection of input variables or inconsistent hand-classification can lead to
faulty models. Additionally, with high throughput image analysis, it is critical to verify objects of interest are
not lost or altered in processing and segmentation. As an example, during analysis of 3D mitochondrial objects,
we observed a “ballooning” effect in which binary objects after segmentation were enlarged compared to the
mitochondrial signal in the original images. This effect was reduced through the implementation of a morpho-
logical erosion step during binary image processing19. A limitation specific to automated SBF-SEM analysis is
segmentation based on pixel intensity. We trained a Weka segmentation model for the automated extraction of
mitochondrial objects from SBF-SEM images. This technique greatly improved our sampling ability and analysis
efficiency. However, application of this method generated a “survivor”-like bias, where mitochondria with severe
cristae dysfunction were unintentionally discarded during segmentation, leading to a likely underestimation of
swollen mitochondria. It is important to note that application of our proposed pipeline is also possible without
automated segmentation. Therefore, possible biases introduced during automated processing and segmentation
can be avoided by implementing the classification protocol without batched image segmentation.
There is an increasing need to bridge the fields of computer science, mathematics, and artificial intelligence
with the biomedical sciences. Detailed analysis with computational and imaging techniques will greatly advance
our understanding of complex biological processes and increase reproducibility in research. Here we describe
a semi-automated machine learning-based workflow for the 2D and 3D analysis of mitochondrial morphology
using free and open-source software. Our method of morphological classification offers much needed versatil-
ity, such that investigators can apply the technique to their biological model and imaging technique of interest.
The application of this quantitative method will greatly increase the efficiency and reproducibility of assessing
mitochondrial morphology throughout the field.
Methods
Animals. All procedures were performed in accordance with institutional and ARRIVE guidelines and
approved by the University of Michigan and Wayne State University Institutional Animal Care and Use Commit-
tees (IACUC). Mice were maintained on a 12 h light/dark cycle with standard rodent chow and water available
ad libitum. Wild-type (WT) mice (C57BL/6Crl) were purchased from Charles River Laboratories (Wilmington,
MA). Drp1 floxed (Drp1flx/flx) mice (Dnm1ltm1.1Hise) were generously provided by Hiromi Sesaki, Johns Hopkins
University, Baltimore, MD58. Opa1 floxed (Opa1flx/flx) mice were generously provided by Luca Scorrano, Univer-
sity of Padua, Italy59. All mouse models were backcrossed to C57BL/6Crl background. Sprague Dawley rats were
obtained from Envigo (Indianapolis, IN).
Primary neuron culture. Postnatal day 0–2 (P0–P2) mouse pups were sacrificed by decapitation. Cerebral
cortices were dissected and minced prior to incubation in enzyme digestion solution (1 × hibernate complete
medium, 0.06 mg/mL l-cysteine (Sigma, 778672), 1.4 × 10⁻² N NaOH (Sigma, 43617), 10 ng/mL APV (2-Amino-
5-phosphonopentanoic acid, Sigma, A-5282), with 50 uL Papain (Worthington, LS 03126)) for 30 min at 37 °C.
Scientific Reports | (2021) 11:5133 | https://doi.org/10.1038/s41598-021-84528-8 8
Vol:.(1234567890)www.nature.com/scientificreports/
Following digestion, tissue was washed with DPBS and dissociated in complete Hibernate-A medium. Cells were
seeded onto 0.1% PEI-coated glass coverslips at a density of 160,000 cells/cm2. After 30 min, complete media
change was performed with neurobasal complete medium (1 × Neurobasal Plus medium (Gibco, A3582901), 1%
B27 Plus (Gibco, A3653401), 0.5 mM Glutamax Supplement (Gibco, 35050061), and 1 Penicillin/Streptomycin
Solution (Gibco, SV30010)). Cells were incubated at 37 °C in 5% C O2 for 14 days. Half-media changes were
performed every 3–4 days with neurobasal complete medium.
Lentiviral transduction. Lentiviral infection was performed 7 days prior to experimentation, on day-
in-vitro 7 (DIV7). Lentiviral plasmids and lentivirus were generated by the vector core at the University of
Michigan: Lenti-EF1ɑ-Cre-VSVG, Lenti-EF1ɑ-VSVG. Viruses were prepared in Neurobasal Medium (Gibco,
21103049). For cKO experiments, an empty vector lentivirus (Lenti-EF1ɑ-VSVG) was administered to floxed
cells to serve as controls.
Pharmacological treatment. For glucose deprivation, cells were incubated in EBSS no glucose medium
((0.20 g/L CaCl2 (Spectrum, CA138500GM), 0.4 g/L KCl (Fisher Chemical, P217-500), 0.097 g/L MgSO4 (Fisher
Chemical, M65-500), 6.8 g/L NaCl (Fisher Chemical, S2711), 2.2 N aHCO3 (Acros Organics, AC447102500),
0.14 g/L NaH2PO4-H2O (Fisher Chemical, S369-500), and 0.01 g/L Phenol red (Fisher Chemical, P74-10)) for
18 h at 37 °C. For glutamate treatment, cells were incubated in 100 μM glutamate (Sigma, G8415) and 10 μM
glycine (Sigma-Aldrich, G5417) in EBSS for 30 min at 37 °C. Prior to glutamate treatment, cells were pre-treated
with 1 μM Cyclosporin-A (CsA, Sigma-Aldrich, SML1018) and 10 μM Ru360 (Calbiochem, 557440) for 60 min.
Following pre-treatment, cells were incubated with CsA and Ru360 concurrently with glutamate treatment for
30 min.
Cryostat sectioning. Mice were anesthetized with isoflurane then transcardially perfused with 10 mL of
1 × PBS, followed by 10 mL of 4% PFA in 1 × PBS. Brains were post-fixed overnight in 4% PFA at 4 °C, then
cryoprotected in 25% sucrose in 1 × PBS. Brains were cut into 20 µm sections using a cryostat (CM1860, Leica
Microsystems), set at − 22 °C, cold mounted onto slides (Superfrost, Thermo Fisher Scientific), and stored at
− 20 °C until staining.
Western blot. Cells were scraped in homogenization-A buffer, sonicated, and protein concentration was
measured using the Bradford Plus Assay Reagent (ThermoFisher, PI23236). Polyacrylamide gels (10% 29:1 poly-
acrylamide/bisacrylamide (Fisher BioReagents, BP1408-1), 375 mM Tris pH 8.8 (Fisher BioReagents, BP152-
1), 0.1% sodium dodecyl sulfate (SDS, Sigma, L3771), 0.1% ammonium persulfate (APS, Sigma, #A3678), and
0.1% TEMED (GE Healthcare, # 45-000-226)) were loaded with 10 μg of whole cell lysates and transferred
to nitrocellulose membranes. Membranes were incubated with primary antibodies (1:1000 Mouse Anti-Dlp1/
Drp1 in 2% milk (Clone 8, BD Transduction Labroraotries, DB6111112); 1:1000 Mouse Anti-Opa1 in 2% BSA
(DB Transduction Laboratories, DB612607); 1:10,000 Rabbit Anti-GAPDH in 2% BSA (14C10, Cell Signaling,
2118)) at 4 °C overnight. Membranes were then washed with Tris-Buffered Saline and 0.1% Tween (TBST, Fisher
Scientific, BP337500) and incubated in secondary antibodies for 60 min at room temperature. Membranes were
then washed 3 × with TBST for 5 min. The membranes were incubated in SuperSignal West Pico Plus Chemilu-
minescent Substrate (ThermoFisher, 34577), imaged utilizing a BioRad ChemiDoc XRS and imager, and finally
quantified by densitometry using ImageJ.
Immunofluorescence. Cell culture. Cells were fixed with 4% paraformaldehyde (ThermoFisher,
50980487) for 15 min at 37 °C. Coverslips were incubated in blocking solution (5% goat serum (Sigma, G9023)
and 0.3% Triton-X100 (Acros Organics, 215682500) in PBS) for 60 min. Coverslips were then incubated in pri-
mary antibody solution (1:1000 Mouse Anti-ATPB (Abcam, ab14730), 1:200 Rabbit Anti-TOM20 (ProteinTech,
11802–1-AP), 1:1000 Chicken Anti-MAP2 (Abcam, ab5392), 1% BSA (Sigma, A9647) and 0.3% Triton-X100 in
PBS) at 4 °C overnight. After primary incubation, coverslips were washed 3 × in PBS and incubated in secondary
antibody solution (1:200 Anti-Mouse Alexa Fluor 488 (Invitrogen, A11029), 1:200 Anti-Rabbit Alexa Fluor 546
(Invitrogen, A10040), 1:200 Anti-Chicken Alexa Fluor 647 (Invitrogen, A21449), 1% BSA (Sigma, A9647) and
0.3% Triton-X100 in PBS) for 60 min. Following secondary incubation, coverslips were washed 3 × with PBS and
mounted on glass slides using Fluoroshield with DAPI (Sigma, F6057).
Tissue sections. Slides were permeabilized with 1% triton in 1 × PBS for 10 min and then 3% peroxide for
10 min. Slides were blocked using 2% goat serum/TBSGBA (Tris buffered saline, gelatin, bovine serum, azide)
for 1 h. Primary antibody (1:100 Mouse Anti-ATPB, Abcam, ab14730) in blocking solution was incubated over-
night at room temperature. Slides were washed with 1 × PBS, incubated with secondary antibody (1:100 Anti-
Mouse Alexa Fluor 488 (Invitrogen, A11029) and DAPI (Sigma) for 3 h at room temperature and mounted with
ProLong Glass mountant (Thermo Fisher Scientific).
Fluorescent microscopy. Cell culture. Each coverslip was imaged using a Zeiss Axio Observer Z1 in-
verted microscope with LED illumination. For each coverslip, 8–10 image z-stacks (0.24 µm slices) were ac-
quired at 63 × with oil immersion. Z-stacks were then deconvolved using the Zeiss Zen Pro regularized inverse
filter method. Following, z-stacks were processed using Zeiss Zen Pro extended depth of focus wavelets method.
Images were exported in TIFF format for post-processing.
Scientific Reports | (2021) 11:5133 | https://doi.org/10.1038/s41598-021-84528-8 9
Vol.:(0123456789)www.nature.com/scientificreports/
Tissue sections. Images were acquired on a Leica TCS SP8 DMi8 STED Inverted Confocal microscope (Leica
Wetzler, Germany) using Leica Application Suite X (LASX). Z-series of 5 μm were collected beginning at the top
of the tissue section inward using the following parameters: 400 Hz, z step size:0.1 um, 2048 × 2048. After acqui-
sition, image stacks were deconvolved with Huygens Professional version 19.04 (Scientific Volume Imaging, The
Netherlands, http://svi.nl) using CMLE algorithm, with SNR:20 and 40 iterations. Z stacks were exported in
TIFF format for post-processing.
Electron microscopy. Brains were fixed with 2.5% glutaraldehyde then embedded and stained with
osmium tetroxide and imaged on a scanning block face scanning electron microscope19. Block-face scans of
the sample are taken, followed by removal of a 70 nm section and subsequent SEM image the next z-plane. This
process is repeated on average 400 to 500 times, generating z-stacks of SEM data at 70 nm intervals.
Image processing and segmentation. Immunofluorescence. Post-processing was performed in F IJI28.
Images collected from in vitro experiments were imported as merged images of ATP synthase and TOM20
signal. Z series of mouse cerebral tissue were unstacked and imported into FIJI as individual images of ATP
synthase signal. The following steps were performed using FIJI’s batch processing feature. Background noise was
removed using a rolling ball radius of 10 pixels. Images were filtered via Unsharp Mask with a radius of 1 pixel
and mask weight of 0.60. Enhancement of local contrast was performed using Contrast Limited Adaptive Histo-
gram Equalization (CLAHE)60 with 256 histogram bins. A median filter was then applied to each image with a
radius of 2 pixels. Mitochondria were segmented using Trainable Weka S egmentation56. The segmentation clas-
sifier model was trained using hand identified mitochondria from processed images, positive for ATP Synthase
and/or TOM20 signal. Segmentation output images were converted to 8-bit binary images and the known scale
was set. For the identification of mitochondrial objects in 2D, the FIJI Particle Analyzer plug-in was run with a
minimum object size of 0.30 um. Measurements from identified objects were then expanded using the Extended
Geometric Descriptions macro61.
Electron microscopy. Images were imported into FIJI software and 5 × compressed via bilinear interpolation.
Mitochondrial objects were segmented from downsized images using Trainable Weka S egmentation56. Output
images were converted to 8-bit binary.
3D object mapping and measurement. Segmented binary images from tissue immunofluorescence
and electron microscopy were morphologically eroded using MorphoLibJ Morphological Filters plug-in55. Indi-
vidual images were then re-assembled into z stacks and 3D objects were identified using the MorphoLibJ Con-
nected Components Labeling plug-in at a connectivity setting of 655. Resulting connected objects were measured
with the 3D ROI Manager62.
Machine learning classification. Machine learning-based classification of mitochondrial objects was
performed in R computing language using the R Caret package29,30. Rstudio software (Boston, MA) was used
for all R computation. The following procedures were utilized for the development of all classification models
described. The measurements of classified mitochondrial objects, along with their classification, were imported
into Rstudio as the train/test set. This data set was then split into the training (80%) and test (20%) sets using
the createDataPartition function. A random forest algorithm (“rf ”) was trained by the training set with 25 rep-
etitions. The test set was then run through the model for the assessment of accuracy. Confusion matrices and
principal component analyses were produced to assess the performance of the models.
After model construction, data from in vitro experiments was imported into Rstudio and run through the
trained model using the predict function. Predicted morphological phenotypes for each mitochondrial object
were then exported along with the original measurements as a csv file. Data was then compiled and organized
in Microsoft Excel (Redmond, WA) to compute the percent mitochondrial area belonging to each morphology
in a given image/condition. R functions written for model training and morphological predictions are available
in our GitHub repository (https://github.com/sanderson-lab/mitomorphology).
Statistical analysis. Statistical analyses were performed in GraphPad Prism 8 (GraphPad Software, San
Diego, CA). For comparisons of two discrete groups, one-way ANOVAs were performed, followed by post-hoc
t-tests. For comparisons of more than two groups, two-way ANOVAs were performed with post-hoc compari-
sons made by Tukey’s test corrected for multiple comparisons. Tests with p < .05 were considered statistically
significant. The number of biological replicates is indicated by n, unless otherwise noted.
Code Availability
R functions written for machine learning model training and morphological predictions, as well as sample raw
images, are available in our GitHub repository (https://github.com/sanderson-lab/mitomorphology)29,30.
Received: 25 November 2020; Accepted: 17 February 2021
References
1. Kulek, A. R., Anzell, A., Wider, J. M., Sanderson, T. H. & Przyklenk, K. Mitochondrial quality control: role in cardiac models of
lethal ischemia-reperfusion injury. Cells 9, 214 (2020).
Scientific Reports | (2021) 11:5133 | https://doi.org/10.1038/s41598-021-84528-8 10
Vol:.(1234567890)www.nature.com/scientificreports/
2. Twig, G. & Shirihai, O. S. The interplay between mitochondrial dynamics and mitophagy. Antioxid. Redox Signal 14, 1939–1951
(2011).
3. Calo, L., Dong, Y., Kumar, R., Przyklenk, K. & Sanderson, T. H. Mitochondrial dynamics: an emerging paradigm in ischemia-
reperfusion injury. Curr. Pharm. Des. 19, 6848–6857 (2013).
4. Hoppins, S., Lackner, L. & Nunnari, J. The machines that divide and fuse mitochondria. Annu. Rev. Biochem. 76, 751–780 (2007).
5. Twig, G., Hyde, B. & Shirihai, O. S. Mitochondrial fusion, fission and autophagy as a quality control axis: the bioenergetic view.
Biochim. Biophys. Acta 1777, 1092–1097 (2008).
6. Gomes, L. C. & Scorrano, L. High levels of Fis1, a pro-fission mitochondrial protein, trigger autophagy. Biochim. Biophys. Acta
1777, 860–866 (2008).
7. Malena, A., Loro, E., Di Re, M., Holt, I. J. & Vergani, L. Inhibition of mitochondrial fission favours mutant over wild-type mito-
chondrial DNA. Hum. Mol. Genet. 18, 3407–3416 (2009).
8. Suen, D. F., Narendra, D. P., Tanaka, A., Manfredi, G. & Youle, R. J. Parkin overexpression selects against a deleterious mtDNA
mutation in heteroplasmic cybrid cells. Proc. Natl. Acad. Sci. USA 107, 11835–11840 (2010).
9. Partikian, A., Olveczky, B., Swaminathan, R., Li, Y. & Verkman, A. S. Rapid diffusion of green fluorescent protein in the mitochon-
drial matrix. J. Cell Biol. 140, 821–829 (1998).
10. Ono, T., Isobe, K., Nakada, K. & Hayashi, J. I. Human cells are protected from mitochondrial dysfunction by complementation of
DNA products in fused mitochondria. Nat. Genet. 28, 272–275 (2001).
11. Busch, K. B., Bereiter-Hahn, J., Wittig, I., Schagger, H. & Jendrach, M. Mitochondrial dynamics generate equal distribution but
patchwork localization of respiratory complex I. Mol. Membr. Biol. 23, 509–520 (2006).
12. Horbay, R. & Bilyy, R. Mitochondrial dynamics during cell cycling. Apoptosis 21, 1327–1335 (2016).
13. Frank, S. et al. The role of dynamin-related protein 1, a mediator of mitochondrial fission, in apoptosis. Dev. Cell 1, 515–525 (2001).
14. Nunnari, J. & Suomalainen, A. Mitochondria: in sickness and in health. Cell 148, 1145–1159 (2012).
15. Anzell, A. R., Maizy, R., Przyklenk, K. & Sanderson, T. H. Mitochondrial quality control and disease: insights into ischemia-
reperfusion injury. Mol. Neurobiol. 55, 2547–2564 (2018).
16. Margineantu, D. H. & Hockenbery, D. M. Mitochondrial functions in stem cells. Curr. Opin. Genet. Dev. 38, 110–117 (2016).
17. Wai, T. & Langer, T. Mitochondrial dynamics and metabolic regulation. Trends Endocrinol. Metab. 27, 105–117 (2016).
18. Youle, R. J. & van der Bliek, A. M. Mitochondrial fission, fusion, and stress. Science 337, 1062–1065 (2012).
19. Kumar, R. et al. Mitochondrial dynamics following global cerebral ischemia. Mol. Cell Neurosci. 76, 68–75 (2016).
20. Tang, J., Hu, Z., Tan, J., Yang, S. & Zeng, L. Parkin protects against oxygen-glucose deprivation/reperfusion insult by promoting
Drp1 degradation. Oxid. Med. Cell Longev. 2016, 8474303 (2016).
21. Prieto, J. et al. Early ERK1/2 activation promotes DRP1-dependent mitochondrial fission necessary for cell reprogramming. Nat.
Commun. 7, 11124 (2016).
22. Molina, A. J. et al. Mitochondrial networking protects beta-cells from nutrient-induced apoptosis. Diabetes 58, 2303–2315 (2009).
23. Zahedi, A. et al. Deep analysis of mitochondria and cell health using machine learning. Sci. Rep. 8, 16354 (2018).
24. Reis, Y. et al. Multi-parametric analysis and modeling of relationships between mitochondrial morphology and apoptosis. PLoS
ONE 7, e28694 (2012).
25. Giedt, R. J. et al. Computational imaging reveals mitochondrial morphology as a biomarker of cancer phenotype and drug response.
Sci. Rep. 6, 32985 (2016).
26. Leonard, A. P. et al. Quantitative analysis of mitochondrial morphology and membrane potential in living cells using high-content
imaging, machine learning, and morphological binning. Biochim. Biophys. Acta 1853, 348–360 (2015).
27. Kislin, M. et al. Reversible disruption of neuronal mitochondria by ischemic and traumatic injury revealed by quantitative two-
photon imaging in the neocortex of anesthetized mice. J. Neurosci. 37, 333–348 (2017).
28. Schindelin, J. et al. Fiji: an open-source platform for biological-image analysis. Nat. Methods 9, 676–682 (2012).
29. Kuhn, M. Building predictive models in R using the caret package. J. Stat Softw. 28, 1–26 (2008).
30. R Core Team. R: A Language and Environment for Statistical Computing. R Foundation for Statistical Computing, Vienna, Austria
(accessed 27 Jan 2020, 2019). https://www.R-project.org/.
31. Lee, H. & Yoon, Y. Mitochondrial membrane dynamics-functional positioning of OPA1. Antioxidants (Basel) 7, 186 (2018).
32. MacVicar, T. & Langer, T. OPA1 processing in cell death and disease—the long and short of it. J. Cell Sci. 129, 2297–2306 (2016).
33. Duvezin-Caubet, S. et al. Proteolytic processing of OPA1 links mitochondrial dysfunction to alterations in mitochondrial mor-
phology. J. Biol. Chem. 281, 37972–37979 (2006).
34. Piquereau, J. et al. Down-regulation of OPA1 alters mouse mitochondrial morphology, PTP function, and cardiac adaptation to
pressure overload. Cardiovasc. Res. 94, 408–417 (2012).
35. Ishihara, N., Fujita, Y., Oka, T. & Mihara, K. Regulation of mitochondrial morphology through proteolytic cleavage of OPA1.
EMBO J. 25, 2966–2977 (2006).
36. Cho, B., Choi, S. Y., Cho, H. M., Kim, H. J. & Sun, W. Physiological and pathological significance of dynamin-related protein 1
(drp1)-dependent mitochondrial fission in the nervous system. Exp. Neurobiol. 22, 149–157 (2013).
37. Reddy, P. H. et al. Dynamin-related protein 1 and mitochondrial fragmentation in neurodegenerative diseases. Brain Res. Rev. 67,
103–118 (2011).
38. Rambold, A. S., Kostelecky, B., Elia, N. & Lippincott-Schwartz, J. Tubular network formation protects mitochondria from
autophagosomal degradation during nutrient starvation. Proc. Natl. Acad. Sci. USA 108, 10190–10195 (2011).
39. Mishra, J. et al. Cyclosporin A increases mitochondrial buffering of calcium: an additional mechanism in delaying mitochondrial
permeability transition pore opening. Cells 8, 1052 (2019).
40. Kwong, J. Q. & Molkentin, J. D. Physiological and pathological roles of the mitochondrial permeability transition pore in the heart.
Cell Metab. 21, 206–214 (2015).
41. Park, J. Y. et al. Mitochondrial swelling and microtubule depolymerization are associated with energy depletion in axon degenera-
tion. Neuroscience 238, 258–269 (2013).
42. Minamikawa, T., Williams, D. A., Bowser, D. N. & Nagley, P. Mitochondrial permeability transition and swelling can occur revers-
ibly without inducing cell death in intact human cells. Exp. Cell Res. 246, 26–37 (1999).
43. Kobayashi, T. et al. Calcium-induced mitochondrial swelling and cytochrome c release in the brain: its biochemical characteristics
and implication in ischemic neuronal injury. Brain Res. 960, 62–70 (2003).
44. Li, J. et al. Reperfusion promotes mitochondrial dysfunction following focal cerebral ischemia in rats. PLoS ONE 7, e46498 (2012).
45. Lemasters, J. J., Theruvath, T. P., Zhong, Z. & Nieminen, A. L. Mitochondrial calcium and the permeability transition in cell death.
Biochim. Biophys. Acta 1787, 1395–1401 (2009).
46. Liu, X., Xu, S., Wang, P. & Wang, W. Transient mitochondrial permeability transition mediates excitotoxicity in glutamate-sensitive
NSC34D motor neuron-like cells. Exp. Neurol. 271, 122–130 (2015).
47. Brustovetsky, T., Li, V. & Brustovetsky, N. Stimulation of glutamate receptors in cultured hippocampal neurons causes Ca2+-
dependent mitochondrial contraction. Cell Calcium 46, 18–29 (2009).
48. Zazueta, C., Sosa-Torres, M. E., Correa, F. & Garza-Ortiz, A. Inhibitory properties of ruthenium amine complexes on mitochondrial
calcium uptake. J. Bioenerg. Biomembr. 31, 551–557 (1999).
49. Zhao, L., Li, S., Wang, S., Yu, N. & Liu, J. The effect of mitochondrial calcium uniporter on mitochondrial fission in hippocampus
cells ischemia/reperfusion injury. Biochem. Biophys. Res. Commun. 461, 537–542 (2015).
Scientific Reports | (2021) 11:5133 | https://doi.org/10.1038/s41598-021-84528-8 11
Vol.:(0123456789)www.nature.com/scientificreports/
50. Crompton, M., Ellinger, H. & Costi, A. Inhibition by cyclosporin A of a Ca2+-dependent pore in heart mitochondria activated by
inorganic phosphate and oxidative stress. Biochem. J. 255, 357–360 (1988).
51. Broekemeier, K. M., Dempsey, M. E. & Pfeiffer, D. R. Cyclosporin A is a potent inhibitor of the inner membrane permeability
transition in liver mitochondria. J. Biol. Chem. 264, 7826–7830 (1989).
52. Halestrap, A. P., Connern, C. P., Griffiths, E. J. & Kerr, P. M. Cyclosporin A binding to mitochondrial cyclophilin inhibits the
permeability transition pore and protects hearts from ischaemia/reperfusion injury. Mol. Cell. Biochem. 174, 167–172 (1997).
53. Cereghetti, G. M. et al. Dephosphorylation by calcineurin regulates translocation of Drp1 to mitochondria. Proc. Natl. Acad. Sci.
USA 105, 15803–15808 (2008).
54. Kowaltowski, A. J. et al. Mitochondrial morphology regulates organellar Ca. FASEB J. 33, 13176–13188 (2019).
55. Legland, D., Arganda-Carreras, I. & Andrey, P. MorphoLibJ: integrated library and plugins for mathematical morphology with
ImageJ. Bioinformatics 32, 3532–3534 (2016).
56. Arganda-Carreras, I. et al. Trainable Weka segmentation: a machine learning tool for microscopy pixel classification. Bioinformatics
33, 2424–2426 (2017).
57. Kan, A. Machine learning applications in cell image analysis. Immunol. Cell Biol. 95, 525–530 (2017).
58. Wakabayashi, J. et al. The dynamin-related GTPase Drp1 is required for embryonic and brain development in mice. J. Cell Biol.
186, 805–816 (2009).
59. Varanita, T. et al. The OPA1-dependent mitochondrial cristae remodeling pathway controls atrophic, apoptotic, and ischemic
tissue damage. Cell Metab. 21, 834–844 (2015).
60. Reza, A. M. Realization of the contrast limited adaptive histogram equalization (CLAHE) for real-time image enhancement. J.
VLSI Sig. Proc. Syst. 38, 35–44 (2004).
61. Sanabria, C. & Lee, P. J. In Handbook of Superconducting Materials (ed. Cardwell, D. A.) (Taylor and Francis, 2003).
62. Ollion, J., Cochennec, J., Loll, F., Escudé, C. & Boudier, T. TANGO: a generic tool for high-throughput 3D image analysis for
studying nuclear organization. Bioinformatics 29, 1840–1841 (2013).
Acknowledgements
This work was supported by the U.S. National Institutes of Health Grants R01 NS091242 (T.H.S.), R42105237
(T.H.S.), National Science Foundation GRFP Grant 1256260 (G.M.F.), and American Heart Association Grants
19SFRN3483008 (R.W.N. and T.H.S.), 19POST34380608 (K.J.M., and T.H.S.), and 19POST34380705 (J.M.W.
and T.H.S.).Any opinions, findings, and conclusions or recommendations expressed in this material are those
of the authors and do not necessarily reflect the views of the U.S. National Institutes of Health, National Science
Foundation, or American Heart Association. We would like to thank Renovo Neural Inc. for their contributions
with SBF-SEM image acquisition.
Author contributions
G.M.F., A.R.A., and T.H.S. conceived the study. K.P and R.W.N. assisted with study design, G.M.F., A.R.A.,
S.R., K.J.E, J.M.W., and T.D.B. performed primary neuron experiments and image analysis. G.M.F., A.R.A., and
K.J.E. developed the analysis pipeline, T.H.S., K.J.M, J.M.W, and M.J.B. performed and analyzed the in vivo brain
experiments. G.M.F, A.R.A, and T.H.S. wrote the manuscript, assisted by S.R, K.J.M, J.M.W., T.D.B, M.J.B, K.P,
and R.W.N.
Competing interests
The authors declare no competing interests.
Additional information
Supplementary Information The online version contains supplementary material available at https://doi.
org/10.1038/s41598-021-84528-8.
Correspondence and requests for materials should be addressed to T.H.S.
Reprints and permissions information is available at www.nature.com/reprints.
Publisher’s note Springer Nature remains neutral with regard to jurisdictional claims in published maps and
institutional affiliations.
Open Access This article is licensed under a Creative Commons Attribution 4.0 International
License, which permits use, sharing, adaptation, distribution and reproduction in any medium or
format, as long as you give appropriate credit to the original author(s) and the source, provide a link to the
Creative Commons licence, and indicate if changes were made. The images or other third party material in this
article are included in the article’s Creative Commons licence, unless indicated otherwise in a credit line to the
material. If material is not included in the article’s Creative Commons licence and your intended use is not
permitted by statutory regulation or exceeds the permitted use, you will need to obtain permission directly from
the copyright holder. To view a copy of this licence, visit http://creativecommons.org/licenses/by/4.0/.
© The Author(s) 2021
Scientific Reports | (2021) 11:5133 | https://doi.org/10.1038/s41598-021-84528-8 12
Vol:.(1234567890)You can also read