Quantitative, super-resolution localization of small RNAs with sRNA-PAINT
←
→
Page content transcription
If your browser does not render page correctly, please read the page content below
Published online 27 July 2020                                                             Nucleic Acids Research, 2020, Vol. 48, No. 16 e96
                                                                                                                   doi: 10.1093/nar/gkaa623

Quantitative, super-resolution localization of small
RNAs with sRNA-PAINT
Kun Huang1,2 , Feray Demirci3 , Mona Batish4 , Wayne Treible5 , Blake C. Meyers                                                       6,7,*
                                                                                                                                              and
Jeffrey L. Caplan 1,2,*
1
  Department of Plant and Soil Sciences, University of Delaware, Newark, DE 19716, USA, 2 Bio-Imaging Center,
Delaware Biotechnology Institute, University of Delaware, Newark, DE 19716, USA, 3 FiDoSoft Software Consulting,
Redmond, WA 98052, USA, 4 Department of Medical and Molecular Sciences, University of Delaware, Newark, DE
19716, USA, 5 Department of Computer and Information Sciences, University of Delaware, Newark, DE 19716, USA,

                                                                                                                                                              Downloaded from https://academic.oup.com/nar/article/48/16/e96/5876683 by guest on 29 October 2020
6
  Donald Danforth Plant Science Center, 975 North Warson Road, St. Louis, MO 63132, USA and 7 University of
Missouri – Columbia, Division of Plant Sciences, 52 Agriculture Lab, Columbia, MO 65211, USA

Received December 16, 2019; Revised June 24, 2020; Editorial Decision July 12, 2020; Accepted July 13, 2020

ABSTRACT                                                                        NAs) and small interfering RNAs (siRNAs) (2). miRNAs
                                                                                are derived from long, hairpin precursor RNAs processed
Small RNAs are non-coding RNAs that play important                              by precise cleavage, yielding mature miRNAs which influ-
roles in the lives of both animals and plants. They are                         ence gene transcript levels and translation (3). Plant siR-
21- to 24-nt in length and ∼10 nm in size. Their small                          NAs, also derived from long precursors that are made
size and high diversity have made it challenging to                             double-stranded by RNA-dependent RNA polymerases
develop detection methods that have sufficient res-                             (RDRPs), are processed into mature siRNAs, and regu-
olution and specificity to multiplex and quantify. We                           late gene transcript levels through post-transcriptional si-
created a method, sRNA-PAINT, for the detection of                              lencing, and epigenetically via RNA-directed DNA methy-
small RNAs with 20 nm resolution by combining the                               lation (RdDM) (4). Some plant miRNAs trigger phased,
super-resolution method, DNA-based points accu-                                 secondary siRNAs (phasiRNAs), which are either 21 or 24
mulation in nanoscale topography (DNA-PAINT), and                               nt in length (5–7). Anthers, the plant male reproductive or-
                                                                                gan, are a particularly rich source of miRNAs and phasiR-
the specificity of locked nucleic acid (LNA) probes
                                                                                NAs, well-described in grasses including maize (7); during
for the in situ detection of multiple small RNAs. The                           the meiotic stage, anthers are composed of cell layers that
method relies on designing probes to target small                               include the epidermis, endothecium, middle and tapetum,
RNAs that combine DNA oligonucleotides (oligos)                                 that all surround the pollen mother cells. In maize anthers,
for PAINT with LNA-containing oligos for hybridiza-                             the abundance and distribution of miRNAs and phasiR-
tion; therefore, we developed an online tool called                             NAs vary in different cell layers (7), and our interest in
‘Vetting & Analysis of RNA for in situ Hybridization                            the spatial organization and concentration of these sRNAs,
probes’ (VARNISH) for probe design. Our method uti-                             particularly at the subcellular level, provided us a strong
lizes advances in DNA-PAINT methodologies, includ-                              motivation to develop new methods for fluorescent detec-
ing qPAINT for quantification, and Exchange-PAINT                               tion.
for multiplexing. We demonstrated these capabilities                               sRNAs are mobile, moving within and between or-
                                                                                ganelles, from cell-to-cell, and long distances within an or-
of sRNA-PAINT by detecting and quantifying small
                                                                                ganism or even across organismal boundaries in plant–
RNAs in different cell layers of early developmental                            pathogen interactions (8). For example, within a cell, sR-
stage maize anthers that are important for male sex-                            NAs move between the nucleus and cytoplasm, bind Arg-
ual reproduction.                                                               onaute (AGO) proteins, locate to Dicing bodies (D-bodies),
                                                                                Cajal bodies (CBs), and may be polysome-associated or
INTRODUCTION                                                                    found with organelles such as the endoplasmic reticulum
                                                                                (9–12). Intercellular movement of sRNAs, presumably via
In plants, 21- to 24-nucleotide (nt), non-coding small RNAs                     plasmodesmata in plants, regulates tissue and organ devel-
(sRNAs) regulate many important biological processes (1).                       opment by silencing and regulating developmentally impor-
Plant and animal genomes encode various sRNAs that can                          tant genes (13). Systemic translocation of sRNAs has been
be divided into two major categories: microRNAs (miR-

* To
   whom correspondence should be addressed. Tel: +1 302 831 3403; Fax: +1 302 831 4841; Email: jcaplan@udel.edu
Correspondence may also be addressed to Blake C. Meyers. Tel: +1 314 587 1422; Email: bmeyers@danforthcenter.org


C The Author(s) 2020. Published by Oxford University Press on behalf of Nucleic Acids Research.
This is an Open Access article distributed under the terms of the Creative Commons Attribution License (http://creativecommons.org/licenses/by/4.0/), which
permits unrestricted reuse, distribution, and reproduction in any medium, provided the original work is properly cited.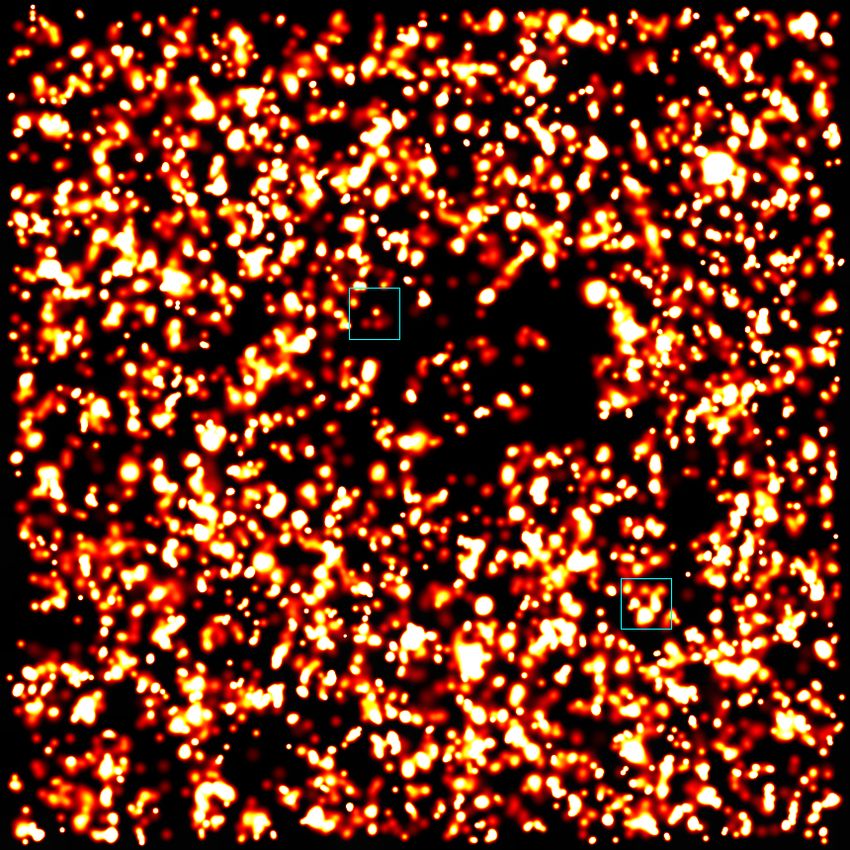
e96 Nucleic Acids Research, 2020, Vol. 48, No. 16 PAGE 2 OF 13
demonstrated by epigenetic silencing across graft junctions the high resolution and precise quantification of DNA-
and sRNA profiling of vasculature (8,14). Remarkably, sR- PAINT with the efficiency and specificity of LNA-based in
NAs also move between organisms at host–pathogen inter- situ hybridization. We created a probe design tool for our
faces (15). Pathogens, including parasitic plants, regulate method and show that these sRNA-PAINT probes can used
host defense responses via miRNAs and trans-species sR- for robust sRNA detection. And, we have demonstrated
NAs, and vice versa (16). In animals, extracellular vesicles that it can be combined with qPAINT to localize and quan-
(EVs) transport miRNAs from cell-to-cell and over long- tify distinct sRNAs in fixed biological sample, and with
distances (17). Plant EVs are populated with miRNAs as Exchange-PAINT for multiplexed target detection.
well as with fragments as small as 10–17 nt, so-called tiny
RNAs (2). All of these sRNAs vary in abundance from low
to extremely high, as measured by sequencing, which typi- MATERIALS AND METHODS
cally utilizes gram quantities of plant tissue, a process that Plant materials and oligonucleotides
substantially limits spatial analyses. At the subcellular level,
Maize anthers from W23 were provided by the Walbot lab
Downloaded from https://academic.oup.com/nar/article/48/16/e96/5876683 by guest on 29 October 2020
the localizations of these RNAs are not well-characterized.
Thus, future approaches to sRNA characterization will re- at Stanford University (Palo Alto, CA, USA). Plants were
quire nanometer resolution, high specificity, and both mul- grown in Palo Alto, CA under greenhouse conditions. An-
tiplexing and quantitative capabilities. ther dissection and measurements were performed as previ-
For in situ hybridization of sRNAs, the use of locked ously described (25). LNA-modified oligonucleotide probes
nucleic acid (LNA) oligonucleotide probes has shown were designed using our VARNISH software and synthe-
specificity and high fidelity (18). However, colorimetric sized by Exiqon (QIAGEN; Germantown, MD, USA). Im-
and even fluorescent localization of sRNAs using LNA- ager strands coupled with Alexa Fluor 647 (AF647) were
based methods are able to resolve only cell-level local- ordered from IDT (Coralville, IA, USA).
ization patterns. Because of the limits of light diffrac-
tion, light microscopy cannot resolve spots below ∼200 Sample preparation
nm in diameter and 400–700 nm in axial length (19).
New techniques have been developed to drive microscopic Sample preparation for in situ hybridization was performed
detection beyond the diffraction limit, yielding so-called as previously described (20). Briefly, anthers were dissected
‘super-resolution’ microscopy, such as Photo-Activated Lo- and fixed in a 50 ml tube using 4% paraformaldehyde in
calization Microscopy (PALM), Structured Illumination 1× PHEM buffer (5 mM HEPES, 60 mM PIPES, 10 mM
Microscopy (SIM), direct Stochastic Optical Reconstruc- EGTA, 2 mM MgSO4 at pH 7). Samples were then pro-
tion Microscopy (dSTORM) and Points Accumulation for cessed in a vacuum chamber (0.08 MPa) three times, 15
Imaging in Nanoscale Topography (PAINT) (19). We have min each. After fixation, samples were embedded in paraf-
previously demonstrated an sRNA-FISH method com- fin at the Histochemistry and Tissue Processing Core Lab
bined with SIM and dSTORM (20). However, dSTORM at Nemours/Alfred I. duPont Hospital for Children (Wilm-
utilizes the blinking property of fluorescent dyes and re- ington, DE, USA). Paraffin samples were sectioned at 6
lies on specific excitation and buffer conditions to achieve m thickness using a paraffin microtome and dried on a
proper imaging (21). Photoswitching of the dye molecule is Wide Spectral Band 600 ± 100 nm Gold Fiducials cover-
hard to predict, which made absolute quantification diffi- glass (600-100AuF; Hestzig LLC, Leesburg, VA, USA) at
cult using the dSTORM method. The number of dyes with 37◦ C on a slider warmer.
the appropriate photoswitching properties within the visi-
ble spectrum is also a limiting factor for multiplexed detec-
In situ hybridization
tion (21). DNA-PAINT decouples the blinking events from
dye photophysics, using the binding and dwelling kinetics The in situ hybridization step was performed following
of a short dye-labeled oligonucleotide ‘imager strand’ to lo- our previously-published protocol (20). Briefly, samples
calize target-specific ‘docking strands’ (22,23). The docking were de-paraffinized using Histo-Clear (item 50-899-90147;
strand in DNA-PAINT is linked to an antibody for single- Fisher Scientific, Pittsburgh, PA, USA) and re-hydrated by
molecule protein detection, with imager strands introduced going through an ethanol series of 95, 80, 70, 50, 30, 10%
by perfusion, one imager strand at a time, each specific to (vol/vol) and water (1 min) at room temperature. Then sam-
a given docking strand and protein. After the image is ac- ples were treated with protease (item P5147; Sigma-Aldrich,
quired, the imager strand is washed off and then the next St. Louis, MO, USA) for 20 min at 37◦ C. Excess formalde-
imager strand is introduced (21). As a result, a single dye hyde background was removed by treating samples with
can be linked to different imager strands and applied for de- 0.2% glycine (item G8898; Sigma-Aldrich) for 20 min. After
tection of numerous protein targets via use of different im- two washes in 1× PBS buffer (phosphate-buffered saline),
ager strand-docking strand combinations. This multiplex- samples were dehydrated by going through an ethanol se-
ing technique, known as ‘Exchange-PAINT’ has been used ries of 10, 30, 50, 70, 80, 95% and 100% (vol/vol). Hy-
for in situ imaging of protein targets, such as microtubules bridization was done with 10 M probe at 53.3◦ C in a hy-
and mitochondria (23), and in vitro profiling of miRNAs bridization oven. After hybridization, samples were washed
using barcoded synthetic DNA origami (24). twice with 0.2× SSC buffer (saline-sodium citrate). To im-
To achieve subcellular, nanometer resolution imaging for mobilize the hybridized probes, samples were incubated
the localization and analysis of sRNAs, we created a detec- for 10 min in freshly prepared EDC solution containing
tion method called sRNA-PAINT. This method combines 0.13 M 1-methylimidazole, 300 nM NaCl (pH 8.0). Then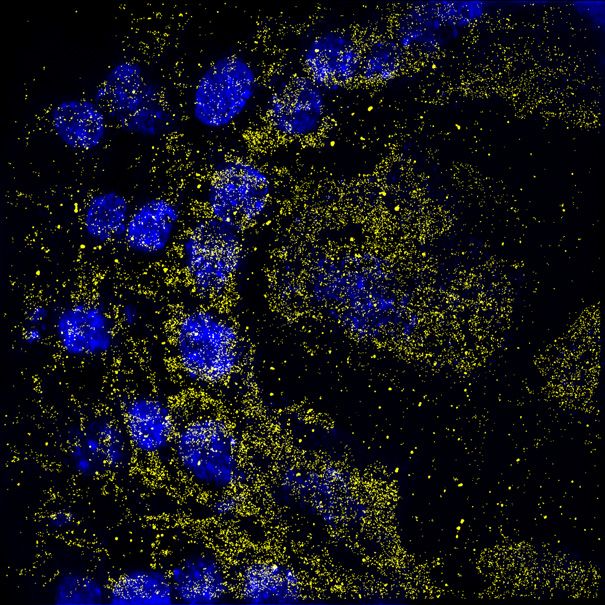
PAGE 3 OF 13 Nucleic Acids Research, 2020, Vol. 48, No. 16 e96
samples were incubated for 1 h and 15 min in 0.16 M N- probes were mixed together and hybridized to the tissue si-
(3-dimethylaminopropyl)-N’-ethylcarbodiimide hydrochlo- multaneously overnight at 53.3◦ C in a hybridization oven.
ride (EDC) (item 03450, Sigma-Aldrich, St. Louis, MO) so- The probes were washed off with 0.2× SSC buffer the next
lution. Slides then were washed twice in TBS solution, 10 morning, and stored in 1× PBS buffer till imaging. DAPI
min each wash. Hybridized samples were kept in 1× TBS (4 ,6-diamidino-2-phenylindole) stained nuclei images were
at 4◦ C until imaging. smFISH was carried out as previ- taken after Exchange-PAINT. Alignment of channels were
ously described (26). Thirty-five probes were used to detect done using TrakEM2 package of ImageJ (27). Probes used
the PHAS precursor lncRNA, as shown in Supplementary for multiplexed detection are listed in Supplementary Table
Table S2. Quantification of smFISH was processed using S1.
SpotCounter program in ImageJ. Three different spots from
each layer, were used for quantification, which were the ex-
Quantification of sRNA-qPAINT with Picasso software
act same locations used in qPAINT quantification for direct
comparison. qPAINT data analysis was performed following the proto-
Downloaded from https://academic.oup.com/nar/article/48/16/e96/5876683 by guest on 29 October 2020
col by Schnitzbauer et al. (21) and using the Picasso soft-
Super-resolution imaging and image reconstruction ware package. In brief, 8000 frames of the raw movie file
of PAINT data were processed with ‘Picasso: Localize’. We
Super-resolution imaging was carried out on an inverted adjusted the threshold until only the PAINT spots were
Zeiss Elyra PS.1 super-resolution microscope (Carl Zeiss, detected and selected (13 000 Min Net Gradient was cho-
Lberkochen, Germany). TIRF illumination was done using sen for this manuscript). After ‘Localize (Identify & Fit)’,
a 100% 642 nm laser and ␣-Plan-Apochromat 100×/1.46 a .hdf5 file was generated and this was used as the input
oil objective. For each imager strand, as well as control im- for the next module. The .hdf5 file was opened in ‘Picasso:
ager strand, images were taken with an exposure time of Render’, and marker-based drift correction or redundant
100 ms, an EMCCD Gain 30 and 20 000 frames in total. cross-correlative drift correction was performed. We picked
Each image was analyzed and rendered in Zen software a 3.18 m (20 pixel) diameter circle in the cytoplasm of each
(Carl Zeiss Inc., Thornwood, NY, USA). The images were anther cell layer using ‘Tools: Pick’ and then performed
processed using the following identical parameters: Ignore qPAINT analysis with Picasso. The copy number in these
overlapping molecules; Peak Mask Size (6.0); Peak Inten- picked regions of each cell in each layer was used to cal-
sity to Noise (6.0); Fit model (x,y 2D Gauss Fit). Drift cor- culate the number of binding sites in 63.25 m2 , which
rection was done using fiducial-based algorithm. For im- is roughly the area of the cytoplasm of cells in our sec-
age rendering, pixel resolution was set to 16 nm/pixel and tions. The influx rate was calculated using the formula, ξ =
2 nm/pixel for zoomed in images with 1× and 0.5× PSF kon × c, in which kon represented the association constant
(point spread function) expansion factor. The number of of the imager strand (1.5 × 10⁶ (M s)−1 ), and c represented
photons was selected between 420 and 10,000 to eliminate the concentration of the imager strand. The dark time un-
non-specific background. der ‘View: Show info’ and the calculated influx rate were
used to calculate binding sites. A total of 150 sample ar-
sRNA-PAINT eas across three biological replicates were used to determine
A DH40iL culture dish incubate system (model 640388; the background binding number. We observed 5.12 back-
Warner Instruments LLC, Hamden, CT, USA) and a ground binding sites for scrambled control LNA probe. As
quick release magnetic chamber for 25 mm low pro- a result, the 5.12 background binding sites were subtracted
file, round coverglasss (model 641943; Warner Instruments from all other qPAINT quantifications. For each sample, 10
LLC) were assembled and used as the perfusion chamber. locations for each cell layer were used to calculate the bind-
A ValveLink8.2 Perfusion System (AutoMate Scientific, ing sites.
Berkeley, CA, USA) was used for perfusing buffer and im-
ager strand solutions and washing solution into the cham- Colocalization analysis
ber. ValveLink 8.2 perfusion system is a gravity force-driven
perfusion system. We used a working height about 15 cm Small RNA colocalization analyses were carried out us-
above the imaging chamber. All imager strands were diluted ing Clus-DoC colocalization software, which is designed
to 0.5-2 nM in buffer C (1× PBS, 500 mM NaCl, pH 8). for single-molecule localization microscopy data (28). Five
Images were taken with constant flow of imager strand so- thousand images from each small RNA localization image
lution. A Masterflex C/L peristaltic pump (60 RPM, model were taken for analysis. Image alignment was done with
77120-62; Cole-Parmer Instrument Company LLC, Vernon fiducials in Zen software (Carl Zeiss Inc., Thornwood, NY,
Hills, IL, USA) was used to constantly collect the waste USA). As part of the ClusDoC co-clustering analysis, each
buffer flow at maximum speed. pair of small RNA images were clustered using DBSCAN.
A minimum cluster size of three points and an epsilon ra-
dius of 200 nm (with 40 nm histogram-smoothed contours)
sRNA-Exchange-PAINT
were manually tuned to produce the most accurate clus-
For multiplexed detection, all the probes were designed with tering of small RNA with DBSCAN in individual images.
VARNISH tool by picking different docking and imager Colocalization analysis in ClusDoC was performed by cal-
strand combinations. Following the same in situ hybridiza- culating and comparing the density distributions of pair-
tion procedure as described earlier, each probe was dena- wise points between channels. For this analysis, a large max-
tured in an individual tube. After chilling on ice, all the imum radius (Rmax) of 2500 nm and a step size of 10 nm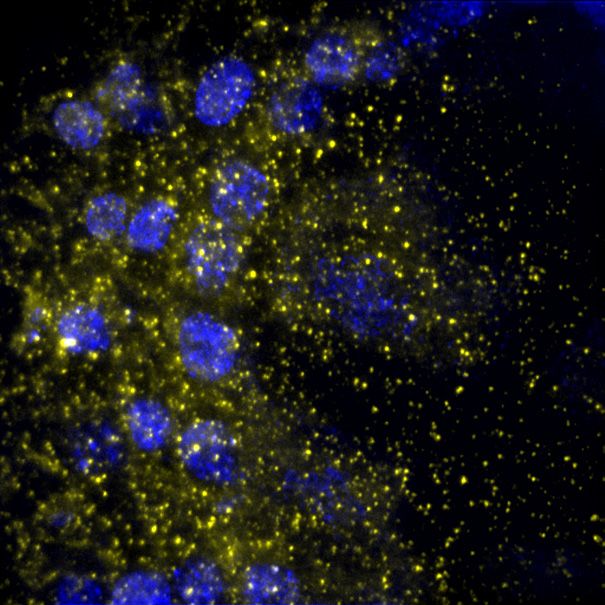
e96 Nucleic Acids Research, 2020, Vol. 48, No. 16                                                                 PAGE 4 OF 13

were selected for the calculation of the discrete distributions   strand can be either chosen from a drop down menu con-
due to the density of the dataset.                                taining the 13 previously used docking strands (23) or the
                                                                  sequence can be entered manually in the VARNISH tool.
                                                                  The software will conduct a homo-dimer and secondary
Small RNA library and data handling                               structure analysis from all, or a subset of, the 13 provided
The details of the library are as follows: it is a maize small    docking strands in combination with the linker and the top
RNA library with GEO accession number GSM1262527                  200 probe backbone candidates. These two steps are per-
that includes 24,145,201 genome-matched reads between             formed by using the ‘SelfDimer’ and ‘UNAFoldRun’ func-
the sizes of 18 and 34 nt. After removing adapters and low-       tions from the IDT web API. Finally, the algorithm will
quality reads, small RNA reads length between 18 and 34           choose the top 10 candidates for each docking stand with
nt were mapped back to the reference genome of maize, ver-        the highest Tm and lowest G for homo-dimer and sec-
sion AGPv4 (29). Abundances of small RNAs were normal-            ondary structure predictions. Once the computations are
ized to ‘TP10M’ (transcripts per 10 million) based on the         complete, VARNISH will send an email message containing

                                                                                                                                    Downloaded from https://academic.oup.com/nar/article/48/16/e96/5876683 by guest on 29 October 2020
total count of genome-matched reads in the library.               a weblink to an output page that lists the 10 top probe can-
                                                                  didates and information on ordering both the probes and
                                                                  their corresponding imager strands.
sRNA sequences
All small RNA probe sequences and imager strands used             sRNA-PAINT detects and quantifies cellular sRNAs at single
are listed in Supplementary Table S1.                             molecule resolution
                                                                  Figure 1B shows the general process for the sRNA-PAINT
RESULTS                                                           method. First, the samples were fixed, embedded in paraf-
                                                                  fin, and sectioned. Then, thin sections were placed onto
sRNA-PAINT probe design
                                                                  coverglass with gold fiducials sealed with silicon dioxide
Most eukaryotic sRNA sequences are between 21 and 24              (SiO2 ). The gold fiducials were used as alignment land-
nt in length. To perform sRNA-PAINT, we designed a                marks for image registration over time and after buffer ex-
probe that is composed of three sequences: the probe back-        changes. We highly recommend that no additional coat-
bone sequence with LNA bases, the DNA-PAINT dock-                 ings are added, such as poly-l-lysine, since they resulted in
ing strand sequence, and a linker sequence that connects          non-specific binding. Next, during the hybridization pro-
those two (Figure 1). The probe design is the most criti-         cess, probes are applied to fixed and sectioned samples (Fig-
cal step of the sRNA-PAINT method; to facilitate this pro-        ure 1B). Excess probes are removed in the washing process.
cess, we created an online tool called VARNISH (Vetting           Afterward, imager strands are perfused in. When the un-
& Analysis of RNA for in situ Hybridization probes) for           annealed imager strands flow within the buffer, the speed of
automated design of sRNA-PAINT probes (https://wasabi.            the movement is too fast to be caught by the microscope.
ddpsc.org/~apps/varnish/). The tool requires the input of         However, when an imager strand finds its docking partner,
a target sRNA sequence and the hybridization parame-              and dwells on it, the short time period before the imager
ters (defaults provided), including sodium (50 mM), mag-          strand dissociates from the docking creates a blinking event
nesium (0 mM) and temperature (25◦ C). VARNISH first              that can be detected using a total internal reflection fluores-
will reverse complement the sRNA sequence and will then           cence microscope (TIRFM). As a result, when thousands of
choose between 19 and 22 nt of the sequence such that the         these blink events are collected, detection of all the docking
melting point temperature (Tm ) is lower than 60◦ C, with         sites within the sample is eventually completed, defining the
preference for lower Tm values for the longest sequence           locations of the sRNA targets.
length. The melting temperature is calculated by using the              For sRNA-PAINT probe labeling, we selected Alexa
‘Analyze’ function from the IDT web application program           Fluor 647 dye (AF647). First, AF647 emits far-red fluo-
interface (API) (https://www.idtdna.com/AnalyzerService/          rescence that is distinct from tissue autofluorescence; sec-
AnalyzerService.asmx). The final sequence is the probe            ond, its photophysical property made it a dye suitable for
backbone (Figure 1, cyan). Next, LNA bases and a linker           generating quality super-resolution images (31). The sRNA
sequence are introduced to the selected probe backbone by         probes designed by VARNISH were hybridized and the cov-
VARNISH. The default linker sequence is ‘tattcgt’, which          erglass was mounted in a perfusion chamber. The corre-
has no match to the sRNA sequences in miRBase, but                sponding, 3 -dye-labeled imager strands were continuously
which can be changed to any desired custom linker se-             perfused and imaging was conducted using TIRFM. As a
quence. VARNISH introduces between five and nine LNA              demonstration, we performed sRNA-PAINT on an abun-
bases (default is eight) and it avoids stretches of more than     dant 24-nt phasiRNA – a class of plant secondary siR-
four LNA bases and three or more Gs or Cs. The algo-              NAs abundant in the early developmental stages of maize
rithm exhausts all the possible combinations of the posi-         anthers (7) (Figure 2); the 24-nt phasiRNAs are triggered
tions for LNA bases, and it calculates the approximate Tm         by an miRNA, miR2275, providing us with two different
using previously estimated Tm values for different LNAs           classes of small RNAs in one tissue. Our sRNA-PAINT
(30). Next, VARNISH takes the top 200 probe backbone              experiment (Figure 2A) was consistent with our previous
candidates with the highest Tm and calculates the exact Tm        findings that the 24-nt phasiRNA was present in all of the
using the IDT web API. The last step is to add the DNA-           anther cell layers, and most abundant in the tapetum layer
PAINT docking strand. In the VARNISH tool, the docking            and pollen mother cells (7); however, our, sRNA-PAINT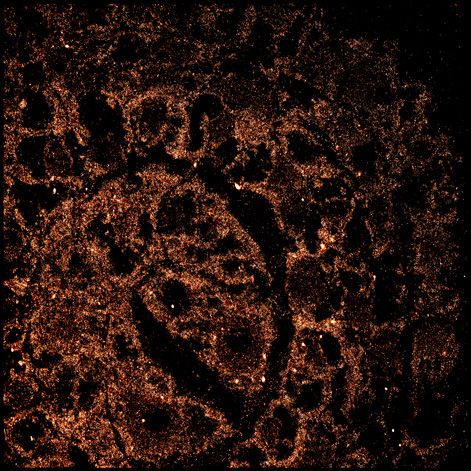
PAGE 5 OF 13 Nucleic Acids Research, 2020, Vol. 48, No. 16 e96
A Imager strand
fluorophore
Probe
imager strand
docking strand
probe backbone
LNA bases
linker
target sRNA
target sRNA
Downloaded from https://academic.oup.com/nar/article/48/16/e96/5876683 by guest on 29 October 2020
B Image
I
Imager strand
stra
t annd
Embed
Section Hybridize
+ EDC lock
Figure 1. Illustration of sRNA-PAINT probe design and workflow. (A) Illustration of a VARNISH probe design. A VARNISH probe is comprised of three
parts: a probe backbone (cyan) that is complementary to the target sRNA (orange), a docking strand (green) and a linker sequence (dark blue) connecting
them. The imager strand is conjugated to the fluorophore, and it will find its corresponding docking strand during the imaging process. (B) A workflow for
sRNA-PAINT. Samples were fixed and embedded, and a thin section is placed on the coverglass. During the hybridization process, the VARNISH probes
will bind to sRNAs in the sample and then locked with EDC. During the imaging step, imager strands are added to the probe-hybridized sample on the
coverglass.
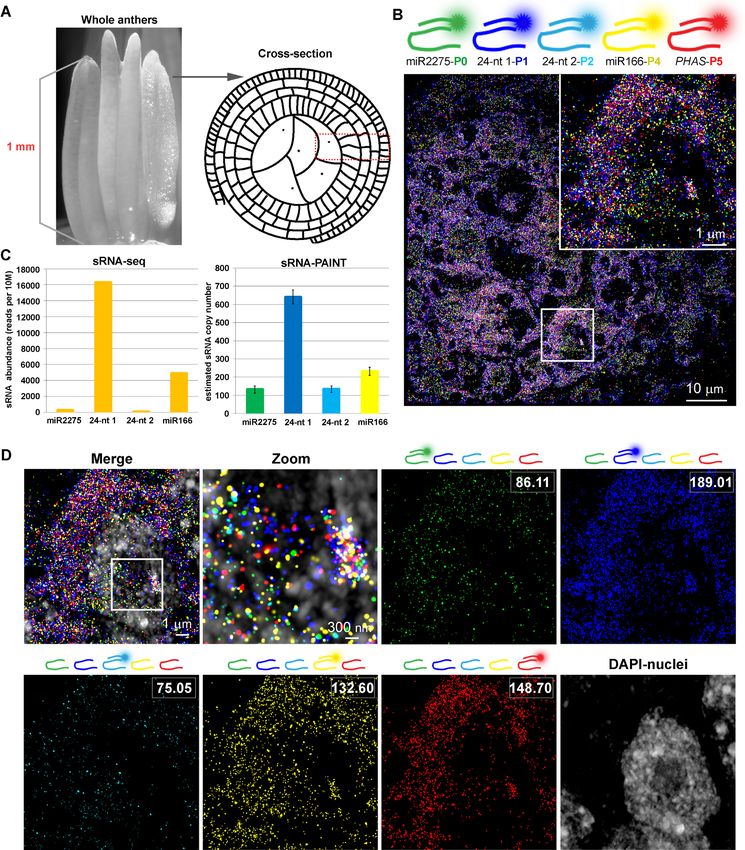
approach achieved a much higher resolution of below 20 with the 2-nt mutation detected very low background signal
nm (Figure 2B). compared with the original probe, resulting in an average of
qPAINT can count molecules by analyzing the pre- 95% decrease of the detected spots. Second, we confirmed
dictable and programmable binding kinetics of the imager that LNA is essential for efficient detection of small RNA
strand to the docking strand (22). This quantitative method targets (18). We found that without LNA, the signal inten-
is based solely on binding kinetics, and therefore, individ- sity is much lower compared with probes with LNA (Fig-
ual molecules do not need to be resolved. The Picasso soft- ure 2) and nearly a 92% reduction in binding sites quan-
ware is publicly available and can perform this calculation tified by qPAINT (Supplementary Figure S2). The scram-
for the binding sites within a selected region (21). We then bled, control LNA probe detected very little background
performed qPAINT analysis on 24-nt phasiRNA with Pi- fluorescence (Supplementary Figure S1).
casso. As shown in Figure 2C, we detected 44.09 copies After the first round of imaging, buffer was perfused
of 24-nt phasiRNA per selected region per cell in epider- into the imaging chamber, and the signal was diminished
mal cells, 56.13 copies in endothecium cells, 86.93 copies rapidly within 1 min, suggesting that stripping off the im-
in middle layer cells, 179.42 copies in pollen mother cells, ager strand is very efficient. Next, sRNA-PAINT signal was
and most abundant, 183.61 copies in tapetal cells. These re-achieved by re-applying the imager strands (Figure 3A).
copy number values are minus the background detected in We used EDC (1-ethyl-1-(3-dimethylaminopropyl) carbodi-
the scrambled LNA control probe that was calculated to be imide) prior to imaging in order to cross-link and immo-
5.12 binding sites using 150 regions of images from three bi- bilize the probes to prevent probe stripping during wash
ological replicates (Supplementary Figure S1). The scram- steps (32). After EDC treatment, the signal intensity in the
bled LNA probe used to estimate the non-specific binding re-imaged sample was comparable with the original im-
of LNA probes has no similarity with maize small RNAs. age (Figure 3A) and there was no significant difference in
Pollen mother cells and tapetum have a greater abundance quantified the number of binding sites (Figure 3B). Without
of the 24-nt phasiRNA compared with the other cell layers. EDC, there was a decrease in image intensity after washing,
qPAINT, in combination with sRNA-PAINT, enabled the as shown in Figure 3A and quantified in Figure 3B. The
detection of the copy number of sRNAs in cell sections and number of localization spots detected remain relatively sta-
the sRNA targets in the different cell layers. ble during the imaging process of 20,000 frames for sam-
Next, we tested the specificity of the VARNISH probes ples suggesting the signal loss was due to the wash step
and the essentiality of LNA bases. First, we tested the speci- (Supplementary Figure S3). We also confirmed that a differ-
ficity of the probe backbone by mutating two nucleotides ent imager strand had no or very little non-specific binding
in the 24-nt phasiRNA probe backbone. As shown in Fig- (Figure 3A), which is similar to the original DNA-PAINT
ure 2 and quantified in Supplementary Figure S2, the probe method (23).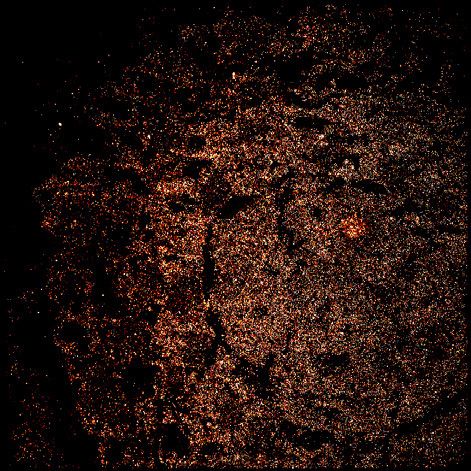
e96 Nucleic Acids Research, 2020, Vol. 48, No. 16 PAGE 6 OF 13
A VARNISH probe 2-nt mutations no LNA
box 1
box 2
10 μm
Downloaded from https://academic.oup.com/nar/article/48/16/e96/5876683 by guest on 29 October 2020
B box 1, enlarged box 2, enlarged
1 μm
50 nm 50 nm
C
binding site = 1
Epidermis 44.09
Endothecium 56.13
Middle layer 86.93
binding sites = 3
Tapetum 183.61
Pollen mother cells 179.42
0 50 100 150 200 250
Number of binding sites / cell
Figure 2. sRNA-PAINT detects 24 nt-phasiRNA specifically in an early-stage maize anther. (A) Detection of a 24-nt phasiRNA in a cross-section of
maize anther. The VARNISH probe and modified probes with either 2-nt mutations or the LNAs were applied to samples. 24-nt phasiRNA probes showed
signal while the mutation probe and no-LNA probe detected little to no signal. Scale bar = 10 m in all images. A red-to-white lookup table was used to
display low-to-high intensity values. Arrows indicate 2 out of ∼66 fiducials used in experiments. (B) Zoomed images of boxes 1 and 2 in panel A. There are
more 24-nt phasiRNA localization events in the pollen mother cells (box 1) compared to the epidermal layer (box 2). Expanded boxed areas (white) show
representative areas at higher magnification, with centroid positions shown in blue crosses. (C) qPAINT analysis of 24-nt phasiRNA in different anther
cell layers. Cartoon diagram representing each cell layer of a cross section of a maize anther lobe: epidermis (yellow), endothecium (green), middle layer
(red), tapetum (blue) and pollen mother cells (purple). Numbers shows the binding events for each cell in all cytoplasmic areas of different cell layers. 10
different locations in each specified cell layer of three biological replicates were taken for statistical analysis (n = 150). Error bar indicates standard error
for each sample.
Application of sRNA-PAINT in detecting lncRNAs (long the PHAS lncRNA. Subsequently, RDR6 and SGS3 con-
non-coding RNAs) vert the 3’ cleaved strand into double-stranded RNA
(dsRNA), perhaps via miRNA-loaded AGO1 protein (5,33)
sRNA-PAINT can also be applied in detecting longer RNA
(Figure 4A). As shown in Figure 4B, sRNA-PAINT de-
transcripts. To demonstrate this, we designed an sRNA-
tected PHAS lncRNA in all cell layers of premeiotic maize
PAINT VARNISH probe to detect the PHAS precursor
anther. We then compared our result with tradition single-
(a lncRNA) of the same 24-nt phasiRNA studied in Fig-
molecule fluorescent in situ hybridization (smFISH). sm-
ure 2. During the phasiRNA biogenesis, PHAS lncRNA
FISH showed a similar localization pattern with the sRNA-
appear to accumulate at low levels relative to their
PAINT method (Figure 4B), with slightly fewer binding
small RNA products in plants (7). It has been pro-
sites (Figure 4C). The sRNA-PAINT probe was designed
posed that AGO1-bound miR2275 directs cleavage of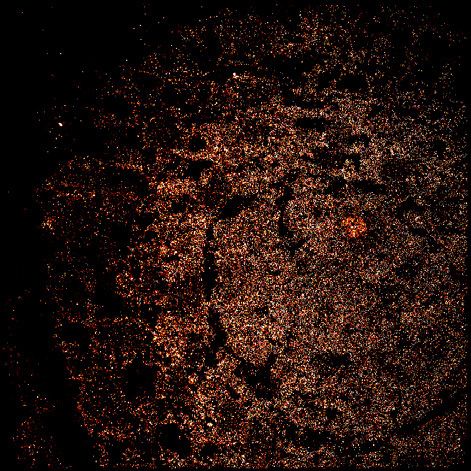
PAGE 7 OF 13 Nucleic Acids Research, 2020, Vol. 48, No. 16 e96
A Image Image Re-image
Re
e image
g Control
Non-specific
Non specific
Imager strand
stra
an Wash buffer Imager strand
st
stra
trran
imager
imager strand
wash
wa
ash
s
+ EDC
Downloaded from https://academic.oup.com/nar/article/48/16/e96/5876683 by guest on 29 October 2020
10 µm
no EDC
B
A
Pollen mother cells A n.s.
A
C
A
Tapetum A n.s.
A
C
B
All other cell layers B n.s.
B
D
0 50 100 150 200 250 300
Binding sites
Image (+EDC) Re-image (+EDC) Image (no EDC) Re-image (no EDC)
Figure 3. Comparison of sRNA-PAINT imaging and re-imaging with and without EDC treatment. (A) sRNA-PAINT imaging signal can be re-detected
to a similar level when treated with EDC. Without EDC treatment, re-imaged samples have lower fluorescence signal. A non-specific imager strand (last
column) was used as a control. Scale bar = 10 m in all images. We used the same anther section used in Figure 2. Arrows indicate 2 of the of ∼66 fiducials
used in experiments. (B) qPAINT analysis of image in panel A. Numbers shows the binding events for each cell in different cell layers. Ten different locations
in each specified cell layer were taken for statistical analysis. Error bars indicate standard error for each sample. Letters indicate significant differences using
Tukey’s test (P < 0.05, n = 50). No significant difference was observed in each cell layer during imaging and re-imaging in EDC treated samples.
5’ of the miR2275 cleavage site, and the 35 smFISH probes Sequential multiplexed imaging of phasiRNA biogenesis
were designed to span the entire PHAS lncRNA (omit- components using sRNA-Exchange-PAINT
ting the sRNA-PAINT probe sites). smFISH fluorescence
Sequential detection of sRNAs can be performed by mul-
was diffuse in the cytosol, while sRNA-PAINT fluores-
tiplexed VARNISH probes with different docking strand
cence appeared as discrete spots. We hypothesize that we
combinations. We name this technique sRNA-Exchange-
are detecting persistent 5’ degradation products that ap-
PAINT, as a variation of the protein-focused, multiplexed
pear as diffuse signal by smFISH due to a lack of mul-
Exchange-PAINT method. For this analysis, we measured
tiple probes to this smaller RNA degradation product
both miR2275 and the most abundant 24-nt phasiRNA
(Figure 4A).
it triggers, in maize anthers. As shown in Supplementary
e96 Nucleic Acids Research, 2020, Vol. 48, No. 16 PAGE 8 OF 13
A B sRNA-PAINT smFISH
PHAS lncRNA
M7G (AAA)n
cap
M7G
cap
PP (AAA)n
AGO1
miR2275
SGS3 (AAA)n
A RDR6
miRG2O1
275 dsRNA
5’ cleaved
portion C
Downloaded from https://academic.oup.com/nar/article/48/16/e96/5876683 by guest on 29 October 2020
A
Pollen mother cells
B
AGO (AAA)n
DCL5 A
Tapetum
BC sRNA-PAINT
AGO 24-nt phasiRNAs
smFISH
BC
Other cell layer
C
0 20 40 60 80 100 120
Binding sites
Figure 4. Application of sRNA-PAINT for detecting lncRNA transcript. (A) biogenesis pathway of phasiRNA in maize. AGO1-miR2275 cleaved PHAS
lncRNA is produced into long dsRNA via RDR6-SGS3. DCL5 cleaves target sites into 24-mers (phasiRNAs). Our sRNA-PAINT suggests that AGO1-
miR2275 and RDR6-SGS3 might be present simultaneously on the PHAS lncRNA. The AGO1-miR2275 cleaved 5 unpaired portion may not go through
immediate degradation. Red bar represents the relative location of the VARNISH probe for PHAS lncRNA. Red boxes represent probe locations for
24-nt phasiRNA 1 and 24-nt phasiRNA 2. smFISH probes are represented with dash lines. (B) Comparison of sRNA-PAINT and smFISH for the same
RNA transcript (PHAS lncRNA). sRNA-PAINT detected a similar RNA localization pattern compared with smFISH, with increased single-molecule
resolution and a higher quantification count. All images were taken on the same coverglass sequentially. Scale bar = 10 m in all images. (C) Quantification
analysis of image in panel A. sRNA-PAINT detected more PHAS lncRNA than smFISH. Numbers show the binding events for each cell (90-pixel size
diameter circle in Picasso software) in different cell layers. 3 different locations in each specified cell layer were taken for statistical analysis. Different letters
indicate significant differences (Tukey’s test; P < 0.05, n = 90).
Figure S4, the imager strand used for miR2275 (P0*) and of each target. We tested this high-level multiplexing with
24-nt phasiRNA (P1*) do not non-specifically bind to the phasiRNA biogenesis components in 1 mm (length) pre-
each other’s docking strand. Sections on coverglass were meiotic maize anthers (Figure 5A). We aimed for four com-
mounted into a perfusion chamber and were first perfused ponents of the phasiRNA biogenesis pathways that shared
with P0* imager strand. After the image of miR2275 was the same precursor: miR2275, the PHAS lncRNA precur-
acquired, buffer wash was performed to completely remove sor, and two phasiRNAs (5 phase ‘cycles’ apart, or 5 × 24 nt
the P0* imager strand. Next, the imager strand P1* was = 120 nt apart). We also included a fifth candidate, miR166,
applied, and generated the image for the 24-nt phasiRNA. which regulates flower development but does not belong
Using traditional in situ hybridization methods, miR2275 to the 24-nt phasiRNA biogenesis pathway (33). Each of
and 24-nt phasiRNA were thought to co-localize in the the five sRNA-PAINT probes, used at the same concen-
tapetum layer and pollen mother cells (7). Using sRNA- tration, was hybridized simultaneously to a maize anther
PAINT, which has a resolution down to 10 nm, we con- cross-section (Figure 5A). We observed effective detection
firmed that they co-localize to the tapetum layer and pollen of the targets by exchanging imager strands (Figure 5B);
mother cells within the anther tissue. To examine if they DAPI was subsequently imaged as a counterstain for nu-
co-localize at the single molecule level, we implemented an clei. In comparison with sRNA-seq data of multiple pooled
approach called Clus-DoC (28) that combines DBSCAN 1 mm anthers, quantification of each sRNA-PAINT chan-
(34) clustering with colocalization. Using this analysis ap- nel showed similar trends in sRNA abundances (Figure 5C).
proach, miR2275 and 24-nt phasiRNA had lower DoC Single-molecule resolution was preserved with high-level
scores (29.8% and 27.2%) compared to the control exper- multiplexing (Figure 5D zoom) demonstrating that sRNA-
iment in which 24-nt phasiRNA was imaged and then re- Exchange-PAINT preserved the quantification capability of
imaged (68.7% and 64.3%) (Supplementary Figure S4C). qPAINT. The sequential order of the imager strands did not
Higher levels of multiplexing can be achieved by sequen- alter the quantification of the targets, as shown in Supple-
tial detection of multiple small RNA targets. To achieve mentary Figure S5.
this, different docking strands could be attached to differ-
ent sRNA-PAINT probe backbones by simply specifying
the choice of docking strand in the VARNISH software. All DISCUSSION
the sRNA-PAINT probes are then hybridized to the tissue sRNA-PAINT provides a robust method that quantita-
together in one hybridization step; after stringent washes, tively detects small RNAs with single-molecule resolution.
each imager strand is perfused in for sequential detection It greatly improves the resolution and precision of sRNA lo-
PAGE 9 OF 13                                                                             Nucleic Acids Research, 2020, Vol. 48, No. 16 e96

                                                                                                                                                           Downloaded from https://academic.oup.com/nar/article/48/16/e96/5876683 by guest on 29 October 2020

Figure 5. sRNA-Exchange-PAINT for detection of phasiRNA biogenesis components in premeiotic maize anther. (A) Schematic of maize anther stage and
comparison of material used in sRNA-seq and sRNA-PAINT method. (B) Image of sRNA-Exchange-PAINT carried on five targets. Zoomed-in image of
the boxed area is shown on the right corner. miR2275 probes were linked with the P0 docking strand and represented with green color. 24-nt phasiRNA
1 probe was linked with P1 docking strand and represented with blue color. 24-nt phasiRNA 2 probe was linked with P2 docking strand and represented
with cyan color. miR166 probe was linked with P4 docking strand and represented with yellow color. PHAS lncRNA was linked with P5 docking strand
and represented with red color. (C) Comparison of the quantification result of four target miRNAs using sRNA-seq and sRNA-qPAINT. Representative
sRNA copy number estimates were calculated by the sum of the binding sites shown in the boxed area using sRNA-qPAINT. (D) Sequential detection of
five targets and overlay with the nucleus. Overlay of the channels shows the complexity and density of the small RNAs. Zoomed in image of the boxed area
shows single-molecule detection capability with higher-level of multiplexing. The imager strand in each channel is indicated with the diagram above each
image, and the quantification of binding sites of each channel is shown in the white box.
e96 Nucleic Acids Research, 2020, Vol. 48, No. 16                                                               PAGE 10 OF 13

calization compared to other FISH methods, namely those          parable approaches and is relatively simple. The primary
that are limited by the diffraction limit of light. The small    limitation to sRNA-PAINT is the cost of the LNA oligos,
size of sRNAs are generally only detected by one probe per       which makes it expensive for new probes, although this cost
sRNA, as a result, each probe plays an important role with       is amortized if the probe is used for many samples, as a typi-
respect to quantification. Our online VARNISH tool as-           cal yield for a purchased LNA oligo is enough for hundreds
sists with the critical probe design step to generate LNA        to thousands of sRNA-PAINT experiments.
probes with docking strands. Quantification of binding sites        Colocalization data from sRNA-PAINT should be eval-
then can be deduced from the known binding kinetics of the       uated in the context of spatial information at the tissue, sub-
imager strands to the docking strands with sRNA-PAINT            cellular, and molecular levels. In the case of miR2275 and
(22). A clear benefit of sRNA-PAINT is ability to multiplex      the 24-nt phasiRNA, sRNA-PAINT confirmed in situ hy-
detection beyond three sRNAs, a capability that was previ-       bridization data that showed these two sRNAs co-localize
ously reserved for longer RNAs.                                  at the tissue level in tapetal layer and pollen mother cells,
   To develop a quantitative, super-resolution method for        and, at the subcellular level, mainly in the cytoplasm (7,20).

                                                                                                                                   Downloaded from https://academic.oup.com/nar/article/48/16/e96/5876683 by guest on 29 October 2020
sRNA, we chose to design a PAINT-based method over               However, sRNA-PAINT should be cautiously applied for
a dSTORM-based method for several reasons. The pre-              colocalization at the molecular level. The size of a small
dictable binding of imager strands to docking strands with       RNA is about 10 nm (42) and the imaging resolution of our
PAINT-based method is preferred over the stochastic blink-       sRNA-PAINT is sub-20 nm. Colocalization of miR2275
ing of dye molecules in dSTORM (22). Furthermore, quan-          and phasiRNA it triggered at the molecular level would sug-
tification with a dSTORM probe using a single fluorophore        gest that they physically interact with each other or that
molecule would be greatly hindered by photobleaching.            their density is too high for the method to resolve dif-
Bleached dye molecules would result in an underestima-           ferent target sRNA molecules; neither of which is appar-
tion of the number of sRNA targets (20,35). In contrast,         ently the case. sRNA-PAINT, like all super-resolution sin-
qPAINT-based methods are mostly unaffected by fluo-              gle molecule localization approaches consist of a collection
rophore photobleaching because fluorophore molecules are         of 2D or 3D coordinates, each associated with some degree
constantly being replenished by the binding of new im-           of uncertainty in localization (43). Therefore, to account for
ager strands (23). Rather, the major pitfall related to pho-     that uncertainty, we used Clus-DoC that first clusters local-
tobleaching is photodamage of the docking strands during         ization events and then conducts colocalization to examine
qPAINT-based methods caused by the generation of reac-           the spatial relationship of miR2275 and 24-nt phasiRNA at
tive oxygen species (36). After EDC treatment, the photo-        the molecular level (28). We found that 29.8% and 27.2%
bleaching effect was negligible for the highly abundant 24-nt    cluster colocalization for miR2275 and 24-nt phasiRNA.
phasiRNA, since there was no significant difference in the       However, we found that imaging and re-imaging the same
qPAINT quantification after washing and reimaging (Fig-          24-nt phasiRNA resulted in colocalization scores
PAGE 11 OF 13 Nucleic Acids Research, 2020, Vol. 48, No. 16 e96
a superior method for quantifying full-length, longer RNAs efficiency of the probes prior to imaging. sRNA-PAINT
and should be used for that application. sRNA-PAINT is method still retains the pros and cons of any LNA-based
best suited for multiplexing the detection of longer RNAs in situ method and that PAINT technology quantification
with sRNAs or to study the processing of longer RNAs. is restricted to the number of binding sites (hybridized
Improvements in colocalization described above, combined probes). The development of LNA technology increased
with multiplexing, may lead to powerful advancements in the specificity and efficiency of sRNA-FISH methods mak-
the sRNA-PAINT approach to study sRNA biogenesis ing the development of sRNA-PAINT possible. Future im-
from longer precursors. Indeed, the limited number of ex- provements in probes, such as the use of next-gen bridged
periments conducted to develop sRNA-PAINT has led to nucleic acids (BNAs) (49) may provide more efficient and
new hypotheses. For example, we detected a higher number specific labeling of target sRNAs that will benefit all FISH-
of binding sites for PHAS lncRNA than its derivative 24 nt based RNA detection methods, including sRNA-PAINT. A
phasiRNA 2. One possibility is the probes detecting mature drawback of the sRNA-PAINT method is that it can only be
phasiRNA-2 failed to detect the PHAS lncRNA precur- applied to fixed tissues or cells. Live-cell imaging, especially
Downloaded from https://academic.oup.com/nar/article/48/16/e96/5876683 by guest on 29 October 2020
sor, as that region of the precursor may be predominantly aptamer-based sensor imaging for small RNAs, was made
present as dsRNA. As suggested above, another possibility possible by fluorescent RNA aptamers such as Spinach and
is that the cleaved 5 portion of the PHAS precursor accu- Mango (50–52); however, these methods have low sensitiv-
mulates in the cells after AGO1-directed cleavage (Figure ity and resolution. Creating a live-cell sRNA-PAINT ap-
4). proach with single molecule sensitivity would shed light on
A distinct advantage of sRNA-PAINT is that it is the dynamics and ever-changing contents of cellular RNAs.
compatible with Exchange-PAINT, for multiplexing us-
ing multiple docking strands that are linked to the same SUPPLEMENTARY DATA
fluorophore (23). Our previously described sRNA-FISH
method (20) is limited to only two to three targets, mainly Supplementary Data are available at NAR Online.
due to the limited choices of antibodies and fluorophores.
Achieving the theoretical level of multiplexing for protein ACKNOWLEDGEMENTS
detection is mostly limited by the number of primary and We thank Virginia Walbot (Stanford University) and mem-
secondary antibodies. Our antibody-free method for sR- bers of her lab for supplying maize materials and for
NAs potentially can achieve the theoretical level of mul- useful discussions on another small RNAs. We thank
tiplexing by designing hundreds of sRNA-PAINT VAR- Prof. Dr Ralf Jungmann for his support in DNA-PAINT,
NISH probes to query numerous targets in the same sam- qPAINT and analysis with Picasso. Microscopy equipment
ple. The current barriers of reaching the full potential of was acquired with a shared instrumentation grant (S10
sRNA-PAINT are the cost of LNA probes and the imag- OD016361) and access was supported by the NIH-NIGMS
ing time. These barriers may soon be removed as the cost of (P20 GM103446), the NSF (IIA-1301765) and the State of
LNA probes has been decreasing and new methods for in- Delaware.
creasing the speed of PAINT-based methods have been de-
veloped (41,44). However, sRNA-PAINT, as currently con- FUNDING
ceived, will not reach the same level of other highly multi-
plexed barcoding methods for mRNAs, such as MERFISH US NSF Plant Genome Research Program [1649424,
and seqFISH+. MERFISH enabled multiplexed detection 1611853, 1754097]; Meyers and Caplan labs for their sup-
of hundreds to thousands of RNA species in a single cell us- port; Joanna Friesner for editorial assistance. Funding for
ing a combination of encoding probes and readout probes open access charge: NSF EAGER [1822293].
(45,46). The seqFISH+ method was able to detect 10,000 Conflict of interest statement. None declared.
transcripts with high accuracy (47). Our main limitation
is the small size of sRNAs. They are simply too small to REFERENCES
barcode with non-LNA probes. LNA probes are required 1. Lewsey,M.G., Hardcastle,T.J., Melnyk,C.W., Molnar,A., Valli,A.,
for sRNA-PAINT (Figure 2), and high-level multiplexing Urich,M.A., Nery,J.R., Baulcombe,D.C. and Ecker,J.R. (2016)
may be hindered by their cost and the required higher hy- Mobile small RNAs regulate genome-wide DNA methylation. Proc.
bridization (55◦ C) and stripping (90◦ C) temperatures com- Natl Acad. Sci. U.S.A., 113, E801–E810.
pared to DNA probes. One intriguing avenue to increase 2. Baldrich,P., Rutter,B.D., Karimi,H.Z., Podicheti,R., Meyers,B.C. and
Innes,R.W. (2019) Plant extracellular vesicles contain diverse small
multiplexing is to barcode the docking strands. Agasti et RNA species and are enriched in 10-to 17-Nucleotide ‘Tiny’ RNAs.
al. (48) tested the orthogonality of 52 docking sequences Plant Cell, 31, 315–324.
and concluded that those docking sequences could be used 3. Wight,C., Ross,D.A. and Weinberger,D.R. (2018) Small RNAs may
as DNA-barcoded labeling probes for PAINT. We antici- answer big questions in mental illness. Biol. Psychiatry, 83, E1–E3.
4. Borges,F. and Martienssen,R.A. (2015) The expanding world of small
pate that many advances in our sRNA-PAINT method will RNAs in plants. Nat. Rev. Mol. Cell Biol., 16, 727–741.
be driven by clever, new ways to improve all PAINT-based 5. Fei,Q., Xia,R. and Meyers,B.C. (2013) Phased, secondary, small
methods by other research groups. interfering RNAs in posttranscriptional regulatory networks. Plant
Finally, our sRNA-PAINT method provides an alterna- Cell, 25, 2400–2415.
tive to conventional sRNA-FISH, as it is capable of higher 6. Xia,R., Chen,C.J., Pokhrel,S., Ma,W.Q., Huang,K., Patel,P.,
Wang,F.X., Xu,J., Liu,Z.C., Li,J.G. et al. (2019) 24-nt reproductive
resolution, quantification, and multiplexing. All FISH- phasiRNAs are broadly present in angiosperms. Nat. Commun., 10,
based methods are dependent on the actual hybridization 627.e96 Nucleic Acids Research, 2020, Vol. 48, No. 16 PAGE 12 OF 13
7. Zhai,J.X., Zhang,H., Arikit,S., Huang,K., Nan,G.L., Walbot,V. and genetics and genomics database. Nucleic Acids Res., 47,
Meyers,B.C. (2015) Spatiotemporally dynamic, cell-type-dependent D1146–D1154.
premeiotic and meiotic phasiRNAs in maize anthers. Proc. Natl 30. McTigue,P.M., Peterson,R.J. and Kahn,J.D. (2004)
Acad. Sci. U.S.A., 112, 3146–3151. Sequence-dependent thermodynamic parameters; for locked nucleic
8. Chitwood,D.H. and Timmermans,M.C.P. (2010) Small RNAs are on acid (LNA)-DNA duplex formation. Biochemistry, 43, 5388–5405.
the move. Nature, 467, 415–419. 31. Dempsey,G.T., Vaughan,J.C., Chen,K.H., Bates,M. and
9. Fang,Y.D. and Spector,D.L. (2007) Identification of nuclear dicing Zhuang,X.W. (2011) Evaluation of fluorophores for optimal
bodies containing proteins for microRNA biogenesis in living performance in localization-based super-resolution imaging. Nat.
Arabidopsis plants. Curr. Biol., 17, 818–823. Methods, 8, 1027–1036.
10. Li,C.F., Pontes,O., El-Shami,M., Henderson,I.R., 32. Pena,J.T.G., Sohn-Lee,C., Rouhanifard,S.H., Ludwig,J., Hafner,M.,
Bernatavichute,Y.V., Chan,S.W.L., Lagrange,T., Pikaard,C.S. and Mihailovic,A., Lim,C., Holoch,D., Berninger,P., Zavolan,M. et al.
Jacobsen,S.E. (2006) An ARGONAUTE4-containing nuclear (2009) miRNA in situ hybridization in formaldehyde and EDC-fixed
processing center colocalized with Cajal bodies in Arabidopsis tissues. Nat. Methods, 6, 139–141.
thaliana. Cell, 126, 93–106. 33. Sun,W., Chen,D., Xue,Y., Zhai,L., Zhang,D., Cao,Z., Liu,L.,
11. Li,S.B., Le,B., Ma,X., Li,S.F., You,C.J., Yu,Y., Zhang,B.L., Liu,L., Cheng,C., Zhang,Y. and Zhang,Z. (2019) Genome-wide identification
Gao,L., Shi,T. et al. (2016) Biogenesis of phased siRNAs on of AGO18b-bound miRNAs and phasiRNAs in maize by cRIP-seq.
Downloaded from https://academic.oup.com/nar/article/48/16/e96/5876683 by guest on 29 October 2020
membrane-bound polysomes in Arabidopsis. Elife, 5, e22750. BMC Genomics, 20, 656–667.
12. Song,L., Han,M.H., Lesicka,J. and Fedoroff,N. (2007) Arabidopsis 34. Ester,M., Kriegel,H.-P., Sander,J. and Xu,X. (1996) A density-based
primary microRNA processing proteins HYL1 and DCL1 define a algorithm for discovering clusters in large spatial databases with
nuclear body distinct from the Cajal body. Proc. Natl Acad. Sci. noise. In: Proceedings of the 2nd International Conference on
U.S.A., 104, 5437–5442. Knowledge Discovery and Data Mining. Menlo Park, pp. 226–231.
13. Dunoyer,P., Melnyk,C., Molnar,A. and Slotkin,R.K. (2013) Plant 35. Sehayek,S., Gidi,Y., Glembockyte,V., Brandao,H.B., Francois,P.,
mobile small RNAs. Cold Spring Harb. Perspect. Biol., 5, a017897. Cosa,G. and Wiseman,P.W. (2019) A high-throughput image
14. Yoo,B.C., Kragler,F., Varkonyi-Gasic,E., Haywood,V., correlation method for rapid analysis of fluorophore photoblinking
Archer-Evans,S., Lee,Y.M., Lough,T.J. and Lucas,W.J. (2004) A and photobleaching rates. Acs Nano, 13, 11955–11966.
systemic small RNA signaling system in plants. Plant Cell, 16, 36. Blumhardt,P., Stein,J., Mucksch,J., Stehr,F., Bauer,J., Jungmann,R.
1979–2000. and Schwille,P. (2018) Photo-Induced depletion of binding sites in
15. Johnson,N.R. and Axtell,M.J. (2019) Small RNA warfare: exploring DNA-PAINT microscopy. Molecules, 23, 3165.
origins and function of trans-species microRNAs from the parasitic 37. Tamura,M., Tamura,T., Burnham,D.N., Uhlinger,D.J. and
plant Cuscuta. Curr. Opin. Plant Biol., 50, 76–81. Lambeth,J.D. (1989) Stabilization of the superoxide-generating
16. Cai,Q., Qiao,L.L., Wang,M., He,B.Y., Lin,F.M., Palmquist,J., respiratory burst oxidase of human neutrophil plasma membrane by
Huang,S.N.D. and Jin,H.L. (2018) Plants send small RNAs in crosslinking with 1-ethyl-3-(3-dimethylaminopropyl) carbodiimide.
extracellular vesicles to fungal pathogen to silence virulence genes. Arch. Biochem. Biophys., 275, 23–32.
Science, 360, 1126–1129. 38. Tamura,M., Takeshita,M., Curnutte,J.T., Uhlinger,D.J. and
17. Liu,T., Zhang,Q., Zhang,J.K., Li,C., Miao,Y.R., Lei,Q., Li,Q.B. and Lambeth,J.D. (1992) Stabilization of human neutrophil NADPH
Guo,A.Y. (2019) EVmiRNA: a database of miRNA profiling in oxidase activated in a cell-free system by cytosolic proteins and by
extracellular vesicles. Nucleic Acids Res., 47, D89–D93. 1-ethyl-3-(3-dimethylaminopropyl) carbodiimide. J. Biol. Chem., 267,
18. Javelle,M. and Timmermans,M.C.P. (2012) In situ localization of 7529–7538.
small RNAs in plants by using LNA probes. Nat. Protoc., 7, 533–541. 39. Stein,J., Stehr,F., Schueler,P., Blumhardt,P., Schueder,F., Mucksch,J.,
19. Hell,S.W. (2009) Microscopy and its focal switch. Nat. Methods, 6, Jungmann,R. and Schwille,P. (2019) Toward absolute molecular
24–32. numbers in DNA-PAINT. Nano Lett., 19, 8182–8190.
20. Huang,K., Baldrich,P., Meyers,B.C. and Caplan,J.L. (2019) 40. Pleiner,T., Bates,M., Trakhanov,S., Lee,C.T., Schliep,J.E., Chug,H.,
sRNA-FISH: versatile fluorescent in situ detection of small RNAs in Bohning,M., Stark,H., Urlaub,H. and Gorlich,D. (2015)
plants. Plant J., 98, 359–369. Nanobodies: site-specific labeling for super-resolution imaging, rapid
21. Schnitzbauer,J., Strauss,M.T., Schlichthaerle,T., Schueder,F. and epitope-mapping and native protein complex isolation. Elife, 4, e1134.
Jungmann,R. (2017) Super-resolution microscopy with 41. Schueder,F., Stein,J., Stehr,F., Auer,A., Sperl,B., Strauss,M.T.,
DNA-PAINT. Nat. Protoc., 12, 1198–1228. Schwille,P. and Jungmann,R. (2019) An order of magnitude faster
22. Jungmann,R., Avendano,M.S., Dai,M.J., Woehrstein,J.B., DNA-PAINT imaging by optimized sequence design and buffer
Agasti,S.S., Feiger,Z., Rodal,A. and Yin,P. (2016) Quantitative conditions. Nat. Methods, 16, 1101–1104.
super-resolution imaging with qPAINT. Nat. Methods, 13, 42. Yoffe,A.M., Prinsen,P., Gopal,A., Knobler,C.M., Gelbart,W.M. and
1198–1228. Ben-Shaul,A. (2008) Predicting the sizes of large RNA molecules.
23. Jungmann,R., Avendano,M.S., Woehrstein,J.B., Dai,M.J., Shih,W.M. Proc. Natl Acad. Sci. U.S.A., 105, 16153–16158.
and Yin,P. (2014) Multiplexed 3D cellular super-resolution imaging 43. Schnitzbauer,J., Wang,Y., Zhao,S., Bakalar,M., Nuwal,T., Chen,B.
with DNA-PAINT and Exchange-PAINT. Nat. Methods, 11, and Huang,B. (2018) Correlation analysis framework for
313–318. localization-based superresolution microscopy. Proc. Natl Acad. Sci.
24. Xu,W.D., Yin,P. and Dai,M.J. (2018) Super-resolution geometric U.S.A., 115, 3219–3224.
barcoding for multiplexed miRNA profiling. Angew. Chem.-Int. Ed., 44. Filius,M., Cui,T.J., Ananth,A.N., Docter,M.W., Hegge,J.W., van der
57, 14075–14079. Oost,J. and Joo,C. (2020) High-speed super-resolution imaging using
25. Kelliher,T. and Walbot,V. (2011) Emergence and patterning of the protein-assisted DNA-PAINT. Nano Lett., 20, 2264–2270.
five cell types of the Zea mays anther locule. Dev. Biol., 350, 32–49. 45. Chen,K.H., Boettiger,A.N., Moffitt,J.R., Wang,S. and Zhuang,X.
26. Batish,M., Raj,A. and Tyagi,S. (2011) Single molecule imaging of (2015) Spatially resolved, highly multiplexed RNA profiling in single
RNA in situ. Methods Mol. Biol., 714, 3–13. cells. Science, 348, aaa6090.
27. Cardona,A., Saalfeld,S., Schindelin,J., Arganda-Carreras,I., 46. Xia,C.L., Babcock,H.P., Moffitt,J.R. and Zhuang,X.W. (2019)
Preibisch,S., Longair,M., Tomancak,P., Hartenstein,V. and Multiplexed detection of RNA using MERFISH and branched DNA
Douglas,R.J. (2012) TrakEM2 software for neural circuit amplification. Sci Rep-Uk, 9, 7721.
reconstruction. PLoS One, 7, e38011. 47. Eng,C.L., Lawson,M., Zhu,Q., Dries,R., Koulena,N., Takei,Y.,
28. Pageon,S.V., Nicovich,P.R., Mollazade,M., Tabarin,T. and Gaus,K. Yun,J., Cronin,C., Karp,C., Yuan,G.C. et al. (2019)
(2016) Clus-DoC: a combined cluster detection and colocalization Transcriptome-scale super-resolved imaging in tissues by RNA
analysis for single-molecule localization microscopy data. Mol. Biol. seqFISH. Nature, 568, 235–239.
Cell, 27, 3627–3636. 48. Agasti,S.S., Wang,Y., Schueder,F., Sukumar,A., Jungmann,R. and
29. Portwood,J.L. 2nd, Woodhouse,M.R., Cannon,E.K., Gardiner,J.M., Yin,P. (2017) DNA-barcoded labeling probes for highly multiplexed
Harper,L.C., Schaeffer,M.L., Walsh,J.R., Sen,T.Z., Cho,K.T., exchange-PAINT imaging. Chem. Sci., 8, 3080–3091.
Schott,D.A. et al. (2019) MaizeGDB 2018: the maize multi-genomeYou can also read