Reactive nitrogen around the Arabian Peninsula and in the Mediterranean Sea during the 2017 AQABA ship campaign
←
→
Page content transcription
If your browser does not render page correctly, please read the page content below
Atmos. Chem. Phys., 21, 1–26, 2021
https://doi.org/10.5194/acp-21-1-2021
© Author(s) 2021. This work is distributed under
the Creative Commons Attribution 4.0 License.

Reactive nitrogen around the Arabian Peninsula and in the
Mediterranean Sea during the 2017 AQABA ship campaign
Nils Friedrich1 , Philipp Eger1 , Justin Shenolikar1 , Nicolas Sobanski1 , Jan Schuladen1 , Dirk Dienhart1 ,
Bettina Hottmann1 , Ivan Tadic1 , Horst Fischer1 , Monica Martinez1 , Roland Rohloff1 , Sebastian Tauer1 ,
Hartwig Harder1 , Eva Y. Pfannerstill1 , Nijing Wang1 , Jonathan Williams1 , James Brooks2 , Frank Drewnick3 ,
Hang Su4 , Guo Li5 , Yafang Cheng5 , Jos Lelieveld1 , and John N. Crowley1
1 Atmospheric   Chemistry Department, Max Planck Institute for Chemistry, Mainz 55118, Germany
2 Centre  for Atmospheric Science, University of Manchester, Manchester, M13 9PL, UK
3 Particle Chemistry Department, Max Planck Institute for Chemistry, Mainz 55118, Germany
4 Multiphase Chemistry Department, Max Planck Institute for Chemistry, Mainz 55118, Germany
5 Minerva Research Group, Max Planck Institute for Chemistry, Mainz 55118, Germany

Correspondence: John N. Crowley (john.crowley@mpic.de)

Received: 15 January 2021 – Discussion started: 21 January 2021
Revised: 19 March 2021 – Accepted: 8 April 2021 – Published:

Abstract. We present shipborne measurements of NOx              losses dominated (factor 2.5). Regional ozone production ef-
(≡ NO + NO2 ) and NOy (≡ NOx + gas- and particle-phase          ficiencies (OPEs; calculated from the correlation between
organic and inorganic oxides of nitrogen) in summer 2017        Ox and NOz , where Ox = O3 + NO2 ) ranged from 10.5 ± 0.9
as part of the expedition “Air Quality and climate change in    to 19.1 ± 1.1. This metric quantifies the relative strength of
the Arabian BAsin” (AQABA). The NOx and NOz (≡ NOy -            photochemical O3 production from NOx compared to the
NOx ) measurements, made with a thermal dissociation cav-       competing sequestering into NOz species. The largest val-
ity ring-down spectrometer (TD-CRDS), were used to exam-        ues were found over the Arabian Gulf, consistent with high
ine the chemical mechanisms involved in the processing of       levels of O3 found in that region (10–90 percentiles range:
primary NOx emissions and their influence on the NOy bud-       23–108 ppbv). The fractional contribution of individual NOz
get in chemically distinct marine environments, including the   species to NOy exhibited a large regional variability, with
Mediterranean Sea, the Red Sea, and the Arabian Gulf, which     HNO3 generally the dominant component (on average 33 %
were influenced to varying extents by emissions from ship-      of NOy ) with significant contributions from organic nitrates
ping and oil and gas production. Complementing the TD-          (11 %) and particulate nitrates in the PM1 size range (8 %).
CRDS measurements, NO and NO2 data sets from a chemi-
luminescence detector (CLD) were used in the analysis. In all
regions, we find that NOx is strongly connected to ship emis-
sions, both via direct emission of NO and via the formation     1   Introduction
of HONO and its subsequent photolytic conversion to NO.
The role of HONO was assessed by calculating the NOx pro-       The nitrogen oxides NO and NO2 are emitted into the atmo-
duction rate from its photolysis. Mean NO2 lifetimes were       sphere in several natural and anthropogenic processes includ-
3.9 h in the Mediterranean Sea, 4.0 h in the Arabian Gulf,      ing lightning (Chameides et al., 1977; Lange et al., 2001),
and 5.0 h in the Red Sea area. The cumulative loss of NO2       combustion (Lenner, 1987), and bacterial action in soil (Oer-
during the night (reaction with O3 ) was more important than    tel et al., 2016). Due to their rapid interconversion, NO and
daytime losses (reaction with OH) over the Arabian Gulf (by     NO2 are often treated as a single chemical family (NOx ).
a factor 2.8) and over the Red Sea (factor 2.9), whereas over      The chemical processing of NOx in the atmosphere,
the Mediterranean Sea, where OH levels were high, daytime       initiated by ozone and the radicals OH, HO2 , and
                                                                NO3 , leads to the formation of NOz (NOz = HNO3 +

Published by Copernicus Publications on behalf of the European Geosciences Union.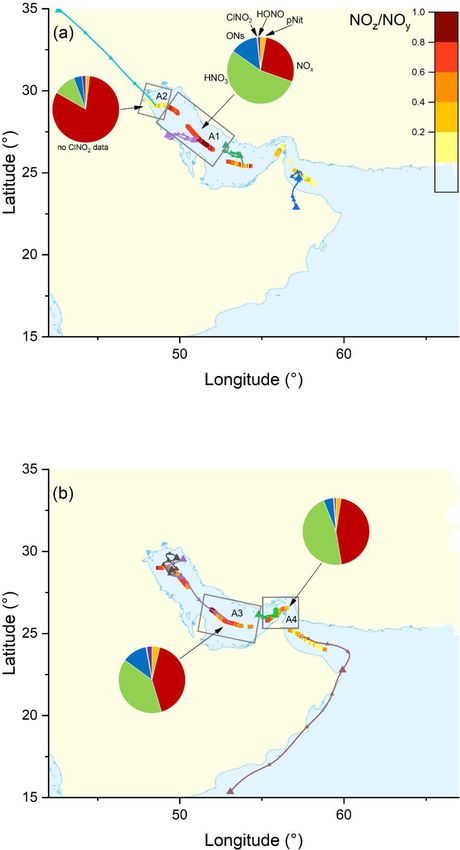
2                                                      N. Friedrich et al.: Reactive nitrogen around the Arabian Peninsula

NO3 + 2N2 O5 + RO2 NO2 + RONO2 + XONO2 + XNO2 +                  the efficiency of which is determined by the competition be-
particulate nitrates), where R is an organic fragment and X      tween photolysis of NO2 to ozone and its conversion to NOz
represents a halogen atom or a H atom. The sum of NOx and        (Day et al., 2003; Wild et al., 2014, 2016; Womack et al.,
NOz is referred to as total reactive nitrogen NOy (Logan,        2017). Modelling studies have identified the Arabian Gulf as
1983), which does not include N2 , N2 O, NH3 , or HCN.           a hotspot for O3 pollution and photochemical smog, with O3
   OH, formed, for example, via the photolysis of O3 in the      mixing ratios exceeding 100 ppbv (Lelieveld et al., 2009).
presence of water (Reactions R1a and R1b), can directly con-        The lack of measurements in the Arabian Gulf and the
vert both NO and NO2 to more oxidised, acidic forms (R2,         eastern Mediterranean, both of which are expected to be
R3; where M is a collision partner). NOx can be re-formed        significantly impacted by climate change (Lelieveld et al.,
from HONO at daytime through photolysis, with a noon-time        2012), preclude accurate prognosis of air quality in these re-
lifetime of ca. 20–30 min (Stutz et al., 2000).                  gions and provide the rationale for conducting the AQABA
                                                                 campaign (AQABA: Air Quality and climate change in
O3 + hν → O(1 D) + O2                                   (R1a)
                                                                 the Arabian BAsin), in which a large suite of instruments
    1
O( D) + H2 O → 2OH                                      (R1b)    were operated in regions that were influenced by anthro-
                                                                 pogenic emissions from megacities, petrochemical and ship-
OH + NO + M → HONO + M                                   (R2)    ping activity, and desert dust emissions and through regions
OH + NO2 + M → HNO3 + M                                  (R3)    that could be classified as maritime background conditions.
                                                                 Emissions from oil exploration provide a complex atmo-
OH can also react with volatile organic compounds (VOCs)         spheric mixture of NOx and anthropogenic VOCs. The pres-
to generate peroxy radicals (RO2 , Reaction R4). Reaction        ence of desert dust can have a significant impact on the bud-
with organic peroxy radicals converts NO to NO2 (major           get of inorganic acids such as HNO3 . Finally, the overall el-
channel; reaction R5a) or to organic nitrates RONO2 (mi-         evated temperatures and actinic fluxes during AQABA pro-
nor channel; Reaction R5b), and it sequesters NO2 as peroxy      moted rapid photochemical processing of NOx . We therefore
nitrates RO2 NO2 (Reaction R7).                                  expect a more varied and complex chemistry than found in
OH + RH(+O2 ) → RO2 + H2 O                               (R4)    remote marine locations.
                                                                    Previous analyses from this campaign focussed on sources
                                                                 and sinks of non-methane hydrocarbons (Bourtsoukidis et
RO2 + NO → RO + NO2                                     (R5a)    al., 2019); the role of OH reactivity in ozone chemistry (Pfan-
                                                                 nerstill et al., 2019); formation of ClNO2 (Eger et al., 2019a),
RO2 + NO + M → RONO2 + M                                (R5b)
                                                                 ethane, and propane emissions from the Red Sea (Bourt-
                                                                 soukidis et al., 2020); emission factors in ship plumes (Celik
HO2 + NO → OH + NO2                                      (R6)
                                                                 et al., 2020); marine emissions of methane sulfonamide (Edt-
RO2 + NO2 + M → RO2 NO2 + M                              (R7)    bauer et al., 2020); rates of net O3 production (Tadic et al.,
   The formation of long-lived organic nitrates (R5b) and        2020); and the abundance of carbonyl compounds.
especially nitric acid (R3) represent daytime sinks for both        In this paper we present NOx , NOy , and NOz mixing
NOx and ROx (OH + HO2 +RO + RO2 ).                               ratios obtained by a thermal dissociation cavity ring-down
   At night-time, when the photolysis of NO2 ceases, NO          spectrometer (TD-CRDS), together with NO and NO2 mix-
is sequentially converted to the NO3 radical (Reaction R8).      ing ratios from a chemiluminescence detector, a comprehen-
This radical can also be a source of RONO2 species through       sive set of ancillary measurements, and an analysis of the re-
the addition to unsaturated VOCs. NO3 exists in thermal          sults in terms of photochemical processing and ageing of air
equilibrium with NO2 and N2 O5 (Reaction R9) and the het-        masses, chemical sources of NOx (e.g. from the photolysis
erogeneous loss of N2 O5 to aqueous surfaces results in trans-   of HONO), and the efficiency of ozone formation.
fer of NOy to the particle phase as HNO3 (Reaction R10)             The ozone production efficiency (OPE), a metric used in
or its loss via deposition. In some (especially marine) envi-    the analysis of the O3 formation, quantifies the fractional
ronments (Osthoff et al., 2008; Kercher et al., 2009), loss of   transformation of primarily emitted NOx to O3 (Liu et al.,
N2 O5 to particles can result in formation of ClNO2 (R11)        1987; Trainer et al., 1993) and thus reflects the relative im-
which, via photolysis, re-forms NO2 the next day.                portance of competing photochemical processes leading to
                                                                 O3 and NOz formation from NOx . High values of OPE are
NO2 + O3 → NO3 + O2                                      (R8)    favoured by low OH and VOC concentrations, and values
NO3 + NO2 + M         N2 O5 + M                          (R9)    exceeding 80 have been reported for remote marine envi-
N2 O5 + H2 O → 2HNO3                                    (R10)    ronments. Low single-digit values have been observed in
                                                                 polluted urban environments (Rickard et al., 2002; Wang et
N2 O5 + Cl   −
                 → ClNO2 + NO−
                             3                          (R11)
                                                                 al., 2018). The location dependence of the OPE can be fur-
  The above reactions illustrate that NOx and VOCs pro-          ther classified with previous observations from the literature.
vide the catalyst and fuel for photochemical ozone formation,    Minimal OPEs in urban environments between 1 and 2 have

Atmos. Chem. Phys., 21, 1–26, 2021                                                    https://doi.org/10.5194/acp-21-1-2021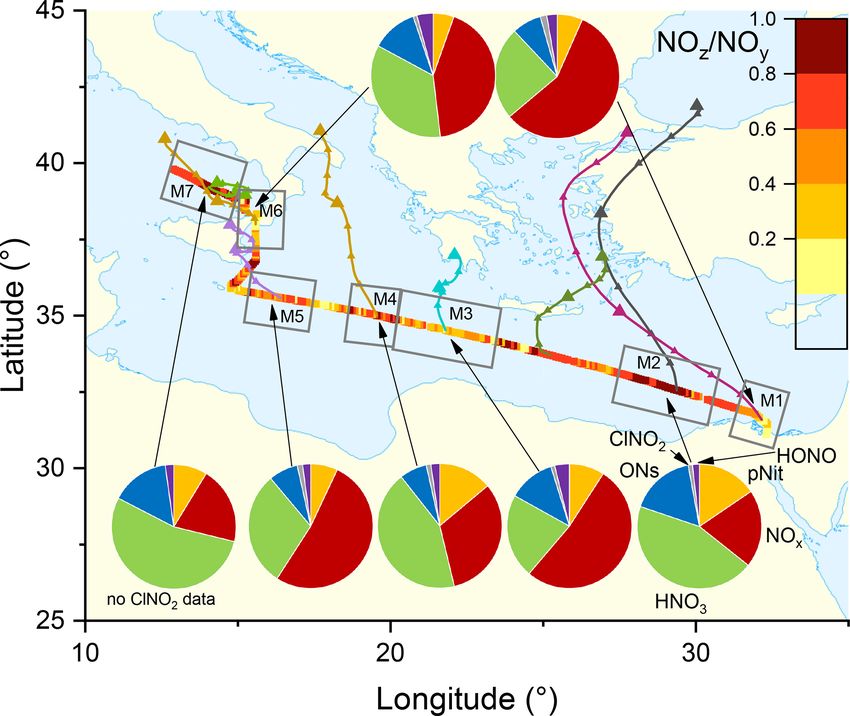
N. Friedrich et al.: Reactive nitrogen around the Arabian Peninsula                                                              3

been reported from the Beijing area (Lin et al., 2011; Ge
et al., 2013) and from the USA (Daum et al., 2000; Sill-
man, 2000; Nunnermacker et al., 2004). In rural and subur-
ban environments, the OPE can increase to values between
10 and 15, as demonstrated in North America (Olszyna et
al., 1994; Roussel et al., 1996; Fried et al., 1997; Ninneman
et al., 2017) and in China (Sun et al., 2010). From oceanic
samples, OPEs of 65 and 87 were observed on the south-
eastern coast of the UK (Rickard et al., 2002) and on Sable
Island, Canada (Wang et al., 1996). Flights over the western
Pacific Ocean found values of 102–246 in the tropical area
(latitude 0–18◦ N) and of 73–209 further north (18–42◦ N)
(Davis et al., 1996). For the AQABA campaign, we expect
lower OPEs than those observed in remote oceanic locations,
due to the variable influx from harbours, coastal pollution,
and surrounding ship traffic.                                    Figure 1. Mixing ratio of NOz from the second leg of the cam-
                                                                 paign, colour-coded along the ship track. Each data point repre-
                                                                 sents an average over 30 min. Grey lines represent HYSPLIT 48 h
                                                                 back-trajectories starting from the ship location at 100 m height.
2     Methods                                                    SH = Strait of Hormuz; BM = Strait of Bab al-Mandab; SC = Suez
                                                                 Canal.
The AQABA ship campaign followed a route from Toulon
in southern France to Kuwait (and back) via the Mediter-
ranean Sea, the Suez Canal, the Red Sea, the Arabian Sea,
and the Arabian Gulf (see Fig. 1). Stops were made in Malta,     nected to a tubular quartz inlet, which was heated to 850 ◦ C
Jeddah, Djibouti, and Fujairah on the first leg (24 June to      to thermally dissociate NOy trace gases to NO or NO2 . The
30 July 2017) and in Fujairah and Malta on the second leg        TD oven was accommodated in an aluminium box on top of
(2 August to 30 August 2017). Most measurements started in       the container with the inlet ca. 1.2 m above the container roof.
the south-eastern Mediterranean Sea on the first leg and fin-    Air samples reached the TD area less than 30 cm behind the
ished ca. halfway between Sicily and Corsica on the second       tip of the inlet, and we expect negligible inlet losses for NOy
leg. The instruments were located either in air-conditioned      species. Inlet lines of the heated and the ambient temperature
research containers aboard, or directly on the deck of, the      channel were each overall ca. 4 m long (2 m located inside
73 m long research vessel “Kommandor Iona”. Periods dur-         and 2 m outside the container). In the Red Sea and Arabian
ing which instrument inlets were contaminated by ship-stack      Gulf, the inlet heating of the NOy channel was switched off
emissions from the ship (identified based on relative wind       occasionally during the hottest hours of the day to prevent
direction and speed and the variability in measured SO2 and      damage to the oven electronics. The campaign data cover-
NO mixing ratios) were excluded from the analysis. This re-      age for NOy is 65 %, considering only time periods when the
sulted in rejection of 38.4 % of the data points on the first    ship was moving.
leg, when the wind and ship direction were often similar, and       The total uncertainty (at 50 % relative humidity and 1 min
rejection of 1.4 % on the second leg of the campaign, when       integration time) amounts to 11 % + 10 pptv for NOx and to
sailing mainly into the wind.                                    16 % + 14 pptv for NOz if we disregard the non-quantitative
                                                                 detection of coarse-mode non-refractory nitrate (see below).
2.1    TD-CRDS instrument for NOx , NOy , and NOz                Detection limits (5 s integration time) during the AQABA
       detection                                                 campaign were 98 pptv for NOx , 51 pptv for NOy , and
                                                                 110 pptv for NOz and are higher than those reported for lab-
The TD-CRDS instrument, its operating principles, labora-        oratory operation owing to problems with optical alignment
tory characterisation, and a validation of the NOx measure-      due to the motion of the ship. Detection limits are defined
ments versus an independent chemiluminescence detector           as the 2σ standard deviation between consecutive zeroing
(CLD) instrument have recently been presented (Friedrich et      periods. Under laboratory conditions, NOx detection limits
al., 2020). The TD-CRDS (located in an air-conditioned re-       of 40 pptv (1 min average) were obtained (Friedrich et al.,
search container on the front deck of the vessel) has two sep-   2020); 6 pptv (40 s) has been achieved with undegraded mir-
arate cavities operating at a wavelength of 405 nm and at sub-   rors (Thieser et al., 2016).
ambient pressure (720 to 770 hPa) to prevent condensation of        The NOz mixing ratios obtained using the TD-CRDS were
water on inlet lines under humid conditions. One of the cav-     calculated from the difference between NOy and NOx mea-
ities is connected to an inlet (perfluoroalkoxy alkane (PFA)     surements and thus contain a contribution from particulate
tubing) at ambient temperature, and the other cavity is con-     nitrate. Friedrich et al. (2020) have shown that this instru-

https://doi.org/10.5194/acp-21-1-2021                                                    Atmos. Chem. Phys., 21, 1–26, 2021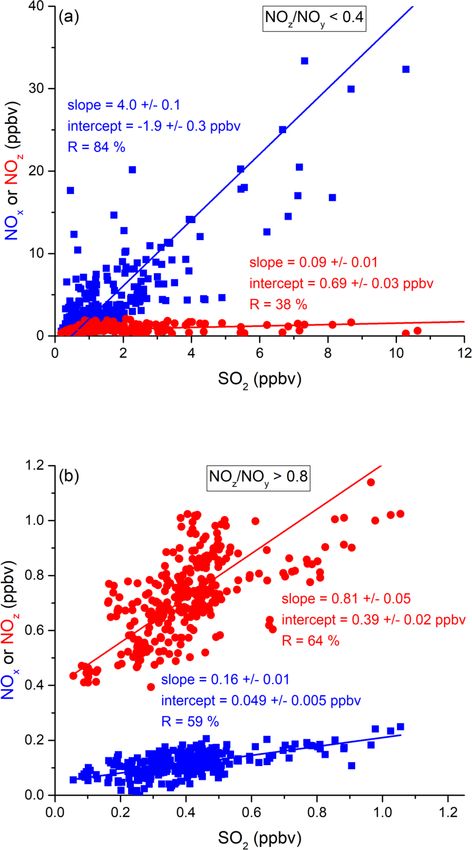
4                                                        N. Friedrich et al.: Reactive nitrogen around the Arabian Peninsula

ment measures ammonium nitrate quantitatively but detects           resolution (Eger et al., 2019a, b). The detection limits for
only a fraction (≈ 25 %) of sodium nitrate (NaNO3 ) of 200–         SO2 and ClNO2 were 38 and 12 pptv, respectively; the total
300 nm diameter as NOx . The inefficient detection of some          uncertainties were 20 % ± 23 pptv (SO2 ) and 30 % ± 6 pptv
non-refractory nitrate species (e.g. NaNO3 ) means that the         (ClNO2 ). Particulate-phase nitrate (pNit) and sulfate concen-
NOy mixing ratios presented below are thus (potentially)            trations in the PM1 size range were obtained by an aerosol
lower limits. As NaNO3 is usually associated with coarse-           mass spectrometer (Aerodyne HR-ToF-AMS; DeCarlo et al.,
mode aerosol (particle diameter > 1 µm), this also implies          2006) with measurement uncertainties of 30 % and 35 %, re-
                                                                                                                               2−
that the particle-phase nitrate measured by the TD-CRDS             spectively, for the mass concentrations of NO−   3 and SO4 .
is comparable to that measured by an aerosol mass spec-             Total aerosol mass concentrations in the PM1 and PM10 size
trometer (HR-ToF-AMS; see Sect. 2.3). In marine environ-            ranges were calculated from particle size distributions, de-
ments, sea salt aerosol can be the dominant aerosol compo-          tected with an optical particle counter (OPC, Grimm model
nent (Lewis and Schwartz, 2004). We therefore note that the         1.109; size range: 250 nm to 32 µm) in a 6 s time resolution
definition of NOy , in this work, is restricted to non-refractory   and with a 35 % uncertainty. Ozone was measured by optical
nitrate particles which can be vaporised by the AMS or in the       absorption at 253.65 nm in a commercial ozone monitor (2B
TD inlet of the CRDS. Nitrate detection by the AMS is fur-          Technologies model 202) with total measurement uncertainty
ther discussed in Sect. 3.2.2 and 3.4.                              of 2 % ± 1 ppbv and a detection limit of 3 ppbv (at 10 s inte-
   High loadings of coarse-mode particles are associated with       gration time). HONO mixing ratios were measured by a long-
high wind speeds, which were encountered on the first leg           path absorption photometer (LOPAP; Heland et al., 2001)
passing the Strait of Bab al-Mandab, through the Arabian            with a 3–5 pptv detection limit and a measurement uncer-
Sea, and until the Gulf of Oman and on the second leg in the        tainty of 20 %. The path length of the instrument was 1.9 m,
Arabian Sea and in the northern Red Sea. The fractional con-        and the inlet was also located on the foredeck of the ship at a
tribution of coarse-mode particles to the overall mass con-         ca. 5 m distance to the TD-CRDS inlets. A spectral radiome-
centration were derived using data from an optical particle         ter (Metcon GmbH) measured wavelength-resolved actinic
counter (OPC) and via the (PM10 –PM1 ) / PM10 ratio (both           flux, which was converted to photolysis rate constants (J ) for
PM1 and PM10 were measured with the OPC). We see from               NO2 , NO3 and HONO using evaluated quantum yields and
Fig. S1 that the impact of coarse-mode nitrate may have been        cross sections (Burkholder et al., 2015). The overall uncer-
largest on both legs in the transitional area between the south-    tainty in J is ca. 15 %, which includes calibration accuracy
ern Red Sea and Arabian Sea, where OPC PM10 mass con-               (Bohn et al., 2008) and the neglect of upwelling radiation
centrations exceeded 150 µg m−3 and the coarse-mode frac-           from the sea surface. OH concentrations were obtained from
tion was consistently > ca. 90 %.                                   a custom-built laser-induced fluorescence (LIF) instrument
                                                                    (Martinez et al., 2010; Regelin et al., 2013) with an upper
2.2   CLD measurements of NOx                                       limit total uncertainty of 40 %. Total OH reactivity measure-
                                                                    ments were performed according to the comparative reactiv-
NO and NO2 were measured with a chemiluminescence de-               ity method (Sinha et al., 2008), with a 5 min detection limit
tector (CLD 790 SR, ECO PHYSICS, 5 s time resolution) as            of 5.4 s−1 and a ca. 50 % total uncertainty, as described in
described in Tadic et al. (2020), with total measurement un-        Pfannerstill et al. (2019). HCHO was detected by a commer-
certainties of 6 % (NO) and 23 % (NO2 ) and detection limits        cial instrument (AL4021, Aero-Laser GmbH) according to
of 22 pptv for NO and 52 pptv for NO2 , both calculated at          the Hantzsch method and had a relative uncertainty of 13 %
a time resolution of 5 s and a confidence interval of 2σ . The      (Stickler et al., 2006). Multi-pass absorption spectroscopy
CLD detection method is based on the chemiluminescence of           using a quantum cascade laser was used to measure CO mix-
electronically excited NO∗2 formed in the reaction of NO with       ing ratios with 20 % uncertainty and a limit of detection of
O3 . Ambient NO2 is photolytically converted to NO by ex-           0.6 ppbv (Li et al., 2013).
posure to UV light from LEDs emitting at wavelengths close
to 398 nm. The CLD was calibrated every 6 h using a 2 ppmv          2.4   Meteorological data
NO gas standard.
                                                                    Temperature, wind direction, wind speed, and relative hu-
2.3   Other measurements                                            midity were measured by a weather station (Neptune,
                                                                    Sterela), together with the GPS position and velocity of the
An overview of the instruments deployed is given in Ta-             ship. Back-trajectories were obtained using the HYSPLIT
ble 1. Total organic nitrates (ONs) were measured as the sum        transport and dispersion model (Stein et al., 2015; Rolph
of peroxy nitrates (PNs, RO2 NO2 ) and alkyl nitrates (ANs,         et al., 2017). The trajectories were calculated backwards for
RONO2 ) in a five-channel thermal dissociation cavity-ring-         48 h from the GPS location of the ship with a starting height
down spectrometer (5C-TD-CRDS; Sobanski et al., 2016).              of 100 m a.m.s.l., using the Global Data Assimilation Sys-
SO2 and ClNO2 were measured with a chemical ionisa-                 tem (GDAS1) meteorological model. The back-trajectories
tion quadrupole mass spectrometer (CI-QMS) with 15 s time           were limited to 48 h as this exceeds the lifetimes of both

Atmos. Chem. Phys., 21, 1–26, 2021                                                       https://doi.org/10.5194/acp-21-1-2021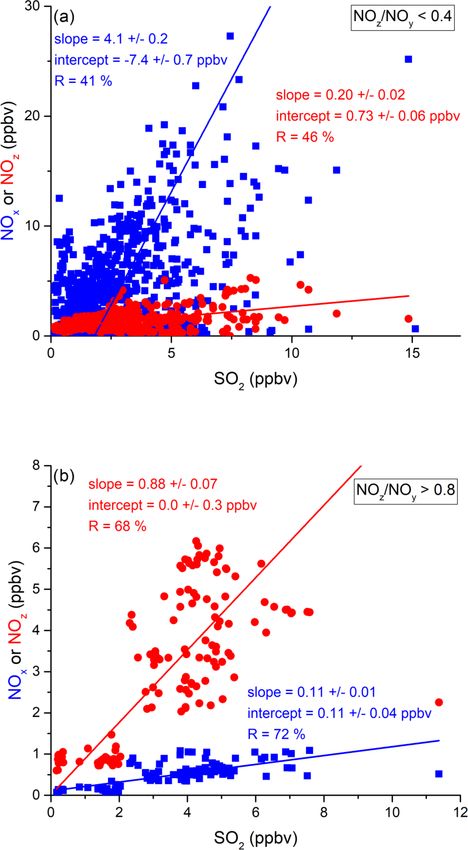
N. Friedrich et al.: Reactive nitrogen around the Arabian Peninsula                                                                                                     5

Table 1. Data sets used in the analysis and corresponding measurement characteristics.

    Species            Instrument            Technique                                                         Detection limit                Measurement uncertainty
    NOx                TD-CRDS              thermal dissociation cavity ring-down spectroscopy                 98 pptv                        11 %
    NOz                                                                                                        110 pptv                       16 %
    NO                 CLD                   chemiluminescence                                                 22 pptv (5 s, 2σ )             6%
    NO2                                                                                                        52 pptv (5 s, 2σ )             23 %
    ONs                5C-TD-CRDS            thermal dissociation cavity ring-down spectroscopy                NA                             NA
    SO2                CI-QMS               chemical ionisation mass spectrometry                              38 pptv                        20 % ± 23 pptv
    ClNO2                                                                                                      12 pptv                        30 % ± 6 pptv
    pNit (PM1 )        AMS                   aerosol mass spectrometry                                         NA                             30 %
    SO2−
      4 (PM1 )                                                                                                 NA                             35 %
    PM∗1               OPC                  optical particle counter                                           NA                             35 %
    PM∗10
    O3                 O3                    optical absorption                                                3 ppbv (10 s)                  2 % ± 1 ppbv
    HONO               LOPAP                 long-path absorption photometry                                   3–5 pptv                       20 %
    Jx∗∗               Jx                    wavelength-resolved actinic flux                                  NA                             10 %
    OH                 LIF                   laser-induced fluorescence                                        variable                       40 % (upper limit)
    OH reactivity      OH reactivity         comparative reactivity method                                     5.4 s−1 (5 min)                ca. 50 %
    HCHO               HCHO                  Hantzsch method                                                   0.128 ppbv (170 s, 2σ )        13 %
    CO                 CO                    absorption spectroscopy with quantum cascade laser                0.6 ppbv                       20 %
∗ represents total aerosol mass concentration. ∗∗ represents photolysis rate constants for NO , NO , and HONO. NA stands for not available.
                                                                                             2    3

NOx and NOz (see later) and is thus sufficient to indicate po-                             NOx mixing ratios below 20 pptv were previously found, for
tential source regions. Back-trajectories displayed in graphs                              example, over the South Atlantic (Fischer et al., 2015). The
are considered to be representative for the prevailing atmo-                               black lines in Fig. 1 represent 2 d back-trajectories (HYS-
spheric flow conditions when passing the respective areas                                  PLIT; see Sect. 2.4). A similar figure for the first leg is given
along the AQABA ship track.                                                                in Fig. S3. For the Mediterranean Sea, the Red Sea, and
                                                                                           the Arabian Gulf, we present an analysis of the lifetimes
                                                                                           and sources of NOx and NOz . Chemical sources of NOx ,
3    Results and discussion                                                                e.g. from the photolysis of HONO or pNit, are discussed in
                                                                                           Sect. 3.4. The chemically distinct regions are compared and
In Fig. S2 we show the complete NOx , NOy , and NOz time                                   contrasted in Sects. 3.5 and 4. Dividing the analysis into the
series from the campaign, averaged from the 5 s raw data                                   three regions helps to highlight the chemically different en-
time resolution onto a 5 min grid. Periods of contamination                                vironments encountered. An analysis of the Arabian Sea re-
by the ship’s own exhaust are indicated by grey background                                 gion was unfortunately not possible due to a gap in the NOz
colouring. The regional variation in NOx and NOz during                                    measurements between 9 and 17 August 2017, caused by in-
the second leg is illustrated in Figs. S3c and 1 which also                                strument failure during heavy seas and winds. The division
delineates the campaign into the “Red Sea” (2–16 July and                                  of the regions was based on the prevalent NOx mixing ratios
17–24 August 2017), the “Arabian Sea” (16–24 July and 7–                                   displayed in Fig. S3c. In contrast to other AQABA publica-
17 August 2017), the “Arabian Gulf” (24–31 July and 3–                                     tions (Eger et al., 2019a; Pfannerstill et al., 2019; Tadic et
7 August 2017), and the “Mediterranean Sea” (24–31 Au-                                     al., 2020), the Gulf of Oman, and the Suez Channel were
gust 2017).                                                                                included in the Arabian Gulf and the Red Sea regions, re-
   Altogether, 4.8 % of the NOx measurements during                                        spectively, as a clear shift in NOx to mixing ratios below
AQABA were below the ca. 100 ppt detection limit of the                                    ca. 1 ppbv occurred both upon leaving the Gulf of Oman
TD-CRDS instrument, indicating only sporadic occurrence                                    into the Arabian Sea and upon exiting the Suez Channel to
of maritime background conditions. Similar observations                                    the north towards the Mediterranean Sea. The transitions be-
were made by Tadic et al. (2020), with only 3.3 % of the                                   tween the Arabian Gulf and the Gulf of Oman, and between
NOx data set below 50 pptv in the Arabian Sea, the south-
ern Red Sea, and the eastern Mediterranean. In comparison,

https://doi.org/10.5194/acp-21-1-2021                                                                                      Atmos. Chem. Phys., 21, 1–26, 2021
6                                                        N. Friedrich et al.: Reactive nitrogen around the Arabian Peninsula

the northern Red Sea and the Suez region are less obviously           Potential non-shipping sources of NOx in this region can
represented in the NOx levels.                                     be identified via the back-trajectories plotted in Fig. 1. In the
                                                                   eastern part of the Mediterranean Sea, the air masses were in-
3.1     Mediterranean Sea                                          fluenced by emissions from the heavily populated and indus-
                                                                   trialised western Turkish coastal area, the island of Crete, and
Owing to unfavourable winds resulting in contamination of          mainland Greece. However, as we show below, the lifetime of
the measurements by the ships own exhaust as well as instru-       NOx is generally less than 6 h, and the greater fraction of any
ment malfunction, very little useable data were obtained by        land-based NOx emissions would have undergone oxidation
the TD-CRDS during the first leg through the Mediterranean         to NOz during the 48 h transport time of the back-trajectory.
Sea, and we analyse only the data obtained on the return leg       In the western Mediterranean Sea, the 2 d back-trajectories
(24–31 August 2017). In this period, temperatures varied be-       end above the open ocean.
tween 24 and 29 ◦ C with relative humidity between 52 % and           Our data can be compared to results from previous mea-
89 % (see Fig. S2). During most of the transit through the         surements of NOx in the Mediterranean area. Excluding
Mediterranean Sea, winds were from the north. At the end of        pollution events, Mallik et al. (2018) report NO and NO2
the cruise when approaching Sicily, we encountered a shift in      levels below 0.05 and 0.25 ppbv, respectively, during the
wind direction with air arriving from the north-west. Back-        2014 Cyprus-based CYPHEX (CYprus PHotochemical EX-
trajectories (see Fig. 1) indicate that when sailing through the   periment 2014) campaign in the eastern Mediterranean Sea.
eastern Mediterranean Sea we encountered air masses that           Plume-like increases in NOx were associated with enhanced
had passed over Turkey; the air we sampled in the central          SO2 and related to emissions from shipping (Eger et al.,
Mediterranean Sea had passed over the Balkan states, and           2019b). During the MINOS (Mediterranean INtensive Oxi-
in the western Mediterranean it had passed over Greece and         dant Study) campaign on the island of Crete, median NO2
Italy. The trajectories ending at the ships location were per-     mixing ratios between 0.3 ppbv and 0.7 ppbv were reported
sistently located in the boundary layer (height < 1000 m) for      (Berresheim et al., 2003). The lower mixing ratios were as-
the previous 48 h. An exception was the back-trajectory orig-      sociated with air masses arriving from the western European
inating from the Black Sea, which was located at a height          free troposphere, whereas the higher values were air masses
(above ground level) of up to 1740 m. The back-trajectory          impacted by biomass burning in eastern Europe. In contrast,
passing over the island of Crete was located at a maximum          higher NO2 mixing ratios (typically between 4 and 6 ppbv
height of 3224 m, which may be the result of orographic up-        excluding plumes) were reported from shipboard measure-
lift caused by the central Cretan mountain range.                  ments in the Aegean Sea (Večeřa et al., 2008). Satellite-based
                                                                   observations of NO2 vertical column densities over Crete
3.1.1    NOx
                                                                   and in the region between Crete and Sicily, were used to
NOx mixing ratios were generally low in the Mediterranean          derive near-surface NO2 mixing ratios of up to ∼ 0.4 ppbv
Sea (Fig. 2a). One-minute mean and median mixing ratios            (Ladstätter-Weißenmayer et al., 2003, 2007).
of NOx as detected by the TD-CRDS were 1.3 and 0.3 ppbv,              Our NOx measurements are thus broadly consistent with
respectively. For the CLD measurements of NOx , the equiv-         previous measurements in the Mediterranean Sea which in-
alent values are 1.1 and 0.2 ppbv, respectively. For both in-      dicate mixing ratios of less than 1 ppbv in the absence of re-
struments, the difference between mean and median values           cent emissions from ships. The higher mixing ratios reported
stems from the frequent occurrence of NOx plumes result-           by Večeřa et al. (2008) are likely to be related to the close
ing from emissions of nearby ships. The NOx mixing ratios          proximity of their ship to NOx sources on the European con-
measured by TD-CRDS and CLD were in good agreement                 tinent and denser ship traffic compared to the more southerly
(see Friedrich et al., 2020) and the bias of the TD-CRDS to        AQABA route through the eastern Mediterranean Sea.
higher values reflects the exclusion of data below the detec-
tion limit. A histogram of the NOx measurements made by            3.1.2   NOz
the CLD is displayed in Fig. 2b), which indicates that 33 %
of the NOx data were between 100 and 250 pptv and 24 %             Figure 2c and d show a time series and histogram, respec-
were above 1 ppbv. The maximum mixing ratio of NOx in              tively, of NOz for the Mediterranean Sea. The shape of the
the Mediterranean Sea of 84.7 ppbv was measured in the nar-        distribution indicates that NOz mixing ratios close to the de-
rowest part of the Strait of Messina, which is a busy corridor     tection limit were rarely measured. The mean (0.8 ppbv), me-
for international shipping with ferry traffic between Italy and    dian (0.7 ppbv), maximum (2.8 ppbv), and minimum NOz
Sicily crossing the Kommandor Iona’s ship track. This obser-       mixing ratios (< 0.1 ppbv) along with the narrower distri-
vation highlights the importance of NOx shipping emissions         bution indicate that, as expected, NOz is significantly less
in some parts of the Mediterranean Sea, which we return to         variable than NOx . The ratio of the median mixing ratios
later.                                                             NOz / NOy in the Mediterranean Sea is ∼ 0.8, and, concomi-
                                                                   tantly, that of NOx / NOy is ∼ 0.2. A more detailed analy-
                                                                   sis of the relative contributions of NOx and NOz to NOy ,

Atmos. Chem. Phys., 21, 1–26, 2021                                                       https://doi.org/10.5194/acp-21-1-2021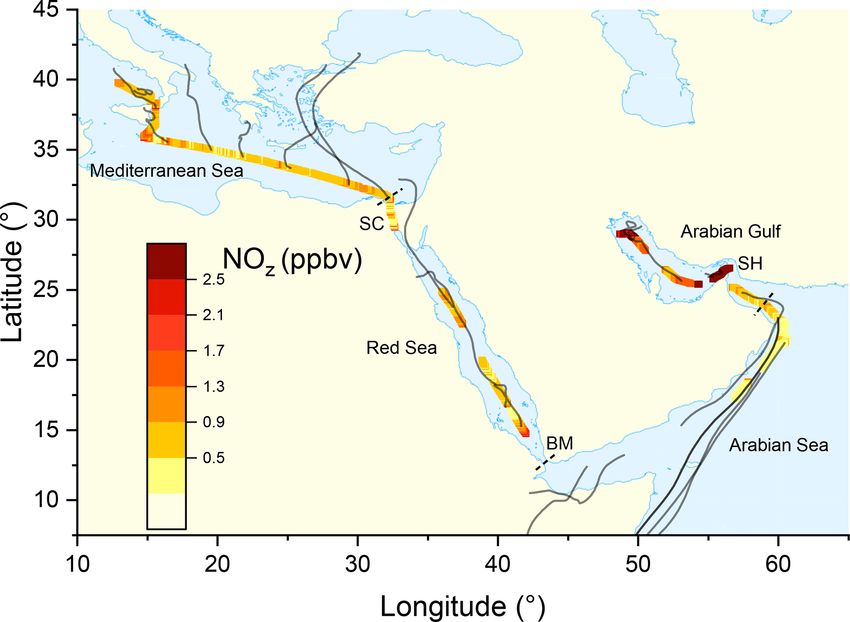
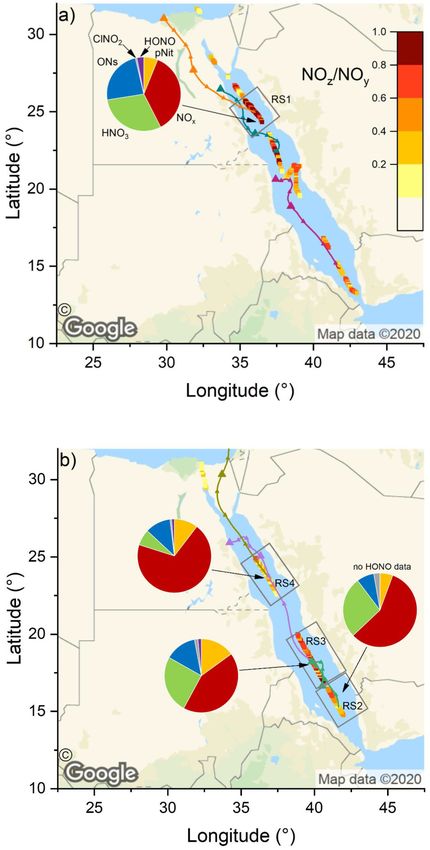
N. Friedrich et al.: Reactive nitrogen around the Arabian Peninsula                                                              7

Figure 2. NOy measurements in the Mediterranean Sea. Dashed lines signify the instrument detection limits. (a) NOx mixing ratios by
CLD and TD-CRDS. (b) Frequency distribution of NOx mixing ratios between 25 August and 1 September 2017. (c) NOz mixing ratios by
TD-CRDS. (d) Frequency distribution of NOz mixing ratios between 25 August and 1 September 2017. The yellow shaded regions show
JNO2 . The vertical dotted lines are the limits of detection of the respective measurements.

in which we divide the Mediterranean Sea into seven subre-          appears unlikely. The data available in each subregion did not
gions, is presented in the following paragraphs. The choice of      always cover an entire diurnal cycle, which will have an im-
these subregions was based on the existence of homogeneous          pact on the fractional contributions of individual NOy species
NOz / NOy ratios over periods of hours to days. This ap-            (see differences between day- and night-time chemistry in
proach enabled us to compare subregions with substantially          Sect. 1). We argue, however, that diurnal patterns in NOy are
different chemical regimes along the ship track but does not        likely overshadowed by the variability of air mass sources.
lend itself to the derivation of a representative NOy budget        The NOy compositions presented are thus to be considered
for the entire region.                                              coarse estimates.
   The pie charts in Fig. 3 indicate the regional average              In all subregions, HNO3 is the dominant component of
contributions (in subregions M1 to M7) of reactive nitro-           NOy besides NOx and therefore the most important NOz
gen species to NOy . The fractional contributions are based         species. Contrastingly, submicron pNit only contributes be-
on measurements of NOx , NOy , gas-phase organic nitrates           tween 5.4 % (M6) and 15.5 % (M2) to NOy and ONs be-
(ON), particulate nitrate (pNit), ClNO2 , and HONO. HNO3            tween 7.1 % (M4) and 16.9 % (M2). ClNO2 only constitutes
was not measured directly but calculated from HNO3 = NOy            a minor part of NOy with ca. 1 % contribution in all regions
– (NOx + ON + pNit + ClNO2 + HONO), where pNit refers               where ClNO2 was measured (M1–M6). The low mixing ra-
to submicron particulate nitrate as measured by the HR-             tios of ClNO2 have been attributed to high night-time tem-
ToF-AMS. Detection of coarse-mode pNit by the TD-CRDS               peratures and high reactivity of NO3 which reduce the in-
(see Friedrich et al., 2020) would lead to an overestimation        teraction of N2 O5 with chloride-containing particles (Eger et
of HNO3 . However, given that the thermal dissociation to           al., 2019a). Elevated HONO mixing ratios (up to 0.3 ppbv)
NO2 of NaNO3 particles with 300 nm diameter is inefficient          were observed in regions M3 and M6 where its contributions
(∼ 20 %) with this instrument, a significant bias by coarse-        to NOz was 3.8 % and 4.2 %, respectively. As the daytime
mode nitrate (e.g. associated with sea salt or mineral dust)        lifetime of HONO is short (a few minutes) due to its rapid

https://doi.org/10.5194/acp-21-1-2021                                                      Atmos. Chem. Phys., 21, 1–26, 2021
8                                                        N. Friedrich et al.: Reactive nitrogen around the Arabian Peninsula

                                                                   and loss. Following the considerations in Sect. 1, we com-
                                                                   pare the daytime loss of NOx via the reaction between NO2
                                                                   and OH (Reaction R3; expected to dominate over other day-
                                                                   time NOx loss processes in the marine environment) with
                                                                   night-time losses via the reaction between NO2 and O3 (Re-
                                                                   action R8):
                                                                   k NO2 = k3 [OH] + k8 [O3 ] ,                                (1)
                                                                   where k NO2 represents the total loss rate constant (in s−1 )
                                                                   for NO2 and is the inverse of the NO2 lifetime (τ NO2 ). The
                                                                   first term on the right-hand side of this expression is most
                                                                   important during the day when OH levels were high (up to
                                                                   1.4 × 10⁷ molec. cm−3 at local noon) but relatively unim-
                                                                   portant at night. In contrast, the second term on the right is
                                                                   only important at night as the NO3 product of R8 is rapidly
                                                                   photolysed back to NOx during daytime so that NOx is con-
                                                                   served.
                                                                      By using Eq. (1) to approximate the NO2 loss rate con-
Figure 3. The NOz / NOy ratio over the Mediterranean Sea.
                                                                   stant, we neglect two further processes which can, under
Coloured lines are 2 d back-trajectories (HYSPLIT). The pie
charts indicate the components of NOy at various segments along
                                                                   some conditions, influence the lifetime of NO2 . Our ap-
the ship’s track (ONs = organic nitrates, pNit = particulate ni-   proach assumes that the night-time formation of NO3 leads
trate). HNO3 was calculated via HNO3 = NOz – (ONs + pNit           to the removal of one NO2 molecule. This approach would
+ NOx + ClNO2 + HONO). The colours of the pie chart segments       be invalid if a significant fraction of NO3 would be lost
are assigned as follows (clockwise): pNit in yellow, NOx in red,   via formation (and subsequent heterogeneous loss) of N2 O5 .
HNO3 in green, ONs in blue, ClNO2 in grey, and HONO in ma-         Firstly, we note that formation of N2 O5 was hindered during
genta.                                                             AQABA by the high gas-phase reactivity of NO3 towards
                                                                   VOCs (Eger et al., 2019a) and that the transfer of N2 O5 to
                                                                   the particle phase was hindered by high temperatures. For ex-
photolysis (Platt et al., 1980), HONO levels up to 0.3 ppbv        ample, taking an N2 O5 uptake coefficient γN2 O5 of 0.03 (as
imply strong sources. Elevated HONO mixing ratios in ship          found for polluted marine environments by Aldener et al.,
plumes have been observed in previous field measurements           2006) and the median night-time aerosol surface area (ASA)
(Večeřa et al., 2008; Sun et al., 2020) and could explain the    in the Mediterranean Sea of 1.78 × 10⁻⁶ cm2 cm−3 (Eger et
presence of HONO in subregions M3 and M6. Other sources            al., 2019a), we estimated a loss rate constant for uptake of
of HONO, summarised in Elshorbany et al. (2012), include           N2 O5 of 3.5×10⁻⁴ s−1 , which is 2 orders of magnitude lower
heterogeneous or photochemical reactions of NOx and NOz            than the rate constant (4.9 × 10⁻² s−1 ) for thermal decompo-
on various surfaces and also the photolysis of particulate ni-     sition at 25.7 ◦ C (the mean, minimum night-time temperature
trate (Meusel et al., 2018).                                       in the Mediterranean Sea).
   Figure 3 also plots the NOz / NOy ratio along the ship’s           We also neglect the loss of NOx via uptake of NO2 onto
track. The highest values with median NOz / NOy > 0.68             black carbon (BC) particles. Using a literature uptake coef-
were found in regions M2, M4, and M7, reflecting a lack            ficient γNO2 of ca. 1 × 10⁻⁴ (Longfellow et al., 1999) and
of local NOx sources as confirmed by the back-trajectories.        the aforementioned ASA, the first-order loss rate constant for
For visual clarity, only the back-trajectories starting at the     the heterogeneous uptake would be 1.8 × 10⁻⁶ s−1 . Using an
geographical centres of the respective subregions are dis-         O3 mixing ratio of 63.4 ppbv (equal to night-time median
played in Fig. 3. Back-trajectories starting at the ship’s lo-     mixing ratio in the Mediterranean Sea), we calculate a first-
cation 4 h before or after confirmed that the air mass origin      order loss rate constant for the reaction of NO2 and O3 of
was very similar. In contrast, the regions designated M3, M5,      5.5 × 10⁻⁵ s−1 , which implies that > 95 % of total NO2 loss
and M6 are influenced by fresh emissions from land-based           at night-time NO2 is due to O3 . Uptake of NO2 might, there-
sources and are characterised by low NOz / NOy ratios (me-         fore, be relevant for HONO formation (see Sect. 3.4) but does
dians < 0.55), reflecting the higher levels of NOx which con-      not constitute a relevant loss process for NOx .
tributed 52 % (M3 and M5) and 43 % (M6) to total NOy .                In order to fill gaps in the OH data set (daytime data cover-
                                                                   age of 71 %), complete diel cycles of OH were generated by
3.1.3   Lifetime and sources of NOx                                scaling measurements of JO1 D to the OH noon-time maxima.
                                                                   Figure S4 compares the measured OH concentrations with
In the following section, the observations of NOx in the           the interpolated trace and shows that the thereby derived OH
Mediterranean Sea are analysed in terms of its production          levels can be considered upper limits. Inserting these values

Atmos. Chem. Phys., 21, 1–26, 2021                                                      https://doi.org/10.5194/acp-21-1-2021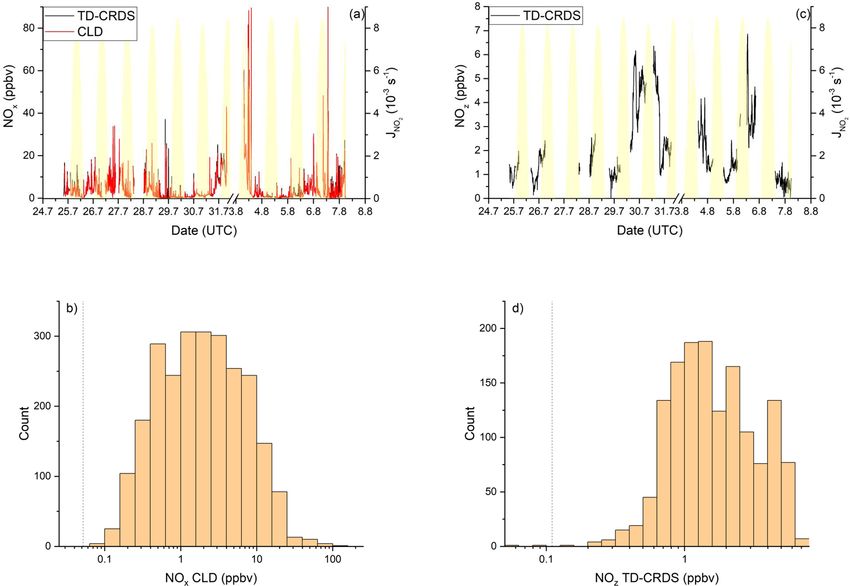
N. Friedrich et al.: Reactive nitrogen around the Arabian Peninsula 9
Chemical sources of NOx in the Mediterranean Sea, i.e. from
the photolysis of HONO and pNit, as well the reaction of OH
and HNO3 , are discussed in detail in Sect. 3.4.
In the following, we examine the contribution of ship
emissions to the NOx budget in the Mediterranean region and
especially along the track taken by the Kommandor Iona dur-
ing the AQABA campaign. In Fig. S5 we plot a time series of
NOx and SO2 data for the transit through the Mediterranean
Sea. It is immediately apparent that large plume-like features
in NOx coincide with similar features in SO2 . We now sep-
arate the data set into two regimes in which the NOz and
NOy measurements indicate either relatively “fresh” emis-
sions (NOz / NOy ratio < 0.4) or relatively “aged” emis-
sions (NOz / NOy ratio > 0.8). In Fig. 5a we show that, for
fresh emissions, SO2 and NOx are highly correlated (Pear-
son’s R = 0.84) with a slope of 4 ± 0.1 ppbv NOx per ppbv
SO2 and an intercept (at zero SO2 ) of −1.9 ± 0.3 ppbv. This
strongly suggests that fresh NOx emissions are generally ac-
companied by SO2 and thus indicates that either ships or
power plants, e.g. in coastal locations, are the likely sources
of a large fraction of the NOx . The slope is similar to that
derived by Celik et al. (2020) (2.7 ± 0.8), who examined sin-
gle ship plumes in a more detailed analysis and with litera-
ture values that range from 6.8 ± 6.3 near the coast of Texas
(Williams et al., 2009) to 11.2 ± 10.9 (Diesch et al., 2013)
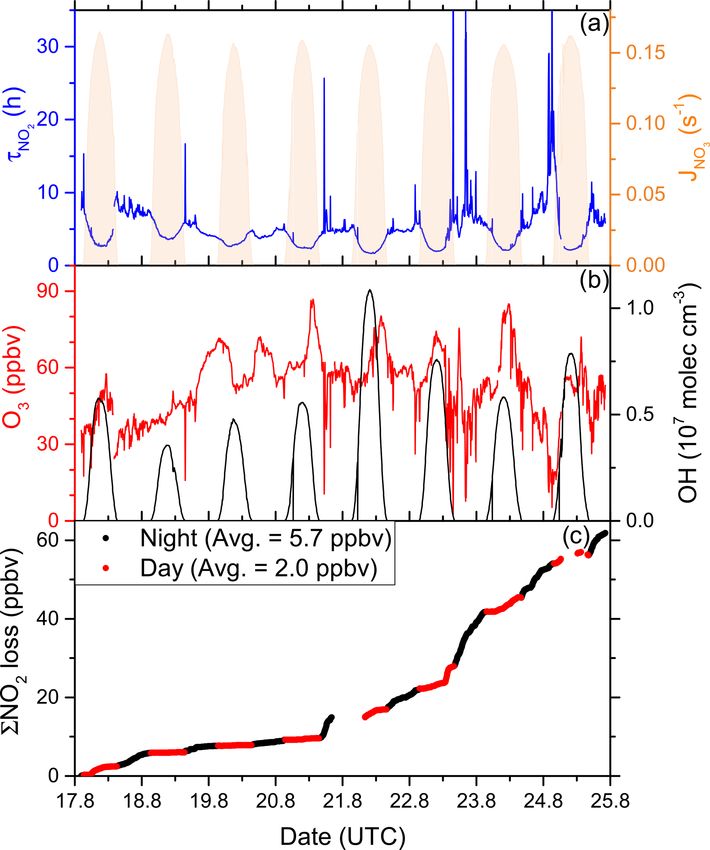
Figure 4. (a) Lifetime (τ ) of NO2 due to reactions with OH and O3
at the Elbe river near Hamburg/Germany. In comparison to
in the Mediterranean Sea, together with concentrations of O3 and
OH. The OH trace is an interpolation based on OH measurements Celik et al. (2020), however, the two other literature stud-
and JO1 D (see Sect. 3.1.3). Daytime hours are indicated via JNO3 . ies only sampled very fresh and unprocessed ship plumes,
(b) Cumulative loss of NO2 during the displayed time frame, based from a distance of less than ca. 5 km to the emission source.
on the calculated lifetimes and measured NO2 . Fig. 5a shows that NOz and SO2 are not correlated (Pearson’s
R = 0.38) in air masses impacted by fresh emissions.
In more aged air masses (Fig. 5b) the slope of NOx per
and the measured O3 concentration into Eq. (1) and using SO2 is, as expected, much smaller (0.16 ± 0.01 ppbv NO2
preferred rate coefficients for k3 and k8 (IUPAC, 2020) we per ppbv SO2 ) which reflects the significantly longer life-
derive lifetimes (Fig. 4a) of ∼ 2 h at local noon (largest OH time of SO2 (∼ 10 d) compared to NOx . After a few days of
levels) and 5–6 h at night. Loss of NOx by deposition may transport an air mass containing co-emitted NOx and SO2
be important in forested regions (Delaria et al., 2018; De- will still contain SO2 but the initially emitted NOx will, to
laria and Cohen, 2020) but is expected to be insignificant in a large extent, have been converted to NOz . The intercept
a marine environment. The relative importance of day- and (NOx = 0.049 ± 0.005 ppbv at zero SO2 ) is consistent with
night-time losses of NO2 in the Mediterranean Sea during the re-generation of NOx from NOz (see above) but is also in
AQABA was estimated by integrating the two loss terms us- the area of the detection limit of the NOx measurement.
ing the available NO2 , O3 , and OH data. Averaged over the The plot of NOz versus SO2 for aged emissions indicates
6 d of measurements, 3.71 ppbv of NOx was lost per 12 h day a significant intercept (at zero SO2 ) of 0.4 ppbv NOz . As the
and 1.51 ppbv was lost per 12 h night (Fig. 4c). lifetime of SO2 (∼ 10 d) is longer than of NOz (∼ half a day)
Although our conclusion is based on a limited data set, (Dickerson et al., 1999; Romer et al., 2016), the residual
we calculate that the OH-induced daytime loss of NOx is NOz at zero SO2 cannot stem directly from ship emissions
most important in the Mediterranean Sea, reflecting the high (or combustion sources that generate both NOx and SO2 ) but
levels of OH encountered during AQABA, but we note that represents the background level of NOz in the Mediterranean
night-time losses make a significant contribution. It is very Sea in aged air masses and is consistent with an average
likely that in other seasons with reduced photochemical ac- HNO3 mixing ratio of 0.48 ppbv observed during the MINOS
tivity and lower temperatures (which favour the formation of campaign at Finokalia on Crete (Metzger et al., 2006).
N2 O5 which can remove two NO2 molecules via heteroge- The analysis above, when combined with back-trajectory
neous processes), the night-time losses gain in relative im- information, provides clear evidence that shipping emissions
portance. Averaged over the entire data set obtained in the are responsible for a large fraction of NOx in the Mediter-
Mediterranean Sea, we calculate a lifetime of NO2 of 3.9 h. ranean Sea. The impact of shipping emissions on the atmo-
https://doi.org/10.5194/acp-21-1-2021 Atmos. Chem. Phys., 21, 1–26, 2021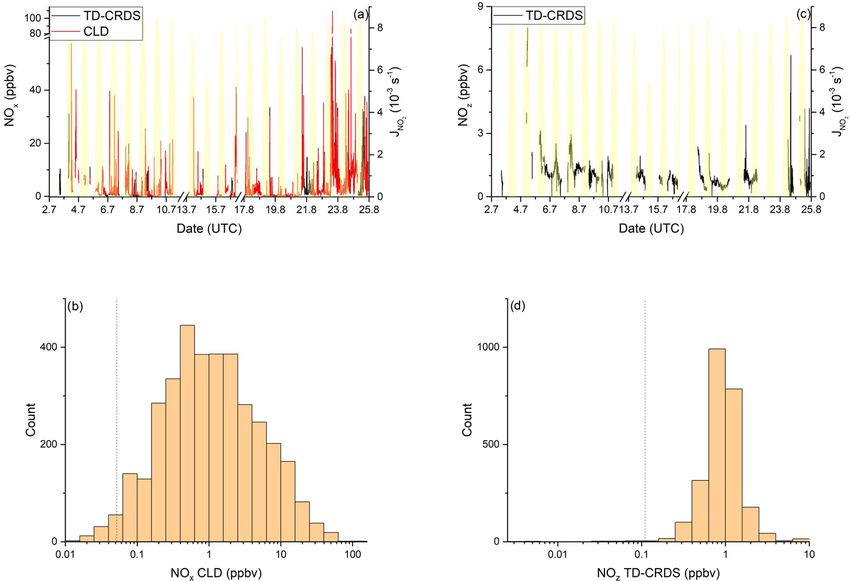
10                                                     N. Friedrich et al.: Reactive nitrogen around the Arabian Peninsula

                                                                 on the first leg and 17–25 August 2017 on the second leg. On
                                                                 the first leg, the Kommandor Iona reversed direction in the
                                                                 northern Red Sea three times (twice for 9 h and once for 6 h),
                                                                 in order to sail into the wind and avoid contamination by the
                                                                 ship’s own stack. Additionally, there was a 3 d layover in Jed-
                                                                 dah (10 to 13 July 2017). Temperatures on the first leg were
                                                                 usually above 27 ◦ C, with maxima of 37–38 ◦ C in the Suez
                                                                 Canal, in Jeddah, and on the approach to Bab al-Mandab. The
                                                                 relative humidity was usually between ca. 60 % and 80 % but
                                                                 dropped below 30 % in the Suez Canal and in Jeddah. Winds
                                                                 came predominantly from northerly directions with speeds
                                                                 generally between 2 and 10 m s−1 . On the second leg, tem-
                                                                 peratures were constantly above 30 ◦ C in the southern Red
                                                                 Sea; relative humidities were similar to the first leg. The wind
                                                                 was consistently from the north, with wind speeds between
                                                                 5 and 12 m s−1 until the ship reached the Suez region. Dur-
                                                                 ing the first leg, the air masses intercepted above the northern
                                                                 Red Sea were impacted by emissions from Cairo and the Nile
                                                                 valley. Two-day back-trajectories for the southern Red Sea
                                                                 start in the centre of the Red Sea and do not indicate trans-
                                                                 port from the Suez region. Extended back-trajectories for the
                                                                 southern Red Sea showed that 3 to 4 d prior to sampling, the
                                                                 air parcel passed over southern Egypt, and 5 to 6 d before
                                                                 it was located over the Cairo area. Similar back-trajectories
                                                                 were obtained for the second leg. Air masses in the northern
                                                                 Red Sea were influenced by the Suez region, north-eastern
                                                                 Egypt, and Israel.

                                                                 3.2.1   NOx

                                                                 NOx mixing ratios in the Red Sea (excluding the 3 d layover
                                                                 in the port of Jeddah) as measured by the TD-CRDS and the
                                                                 CLD instruments are displayed in Fig. 6a. NOx mixing ratios
                                                                 were highly variable and there were only short periods free
                                                                 of NOx plumes > 10 ppbv (e.g. during the second leg on 19
                                                                 and 20 August 2017). The mean NOx mixing ratios (2.8 ppbv
Figure 5. Correlation between SO2 and NOx or NOz for (a) fresh
and (b) aged NOx emissions in the Mediterranean Sea.             measured by the TD-CRDS and 3.2 ppbv measured by the
                                                                 CLD) were therefore significantly higher than the median
                                                                 values of 1.0 ppbv. Figure 6b indicates that the NOx mixing
                                                                 ratios are broadly distributed around the median of 1.0 ppbv
spheric sulfur budget has been assessed in numerous stud-
                                                                 with 21 % of all data points > 3 ppbv. The highest NOx lev-
ies which identify coastal areas and international shipping
                                                                 els during AQABA were found in narrow shipping corridors
lanes as important hotspots for SO2 emissions (Capaldo et
                                                                 of the Suez region and the Strait of Bab al-Mandab. When ex-
al., 1999; Dalsøren et al., 2009; Eyring et al., 2010), with
                                                                 cluding the Suez and Bab al-Mandab regions, a median NOx
emissions of SO2 severely impacting air quality in port re-
                                                                 mixing ratio of 0.7 ppbv can be derived for the maritime cen-
gions (Isakson et al., 2001; Cooper, 2003; Saxe and Larsen,
                                                                 tral part of the Red Sea.
2004; Marmer and Langmann, 2005; Ledoux et al., 2018). A
                                                                    To the best of our knowledge, in situ measurements in
detailed analysis of SO2 data with regard to ship emissions
                                                                 the Red Sea area are not available for comparison with our
during AQABA is provided by Celik et al. (2020), who anal-
                                                                 NOx data. Satellite-based modelling studies show that high
ysed emission factors from individual ship plumes during the
                                                                 NO2 column densities above the Red Sea are associated
AQABA campaign.
                                                                 with shipping emissions (Richter et al., 2004; Alahmadi et
3.2   Red Sea                                                    al., 2019), which is consistent with our observation of a
                                                                 strong correlation between NOx and SO2 (see below). Jo-
Measurements over the Red Sea (from the Suez Canal and           hansson et al. (2017) have estimated a NOx emission rate of
the Strait of Bab al-Mandab) were made from 2–16 July 2017       0.70 t km−2 yr−1 for the Red Sea (including the Suez region).

Atmos. Chem. Phys., 21, 1–26, 2021                                                    https://doi.org/10.5194/acp-21-1-2021
N. Friedrich et al.: Reactive nitrogen around the Arabian Peninsula 11
Figure 6. NOy measurements in the Red Sea. Dashed lines signify the instrument detection limits. (a) NOx mixing ratios by CLD and TD-
CRDS. (b) Frequency distribution of NOx mixing ratios during 2–16 July 2017 and 17–24 August 2017, excluding the layover in Jeddah.
(c) NOz mixing ratios by TD-CRDS. (d) Frequency of NOz mixing ratios during 2–16 July 2017 and 17–24 August 2017. The yellow shaded
regions show JNO2 . The vertical dotted lines are the limits of detection of the respective measurements.
3.2.2 NOz budget and the air quality in the Red Sea region (as discussed
in Sect. 3.2.1).
For the Red Sea, we have defined four subregions in
The mean mixing ratio of NOz over the Red Sea was which we calculate the contributions of NOx and various
1.0 ppbv, with a maximum value of 8.0 ppbv measured in the NOz species to NOy : these are RS1 on the first leg and RS2,
Gulf of Suez on the first leg. NOz mixing ratios are narrowly RS3, and RS4 on the second leg. Note that RS1 and RS4 are
distributed (see Fig. 6d) around a median value of 0.7 ppbv, both located in the northern Red Sea, but the measurements
with 53 % of the measurements between 0.4 and 1.0 ppbv and (∼ 5 weeks apart) revealed different chemical characteristics;
41 % between 1.0 and 4.0 ppbv. hence the separate treatment.
The NOz / NOy ratios along the ship’s track are plotted in Due to poor data coverage, mainly of organic nitrates, we
Fig. 7: values > 0.6 were mostly observed over the northern were not able to perform this calculation in further subre-
Red Sea on the first leg, after leaving the Gulf of Suez. On gions on the first leg. In all four regions, NOx was the largest
the second leg, the NOz / NOy ratio was higher in the south- component of NOy which results from continuous NOx input
ern Red Sea. NOz data coverage was limited in the Red Sea from onshore and shipping emissions.
on both legs and the NOz / NOy ratio was more variable than In RS1 we observed the lowest contribution (36.4 %) of
values found in the Mediterranean Sea and the Arabian Gulf. NOx to NOy and the largest contribution of ONs (23.8 %)
The high variability in the NOz / NOy ratios is caused by the to NOy , over the Red Sea. The latter value is the highest
route of the Kommandor Iona along the main shipping lane found during the entire AQABA campaign and is compa-
connecting the Suez Canal and the Gulf of Aden and the fre- rable to the contribution of HNO3 (30.0 %). In roughly co-
quent sampling of plumes from nearby ships. The observed located RS4, but 5 weeks later, the NOx contribution was
NOz / NOy ratios of < 0.6 in the Red Sea highlight the im- much larger (69.5 %). The divergent median NOx / NOy and
pact of NOx emissions from shipping on the reactive nitrogen NOz / NOy for subregions RS1 and RS4 can be understood
https://doi.org/10.5194/acp-21-1-2021 Atmos. Chem. Phys., 21, 1–26, 202112 N. Friedrich et al.: Reactive nitrogen around the Arabian Peninsula
proach to Suez provides the NOx required for formation of
organic nitrates (ONs). Meteorological conditions addition-
ally favoured a build-up of ONs during our passage through
RS1: elevated wind speeds of up to 11 m s−1 coincided with
temperatures below 30 ◦ C, which slowed down the thermal
decomposition of PAN (peroxyacetyl nitrate) compared to
the ca. 35 ◦ C regime in the Arabian Gulf. Average PAN mix-
ing ratios, as measured by chemical ionisation mass spec-
troscopy (CIMS), were 190 pptv in this area, which consti-
tutes ca. 20 % of the total ONs signal. On the second leg in
RS4, the fractional contribution of ONs was overshadowed
by the stronger impact of NOx pollution from the Suez re-
gion (see above).
In RS1 and RS4 the contributions of HONO and ClNO2
to NOy were minor (≤ 3 %). RS2 and RS3 are both located
in the southern half of the Red Sea. For RS3 we observed
the highest contribution (15 %) of AMS-measured partic-
ulate nitrate to NOy , and RS3 was characterised in large
parts by coarse-mode OPC fractions > 85 % (i.e. (PM10 -
PM1 ) / PM10 ; see 18 and 19 August 2017 in Fig. S1). It
is reasonable to assume that the coarse-mode particle mass
concentrations in this area was due to sea salt, which reacts
heterogeneously with HNO3 to form particle-phase nitrates
(Mamane and Gottlieb, 1990). Refractory sea salt aerosol
particles in the PM1 size range are, however, not expected
to be detectable via AMS (Jimenez et al., 2003) or with only
very low efficiency (ca. 1 %) (Zorn et al., 2008).
Region RS2 shows a intermediate behaviour, as
NOz / NOy increases after leaving Bab al-Mandab and
Figure 7. The NOz / NOy ratio over the Red Sea during the (a) first transported air only came from the surrounding southern
and (b) second leg. Coloured lines are 2 d back-trajectories (HYS- Red Sea without being influenced by shore-side anthro-
PLIT). The pie charts indicate the components of NOy at var- pogenic activities. Here, NOx and HNO3 contribute 57 %
ious segments along the ship’s track (ONs = organic nitrates, and 27 %, respectively. The relatively high NOx contri-
pNit = particulate nitrate). HNO3 was calculated via HNO3 = NOz bution, considering the remote area, can be explained by
– (ONs + pNit + NOx + ClNO2 + HONO). The colours of the pie sampling ship plumes on the departure from Bab el-Mandab,
chart segments are assigned as follows (clockwise): pNit in yel-
which led to several NOx peaks above 10 ppbv (see Fig. 6a).
low, NOx in red, HNO3 in green, ONs in blue, ClNO2 in grey, and
Consequently, background NOx levels also did not fall
HONO in magenta (© Google Maps).
below ca. 1.5 ppbv on the night from 17 to 18 August 2017.
Overall, the fractional contributions of NOx were positively
biased by short-term spikes in NOx mixing ratios caused
when one examines the air mass back-trajectories for the two by ship plumes in all Red Sea subregions. The use of mean
legs. On the second leg, strong northerly winds transported values to assess the fractional contributions of NOy species
NOx from the highly polluted southern end of the Gulf of in certain subregions is thus a caveat of this analysis, as NOz
Suez to RS4, whereas during the first leg the back-trajectory signals exhibit less variability during pollution events (see
for RS1 passed (with lower wind speeds) mainly over east- Fig. 6c). Employing the median values, however, would not
ern Egyptian deserts, with emissions from Cairo requiring allow the relative contributions to NOy to be assessed.
36 h to reach RS1 during which a significant fraction of NOx
was converted to NOz . We expect that the large contribution
3.2.3 Lifetime and sources of NOx
of ONs in RS1 is a result of the unique chemical environment
at the southern end of the Gulf of Suez and in the north-
ern Red Sea. A large coherent oil field is located south of Analogous to Sect. 3.1.3, we now investigate the day- and
the Gulf of Suez and the coast of eastern Egypt (Alsharhan, night-time chemical losses of NO2 in the Red Sea (see
2003), and the numerous facilities for oil extraction result Fig. 8). As described previously, we used an interpolated OH
in abundant emissions of VOCs, while the proximity to the data set based on a scaling factor between the available OH
Gulf of Suez and the narrowing shipping corridor on the ap- data and JO1 D .
Atmos. Chem. Phys., 21, 1–26, 2021 https://doi.org/10.5194/acp-21-1-2021N. Friedrich et al.: Reactive nitrogen around the Arabian Peninsula 13
Figure 8. (a) Lifetime (τ ) of NO2 due to reactions with OH and O3
along the second Red Sea leg, together with concentrations of O3
and OH. The OH trace is an interpolation based on OH measure-
ments and JO1 D (see Sect. 3.2.3). Daytime hours are indicated via
JNO3 . (b) Cumulative loss of NO2 during the displayed time frame,
based on the calculated lifetimes and measured NO2 .
Figure 9. Correlation between SO2 and NOx or NOz for (a) fresh
As OH was not measured over the Red Sea on the first and (b) aged NOx emissions in the Red Sea.
leg, our analysis is restricted to the second leg only. Daytime
NO2 lifetimes with respect to loss by reaction with OH were
usually in a range between 2 and 4 h, with a minimum of 1.7 h trated in Fig. 9 and summarised in Table 2, which reveal a
on 21 August 2017, where the noon-time OH concentration positive correlation (slope of 3.7 ± 0.1 and a regression coef-
peaked at 1.1 × 10⁷ molec. cm−3 . Night-time NO2 lifetimes ficient R of 0.61) between NOx and SO2 in air masses con-
(determined by O3 levels) exhibited a larger variability but taining freshly emitted pollutants. Six data points far above
were mostly between 5 and 10 h. The average (day and night) 20 ppbv (range 43–128 ppbv SO2 ) were excluded, as they
NO2 lifetime in the Red Sea was 5.0 h. would bias the linear regression result. Including these data
Over the entire period of measurements in the Red Sea (8 d points lowers the slope to 1.26 ± 0.04 and the correlation co-
and 8 nights) we calculate that a cumulative total of 62 ppbv efficient R to 0.40. The NOx / SO2 ratio is thus highly vari-
of NO2 were lost (Fig. 8c). Despite the shorter lifetime of able throughout the Red Sea, potentially reflecting variable
NO2 at noon, the greater integrated loss of NO2 occurred NOx / SO2 emission ratios of different vessels, using various
during night-time (5.7 ppbv per night on average) when con- fuels, as well as the impact (on NOx ) of offshore oil-drilling
tinually high O3 levels (median 54 ppbv) were available. At rigs and shore-side oil refineries. The latter are most impor-
midday, NO2 mixing ratios are reduced due to the shift in tant in the northern Red Sea, whereas shipping emissions
the NO2 / NO ratio caused by the rapid photolysis of NO2 dominate in the narrow shipping lanes of the Suez Canal.
and also because the OH levels are highest then. On average, For chemically aged air masses, the NOx / SO2 ratio
daytime loss rates were 2.0 ppbv per day. is 0.20 ± 0.01 with R = 0.61 and the reduction in slope re-
In order to assess the contribution of shipping on NOx flecting the shorter lifetime of NOx compared to SO2 . We
emissions, we correlated NOx and SO2 mixing ratios for find, however, that in chemically aged air masses, NOz and
freshly emitted (NOz / NOy < 0.4) and chemically more SO2 are highly correlated (Fig. 9b) with a slope NOz / SO2
aged (NOz / NOy > 0.8) air masses. The results are illus- of 1.25 ± 0.04 and R = 0.85. The intercept (see Fig. 9b) at an
https://doi.org/10.5194/acp-21-1-2021 Atmos. Chem. Phys., 21, 1–26, 2021You can also read