Wavelength calibration of Brewer spectrophotometer using a tunable pulsed laser and implications to the Brewer ozone retrieval - Atmos. Meas. Tech
←
→
Page content transcription
If your browser does not render page correctly, please read the page content below
Atmos. Meas. Tech., 11, 3759–3768, 2018
https://doi.org/10.5194/amt-11-3759-2018
© Author(s) 2018. This work is distributed under
the Creative Commons Attribution 4.0 License.

Wavelength calibration of Brewer spectrophotometer using a
tunable pulsed laser and implications to the Brewer ozone retrieval
Alberto Redondas1,2 , Saulius Nevas3 , Alberto Berjón4,2 , Meelis-Mait Sildoja3 , Sergio Fabian León-Luis1,2 ,
Virgilio Carreño1,2 , and Daniel Santana-Díaz4,2
1 Agencia  Estatal de Meteorología, Izaña Atmospheric Research Center, Tenerife, Spain
2 Regional Brewer Calibration Center for Europe, Izaña Atmospheric Research Center, Tenerife, Spain
3 Physikalisch-Technische Bundesanstalt (PTB), Braunschweig, Germany
4 University of La Laguna, Department of Industrial Engineering, S.C. de Tenerife, Spain

Correspondence: Alberto Redondas (aredondasm@aemet.es)

Received: 15 December 2017 – Discussion started: 31 January 2018
Revised: 25 May 2018 – Accepted: 1 June 2018 – Published: 27 June 2018

Abstract. In this contribution we present the wavelength cal-   1981; Kerr, 2010) was introduced in the 1980s as an auto-
ibration of the travelling reference Brewer spectrometer of     matic device measuring direct solar UV radiation and global
the Regional Brewer Calibration Center for Europe (RBCC-        UV irradiance. Both the Brewer and the Dobson instruments
E) at PTB in Braunschweig, Germany. The wavelength cali-        were considered by the World Meteorological Organization
bration is needed for the calculation of the ozone absorption   (WMO) in the framework of the Global Atmosphere Watch
coefficients used by the Brewer ozone algorithm. In order       program (GAW) as the standard instruments for TOC moni-
to validate the standard procedure for determining Brewer’s     toring. The wavelength calibration is needed for calculation
wavelength scale, a calibration has been performed by using     of the ozone absorption coefficient used by the Brewer ozone
a tunable laser source at PTB in the framework of the EMRP      retrieval algorithm. The Brewer spectrophotometer has two
project ENV59 ATMOZ “Traceability for the total column          operating modes. In the ozone mode, used for the total ozone
ozone”. Here we compare these results to those of the stan-     column and aerosol measurements, the diffraction grating
dard procedure for the wavelength calibration of the Brewer     stays at a fixed position while the six operational wavelengths
instrument. Such a comparison allows validating the standard    are selected by a rotating slit mask (Table 1). The scanning
methodology used for measuring the ozone absorption co-         mode is used to perform spectral irradiance measurements
efficient with respect to several assumptions. The results of   in the UV spectral range. In this mode, the slits are fixed
the laser-based calibrations reproduces those obtained by the   and the spectral scan is carried out by turning the diffraction
standard operational methodology and shows that there is an     grating. The usual wavelength calibration procedure is per-
underestimation of 0.8 % of the ozone absorption coefficients   formed in the scanning mode by analyzing recorded emis-
due to the use of the parametrized slit functions.              sion lines of the spectral discharge lamps, which are usu-
                                                                ally mercury (Hg), cadmium (Cd), and zinc (Zn). The use of
                                                                the spectral lines provided in Table 2 allow us to determine
                                                                the central wavelengths and the corresponding full-width-
1   Background                                                  at-half-maximum (FWHM) of the slit functions as well as
                                                                the relation between the positions of the grating and the cor-
Nowadays the primary ground-based instruments used to           responding instrument wavelengths (dispersion relation) re-
report total ozone column (TOC) are Dobson and Brewer           quired to determine the operational wavelengths used for the
spectrophotometers. Based on the irradiances measured by        ozone determination. To obtain the ozone absorption coeffi-
these instruments in the ultraviolet (UV) spectral range and    cients, the instrumental slit functions are convolved with the
on well-defined retrieval procedures, TOC values are de-
rived. The Brewer spectrometer (Brewer, 1973; Kerr et al.,

Published by Copernicus Publications on behalf of the European Geosciences Union.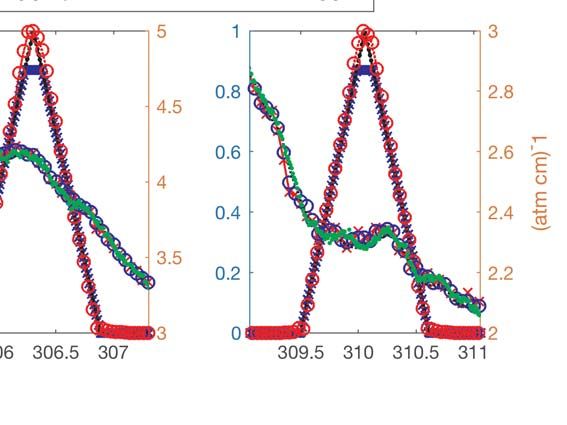
3760                                                                      A. Redondas et al.: Brewer Wavelength Calibration

Table 1. Slits and wavelengths used in the Brewer operative algo-    Table 2. Emission lines of the discharge lamps used for Brewer
rithms. The table provides the mean and the standard deviation of    calibration.
the central wavelengths and the full-width-half-maximum (FWHM)
in nanometres of the slits of the “average” Brewer spectrophotome-                        Lamp             Line (nm)   Slits
ter determined during RBCC-E campaigns (Redondas et al., 2014).
                                                                                          Mercury (Hg)       289.36    0–1
                                                                                          Hg                296.728    0–3
         Slit   Wavelength       SD    FWHM          SD                                   Zinc (Zn)         301.836    0–5
         0         306.301     0.014      0.548   0.016                                   Zn                303.578    0–5
         2         310.051     0.014      0.539   0.015                                   Cd (multiplet)    308.082    0–5
         3         313.501     0.015      0.555   0.012                                   Cd               313.3167    0–5
         4         316.801     0.017      0.545   0.012                                   Cd               326.1055    0–5
         5         320.002     0.019      0.538   0.012                                   Zn                328.233    0–5
                                                                                          Hg                334.148    0–5
                                                                                          Cd               340.3652    0–5
                                                                                          Cd                349.995    4–5
Bass & Paur ozone absorption cross-section data. The use of                               Cd (multiplet)    361.163      5
a tunable laser source allows us to do the following:

  – The calculation of the ozone absorption coefficients                  lamps at the end of spectral range of the Brewer spec-
    from the calibration directly in the ozone mode. The                  trophotometer and due to the fact that the emission lines
    normal determination of the ozone absorption coeffi-                  of the used lamps are not equally spaced.
    cients involves scanning of the spectral lines in the scan-
    ning mode of the instrument so that the dispersion rela-
    tion is required to convert the grating positions in mi-
                                                                     2   Calibration of the Brewer spectrophotometer
    crometre steps to the respective wavelengths. Here we
    can determine the instrumental slit functions directly           The Brewer instrument measures the irradiance of direct sun-
    in the ozone mode by scanning them with the tunable              light at six nominal wavelengths (λ) in the UV range: 303.2,
    laser and weight them with the ozone absorption cross-           306.3, 310.1, 313.5, 316.8 and 320.1 nm, each spectral band
    sections without the need of assumption about the slit           covering a bandwidth of 0.5 nm (resolving power λ/δλ of
    functions and the dispersion relations used in the nor-          around 600). The spectral resolution is achieved by a holo-
    mal calibration procedure (See Sect. 2).                         graphic grating in combination with a slit mask that selects
  – The calculation of the dispersion relation based on reg-         the channel to be analyzed by a photomultiplier tube (PMT).
    ularly spaced reference spectral lines, provided by the          The longest four wavelengths are used for the ozone calcula-
    tunable laser instead of the irregularly distributed emis-       tion. Based on the Lambert–Beer law, the total ozone column
    sion lines of the Hg, Cd and Zn spectral lamps.                  in the Brewer algorithm can be expressed as follows:
                                                                          F − ETC
  During the experiment we performed three measurements:             X=                                                         (1)
                                                                            αµ
  1. The standard method for the dispersion measurements             where F are the measured double ratios corrected for
     using spectral lamps described in Sect. 2.                      Rayleigh effects, α is the ozone absorption coefficient, µ is
                                                                     the ozone air mass factor, and ETC is the extra-terrestrial
  2. Direct dispersion measurements (laser scanning). While          constant. The F , α and ETC parameters are weighted func-
     the Brewer spectrophotometer is measuring in the ozone          tions at the operational wavelengths with weighting coeffi-
     mode, the laser wavelength is swept ±2 nm with a step           cients wi :
     of 0.04 nm around the six Brewer operational wave-
     lengths selected by the rotating slit mask for different             4
                                                                          X                 p
     grating positions (Fig. 1)                                      F=        wi F i −        βi µ,                            (2)
                                                                           i
                                                                                            p0
  3. Dispersion measurements using the tunable laser                      4
                                                                          X
     (Brewer scanning). While the laser is emitting at a fixed       α=        w i αi ,                                         (3)
     wavelength in the range from 290 to 365 nm with an                    i
                                                                               4
     increment of 5 nm, the Brewer instrument scans ±2 nm                      X
     around these wavelengths in the scanning mode by mov-           ETC =          wi F0i ,                                    (4)
                                                                                i
     ing the grating and using the six slits. The results allow
     us to estimate the dispersion approximation error due to        where, βi are the Rayleigh coefficients, p is the climatologi-
     the lack of spectral lines available from the discharge         cal pressure at the measurement site, p0 is the pressure at sea

Atmos. Meas. Tech., 11, 3759–3768, 2018                                                      www.atmos-meas-tech.net/11/3759/2018/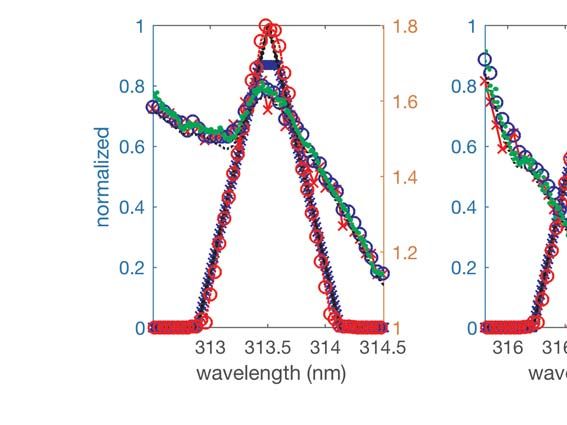
A. Redondas et al.: Brewer Wavelength Calibration 3761
1.2 1.2 1.2
FWHM: 0.57 FWHM: 0.56 FWHM: 0.55
1 303.20 1 306.30 1 310.06
303.20 306.30 310.06
0.8 0.8 0.8
0.6 0.6 0.6
0.4 0.4 0.4
0.2 0.2 0.2
0 0 0
302 303 304 305 306 307 309 310 311
Wavelength (nm) Wavelength (nm) Wavelength (nm)
1.2 1.2 1.2
FWHM: 0.57 FWHM: 0.56 FWHM: 0.55
1 313.51 1 316.80 1 320.01
313.51 316.80 320.01
0.8 0.8 0.8
0.6 0.6 0.6
0.4 0.4 0.4
0.2 0.2 0.2
0 0 0
313 314 316 317 318 319 320 321
Wavelength (nm) Wavelength (nm) Wavelength (nm)
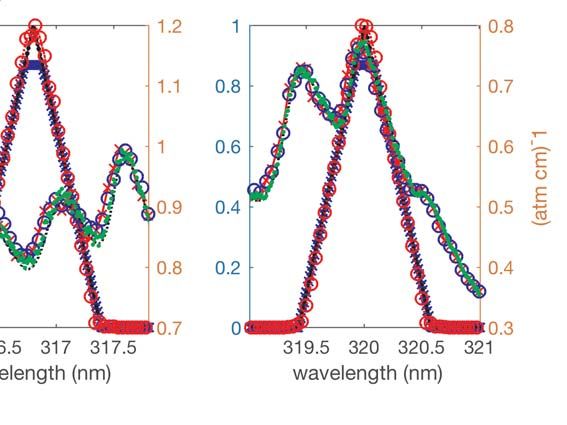
Figure 1. Results of Brewer measurements in the ozone mode obtained while the laser wavelength was changed every 0.04 nm. The central
wavelength and the FWHM calculated are displayed in red using the same methodology of the dispersion test.
level, and F0 are the individual extra-terrestrial constants at 3. Finally, the ETC transfer is performed by comparison
each wavelength. The weights w = [1, −0.5, −2.2, 1.7] have with the reference Brewer instrument or, in the case of
been chosen to minimize the influence of SO2 and verify the the reference instruments, by the Langley method.
following: The Brewer wavelength calibration follows the operative
procedure (Gröbner et al., 1998; Kerr, 2002) used by the Re-
4
X
wi = 0, (5) gional Brewer Calibration Center for Europe (RBCC-E) at
i
the calibration campaigns. In summary, the individual wave-
4 lengths (bands) in the Brewer instrument are selected through
the use of a stainless steel mask of seven slits located at the
X
wi λi = 0. (6)
i focal plane of the spectrometer. The particular wavelength is
determined by analyzing the measurements of a series of dis-
This widely eliminates absorption features which depend, charge lamps during so-called dispersion test, which deter-
in local approximation, linearly on the wavelength, like for mines the central wavelength and FWHM of every slit. Then
example the contribution from aerosols. the wavelength setting is optimized to minimize the effect of
We can divide the calibration in three steps including wavelength shift during the operation of the instrument by
instrumental calibration, wavelength calibration, and ETC performing the so-called sun-scan test (Lamb and Asbridge,
transfer: 1996). Finally, the ozone absorption coefficient is determined
for every slit.
1. The instrumental calibration includes all the parameters The ozone absorption coefficient were defined as follows
that affect the double ratios (F ) obtained from the sig- (Vanier and Wardle, 1969; Bernhard et al., 2005):
nals measured with the different slits in front of the P !
Eo (λ)S(λ, λi )10−σ (λ)Xµ−β(λ) Po ν dλ
R
PMT, in particular, photomultiplier dead time correc-
log
tion, temperature coefficients and filter attenuation. P
Eo (λ)S(λ, λi )10−β(λ) Po ν dλ
R
αi (λ) = , (7)
2. Wavelength calibration is needed to determine the Xµ
ozone absorption coefficient. The so-called “dispersion where S is the instrumental slit function for the corre-
test” is used to obtain the particular wavelengths for sponding wavelength, E is the sun spectrum at this wave-
the instrument and the slits, or instrumental functions, length that depends mostly on the ozone concentration and
of each spectrophotometer. Note that the precise wave- air-mass, and σ is the ozone cross-section at the temperature
lengths of every Brewer spectrophotometer are slightly of −46.3 ◦ C for Dobson and at −45 ◦ C for Brewer instru-
different from instrument to instrument. ments.
www.atmos-meas-tech.net/11/3759/2018/ Atmos. Meas. Tech., 11, 3759–3768, 2018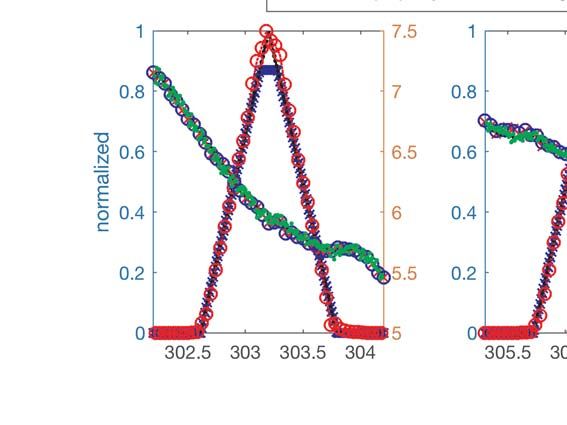
3762                                                                      A. Redondas et al.: Brewer Wavelength Calibration

   The Brewer operative method uses the following assump-
tions:
 1. Only “ideal” slits are used; the slit functions are
    parametrized as trapezoids, i.e. isosceles triangles trun-
    cated at 0.87 height.
 2. Stray light is not considered, i.e. zero slit function val-
    ues are assumed outside the triangle.
 3. The FWHM of the triangle is considered different for
    every slit. It is calculated from the dispersion test, deter-
    mined in micrometre steps and then converted to wave-
    lengths using the dispersion relation (Fig. 2).
 4. The ozone cross sections are expressed by the Bass &
    Paur absorption coefficient data set.
 5. Solar spectrum is considered constant on the slit.
                                                                    Figure 2. Slit function of the slit 3 (320 nm) measured in the scan-
   Under these assumptions, the ozone effective absorption          ning mode: the standard method uses the normalized values only
is essentially obtained the same way as in the approximation        between 0.2 and 0.8 (points with crosses). The figure shows the
method of Bernhard et al. (2005) used with Dobson spec-             signals recorded during the scans (orange diamonds) and the non-
trophotometers (see Eq. 8).                                         linearity-corrected values (blue circles) in counts s−1 . The hystere-
                                                                    sis is evident from the asymmetry of the uncorrected signals in the
        σ (λ)Si (λ, λ0 )dλ0
      R
                                                                    low signal region of the plot. The centre steps and the FWHMs cal-
αi = R                                                   (8)
           Si (λ, λ0 )dλ0                                           culated from the up-scan are shown in red while the values derived
                                                                    from the down-scanned slit function are presented in blue text. The
Dispersion Test                                                     central wavelength determination is not affected by the nonlinearity
                                                                    but the apparent FWHMs would be larger if the non-linearity cor-
The Brewer spectrophotometer is constructed based either            rection were not applied. The resulting parametrized slits are repre-
on a single or a double monochromator of modified Ebert–            sented on the right axis.
Fastie type, generally referred to as single or double Brewer,
respectively. The first monochromator disperses the incom-
ing radiation onto six exit slits. In the case of the double-       is used to transform the previously determined central posi-
monochromator Brewer, the six exit slits (intermediate slits)       tions and FWHMs of the slit functions in micrometre steps
of the first monochromator are the entrance slits to a second       to a wavelength scale.
monochromator that is used in subtractive mode. The wave-              The cubic approximation method of Gröbner et al. (1998)
length is selected by choosing one of the six exit slits (ozone     uses knowledge of the optical design of the Brewer spec-
mode) or rotating the grating (scanning mode). The rotation         trometer to transfer results of the spectral line measurements
of the grating is managed by a drive mechanism consisting of        from one slit to the other slits, which reduces the number of
a motor-driven micrometre linked to an arm that rotates the         free parameters to be adjusted compared with the quadratic
grating. The smallest wavelength increment corresponding            method. However, there is a systematic difference between
to one stepper motor step varies steadily from approximately        the ozone absorption coefficients calculated by the two meth-
8.0 to 7.0 pm (Gröbner et al., 1998).                               ods. Both methods generally agree only in the ozone spectral
   The dispersion relation, which provides the relation be-         range of the Brewer instrument (Redondas and Rodriguez-
tween the micrometre steps and the monochromator set                Franco, 2014).
wavelengths, is determined by scanning the emission lines              The stability of the wavelength calibration during Brewer
as described in Sect. 1. The line scans are carried out with        operations is checked by measuring the internal Hg lamp. In
an increment of 10 motor steps (0.7 Å). From the results, the       most of the Brewers, the 302 nm double line (302.150 and
central position and the FWHM of the slit function are cal-         302.347 nm) is used due to its proximity to the Brewer op-
culated in motor steps assuming an isosceles triangle. Both         erational wavelengths. However, for Brewer #185 and for an
sides of the peak are fitted to a straight line taking only the     increasing number of other Brewers the test is performed us-
function values above 20 and below 80 % of the normalized           ing the more powerful 296.7 nm line. The wavelength test
peak. The central point is calculated by the intersection point     includes 12 measurements of the line from the mercury lamp
and the FWHM is the width of the triangle (Fig. 2). Finally,        on slit 0, with an increment of ±10 steps of the microme-
the dispersion relation is calculated using a quadratic poly-       tre motor. The obtained curve for the line peak is compared
nomial or the cubic polynomial approximation. This relation         to a stored reference one. The comparison is done by shifting

Atmos. Meas. Tech., 11, 3759–3768, 2018                                                 www.atmos-meas-tech.net/11/3759/2018/
A. Redondas et al.: Brewer Wavelength Calibration                                                                                              3763

Figure 3. Pulsed OPO-based setup at PTB that was used for measuring the slit functions of the Brewer spectrophotometer.

the two scanned curves against each other and calculating the                                              Brewer nolinearity correction
                                                                                                   10 3
correlation coefficient between the two after each shift. The
interpolated step number yielding the maximum of the cor-
relation coefficient provides the reference micrometre posi-                                       10 2

tion (Savastiouk, 2006). If the required adjustment of the mi-
                                                                       Brewer/monitor normalized

crometre position is more than one and a half motor steps, the                                     10 1
test is repeated. Hence, the accuracy of the wavelength set-
ting of the Brewer instrument achieved by such an approach
                                                                                                   10 0
is defined by a rectangular probability distribution function
on the interval of ±0.5
                    √ steps. Thus, the respective standard
uncertainty is 0.5/ 3 = 0.289 steps. During the brewer op-                                     10 -1

eration at RBCC-E calibration campaigns the ozone observa-
tions are discarded if the subsequent hg test is repeated, the                                 10 -2
bigger discrepancy for the accepted measurements will be
1.5 steps. This 1.5 affects the ozone absorption coefficient by
                                                                                               10 -3
approximately of 0.1 atm cm−1 and the ozone concentration                                          10 2   10 3           10 4           10 5    10 6
                                                                                                                                   -1
by 0.3 %.                                                                                                        Brewer counts s

                                                                      Figure 4. Log–log plot of the normalized ratio of measured Brewer
                                                                      counts to the monitor photodiode signal, which is proportional to
3     Pulsed laser-based measurements
                                                                      the laser power, plotted as a function of the Brewer counts s−1 . The
                                                                      black points shows the measured points while the red curve is the
3.1    Instrumental setup                                             fit used to correct the Brewer signals for the nonlinearity.

For the characterization of the bandpass functions of the
Brewer instrument, an upgraded PLACOS setup (Nevas
et al., 2009) featuring a tunable pulsed laser system based           beam. The photocurrent of the silicon photodiode was mea-
on an optical parametric oscillator (OPO) was used at                 sured by an electrometer. During the measurements, the laser
Physikalisch-Technische Bundesanstalt (PTB) in Braun-                 wavelengths were monitored by a wavemetre (laser spectrum
schweig (Fig. 3). The new OPO system generates 3–6 ns                 analyzer) and a high-resolution spectrometer with a FWHM
pulses at 1 kHz repetition rate in the spectral range from 210        of 0.1 nm. The wavelength accuracy of the wavemetre ac-
to 2600 nm. The laser beam was guided into the direct port of         cording to the manufacturer’s specifications is between 6 and
the Brewer spectrophotometer by using a liquid light guide.           3 pm in the spectral range from 290 to 360 nm, respectively.
A fraction of the beam was directed to a monitor photodiode           The calibration of the instrument is accomplished by means
in order to account for the output power changes of the laser         of an autocalibration procedure based on an internally built-

www.atmos-meas-tech.net/11/3759/2018/                                                                     Atmos. Meas. Tech., 11, 3759–3768, 2018
3764 A. Redondas et al.: Brewer Wavelength Calibration
Brewer ozone mode raw counts mic=1020
Slit no. 0 Slit no. 1 Slit no. 2 Slit no. 3 Slit no. 4 Slit no. 5 Slit no. 6
10 4 10 4
10 4
Brewer raw counts
10 3 10 3
10 3
10 2
10 2 10 2
10 1
10 1 10 1
302 303 304 305 306 307 309 310 311
10 4 10 4 10 4
Brewer raw counts
10 3 10 3
10 3
10 2 10 2
10 2
10 1 10 1
10 1
312 313 314 315 316 317 318 319 320 321
Wavelength (nm) Wavelength (nm) Wavelength (nm)
Figure 5. Brewer measurements in the ozone mode while the laser wavelength is changed every 0.04 nm. The orange curve corresponds to
the dark counts obtained from the measurements of slit 1.
in neon lamp. The wavelength scale of the high-resolution of pulsed sources, the PMT manual advises changing the
spectrometer was calibrated by using the spectral emission electronics configuration. As the main objective was to val-
lines of a Hg lamp. The wavelength uncertainty of the cal- idate the operational wavelength calibration of the Brewer,
ibrated spectrometer in the above-mentioned spectral range we decided to keep the instrument configuration equivalent
was estimated to be 10 pm. A side-by-side comparison of the to that during the field operations. The non-linearity problem
laser wavelength values measured by both instrument types was solved by determining the respective correction func-
showed an agreement well within 10 pm. tion. For this purpose, the power of the laser beam was varied
In contrast with the standard calibration procedure, where while simultaneously measuring signals of the PMT and the
the Brewer instrument scans the lines of the spectral lamps, in linear monitor photodiode.
this experiment the Brewer measures in ozone mode. Here, The ratios of the measured Brewer counts to the recorded
the Brewer grating is fixed at the ozone position while the monitor photodiode signals are shown in Fig. 4. The non-
coupled laser beam is measured using the seven slits (slit #1 linearity is evident together with hysteresis region near
is used to obtain the dark signal values). During these mea- 104 Brewer counts s−1 . The correction is not reliable around
surements the wavelength of the OPO system is scanned with 103 counts s−1 and lower than 100 counts s−1 . As we can
0.04 nm step. The experiment is complemented by the mea- control the power of the laser beam, it is possible to work
surements in the Brewer scanning mode, where the tunable on the “flat regions” of the non-linearity characteristics and
laser is used as a source of spectral lines covering the range apply the determined correction. This correction does not af-
from 290 to 360 nm on a regular grid with 5 nm step. fect the calculated central wavelength of the slit functions,
though, it does affect the determined FWHM values (Fig. 2)
3.1.1 Non-linearity of the PMT if the correction is not applied.
We observed that the recorder dark signal values (mea-
The Brewer detector system, which is based on a PMT, re- surements performed with the blocked slit #1) were highest
sponds non-linearly to pulsed sources. For the measurements
Atmos. Meas. Tech., 11, 3759–3768, 2018 www.atmos-meas-tech.net/11/3759/2018/A. Redondas et al.: Brewer Wavelength Calibration 3765
Figure 6. Plot of the parametrized (thick lines, left axis) and the measured slit functions (dots, left axis), as well as the different ozone
cross-sections in cm−1 (right axis) used for the Brewer effective ozone absorption coefficient calculation.
Table 3. Ozone absorption coefficients in atm cm−1 calculated using four ozone absorption cross-sections, together with the trapezoidal and
the triangular parametrization of the slit functions, as well as the directly measured slit functions. Percentage difference is also given between
the absorption coefficients yielded by the parameterized and the directly measured slit functions.
Trapezoid Triangular Measured % Trapezoid % Triangular
BRW 0.3381 0.3395 0.3406 −0.73 −0.33
B&P 0.3331 0.3344 0.3359 −0.85 −0.44
DMB 0.3483 0.3498 0.3514 −0.86 −0.45
SGW 0.3393 0.3407 0.3422 −0.84 −0.43
immediately after exposing the PMT to the laser light (see tee (“Absorption Cross Sections of Ozone”) (Orphal et al.,
Fig. 5). The dark signal of the PMT was then gradually fast 2016).
decreasing with time after the excitation, which may cause Among the available data sets there are versions of Bass
the signal values obtained for slit #1 (measured immediately and Paur (1985) cross-sections denoted as Brewer opera-
after slit #0) be higher than for the other slits measured after- tional (Brw), IGACO quadratic coefficient (B&P), the cross-
wards. sections of Daumont Brion Malicet (DBM) (Daumont et al.,
1992; Brion et al., 1993; Malicet et al., 1995), and the newly
3.1.2 Slit parametrization recommended data set for ozone ground-based calculation
by Serdyuchenco, Groshelev, Weber (SGW) (Serdyuchenko
The Brewer algorithms assume trapezoidal slits functions cut et al., 2012; Gorshelev et al., 2014; Weber et al., 2016).
at 0.87 of the height (Fig. 6) with the centre wavelength and Using the measured slit functions, the calculated effective
the FWHM calculated for every slit from the dispersion re- ozone cross sections are ∼ 0.85 % higher compared to those
lation. The laser measurements allow us to estimate the ef- obtained by using the parametrized Brewer slits in the stan-
fect on the ozone calculation if we use the directly measured dard procedure (Table 3), this difference is reduced approx-
slit functions instead of the parametrized ones. For this pur- imately by a half when a triangular parametrization is used
pose we calculate the ozone absorption coefficients for the (0.44 %), the results are very similar for all the cross sections,
four ozone cross sections evaluated in the “ACSO” commit-
www.atmos-meas-tech.net/11/3759/2018/ Atmos. Meas. Tech., 11, 3759–3768, 20183766 A. Redondas et al.: Brewer Wavelength Calibration
Figure 7. Differences between the central wavelengths (a) and FWHMs (b) determined directly and by the scanning methods, with the laser
wavelengths in equally spaced grid every 5 nm and lines of the discharge lamps. In both cases quadratic and cubic fits are used.
Table 4. Ozone absorption coefficient, in atm cm−1 , calculated using four absorption cross sections.
brw_scana opo_quadb opo_cubicc lamp_quadd lamp_cubice
SGW 0.3409 0.3442 0.342 0.3446 0.3412
Ratio 1 0.9881 1.0033 1.0108 1.001
a Laser wavelength scanned at a fixed Brewer grating position. b Brewer grating position. changed at fixed
laser wavelength, dispersion approx. a quadratic function. c Brewer grating pos. changed at fixed laser
wavelength, dispersion approx. a cubic function. d Brewer grating pos. changed at fixed lamp emission
wavelength, dispersion approx. a quadratic function. e Brewer grating pos. changed at fixed lamp emission
wavelength, dispersion approx. a cubic function.
with the exception of the Bass & Paur used by the Brewer al- than for the cubic fit (Fig. 8). This indicates that the quadratic
gorithm due its low resolution. fit is only valid in the ozone range (310–320 nm) as already
noted in Gröbner et al. (1998). The comparison of the calcu-
lated FWHMs (Fig. 7) shows a different pattern with a dif-
4 Discussion ference of 0.1 Å between the direct and the scanning methods
in the ozone range and with a smaller difference between the
The experiment allows us to validate the Brewer standard quadratic and the cubic fits.
methodology used to perform the wavelength calibration. For The differences between the ozone absorption coefficients
this purpose, we compare laser-based wavelength calibration calculated from the scanning and the direct measurements of
results to those yielded by the standard operative method the slit functions are summarized for the six measurements
based on scanning the spectral lamps in case of both the in Table 4, taking the direct measurements as a reference.
quadratic and the cubic fit to the dispersion relation. The quadratic fits result in bigger differences of around 1 %,
Figure 7 shows discrepancies between the central wave- whereas in the case of the cubic fits the differences decrease
lengths calculated by the quadratic and the cubic fits to be to 0.3 and 0.1 % when the laser or the discharge lamps are
bigger than 0.1 Å for wavelength above 320 nm and much used, respectively.
bigger near 350 nm. This is also indicated by a systematic
shape of the residuals of the quadratic fit that are much larger
Atmos. Meas. Tech., 11, 3759–3768, 2018 www.atmos-meas-tech.net/11/3759/2018/A. Redondas et al.: Brewer Wavelength Calibration 3767
Data availability. The data used for the present study can be made
available after personal communication with the authors of the pa-
per.
Competing interests. The authors declare that they have no conflict
of interest.
Special issue statement. This article is part of the special issue
“Quadrennial Ozone Symposium 2016 – Status and trends of at-
mospheric ozone (ACP/AMT inter-journal SI)”. It is a result of
the Quadrennial Ozone Symposium 2016, Edinburgh, United King-
dom, 4–9 September 2016.
Acknowledgements. This work has been supported by the Euro-
Figure 8. Residuals of the quadratic (filled circles, solid lines) and
pean Metrology Research Programme (EMRP) within the joint
cubic (dashed lines) fits. The colour indicates the six Brewer slits
research project ENV59 “Traceability for atmospheric total column
with the laser wavelengths in equally spaced grid every 5 nm.
ozone” (ATMOZ). The EMRP is jointly funded by the EMRP
participating countries within EURAMET and the European Union.
5 Conclusions Edited by: Alkiviadis Bais
Reviewed by: Lionel Doppler and Julian Gröbner
1. Using the measured slit functions instead of the
parametrized ones increases the ozone absorption co-
efficients and consequently the calculated ozone values
by 0.8 %.
References
2. The quadratic dispersion relation fit used in the standard
Brewer algorithm is not suitable outside the ozone spec- Bernhard, G., Evans, R. D., Labow, G. J., and Oltmans, S. J.:
Bias in Dobson total ozone measurements at high latitudes due
tral range 310–320 nm. The residuals show a systematic
to approximations in calculations of ozone absorption coeffi-
pattern, which is particularly important at the upper end
cients and air mass, J. Geophys. Res.-Atmos., 110, D10305,
of the spectral range. https://doi.org/10.1029/2004JD005559, 2005.
Brewer, A. W.: A replacement for the Dobson spec-
3. The comparison of the results of the three experiments trophotometer?, Pure Appl. Geophys., 106, 919–927,
shows a maximum difference of 0.3 % if the cubic fit https://doi.org/10.1007/BF00881042, 1973.
is used to approximate the dispersion relation of the Brion, J., Chakir, A., Daumont, D., Malicet, J., and Parisse,
Brewer instrument. The respective difference between C.: High-resolution laboratory absorption cross section of
the ozone absorption coefficient that is obtained from O3 . Temperature effect, Chem. Phys. Lett., 213, 610–612,
https://doi.org/10.1016/0009-2614(93)89169-I, 1993.
the direct measurements of the tunable laser in the
Daumont, Brion, J., Charbonnier, J., and Malicet, J.:
ozone mode and from the operative discharge lamp
Ozone UV spectroscopy I: Absorption cross-sections
method is only of 0.1 %, if both use the parametrized at room temperature, J. Atmos. Chem., 15, 145–155,
or measured slit. This confirms the standard procedure https://doi.org/10.1007/BF00053756, 1992.
used for the RBCC-E calibrations. Gorshelev, V., Serdyuchenko, A., Weber, M., Chehade, W., and
Burrows, J. P.: High spectral resolution ozone absorption cross-
4. This work validates the current wavelength calibration sections – Part 1: Measurements, data analysis and comparison
method of the Brewer network and shows that in general with previous measurements around 293 K, Atmos. Meas. Tech.,
there is no need for the characterization of the network 7, 609–624, https://doi.org/10.5194/amt-7-609-2014, 2014.
Gröbner, J., Wardle, D. I., McElroy, C. T., and Kerr,
Brewer instruments with a tuneable source. However,
J. B.: Investigation of the wavelength accuracy of
the limitations of the quadratic dispersion approxima- Brewer spectrophotometers, Appl. Optics, 37, 8352–8360,
tion used over extended spectral range of Brewers MK- https://doi.org/10.1364/AO.37.008352, 1998.
III and MK-IV are evident. Thus, we suggest updating Kerr, J.: New methodology for deriving total ozone and other at-
the operating Brewer software for this model instru- mospheric variables from Brewer spectrophotometer direct sun
ments with the recent version, which already includes spectra, J. Geophys. Res.-Atmos., 107, ACH 22-1–ACH 22-17,
the cubic dispersion. https://doi.org/10.1029/2001JD001227, 2002.
www.atmos-meas-tech.net/11/3759/2018/ Atmos. Meas. Tech., 11, 3759–3768, 20183768 A. Redondas et al.: Brewer Wavelength Calibration Kerr, J. B.: The Brewer Spectrophotometer, in: UV Radiation in Redondas, A. and Rodriguez-Franco, J. J.: Regional Brewer Cali- Global Climate Change, edited by: Gao, W., Slusser, J. R., and bration Center Europe CEOS campaigns: Instrumental Findings, Schmoldt, D. L., 160–191, Springer, Berlin Heidelberg, 2010. in: Quadrennial International Ozone Symposium, 14th WMO- Kerr, J. B., McElroy, C. T., and Olafson, R. A.: Measurements of GAW Brewer Users Group Meeting EUBREWNET & WMO ozone with the Brewer ozone spectrophotometer, in: Proceed- GAW, 2014. ings of the Quadrennial Ozone Symposium held in Boulder, Col- Redondas, A., Evans, R., Stuebi, R., Köhler, U., and We- orado, August 1980, 74–79, J. London, 1981. ber, M.: Evaluation of the use of five laboratory-determined Lamb, K. and Asbridge, A. I.: Brewer Technical Note No.96.01 Sun ozone absorption cross sections in Brewer and Dobson re- scans and relationship to the wavelength calibration step number, trieval algorithms, Atmos. Chem. Phys., 14, 1635–1648, Tech. rep., International Ozone Services, 1996. https://doi.org/10.5194/acp-14-1635-2014, 2014. Malicet, Daumont, D., Charbonnier, J., Parisse, C., Chakir, A., and Savastiouk, V.: Improvements to the direct-sun ozone ob- Brion, J.: Ozone UV spectroscopy. II. Absorption cross-sections servations taken with the Brewer spectrophotometer, PhD and temperature dependence, J. Atmos. Chem., 21, 263–273, thesis, York University, Toronto, Ontario, Canada, 44–57, https://doi.org/10.1007/BF00696758, 1995. available at: https://www.esrl.noaa.gov/gmd/grad/neubrew/docs/ Nevas, S., Lindemann, M., Sperling, A., Teuber, A., and Maass, R.: publications/VladimirSavastiouk_PhD_thesis.pdf (last access: Colorimetry of LEDs with array spectroradiometers, Mapan, 24, 20 June 2018), 2006. 153–162, 2009. Serdyuchenko, A., Gorshelev, V., Weber, M., Chehade, W., and Orphal, J., Staehelin, J., Tamminen, J., Braathen, G., De Backer, Burrows, J. P.: High spectral resolution ozone absorption cross- M.-R., Bais, A., Balis, D., Barbe, A., Bhartia, P. K., Birk, sections – Part 2: Temperature dependence, Atmos. Meas. Tech., M., Burkholder, J. B., Chance, K., von Clarmann, T., Cox, A., 7, 625–636, https://doi.org/10.5194/amt-7-625-2014, 2014. Degenstein, D., Evans, R., Flaud, J. M., Flittner, D., Godin- Vanier, J. and Wardle, D.: The effects of spectral resolution on total Beekmann, S., Gorshelev, V., Gratien, A., Hare, E., Janssen, C., ozone measurements, Q. J. Roy. Meteor. Soc., 95, 395–399 1969. Kyrölä, E., McElroy, T., McPeters, R., Pastel, M., Petersen, M., Weber, M., Gorshelev, V., and Serdyuchenko, A.: Uncertainty bud- Petropavlovskikh, I., Picquet-Varrault, B., Pitts, M., Labow, G., gets of major ozone absorption cross sections used in UV re- Rotger-Languereau, M., Leblanc, T., Lerot, C., Liu, X., Moussay, mote sensing applications, Atmos. Meas. Tech., 9, 4459–4470, P., Redondas, A., Van Roozendael, M., Sander, S. P., Schnei- https://doi.org/10.5194/amt-9-4459-2016, 2016. der, M., Serdyuchenko, A., Veefkind, P., Viallon, J., Viatte, C., Wagner, G., Weber, M., Wielgosz, R. I., and Zehner, C.: Absorp- tion cross-sections of ozone in the ultraviolet and visible spectral regions: Status report 2015, J. Mol. Spectrosc., 327, 105–121, 2016. Atmos. Meas. Tech., 11, 3759–3768, 2018 www.atmos-meas-tech.net/11/3759/2018/
You can also read