Burst error characteristics in probabilistic constellation shaping
←
→
Page content transcription
If your browser does not render page correctly, please read the page content below
IEICE Communications Express, Vol.10, No.10, 775–779

                                 Burst error characteristics in
                                 probabilistic constellation
                                 shaping
                                  Akira Naka1, a)
                                  1   Department of Electrical and Electronic Systems Engineering, Ibaraki University,
                                  4–12–1 Naka-Narusawa, Hitachi-shi, Ibaraki 316–8511, Japan
                                  a) akira.naka.dr@vc.ibaraki.ac.jp

                                  Abstract: Bit error rate (BER) characteristics of Probabilistic Amplitude
                                  Shaping system is evaluated with a novel matching improvement operation
                                  at an inverse-distribution matcher (DM−1 ) using soft information of log-
                                  likelihood ratio value as well as an interleaving of multiple BCH (Bose-
                                  Chaudhuri-Hocquenghem) codewords used as outer forward error correction
                                  (FEC). The obtained results show that the large size interleaver dramatically
                                  eliminates BER floor, while the proposed matching improvement operation
                                  successfully suppresses the increase in errors due to burst errors occurred in
                                  the DM−1 process and low-density parity-check code (LDPC) process used as
                                  an internal FEC.
                                  Keywords: probabilistic amplitude shaping, forward error correction, dis-
                                  tribution matcher, interleaver
                                  Classification: Fiber-Optic Transmission for Communications

                                      References

                                  [1] G. Böcherer, F. Steiner, and P. Schulte, “Bandwidth efficient and rate-matched
                                      low-density parity-check coded modulation,” IEEE Trans. Commun., vol. 63,
                                      no. 12, pp. 4651–4665, 2015. DOI: 10.1109/TCOMM.2015.2494016
                                  [2] F. Buchali, F. Steiner, G. Böcherer, L. Schmalen, P. Schulte, and W. Idler,
                                      “Rate adaptation and reach increase by probabilistically shaped 64-QAM: An
                                      experimental demonstration,” J. Lightw. Technol., vol. 34, no. 7, pp. 1599–1609,
                                      2016. DOI: 10.1109/JLT.2015.2510034
                                  [3] J. Cho and P.J. Winzer, “Probabilistic constellation shaping for optical fiber
                                      communications,” J. Lightw. Technol., vol. 37, no. 6, pp. 1590–1607, 2019. DOI:
                                      10.1109/JLT.2019.2898855
                                  [4] T. Yoshida, M. Karlsson, and E. Agrell, “Hierarchical distribution matching for
                                      probabilistically shaped coded modulation,” J. Lightw. Technol., vol. 37, no. 6,
                                      pp. 1579–1589, 2019. DOI: 10.1109/JLT.2019.2895065
                                  [5] A. Naka, “Performance of probabilistic amplitude shaping with BICM-ID,” Elec-
                                      tron. Lett., vol. 57, no. 5, pp. 226–228, 2021. DOI: 10.1049/ell2.12093
                                  [6] Y. Miyata, R. Sakai, W. Matsumoto, H. Yoshida, and T. Mizuochi, “Reduced-
                                      complexity decoding algorithm for LDPC codes for practical circuit implemen-
                                      tation in optical communications,” OWE5, OFC/NFOEC 2008. DOI: 10.1109/
                                      OFC.2008.4528592
©   IEICE 2021
DOI: 10.1587/comex.2021XBL0117
Received June 1, 2021
Accepted June 30, 2021
Publicized July 8, 2021
Copyedited October 1, 2021

                                                                                                                            775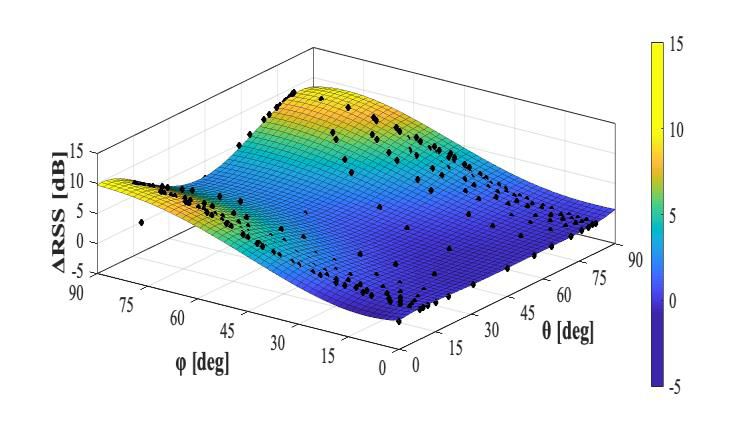
IEICE Communications Express, Vol.10, No.10, 775–779

                                 1 Introduction
                                 Probabilistic amplitude shaping (PAS) modulation is one of coded modulation for-
                                 mats that uses the non-uniformly distributed symbols on a conventional Quadrature
                                 Amplitude Modulation (QAM) constellation to realize both flexible transmission
                                 capacity and high SNR sensitivity. The PAS is a promising format to construct high-
                                 speed optical transmission systems and has been massively investigated in recent
                                 years [1, 2, 3, 4, 5].
                                     The PAS system uses a distribution matcher (DM) and an inverse-DM (DM−1 ),
                                 each of which converts a uniformly distributed binary data block into a distributed
                                 amplitude data block at the transmitter and vice versa at the receiver. When an
                                 unexpected amplitude data block that cannot be generated by the DM is input to the
                                 DM−1 , the conversion to the binary bit data block cannot be operated properly and
                                 a burst error will occur [4].
                                     This study proposes the novel DM−1 operation using soft information of log-
                                 likelihood ratio (LLR) value to reduce the Bit Error Rate (BER) degradation due to
                                 the burst error. The characteristics are numerically evaluated in a system configu-
                                 ration having an interleaver installed before the DM and an inverse-interleaver after
                                 the DM−1 . The obtained results demonstrate that the proposed operation effectively
                                 suppresses the BER degradation.

                                 2 Calculation model
                                 2.1 Overall system configuration
                                 Figure 1 shows an overall system configuration of PAS systems to be evaluated,
                                 composed of an DM and an DM−1 , a two-dimensional 64-QAM modulator and a
                                 demodulator, an interleaver and an inverse-interleaver, and two pairs of different
                                 forward error correction (FEC) encoders and decoders. The two types of FEC
                                 respectively use BCH (Bose-Chaudhuri-Hocquenghem) code as an external code
                                 and low-density parity-check code (LDPC) as an internal code. In addition to the
                                 PAS system, a conventional 64-QAM system with a uniform amplitude distribution
                                 is also evaluated for comparison, where the DM or the DM−1 is not applied in the
                                 configuration illustrated in Fig. 1.
                                      A uniformly distributed binary bit sequence is generated by interleaving 10,000
                                 codewords from the BCH encoder. The bit sequence is then fed into the DM
                                 and divided into some blocks, each of them is converted to a respective amplitude
                                 sequence by a block conversion according to a look-up table (LUT). The amplitude
                                 sequence is then converted to a binary signal by Gary coding and then input to
                                 the LDPC encoder. As the final step at the transmitter, the binary bit sequence of
                                 the LDPC encoder output is input to the modulator to generate 64-QAM symbol,

©   IEICE 2021
DOI: 10.1587/comex.2021XBL0117
Received June 1, 2021                                         Fig. 1. Calculation model
Accepted June 30, 2021
Publicized July 8, 2021
Copyedited October 1, 2021

                                                                                                                           776
IEICE Communications Express, Vol.10, No.10, 775–779

                                 where the data bits and redundant bits of the LDPC output are respectively used
                                 as plus or minus signs and amplitudes for 64-QAM symbols. Note that the data
                                 bits are identical to the binary bit input to the LDPC encoder, since the LDPC is
                                 a systematic encoder [1]. After Additive White Gaussian Noise (AWGN) is added
                                 to the modulated signal, the reverse process of the transmitter is performed on the
                                 receiver by a bitwise 64-QAM demodulator [1], the two types of FEC decoder, the
                                 DM−1 and the inverse-interleaver. BERs are evaluated at four positions after the
                                 demodulator, the LDPC decoder, the DM−1 , and the BCH decoder.
                                     The LUT used in the DM is assumed to have a block size of (k, n) = (10, 10),
                                 where k is a length of an input binary data block and n is a length of an out-
                                 put amplitude block, respectively. The LUT have 10,240 (= 210 × 10) amplitude
                                 elements to form quantized Gaussian distribution as much as possible. Specific
                                 probability distribution is (67.41%, 27.64%, 4.63%, 0.32%) for 64-QAM amplitude
                                 of (1, 3, 5, 7), the corresponding entropy of which is 4.26 bit/symbol. Note that a
                                 10-length amplitude block is converted to a 20-length binary data block by Gray
                                 coding.
                                     The DM−1 process has a novel matching improvement operation proposed in
                                 this paper that uses not only binary data after hard decision but also LLR data from
                                 the LDPC that contains uncertainty information of the decision. If a 10-length
                                 amplitude data block after a hard decision operation is not present in the LUT,
                                 the least reliable binary data in the corresponding 20-length binary data block is
                                 identified by the LLR data to be inverted to recalculate the amplitude element in the
                                 block. Then, the reproduced amplitude data block is attempted to match again with
                                 every amplitude data block in the LUT. This attempt is performed once in this study
                                 but can be iteratively performed. In this study, the BERs are evaluated both by the
                                 DM−1 without this matching operation as deDM1 as well as by the DM−1 with the
                                 operation as deDM2 for comparison.
                                     The two types of FEC, namely the LDPC and the BCH code used in this study
                                 are both defined by Digital Video Broadcasting–Satellite–Second Generation. Every
                                 LDPC codeword is assumed have a length of 64,800 with a code rate of 2/3. The
                                 number of LDPC decoding iterations is set to be 20 for its inner loop. Every BCH
                                 codeword has a length of 21,600 and a code rate of 99.1% for the PAS system so as
                                 to match the LDPC codeword length considering block conversion ratio of k/n at
                                 the DM process. The error correction capability of the BCH code is 12 in this case.
                                 In the conventional 64-QAM system, the LDPC is the same as in the PAS system,
                                 but the different length of BCH code is applied since it does not have DM process.
                                 The BCH code for the 64-QAM system has a codeword length of 43,200, a code rate
                                 of 99.6%, and an error correction capability of 10.
                                     Interleaving is a well-known technique for improving FEC performance by dis-
                                 tributing multiple errors resulting from a burst error in one codeword across multi-
                                 ple codewords. Some BCH codewords from the DM−1 may contain multiple error
                                 bits due to burst errors caused by either the DM−1 or the LDPC decoder. The
                                 inverse-interleaver between the DM−1 and the BCH decoder performs an operation
                                 of regularly exchanging bits of the multiple bit sequences having the same length as
©   IEICE 2021
DOI: 10.1587/comex.2021XBL0117   the BCH codeword from the DM−1 . In this study, N is a value from 1 to 100, where
Received June 1, 2021
Accepted June 30, 2021           N represents the size of the interleaver or inverse-interleaver, that is, the number of
Publicized July 8, 2021
Copyedited October 1, 2021

                                                                                                                            777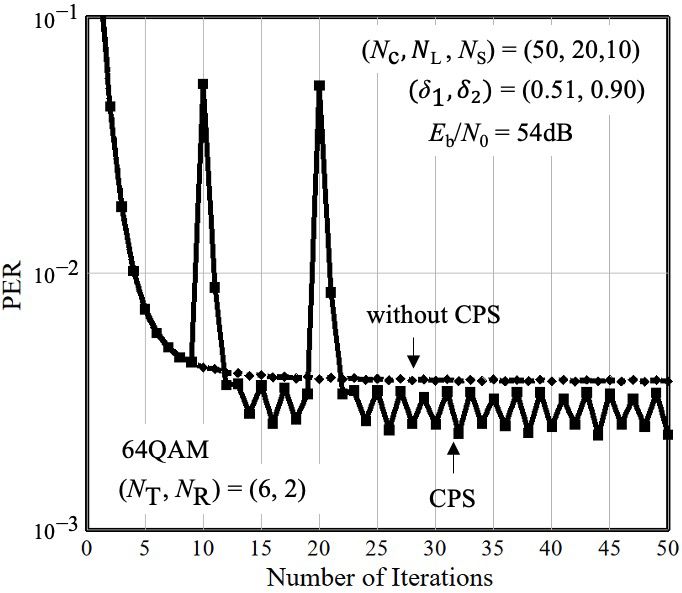
IEICE Communications Express, Vol.10, No.10, 775–779

                                 BCH frames to be exchanged. Note that N = 1 corresponds to a condition in which
                                 interleaving is not applied.

                                 3 Calculation result and discussion
                                 Fig. 2 (a) shows BER characteristics after the demodulator and after the LDPC in
                                 the conventional 64-QAM systems as a function of the signal-to-noise ratio (SNR:
                                 Es /No ). As shown by the purple circles in Fig. 2 (a), the LDPC rapidly improves
                                 BER with increasing a value of SNR, but a slight BER floor is observed when BER
                                 is less than 10−5 . This floor is frequently observed in post-LDPC BER that depends
                                 on the girth value in the parity check matrix [6].
                                      Fig. 2 (b) shows the BER characteristics of the 64-QAM, in which the scale
                                 on the vertical and horizontal axes of Fig. 2 (a) is enlarged to illustrate BER after
                                 BCH respectively for N = 1, 10 and 100, in addition to illustrating the BER after
                                 LDPC again. The BCH coding in combination with the interleaving successfully
                                 eliminates the BER floor caused by the burst errors at the LDPC and works better
                                 with the larger sized interleavers.
                                      Fig. 2 (c) shows the BER characteristics of the PAS systems after the demodulator
                                 and after the LDPC, in which an enhanced BER floor is observed. The cause of the
                                 enhanced floor is presumed to be the highly asymmetric distribution of LLR values
                                 due to the strong shaping affecting LDPC decoding [3]. The reason of the enhanced
                                 BER floor should be further investigated.
                                      Fig. 2 (d) shows the BER of the PAS systems in the enlarged scale after the BCH

                                            Fig. 2. BER as a function of Signal-to-Noise ratio per symbol.
                                                    (a) and (b) 64-QAM systems, (c) and (d) PAS systems.
©   IEICE 2021
DOI: 10.1587/comex.2021XBL0117                      Each position of BER evaluation is shown in the legend
Received June 1, 2021
Accepted June 30, 2021
                                                    in each figure.
Publicized July 8, 2021
Copyedited October 1, 2021

                                                                                                                           778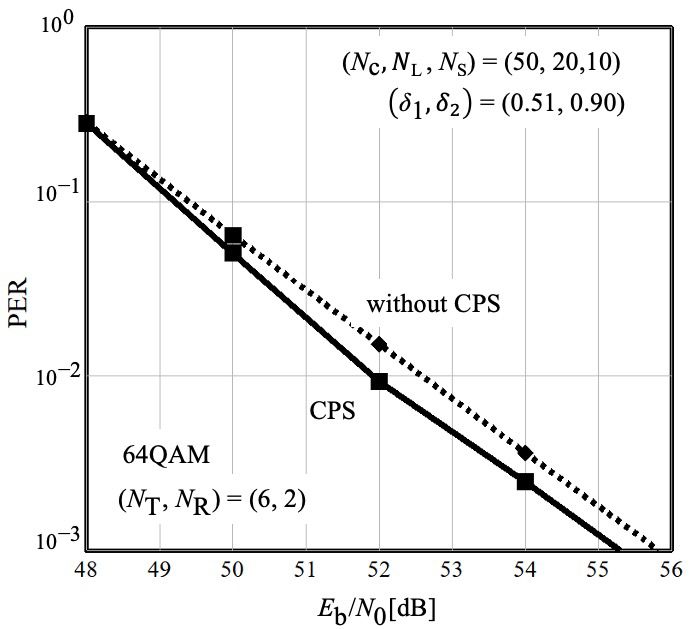
IEICE Communications Express, Vol.10, No.10, 775–779

                                 and the DM−1 s with and without matching improvement operation, as well as BER
                                 after the LDPC again. As shown by the yellow squares, the BER characteristics
                                 is deteriorated by about 10 times due to burst error in the DM−1 under all SNR
                                 conditions, but as shown by the yellow triangles, the deterioration is reduced to
                                 about 80% by the matching improvement operation of deDM2. As indicated by red
                                 squares and triangles, the BCH with the interleaver of N = 1 improves the BER
                                 after the DM−1 to some extent but cannot eliminate the degraded BER floor. On the
                                 other hand, the BCH with the interleaver of N = 10 or 100 dramatically eliminates
                                 the error floor as shown by the bule and green marks. Note that the BER improved
                                 by the matching operation is maintained even after the interleaving regardless of the
                                 size of the interleaving, as indicated by comparing the triangles and the squares of
                                 each color.
                                      Figs. 3 (a) and (b) respectively show the BER characteristics at SNR values of
                                 13.95 dB for the 64-QAM systems and 7.57 dB as a function of the interleaver size
                                 for the PAS system. The results show that the interleaving respectively work better
                                 with the larger size of interleavers. A closer inspection reveals that the interleaving
                                 works more effectively in the PAS system than 64-QAM system at the interleaver
                                 size of 20. This size corresponds to the length of a Gray decoded binary data block,
                                 that is, the length of amplitude data block of the LUT on the DM−1 .

                                            Fig. 3. BER as a function of the interleaver size. (a) 64-
                                                    QAM systems, (b) PAS systems. Each position of BER
                                                    evaluation is as shown in the legend in each figure.

                                 4 Conclusion
                                 We evaluated BER characteristics of PAS system with a novel DM−1 operation using
                                 soft information of log-likelihood ratio (LLR) value as well as an interleaving of
                                 multiple BCH codewords used as an outer FEC. The obtained results showed that
                                 increasing the size of the interleaver dramatically eliminated the BER floor, while
                                 the proposed DM−1 operation successfully suppressed the BER degradation caused
                                 by burst errors due to DM−1 operation as well as LDPC decoding.

©   IEICE 2021                   Acknowledgments
DOI: 10.1587/comex.2021XBL0117
Received June 1, 2021            This work was supported by JSPS KAKENHI Grant Number 19K004386.
Accepted June 30, 2021
Publicized July 8, 2021
Copyedited October 1, 2021

                                                                                                                            779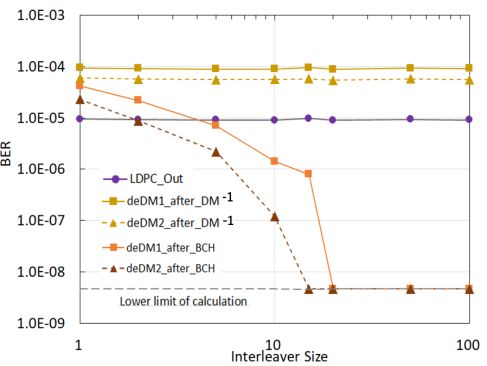
IEICE Communications Express, Vol.10, No.10, 780–785

                                 Generating a super-resolution
                                 radar angular spectrum using
                                 physiological component
                                 analysis
                                  Takuya Sakamoto1, a)
                                  1   Graduate School of Engineering, Kyoto University,
                                  Kyotodaigaku-Katsura, Nishikyo-ku, Kyoto 615–8510, Japan
                                  a) sakamoto.takuya.8n@kyoto-u.ac.jp

                                  Abstract: In this study, we propose a method for generating an angular
                                  spectrum using array radar and physiological component analysis. We develop
                                  physiological component analysis to separate radar echoes from multiple body
                                  positions, where echoes are phase-modulated by propagating pulse waves.
                                  Assuming that the pulse wave displacements at multiple body positions are
                                  constant multiples of a time-shifted waveform, the method estimates echoes
                                  using a simplified mathematical model. We exploit the mainlobe and nulls
                                  of the directional patterns of the physiological component analysis to form
                                  an angular spectrum. We applied the proposed method to simulated data to
                                  demonstrate that it can generate a super-resolution angular spectrum.
                                  Keywords: radar angular spectrum, pulse wave, physiological component
                                  analysis
                                  Classification: Sensing

                                      References

                                      [1] S.S. Najjar, A. Scuteri, V. Shetty, J.G. Wright, D.C. Muller, J.L. Fleg, H.P.
                                          Spurgeon, L. Ferrucci, and E.G. Lakatta, “Pulse wave velocity is an inde-
                                          pendent predictor of the longitudinal increase in systolic blood pressure and of
                                          incident hypertension in the Baltimore longitudinal study of aging,” J. Am. Coll.
                                          Cardiol., vol. 51, no. 14, pp. 1377–1383, Nov. 2009. DOI: 10.1016/j.jacc.2007.
                                          10.065
                                      [2] C. Holz and E.J. Wang, “Glabella: Continuously sensing blood pressure behav-
                                          ior using an unobtrusive wearable device,” Proc. ACM on Interactive, Mobile,
                                          Wearable Ubiquitous Technol., vol. 1, no. 3, Sept. 2017. DOI: 10.1145/3132024
                                      [3] D.B. McCombie, A.T. Reisner, and H.H. Asada, “Adaptive blood pressure esti-
                                          mation from wearable PPG sensors using peripheral artery pulse wave velocity
                                          measurements and multi-channel blind identification of local arterial dynam-
                                          ics,” Proc. 2006 Int. Conf. IEEE EMBS, New York, NY, USA, pp. 3521–3524,
                                          Aug. 2006. DOI: 10.1109/IEMBS.2006.260590
                                      [4] S.L.-O. Martin, A.M. Carek, C.-S. Kim, H. Ashouri, O.T. Inan, J.-O. Hahn, and
                                          R. Mukkamala, “Weighing scale-based pulse transit time is a superior marker
                                          of blood pressure than conventional pulse arrival time,” Sci. Rep., vol. 6, 39273,
                                          Dec. 2016. DOI: 10.1038/srep39273
©   IEICE 2021                        [5] T.-H. Tao, S.-J. Hu, J.-H. Peng, and S.-C. Kuo, “An ultrawideband radar based
DOI: 10.1587/comex.2021XBL0137
Received June 29, 2021                    pulse sensor for arterial stiffness measurement,” Proc. 29th Ann. Int. Conf.
Accepted July 7, 2021
Publicized July 14, 2021
Copyedited October 1, 2021

                                                                                                                               780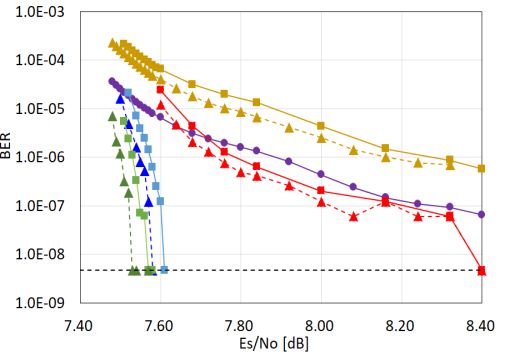
IEICE Communications Express, Vol.10, No.10, 780–785

                                           IEEE EMBS, Lyon, France, pp. 1679–1682, Aug. 2007. DOI: 10.1109/IEMBS.
                                           2007.4352631
                                     [6]   M.-C. Tang, C.-M. Liao, F.-K. Wang, and T.-S. Horng, “Noncontact pulse transit
                                           time measurement using a single-frequency continuous-wave radar,” Proc. 2018
                                           IEEE/MTT-S IMS, Philadelphia, PA, USA, pp. 1409–1412, June 2018. DOI:
                                           10.1109/MWSYM.2018.8439326
                                     [7]   T. Lauteslager, M. Tømmer, T.S. Lande, and T.G. Constandinou, “Coherent
                                           UWB radar-on-chip for in-body measurement of cardiovascular dynamics,”
                                           IEEE Trans. Biomed. Circuits Syst., vol. 13, no. 5, pp. 814–824, Oct. 2019.
                                           DOI: 10.1109/TBCAS.2019.2922775
                                     [8]   R. Vasireddy, J. Goette, M. Jacomet, and A. Vogt, “Estimation of arterial pulse
                                           wave velocity from Doppler radar measurements: a feasibility study,” 41st
                                           Ann. Int. Conf. IEEE EMBS, Berlin, Germany, pp. 5460–5464, July 2019.
                                           DOI: 10.1109/EMBC.2019.8857644
                                     [9]   L. Lu, C. Li, and D.Y.C. Lie, “Experimental demonstration of noncontact pulse
                                           wave velocity monitoring using multiple Doppler radar sensors,” Proc. 2010
                                           Ann. Int. Conf. IEEE Eng. Med. Biology, Buenos Aires, Argentina, pp. 5010–
                                           5013, Aug. 2010. DOI: 10.1109/IEMBS.2010.5627213
                                    [10]   F. Michler, K. Shi, S. Schellenberger, B. Scheiner, F. Lurz, R. Weigel, and A.
                                           Koelpin, “Pulse wave velocity detection using a 24-GHz six-port based Doppler
                                           radar,” 2019 IEEE Radio and Wireless Symp., Orlando, FL, USA, Jan. 2019.
                                           DOI: 10.1109/RWS.2019.8714521
                                    [11]   Y. Oyamada, T. Koshisaka, and T. Sakamoto, “Experimental demonstration of
                                           accurate noncontact measurement of arterial pulse wave displacements using
                                           79-GHz array radar,” IEEE Sensors J., vol. 21, no. 7, pp. 9128–9137, April
                                           2021. DOI: 10.1109/JSEN.2021.3052602
                                    [12]   T. Sakamoto, “Signal separation using a mathematical model of physiologi-
                                           cal signals for the measurement of heart pulse wave propagation with array
                                           radar,” IEEE Access, vol. 8, pp. 175921–175931, Sept. 2020. DOI: 10.1109/
                                           ACCESS.2020.3026539

                                 1 Introduction
                                 Pulse wave velocity (PWV) is an indicator of a variety of cardiovascular diseases [1]
                                 that is calculated by dividing the distance between two body parts by the pulse transit
                                 time (PTT), where the PTT is the time difference between the pulse arrival times
                                 measured at different body positions. In clinical practice, the body volume change
                                 caused by the pulse wave is measured to estimate the PWV. A common technique
                                 to measure the PTT is to use multiple photoplethysmogram (PPG) sensors attached
                                 to multiple parts of the subject’s body [2, 3, 4].
                                     Radar-based noncontact sensing is preferred to contact-type sensors (e.g., PPG)
                                 because it can provide unobtrusive monitoring of PWV data over long periods
                                 without causing discomfort to users. There are existing studies on radar-based pulse
                                 wave measurement [5, 6, 7, 8, 9, 10]. In [5], a radar system was placed on the
                                 patient’s upper arm and left ankle. In [6], the displacements of the subject’s arm
                                 and chest were measured simultaneously using a radar system. In [7], six parts of
                                 the subject’s body were measured sequentially using a radar system. In all these
©   IEICE 2021                   studies [5, 6, 7], radar antennas were placed in close contact with the body.
DOI: 10.1587/comex.2021XBL0137
Received June 29, 2021               In [8], two radar systems were placed approximately 150 mm from the subject’s
Accepted July 7, 2021
Publicized July 14, 2021
Copyedited October 1, 2021

                                                                                                                               781
IEICE Communications Express, Vol.10, No.10, 780–785

                                 chest and groin. In [9], two radar systems were placed close to the subject’s chest
                                 and calf. In [10], a phased array radar system was used to measure the pulse wave
                                 at two locations in the subject’s abdomen. In [11], an array radar was placed 1.2 m
                                 away from the subject, and the displacements at the back and calf were measured
                                 simultaneously. These techniques that use an array radar system require accurate
                                 signal separation so that tiny displacements at multiple body parts are estimated
                                 accurately. To improve the signal separation accuracy, [12] introduced an algorithm
                                 based on optimization with a mathematical model of physiological signals. This
                                 technique is called physiological component analysis (PHCA) and has achieved high
                                 accuracy in separating signals when the echoes are modulated by constant multiples
                                 of time-shifted displacement waveforms.
                                      In this study, we demonstrate the applicability of PHCA to the generation of
                                 radar angular spectra that enable the estimation of the direction of arrival (DOA)
                                 of echoes. We first review the PHCA procedures concisely, and then present the
                                 proposed method to form the angular spectrum of a directional pattern. We compare
                                 the angular spectra of the PHCA and simple beamformer to demonstrate the super-
                                 resolution property of the PHCA.

                                 2 System model
                                 To measure physiological signals, we assume the use of a radar system with an
                                 M-element uniform linear antenna array with a spacing of λ/2, where λ is the
                                 wavelength. We model the transmitted signal as a narrow-band signal. We assume
                                 that the number of targets (body positions) is N, and that N ≤ M is satisfied. The
                                 line-of-sight displacement of the j-th target is d j (t) as a function of time t. The
                                 displacement vector is denoted by d(t) = [d1 (t), d2 (t), · · · , d N ]T . The echoes are
                                 phase-modulated by the displacement as s j (t) = ej2kd j (t) , where k = 2π/λ is the
                                 wave number. The echo vector is denoted by s(t) = [s1 (t), s2 (t), · · · , s N (t)]T . Let
                                 the propagation channel matrix be A. The signal xi (t) is received at the i-th element,
                                 which forms a signal vector x(t) = [x1 (t), x2 (t), · · · , x M (t)]T , where x(t) is expressed
                                 as x(t) = As(t) + n(t), where n(t) is additive noise.

                                 3   Physiological component analysis

                                 We proposed PHCA [12] to determine an N × M matrix W = [w 1 w 2 · · · w N ]T and
                                 estimate echoes as ŝ(t) = W x(t), which leads to the estimate of the displacement
                                 d̂(t) = (1/2k)∠ ŝ(t), where ∠ denotes the argument of a complex number. Note
                                 that ambiguity is allowed in the permutation and constant multiplication when we
                                 estimate d̂(t). For simplicity, we assume that N is known in advance.
                                      In PHCA, we estimate W by solving

                                                                          max F(W),                                            (1)
                                                                        W ∈C n×m

                                 where
                                                            F(W) = F1 (W)F2 (W)F3 (W)F4 (W).                                   (2)
©   IEICE 2021                   The objective function F(W) comprises four functions that are derived from approxi-
DOI: 10.1587/comex.2021XBL0137
Received June 29, 2021
Accepted July 7, 2021
                                 mations based on a mathematical model of physiological signals [12]. The functions
Publicized July 14, 2021
Copyedited October 1, 2021

                                                                                                                               782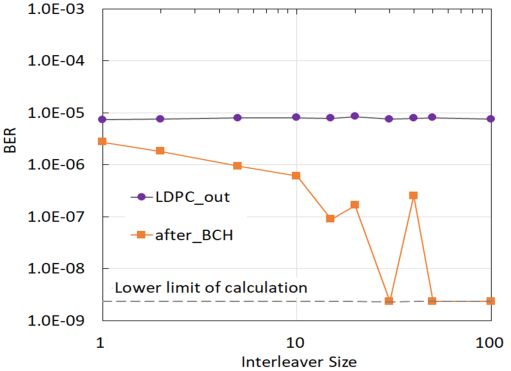
IEICE Communications Express, Vol.10, No.10, 780–785

                                 are defined as

                                                                   F1 (W) = min λ(i)2,                                                 (3)
                                                                               1≤i ≤ N
                                                                                 ∫∞
                                                                       ∏               g (τ) dτ
                                                                                               4
                                                                                   −∞ i, j
                                                           F2 (W) =             (∫ ∞                )2 ,                               (4)
                                                                                              2
                                                                    1≤i< j ≤ N         g
                                                                                  −∞ i, j
                                                                                          (τ)    dτ
                                                                             ∏          maxτ>0 gi, j (τ)
                                                                                                           2
                                                            F3 (W) =                                       2
                                                                                                               ,                       (5)
                                                                          1≤i< j ≤ N    maxτ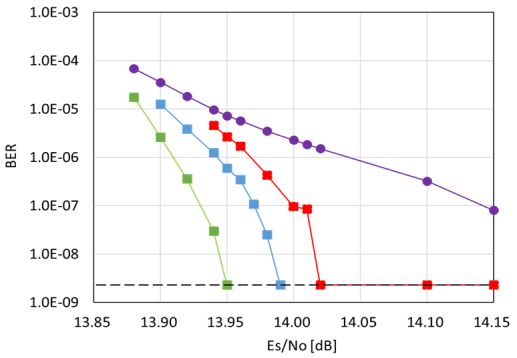
IEICE Communications Express, Vol.10, No.10, 780–785

                                                     Fig. 1. System model assumed in this study.

                                 is within a typical range for actual measurements, and the equivalent S/N for the
                                 physiological component was 21.9 dB. Figure 1 shows the assumed measurement
                                 scenario for a participant lying on a bed with an array radar placed above. We set the
                                 height of the antenna array baseline from the target human body to 1.4 m. We solved
                                 the optimization problem in Eq. (1) using a genetic algorithm with a population size
                                 of 100 and the number of generations set to 300.
                                      Figure 2 shows the directional patterns of PHCA (upper panels) and the angular
                                 spectra (lower panels) obtained using the proposed method. We assumed two settings
                                 with (x1, x2 ) = (−0.2 m, 0.2 m) (scenario 1) and (−0.1 m, 0.3 m) (scenario 2). The
                                 actual DOAs are indicated by dashed blue lines in the figures. Note that we show
                                 P1 , P2 , and P as a function of x instead of θ for the readers’ convenience. We note

                                            Fig. 2. Directional patterns and angular spectra generated us-
©   IEICE 2021                                      ing the proposed method.
DOI: 10.1587/comex.2021XBL0137
Received June 29, 2021
Accepted July 7, 2021
Publicized July 14, 2021
Copyedited October 1, 2021

                                                                                                                           784
IEICE Communications Express, Vol.10, No.10, 780–785
that the lower panels also show the angular spectrum of the beamformer method for
comparison. We observed from the figure that PHCA formed directional patterns
to extract echoes while suppressing the other echo. The proposed method exploited
the characteristic and generated high-resolution angular spectra. The lower panels
in Fig. 2 show that the proposed method generated a super-resolution spectrum.
The average error in estimating DOAs in scenario 1 and 2 were 2.5 × 10⁻² m and
2.3 × 10⁻² m. The errors in estimating the distance between the two body positions
were 4.6 × 10⁻² m and 4.7 × 10⁻² m in scenarios 1 and 2, respectively, which resulted
in a relative error of 12% in both scenarios.
Although we assumed that the number of targets was known, it is important
to investigate the performance of the proposed method when the number of targets
is unknown. It is also important to study the accuracy and resolution limit of
the proposed method under various conditions, including various DOAs, S/Ns,
displacement waveforms, and numbers of elements. Furthermore, it is important to
compare the proposed method with existing super-resolution methods of adaptive
array processing. We will consider these additional issues in our future work.
6 Conclusion
In this study, we proposed a method for generating a radar angular spectrum using
PHCA directional patterns. PHCA is an approach to automatically separate signals
based on a mathematical model of pulse wave propagation. The formation of
the angular spectrum allows us to locate the body positions that exhibit pulse wave
displacement, which results in the estimation of the distance between body positions.
The simulation results showed an average error of 12% for estimating the distance
between two body positions. Because the calculation of PWV requires the distance
of the propagation path, we expect DOA estimation using the proposed method to
be applied in healthcare and medical applications.
Acknowledgments
This work was supported in part by JSPS 19H02155, JST JPMJPR1873, and JST
COI JPMJCE1307.
© IEICE 2021
DOI: 10.1587/comex.2021XBL0137
Received June 29, 2021
Accepted July 7, 2021
Publicized July 14, 2021
Copyedited October 1, 2021
785IEICE Communications Express, Vol.10, No.10, 786–791
Investigation of sea wave
countermeasures in
undersea position
estimating system using
electromagnetic waves
Hiroki Kobayashi1, a) , Ryosuke Kato1 ,
and Masaharu Takahashi1, b)
1 Graduate School of Engineering, Chiba University
1–33 Yayoi-Cho, Inage-Ku, Chiba, 263–8522, Japan
a) afya7030@chiba-u.jp
b) omei@faculty.chiba-u.jp
Abstract: When divers rescue people in accidents at sea, they are exposed
to dangers such as injuries by obstacles, and so on. If the divers can confirm
their position, their rescue activities will become safer. In the previous study,
assuming that we specify the positions of the divers performing rescue oper-
ations to support their work, we developed a 3D undersea position estimation
algorithm communicating between the undersea and the sea surface. How-
ever, we did not yet consider the effects and countermeasures of sea waves. In
this paper, we indicate the effects of sea waves on the algorithm and investigate
wave countermeasures.
Keywords: undersea position estimating, RSS, received signal strength,
lateral wave
Classification: Antennas and Propagation
References
[1] E. Jimenez, G. Quintana, P. Mena, P. Dorta, I. Perez-Alvarez, S. Zazo, M.
Perez, and E. Quevedo, “Investigation on radio wave propagation in shallow
seawater: simulations and measurements,” 2016 IEEE Third Underwater Com-
munications and Networking Conference (UComms), pp. 1–5, Aug. 2016. DOI:
10.1109/ucomms.2016.7583453
[2] D. Pompili and I.F. Akyildiz, “Overview of networking protocols for underwater
wireless communications,” IEEE Commun. Mag., vol.47, no.1, pp. 97–102, Jan.
2009. DOI: 10.1109/mcom.2009.4752684
[3] Marine Industry Research Group, “The research report of the development of
ocean businesses and the effects of new business creation by the advanced un-
derwater acoustic communication” [translated from Japanese], Japan Federation
of Machinery Manufacturers, Ocean Industry Research Group, Tokyo, 2005.
[4] R. Otnes, et al., “A roadmap to ubiquitous underwater acoustic communications
and networking,” Proc. 3rd Int’l. Conf. Underwater Acoustic Measurements:
© IEICE 2021 Tech. & Results, June 2009.
DOI: 10.1587/comex.2021XBL0135
Received June 28, 2021
Accepted July 7, 2021
Publicized July 15, 2021
Copyedited October 1, 2021
786IEICE Communications Express, Vol.10, No.10, 786–791
[5] M. Chitre, S. Shahabudeen, and M. Stojanovic, “Underwater acoustic commu-
nications and networking: recent advances and future challenges,” Marine Tech.
Soc. J., vol. 42, no. 1, pp. 103–116, 2008.
[6] R.K. Moore, “Radio communication in the Sea,” IEEE Spectr., vol. 4, no. 11,
pp. 42–51, Nov. 1967. DOI: 10.1109/mspec.1967.5217169
[7] National Police Agency Community Safety Bureau Community Safety Plan-
ning Division, “The overview of water accidents in 2019” [translate
from Japanese], https://www.npa.go.jp/publications/statistics/safetylife/chiiki/
R01suinan_gaikyou.pdf, June 2020.
[8] R. Kato, M. Takahashi, N. Ishii, Q. Chen, and H. Yoshida, “Investigation of
a 3D undersea positioning system using electromagnetic waves,” IEEE Trans.
Antennas Propag., Aug. 2020. DOI: 10.1109/tap.2020.3048584
[9] A. Hales, G. Quarini, G. Hilton, L. Jones, E. Lucas, D. McBryde, and X.
Yun, “The effect of salinity and temperature on electromagnetic wave attenua-
tion in brine,” Int. J. Refrigeration, vol. 51, pp. 161–168, 2015. DOI: 10.1016/
j.ijrefrig.2014.11.013
1 Introduction
In recent years, various ways of using the ocean have begun to be explored, and
many technologies have been developed to support the generation of new ocean
businesses [1, 2, 3]. To date, acoustic waves have been commonly utilized for
undersea wireless communications. This is because the attenuation of acoustic waves
is smaller than that of electromagnetic waves and light waves, and it is suitable for
remote communication at sea [4, 5]. However, it propagates at 1.5 km/s in the ocean,
which is considerably slow, approximately one-fiftieth as fast as electromagnetic
waves. Regarding light waves, the scattering attenuation with the muddiness of
seawater is large. Reference [2] mentioned that light-wave telecommunication in
seawater is unsuitable due to communication instability and capability. Regarding
electromagnetic waves, because of a large attenuation, it is considered that undersea
communication with electromagnetic waves is challenging [6]. However, we can
ignore the reflection and diffraction of electromagnetic waves because of their large
attenuation. Thus, we wish to consider using electromagnetic waves in the sea,
especially in shallow seas.
We consider supporting technologies for water rescues as a way of using elec-
tromagnetic waves in seawater. According to [7], more than 1,000 water accidents
have occurred annually. Accidents in the water are mainly caused by natural disas-
ters and sinking accidents involving ships. When divers rescue people, the view of
divers is sometimes interrupted by some obstacles floating in the sea; if divers know
their current positions during the rescue, rescue activities will become much safer.
Divers are constantly moving during the rescue, so the system must possess real-time
positioning. In addition, the environment for rescue is not constant and needs to be
adapted on a case-by-case basis. Thus, a simple algorithm and less calculation time
are required.
In the previous study, we developed an undersea positioning system that utilizes
© IEICE 2021
DOI: 10.1587/comex.2021XBL0135 10 kHz bands [8]. We assumed that receive antennas are fixed on the sea surface by
Received June 28, 2021
Accepted July 7, 2021 installed on a raft in this system. However, in the actual environment, sea waves are
Publicized July 15, 2021
Copyedited October 1, 2021
787IEICE Communications Express, Vol.10, No.10, 786–791
often generated on the sea surface. This paper will follow this system and propose
a system that is unaffected by sea waves by floating the receiving antenna above the
sea surface.
2 Assumed position estimating system
In this study, for the position estimation in the sea, we assume two ideal environments.
One is shallow and has a calm sea surface, and the other represents sea waves on
the sea surface. We employed one-axis dipole antennas for our simulations as an
introductory study. The simulation model is shown in Fig. 1. The model has a free
space with a height of 8 m and seawater with a depth of 9 m (εr = 80, σ = 4.0 S/m).
In the model with sea waves, sine waves were used to represent the sea waves. The
amplitude and wavelength of this sine wave were set to 1.2 m and 4 m, respectively,
as shown in Fig. 1(c). These parameters are the maximum size that a diver can
rescue. Receiving antennas (Rxs) were installed at the height of 3 m above the sea
surface, with sufficient margin from this wave. Nine 2 m Rxs are dipole antennas
installed horizontally above the sea surface at intervals of 20 m. We assume that
all Rxs are mounted on the drone, and the distance between each Rx is constant.
A 0.7 m transmitting antenna (Tx) is a dipole antenna installed at any point in the
sea. This state does not receive direct waves from the underwater but receives only
lateral waves. Electric constants of seawater are based on Reference [9].
In this simulation, we employed the Finite Difference Time Domain (FDTD)
method. All cells are 0.1 m × 0.1 m × 0.1 m, and the time step is 1.92 × 10⁻¹⁰ sec,
which satisfies the Courant limit. This calculation is iterated 1.75 million times. As
a boundary condition, 14 layers of PML were deployed. Moreover, we feed a 1-V
sinusoidal wave into a Tx constantly.
Fig. 1. Sea model for the undersea antenna position estimation
system
© IEICE 2021
DOI: 10.1587/comex.2021XBL0135
Received June 28, 2021
Accepted July 7, 2021
Publicized July 15, 2021
Copyedited October 1, 2021
788IEICE Communications Express, Vol.10, No.10, 786–791
3 Sea wave countermeasures and estimating algorithm
In this section, we describe the sea wave countermeasures and the flow of undersea
position estimating. In the previous study, we assumed that all Rxs are floated on
the sea surface by fixed on something like a raft. In this system, when sea waves
occur, changes in the posture of Rx and the distance between antennas will affect
the Receiving Signal Strength (RSS) values. Therefore, since this undersea position
estimation system uses RSS, sea waves have no small effect on position estimation
accuracy. Thus, we proposed a system that avoids posture changes of Rxs caused by
sea waves by installing the Rxs above the sea surface.
Figure 2(a) shows the relationship between RSS and the antenna distance with
Rxs floating in the air numerically. For example, the parameters are shown for Tx
depths of 2m, 3m, and 7m. These parameters were calculated using two dipole
antennas deployed in parallel, as shown in Fig. 1(c). Note that this RSS does not take
into account the antenna matching. RSS is a logarithm of the ratio of the received
power to the input power and is calculated as Eq. (1).
Received Power [W]
RSS [dB] = 10 log10 . (1)
Input Power [W]
RSS is well attenuated relative to the distance between the antennas. Furthermore, at
a depth of 3 m and under two sea surface conditions, calm and wavy, the difference
in RSS is at most 0.3 dB. Therefore, we thought that using a receiving antenna
floating in the air would be a sufficient countermeasure for sea waves.
Subsequently, we will describe the angle correction employed in this position
estimation. The dipole antenna does not have a perfectly isotropic directivity, so the
value of RSS changes depending on the angle of incidence of the electromagnetic
wave to Rx. Due to the boundary conditions at the sea surface, electromagnetic
waves radiated from Tx will propagate radially through the air from the sea surface
point directly above. Therefore, the RSS is corrected using the two angle variables
θ and φ formed by Rx and the point on the surface directly above Tx, as shown in
Fig. 1(a). Figure 2(b) shows the quadratic surface for angle correction when a depth
at Rx is 3 m. This surface is created in advance before the position estimation. The
amount of RSS correction, ∆RSS, is calculated based on the approximate surface.
At the end of this section, we describe the flow of underwater position estimation.
Figure 2(c) shows the simplified estimation flow. First, we select three Rx with
large RSS and calculate the distance between antennas from RSS. Then, we draw
three spheres with the radius of the distance between the antennas around Rx and
calculate cross point as tentatively estimated positions. And then determine ∆RSS
from the two angles θ and φ between Rxs and this tentative position using the angle
correction surface. The final estimated position is recalculated using the corrected
RSScorrected based on Eq. (2).
RSScorrected = RSS + ∆RSS. (2)
As a note in position estimating, the water depth at Tx is assumed to be known.
© IEICE 2021
DOI: 10.1587/comex.2021XBL0135
Received June 28, 2021
Accepted July 7, 2021
Publicized July 15, 2021
Copyedited October 1, 2021
789IEICE Communications Express, Vol.10, No.10, 786–791
Fig. 2. Investigation of sea wave countermeasures and esti-
mating algorithm
4 Position estimating result
In this study, we simulated the position estimation of a Tx that exists at a depth of
2 - 7 m in the sea with sea waves. In this section, we present the results of the
positioning simulation. We evaluated the estimation accuracy based on the distance
between the factual and estimated positions. We establish a maximum of 2.0 m as
the target error, considering an adult male expanding his/her arms and legs. We
indicate the results at depths of 2 - 7 m with sea waves as the error frequency rates
in Fig. 3(a-b). In this simulation, we used the model shown in Fig. 1(a-b) with the
addition of sea waves. And Tx was placed at 225 points on 15 × 15 grid points at 3
m intervals. As shown in Fig. 3(a-b), although there were several points where we
did not achieve the target error at depth 2 m, we achieved the target error at integer
depths from 3 m to 7 m. Overall, most of the errors are widely distributed in the
range of 0.2 m to 1.4 m. Therefore, even under the environment of sea waves, we
© IEICE 2021 can estimate the position with some accuracy. Furthermore, we show the detailed
DOI: 10.1587/comex.2021XBL0135
Received June 28, 2021
Accepted July 7, 2021 results in calm or with sea waves when Tx is at a depth of 3 m in Fig. 2(c). Although
Publicized July 15, 2021
Copyedited October 1, 2021
790IEICE Communications Express, Vol.10, No.10, 786–791
the overall accuracy decreases in the presence of sea waves, we achieved the target
error. Therefore, the method is sufficiently effective as a countermeasure against
sea waves. For more accurate position estimation, we can consider multiple angle
corrections or introduce a new angle correction algorithm.
Fig. 3. The result of undersea position estimating
5 Conclusion
We investigated sea wave countermeasures in an undersea position estimating system
using electromagnetic waves. This study proposed the undersea positioning system,
which uses Rxs floating above the sea surface. Then, we showed that it is possible to
obtain RSS attenuation corresponding to the distance between antennas, even for Rx
above the sea surface. In addition, we introduced a correction method of RSS for the
directivity of antennas, taking into account the propagation path of electromagnetic
waves. As a simulation result, even in the situation where sea waves are existing,
we almost achieved a target error within 2.0 m at 225 points at depths of 2 - 7 m in
our proposed system. Therefore, the proposed countermeasures against sea waves
are sufficiently effective.
As a subject in the future, we need to consider other factors that may occur in
real environments, such as the appearance of obstacles. Also, in order to improve
the accuracy of position estimation, we need to develop antennas with more uni-
© IEICE 2021
DOI: 10.1587/comex.2021XBL0135 form directivity and introduce multiple angle corrections or a new angle correction
Received June 28, 2021
Accepted July 7, 2021 algorithm.
Publicized July 15, 2021
Copyedited October 1, 2021
791IEICE Communications Express, Vol.10, No.10, 792–797
Radio resource allocation
based on adaptive and
maximum reuse distance for
LTE-V2X sidelink mode 3
Daigo Yasuda1, a) , Patrick Finnerty2 , Tomio Kamada2 ,
and Chikara Ohta1
1 Graduate School of Science, Technology and Innovation, Kobe University,
1–1 Rokkodai-cho, Nada-ku, Kobe, Hyogo 657–8501, Japan
2 Graduate School of System Informatics, Kobe University,
1–1 Rokkodai-cho, Nada-ku, Kobe, Hyogo 657–8501, Japan
a) yasudai5@fine.cs.kobe-u.ac.jp
Abstract: LTE-V2X is one of the promising wireless technologies for
Vehicle to Everything (V2X), which is expected to enhance the safety of
road traffic. In this paper, we propose a radio resource allocation scheme for
LTE-V2X Sidelink Mode 3. The reliability of packet transmission is seriously
affected by changes in vehicle density. To cope with this issue, our new scheme
reuses radio resources efficiently by calculating the range of protection from
mutual interference based on the vehicle density. Compared with existing
schemes, the proposed scheme successfully maintains a lower error rate of
packet transmission regardless of the vehicle density.
Keywords: LTE-V2X, sidelink, radio resource allocation
Classification: Wireless Communication Technologies
References
[1] G. Cecchini, A. Bazzi, B.M. Masini, and A. Zanella, “Localization-based re-
source selection schemes for network-controlled LTE-V2V,” Proc. 14th Inter-
national Symposium on Wireless Communication Systems (ISWCS), Bologna,
Italy, pp. 396–401, Aug. 2017. DOI: 10.1109/ISWCS.2017.8108147
[2] G. Cecchini, A. Bazzi, M. Menarini, B.M. Masini, and A. Zanella, “Maximum
reuse distance scheduling for cellular-V2X sidelink mode 3,” 2018 IEEE Globe-
com Workshops (GC Wkshps), Abu Dhabi, United Arab Emirates, pp. 1–6, Dec.
2018. DOI: 10.1109/GLOCOMW.2018.8644360
[3] A. Bazzi, B.M. Masini, and A. Zanella, “How many vehicles in the LTE-V2V
awareness range with half or full duplex radios?,” Proc. 15th International Conf.
on ITS Telecommunications (ITST), Warsaw, Poland, pp. 1–6, May 2017. DOI:
10.1109/ITST.2017.7972195
[4] A. Bazzi, “LTEV2Vsim V2X network simulator,” https://github.com/
alessandrobazzi/LTEV2Vsim, accessed June 16, 2021.
© IEICE 2021
DOI: 10.1587/comex.2021XBL0127
Received June 16, 2021
Accepted July 8, 2021
Publicized July 16, 2021
Copyedited October 1, 2021
792IEICE Communications Express, Vol.10, No.10, 792–797
1 Introduction
In future mobility, all vehicles are expected to be connected and communicate in real-
time to enable new services and applications. One of these services is cooperative
recognition services. These services are aimed at improving traffic conditions and
enabling cooperative autonomous driving, by periodically exchanging information
on vehicle status, speed, and direction of travel. Cellular-V2X (C-V2X), which is
based on mobile communication technologies such as LTE and 5G, is considered to
be a promising communication system to achieve this.
For LTE-V2X, 3GPP has specified Sidelink Mode 3 and Mode 4. In Mode 3, the
base station is responsible for scheduling the radio resources for the vehicle, while in
Mode 4, the vehicles sense and select the resources autonomously. 3GPP provides
the procedure for Mode 4, while the scheduling for Mode 3 is left to the operator.
This paper focuses on the scheduling, i.e., radio resource allocations, for Mode 3.
So far, some Mode 3 radio resource allocation schemes for cooperative recog-
nition services have been proposed. For instance, Fixed Reuse Distance (FRD)
scheme [1] aims to reduce interference by blocking the reuse of radio resources
currently used by vehicles within a certain distance, and Maximum Reuse Distance
(MRD) scheme [2] aims to reuse radio resources used by the farthest vehicle. FRD,
however, has the problem of over-blocking resources when the vehicle density is
low. On the other hand, MRD cannot leave enough distance between vehicles that
use the same resources when the vehicle density is high.
This paper proposes Adaptive and Maximum Reuse Distance (AMRD) scheme
to solve the above two schemes. This scheme flexibly calculates the reuse distance
of radio resources to protect them from mutual interference according to the vehi-
cle density and further maximizes the space between transmitters using the same
resources. Our simulation results show the effectiveness of AMRD by comparing it
with other schemes.
2 Related works
In the cooperative recognition service, each vehicle periodically sends a beacon
message with a certain generation period and size. The message is intended to
be received by all neighbors within a given distance from each vehicle. In this
paper, we call this distance the awareness range, raw . Sidelink Mode 3 assumes that
the area is under the coverage of the network. The resource manager in the base
station allocates resources to all vehicles at each allocation interval. Vehicles use the
same RBs until they are reallocated. A schematic representation of radio resource
allocation is shown in Fig. 1.
2.1 Fixed reuse distance scheme
FRD incorporates the concept of reuse distance, rreuse [3], which is the minimum
required distance that different transmitters can use the same resource without af-
fecting the receivers in raw . According to [3], the reuse distance is calculated as
follows:
IEICE 2021 raw
©
rreuse = raw + [ , (1)
β ]
DOI: 10.1587/comex.2021XBL0127 1
PnRB L0 ·raw β
γmin − PtxRB · Gr
Received June 16, 2021 1
Accepted July 8, 2021
Publicized July 16, 2021
Copyedited October 1, 2021
793IEICE Communications Express, Vol.10, No.10, 792–797
Fig. 1. Radio resource allocation for Sidelink Mode 3
where γmin is the minimum SINR necessary to receive the beacons correctly, PtxRB
is the transmission power per resource block (RB), PnRB is the noise power over an
RB, L0 is the path loss at 1 m, β is the loss exponent, and Gr is the antenna gain at
the receiver. This equation relies on the assumption that the nearest interferer affects
dominantly. This equation guarantees that a vehicle at raw away from the vehicle to
be allocated can successfully receive beacons even if another vehicle at rreuse away
utilizes the same resource.
This scheme allocates radio resources to each vehicle as follows: A target vehicle
is allocated radio resources not used, if any, within its rreuse . For example, in Fig. 1,
radio resources that the black vehicles do not use are available to the red vehicle.
The resource manager randomly selects radio resources from the available ones if
any. Otherwise, the transmission is blocked.
In each allocation interval, resources are reallocated first to the vehicles whose
transmissions were blocked, and then to all vehicles that were previously allocated
in the allocation interval.
The problem with FRD is that rreuse is a fixed value. In the field of vehicle-
to-vehicle (V2V) communication, the situation of the devices is volatile, and the
area where interference may occur changes accordingly. For example, the range of
protection from interference is very different when the maximum communication
distance is raw and when a few meters is sufficient. Using an overlarge rreuse reduces
the number of candidate resources for allocations. As a result, transmission is
over-blocked even when the possibility of interference is low.
2.2 Maximum reuse distance scheme
MRD does not use the reuse distance so that no allocations are blocked. Alternatively,
the scheme selects and allocates the radio resources that are unused or used by the
furthest vehicle.
The procedure of the allocation is as follows: Radio resources to be allocated
are randomly chosen from unused ones if any. Otherwise, radio resources used by
the furthest vehicle are allocated.
© IEICE 2021 The problem with MRD is that it does not take into account the usage of radio
DOI: 10.1587/comex.2021XBL0127
Received June 16, 2021 resources by neighbor vehicles. For example, in Fig. 1, even if the resource used by
Accepted July 8, 2021
Publicized July 16, 2021
Copyedited October 1, 2021
794IEICE Communications Express, Vol.10, No.10, 792–797
the white car furthest from the red car is allocated, if a black vehicle is also using
the same resource, then the red vehicle will be more susceptible to interference.
3 Adaptive and maximum reuse distance scheme
3.1 Basic idea
AMRD was devised to overcome the problems of FRD and MRD. AMRD is
based on MRD and incorporates an adaptive reuse distance, rreuse ∗ , inspired by the
concept of the reuse distance in FRD. This is not fixed like the reuse distance but is
calculated dynamically by checking the positional relationship between the vehicle
to be assigned and the surrounding vehicles. By replacing raw with the maximum
∗
distance, dmax , of the furthest vehicle within raw in Eq. (1), rreuse is calculated as
follows:
∗ dmax
rreuse = dmax + [ ] β1 , (2)
β
PnRB L0 ·dmax
1
γmin − PtxRB · Gr
where dmax ≤ raw and dmax is as shown in Fig. 1.
3.2 Operation of AMRD
This allocates radio resources as follows: First, the resource manager computes rreuse ∗
of a target vehicle. Then, the resources used by the vehicles in rreuse ∗ , i.e. the black
vehicles in Fig. 1, are identified and marked. The resources in this list are not reused
to prevent them from interfering with each other. The radio resource to be assigned
is randomly selected from the unused ones, if any. Otherwise, the resource manager
allocates the radio resource that is not on the list and is in use by the furthest vehicle.
If no resource is available, the transmission is blocked. In each allocation interval,
resources are reallocated first to the vehicles whose transmissions were blocked, and
then to all vehicles that were previously allocated in the allocation interval.
4 Performance evaluation
4.1 Simulation settings
In this section, we verify the effectiveness of AMRD by evaluating it against two
existing schemes in the aspect of the reliability of packet transmission. The simulator
used is LTE-V2Vsim [4] written in MATLAB. We assume a scenario that simulates
a highway. In the scenario, we examine the impact of changes in vehicle density on
the packet reception rate. In addition to FRD, MRD, and AMRD, we also evaluated
two other schemes: one is that combines FRD and MRD (called FMRD), and the
∗
other is that replaces rreuse in FRD with rreuse (called ARD).
The evaluation metric is the Packet Error Rate (PER), which is the ratio of the total
number of packets that failed to transmit to the total number of transmission attempts.
The packets that failed to transmitted include packets that were blocked transmission.
The success or failure of transmission and reception is judged by comparing the
measured SINR with an initial set threshold value γmin . The simulation settings are
summarized in Table I.
© IEICE 2021
DOI: 10.1587/comex.2021XBL0127
Received June 16, 2021
Accepted July 8, 2021
Publicized July 16, 2021
Copyedited October 1, 2021
795IEICE Communications Express, Vol.10, No.10, 792–797
Table I. Simulation and scenario settings
Parameter Value
Simulation time 500 s
Allocation interval 0.1 s
Beacon size 300 bytes
Central frequency 5.9 GHz
Channel bandwidth 10 MHz
Equivalent Radiated Power 23 dBm
Tx/Rx antenna gain 3 dB
Path loss model WINNER + (B1)
Antenna height 1.5 m
Shadowing decorrelation distance 25 m
Shadowing standard deviation 3 dB (LOS)
Duplexing HD
Noise power over a RB −110 dBm
Modulation and coding scheme (MCS) 3
Awareness range (raw ) 150 m
Road length 2 km
Number of lanes 4
Lane width 3m
Vehicle speed 80 km/h
Average number of vehicles 200
Vehicle density (High-density) 143 vehicles/km
Vehicle density (Low-density) 48 vehicles/km
4.2 Results
Figure 2 shows the PER for each scenario. These graphs are one-logarithmic.
The vertical axis in the logarithmic scale denotes the PER, and the horizontal axis
represents the distance in meter between the transmitting and receiving vehicles.
From Fig. 2(a), we consider that setting the reuse distance like FRD and selecting
resources like MRD is one solution to maintain reliability when the vehicle density
is high. Because there is no noticeable difference between FMRD and AMRD, we
can recognize that there is little benefit from varying the reuse distance in high-
density scenario. On the other hand, Fig. 2(b) shows that AMRD has somewhat
© IEICE 2021
DOI: 10.1587/comex.2021XBL0127
Received June 16, 2021 Fig. 2. Simulation results
Accepted July 8, 2021
Publicized July 16, 2021
Copyedited October 1, 2021
796IEICE Communications Express, Vol.10, No.10, 792–797
a smaller PER at the communication distance up to 100 m than FMRD, thanks
to varying the reuse distance, in the low-density scenario. Figure 2(a) displays
that ARD outperforms FRD slightly in short-distance communication in the high
density scenario. Still as the communication distance is longer, the PER of ARD is
approaching that of FRD. The performance at low density is also the same as FRD
as shown in Fig. 2(b).
From the above results, we conclude that AMRD can guarantee transmission
reliability regardless of the vehicle density. In short-range communication, however,
the PER of AMRD is sometimes higher than in other schemes. That is because
the allocation constraint of AMRD is still too strict than other schemes, and some
transmissions are blocked even when the number of transmission errors is small.
5 Conclusion
In this paper, we proposed a new radio resource allocation scheme that takes advan-
tage of the characteristics of existing allocation schemes in V2V. The simulation
results showed that the proposed scheme could keep the PER low regardless of
the vehicle density. It was, however, revealed that the success rate of close-range
communication might be lower than that of existing schemes due to the presence of
some transmission blocks, even if the number of transmission errors is small.
In the future, we would like to verify the effectiveness of AMRD in scenarios
based on actual road conditions.
Acknowledgments
This work was supported by JSPS KAKENHI Grant Number JP18H03232 and JST
CREST JPMJCR1914.
© IEICE 2021
DOI: 10.1587/comex.2021XBL0127
Received June 16, 2021
Accepted July 8, 2021
Publicized July 16, 2021
Copyedited October 1, 2021
797IEICE Communications Express, Vol.10, No.10, 798–802
Optically transparent dual-
polarized reflectarray with
independently controllable
beam for 5G communication
systems
Lin Wang1, a) , Hiroki Hagiwara1 , Yuko Rikuta1 ,
and Toshiyuki Kobayashi1
1 Antenna Development Group, Development Department,
Mobile Carriers Business Division, Nihon Dengyo Kosaku Co., Ltd.,
7–4 Nissai Hanamizuki Sakado-shi Saitama 350–0269, Japan
a) ou-rin@den-gyo.com
Abstract: A reflectarray with independently controllable beam is proposed
for the fifth-generation (5G) communication systems in this letter. A unit cell
of the reflectarray is composed of an asymmetrical crossed-dipole element
to realize dual-polarized operation. The cross-dipole element is printed by a
transparent conductive film on an optically transparent substrate. In order to
validate its performance, a 20 × 10-element (100 mm × 50 mm) reflectarray
operating at 28 GHz is designed and analyzed numerically. Simulation results
demonstrate that the reflectarray can independently control dual-polarized
scattering beams and produce expected shaped radiation patterns.
Keywords: optically transparent, reflectarray, 5G, mmWave
Classification: Antennas and Propagation
References
[1] J. Huang, “Analysis of a microstrip reflectarray antenna for microspacecraft
applications,” TDA Progress Rep., vol. 42-120, pp. 153–173, Feb. 1995.
[2] J. Huang and J. A. Encinar, Reflectarray Antennas, John Wiley & Sons, 2008.
DOI: 10.1002/9780470178775
[3] L. Li, Q. Chen, Q. Yuan, K. Sawaya, T. Maruyama, T. Furuno, and S. Uebayashi,
“Frequency selective reflectarray using crossed-dipole elements with square
loops for wireless communication applications,” IEEE Trans. Antennas Propag.,
vol. 59, no. 1, pp. 89–99, Jan. 2011. DOI: 10.1109/tap.2010.2090455
[4] Q. Chen, J. Li, Y. Kurihara, K. Sawaya, Q. Yuan, N. Tran, and Y. Oda, “Measure-
ment of reflectarray for improving MIMO channel capacity of outdoor NLOS
radio channel,” 2013 IEEE International Symposium on Antennas and Propaga-
tion and USNC-URSI National Radio Science Meeting, July 7-13, 2013. DOI:
10.1109/aps.2013.6711094
[5] J. Kennedy and R.C. Eberhart, “Particle swarm optimization,” Proc. IEEE Conf.
Neural Networks IV, Piscataway, NJ, 1995. DOI: 10.1109/icnn.1995.488968
[6] L. Wang, H. Hagiwara, Y. Rikuta, T. Kobayashi, H. Matsuno, T. Hayashi, S. Ito,
© IEICE 2021 and M. Nakano, “Design and analysis of dual-polarized reflectarray with low
DOI: 10.1587/comex.2021XBL0129
Received June 18, 2021
Accepted July 12, 2021
Publicized July 19, 2021
Copyedited October 1, 2021
798You can also read