Hyaluronic Acid in the Intestinal Tract: Influence of Structure, Rheology, and Mucoadhesion on the Intestinal Uptake in Rats - MDPI
←
→
Page content transcription
If your browser does not render page correctly, please read the page content below
biomolecules

Article
Hyaluronic Acid in the Intestinal Tract: Influence of
Structure, Rheology, and Mucoadhesion on the
Intestinal Uptake in Rats
Alexandro Barbosa de Souza 1,2 , Marco Vinícius Chaud 2 , Thais Francine Alves 2 ,
Juliana Ferreira de Souza 2 and Maria Helena Andrade Santana 1, *
 1   Department of Materials and Bioprocesses Engineering, School of Chemical Engineering,
     University of Campinas, P.O. Box 6066, Campinas 13083 852, SP, Brazil; souzaozzy@yahoo.com.br
 2   Laboratory of Biomaterials and Nanotechnology, University of Sorocaba, Sorocaba 18300 000, SP, Brazil;
     chaudmarco@gmail.com (M.V.C.); thaisfrancine1@hotmail.com (T.F.A.); julianafsz@yahoo.com.br (J.F.d.S.)
 *   Correspondence: mariahelena.santana@gmail.com

 Received: 2 September 2020; Accepted: 26 September 2020; Published: 8 October 2020

 Abstract: Oral hyaluronic acid (HA) is a ubiquitous biopolymer that has gained attention as a
 treatment for local or systemic diseases. Here, we prepared and characterized structures of free HA
 (f-HA) with a high (>105 Da), intermediate (≤105 Da), and low (≤104 Da) average molar mass (MM);
 nanoparticles crosslinked with adipic dihydrazide (n-HA); and mixed formulations (mixed-HA)
 containing f-HA and n-HA. MM distribution determined the structure, hydrodynamic diameter,
 and zeta potential of the f-HAs. Crosslinking changed the physicochemical properties in n-HA.
 In vitro tack adhesion assays, using mucin tablets or a viable rat intestinal mucosa, showed better
 mucoadhesion with f-HA (intermediate MM) and mixed-HA (25% n-HA), especially in the jejunum
 segment. High MM f-HA presented negligible mucoadhesion. n-HA showed the deepest diffusion
 into the porous of the membranes. In vivo results showed that, except for high MM f-HA, there is an
 inverse relationship between rheological changes in the intestinal membrane macerates resulting from
 mucoadhesion and the effective intestinal permeability that led to blood clearance of the structures.
 We conclude that the n-HA formulations are promising for targeting other tissues, while formulations
 of f-HA (intermediate MM) and mixed-HA are better for treating dysbiosis.

 Keywords: hyaluronic acid; nanoparticles; tack adhesion; intestinal permeability

1. Introduction
      Hyaluronic acid (HA) is a glycosaminoglycan ubiquitous in the human body [1]. HA performs
biological functions at various concentrations, molar masses (MM), and size distributions of its chains
structured in different spatial architectures [2–5]. Then, at the intestinal mucosa, intermediate and high
MM (≥105 Da) present antioxidant and anti-microbial properties [6,7]. While the integrity of polymeric
HA structures regulates tissue homeostasis, the decrease of its endogenous production or cleavage of
its chains is linked with various diseases related mainly to age. Nowadays, the HA from fermentation
(bio-HA) is widely used to restore the endogenous HA properties that have been lost [8,9].
      The TSG-6 (Tumour Stimulate Gene-6) is a 35-kDa HA-binding protein that is usually expressed in
response to proinflammatory stimuli is an important protector of tissue structure during inflammation.
The effect of multifunctional protein TSG-6 in various models of inflammation shows an alteration
the structure of HA via its direct crosslinking of HA chains, enhance HA-receptor interactions and
contributes to the anti-inflammatory effects. This anti-inflammatory process by an allosteric mechanism
preventing simultaneous binding of HA and inhibition of interleukin-1 (IL-1), interleukin-6 and tumour

Biomolecules 2020, 10, 1422; doi:10.3390/biom10101422                      www.mdpi.com/journal/biomolecules
Biomolecules 2020, 10, 1422                                                                        2 of 20

necrosis factor (TNFα), and competing interactions of HA for their distinct binding sites on link_TSG6,
both process are more effective with HA with high MM [10,11].
     Oral administration of exogenous HA has gained attention from researchers as a supplementary
or complementary therapy to prevent or treat diseases. Over the last four decades, it has been
postulated that a low and incomplete fraction dose of ingested HA is absorbed as a high molar
mass (MM ≥ 105 Da) [8,12,13]. However, the reported studies were generally qualitative, based on
fluorescent methods for the identification of HA in tissues. Additionally, mucoadhesion can be affected
by the properties of HA structure related to hydration, structural stability, and surface charge [14,15].
A study using animal model demonstrated that after intestinal damage that HA homeostasis in
myenteric neuron influence the intestinal transit, improve the disorder of myenteric plexus during
intestinal inflammation and hinders the development of dysmotility [16,17]. However, studies focusing
on the influences of HA structuring on its intestinal adhesion and uptake are scarce in the literature.
Therefore, the knowledge about the intestinal uptake of HA needs to be advanced in terms of kinetics
and HA structuring.
     In this study, the influence of HA structuring on its penetration into type III mucin of a porcine
stomach and rat intestinal mucosa was studied using free HA (f-HA), nanoparticles crosslinked with
adipic dihydrazide (n-HA), and mixed HA (mix-HA) formulations. The selected formulations from
an in vitro study (f-HA average molar mass 105 Da, n-HA with 475.3 ± 75.8 mean diameter as well
as a mix-HA containing 25 wt % nanoparticles dispersed in the f-HA) were investigated using the
improved single-pass intestinal permeability (SPIP) method [18–20], which considers the entire small
intestine of rats to assess the effects of HA structuring on its intestinal permeability. The results
highlighted the importance of HA structuring on mucoadhesion, facilitating the selection of promising
formulations with improved penetration properties for HA oral administration and investigation in
pre-clinical assays.

2. Materials and Methods

2.1. Polymers and Chemicals
     Hyaluronic acid sodium salt at 1% (w/v) was purchased from Mapric Pharmaceutical Products Ltd.,
(São Paulo, Brazil) (I-MM) and Euflexxa (São Paulo, Brazil) (H-MM). The HA from Mapric was used in
the synthesis of HA nanoparticles. Water-soluble adipic acid dihydrazide (ADH), N, and N-dimethyl
aminopropyl carbodiimide (EDC) were used for nanoparticle crosslinking and were purchased from
Sigma (St. Louis, MO, USA). Ethanol and all other analytical grade chemicals were acquired from
Merck (Darmstadt, Germany). Type III mucin (Sigma-Aldrich Ltd., São Paulo, Brazil) in partially
purified powder from porcine stomach was used in the mucoadhesion assays.

2.2. Pre-Treatments and Characterization of Free HAs
      The HA Euflexxa, distributed by the manufacturer into sterile syringes for medical use, was
used without any pre-treatment. HA Mapric sold for cosmetic use was precipitated with ethanol for
purification before being used.
      Precipitation was carried out with ethanol at pH 7.0 in the presence of NaCl (2 M), according to
the protocol described by Cavalcanti et al. [21]. The precipitate was separated by centrifugation at
1318× g for 20 min and suspended in NaCl (0.15 M) for stabilization.
      The precipitate was later hydrolyzed to provide the low average MM with the same purity grade.
HA hydrolysis was carried out resuspending the precipitated HA in a phosphate buffer (0.1 M) at
pH 12. The obtained solution (5 g/L) was left at 60 ◦ C for 24 h in a reciprocal shaker bath with 500 rpm
stirring speed (Lab-Line Instruments Inc., Melrose Park, IL, USA). After that, the hydrolyzed HA was
freeze-dried for storage. The free HAs were characterized in terms of concentration, purity, average
MM, and distribution.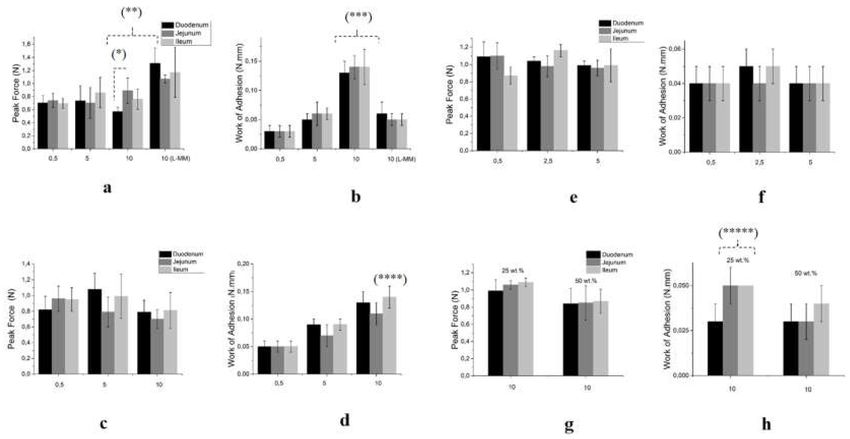
Biomolecules 2020, 10, 1422                                                                        3 of 20

2.2.1. Purity and Concentration
    The purity relative to proteins was determined from HA and protein concentrations according to
Equation (1):
                                               CHA
                                      P=                × 100                                  (1)
                                           (CHA + CSP )
where CHA and CSP are the concentrations of the HA and soluble protein, respectively.
     The HA concentration was quantified by the CTAB method [22]. Briefly, HA solutions and CTAB
were mixed at 0.5/1 (v/v). The mixture was maintained for 10 min at room temperature, after which
the optical density was measured at 400 nm wavelength. The spectrophotometer was calibrated
using a control solution prepared from NaCl (0.15 M) and CTAB at the same ratio. Analytical grade
sodium hyaluronate (HylumedTM) from Genzyme Corporation (Cambridge, MA, USA) was used as a
standard for the calibration curve.
     The protein content was quantified by bicinchoninic acid (BCA) using an assay kit from
Sigma-Aldrich, St. Louis, MO, USA). Briefly, the precipitate and BCA reagent were mixed at a
1/20 (v/v) ratio and incubated in a water bath at 37 ◦ C for 30 min. After reacting, the optical density
was measured at a wavelength of 562 nm. The protein concentration was determined from a standard
curve previously constructed with bovine serum albumin (BSA).

2.2.2. Average Molar Mass and Distribution
     The average molar mass (MM) of the f-HAs was determined by size exclusion chromatography
using a gel filtration column (Polysep-GFC-P6000, 7.8 mm × 300 mm; Phenomenex, Torrance, CA,
USA) coupled to a Shimadzu RID-6A refractive index detector (Shimadzu Corporation, Kyoto, Japan).
Briefly, 20 µL of (0.01 g/L) free HA at pH 7.4 was injected using NaNO3 (0.1 M) as a mobile phase at
1.0 mL min−1 and a temperature of 25 ◦ C. HA analytical standards (Hyalose, Oklahoma, OK, USA)
with MM ranging from 50 to 1000 kDa were correlated with retention time using Equation (2):

                               log MM = 10.95 − (0.62 × retention time).                              (2)

     The MM distribution was calculated considering Equation (2) and the area under the curves of
the chromatographic peaks relative to 106 , 105, and 104 Da. The free HAs were classified according
to the average MM as high MM (H-MM)—richer in the 106 and 105 Da fractions; intermediate MM
(I-MM), richer in the 105 Da; and low MM (L-MM), which was richer in 104 Da fractions.

2.3. Preparation of HA Crosslinked Nanoparticles
      Crosslinked HA nanoparticles were prepared from free I-MM according to the protocol described
by Hu et al. [23], with modifications from Bicudo et al. [24]. Nanoparticles were formed by HA
precipitation due to its local dehydration. Briefly, the process was carried out in a jacket glass
reactor (400 mL) under a controlled temperature of 21 ◦ C and gentle mechanical stirring. Ethanol
(Merck, Darmstadt, Germany) was incorporated at a flow rate of 7 mL/min into a 0.1% (w/v) solution of
sodium hyaluronate with an average MM 105 Da (Mapric Pharmaceutical Products Ltd.). Initially,
an ethanol volume of approximately 100 mL was added and the reacting system was maintained under
stirring for 2 h. Next, EDCI (40 mg/mL) and ADH (20 mg/mL), both in aqueous solutions, were added
to the reactor for crosslinking during 24 h stirring. The reaction was concluded by the addition of
more ethanol volume (100 mL approx.) and a further 20 h stirring. Nanoparticles were recovered
from the dispersion by ultrafiltration in an Ultracel® cell, containing a 10 kDa ultrafiltration disc and
a 44.5 mm diameter filter (EMD Millipore Co., Billerica, MA, USA), operated under a 0.5 psi inlet
nitrogen pressure. The yield (Y) of the nanoparticle preparation was evaluated using Equation (3):

                                                   (Tm − Fm )
                                       Y (%) =                × 100                                   (3)
                                                      Tm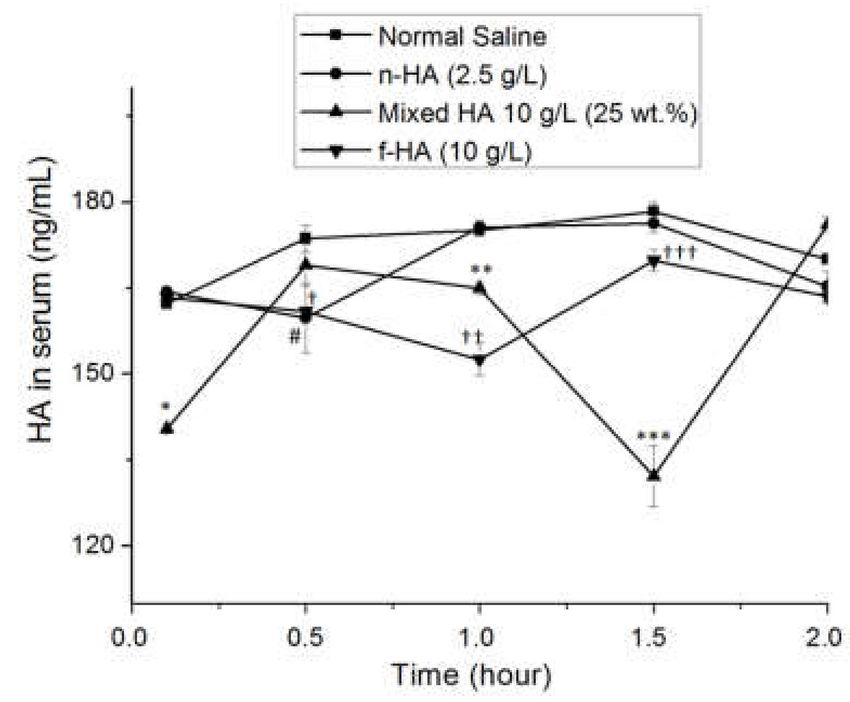
Biomolecules 2020, 10, 1422                                                                           4 of 20

where Tm is the total mass, calculated by the sum of the masses in the filtrate (Fm) and retentate
(Tm − Fm ), which contained the nanoparticles.

2.4. Preparation and Characterization of HA Colloidal Dispersions
     The colloidal dispersions of the free HA (f-HA) were prepared directly from the medical-grade
syringes, Euflexxa HA (H-MM), and post-ethanol precipitation of the dermocosmetic grade Mapric
HA (I-MM). Additional hydrolysis of I-MM was performed to obtain L-MM. The preparations were
obtained in dilute 0.01 g/L and a semi-diluted state in phosphate buffer at pH 7.4 under different
concentrations. The nanoparticle dispersions (n-HA) were prepared under the same conditions.
The HA-mixed dispersions (mixed-HA) were prepared from the freeze-dried powder of I-MM and
mixed with 25% or 50% (wt.) nanoparticles to obtain 10 g/L phosphate-buffered pH 7.4 dispersions. The
mixtures were stirred overnight at 37 ◦ C to ensure the reproducibility of the preparations. The colloidal
dispersions were characterized by the apparent viscosity and oscillatory rheology.

Rheological Characterization
     The rheological behavior of the prepared dispersions was characterized using an Anton Paar
MCR-102 Modular Compact Rheometer. The assays were conducted using a cone-plate geometry
(CP50-1) with a 50 mm diameter, a cone angle of 0.9815◦ , and a truncation of 0.97 µm. The measurements
were performed at 37 ◦ C. Steady-state shear and oscillatory measurements were performed at shear
rates from 0.01 to 1000 s−1 and an angular frequency from 0.1 to 600 rad s−1 , respectively. The apparent
viscosity was determined at 25 ◦ C using a Vibro-SV-10 viscosimeter (Tokyo, Japan).

2.5. Characterization of HA Structures
     Physicochemical characterization of the HA colloidal structures present in the dispersions was
carried out based on the mean hydrodynamic diameter, size distribution, and zeta potential. Biological
characterization was performed by in vitro mucoadhesion assays and in vivo intestinal perfusion.

Mean Hydrodynamic Diameter, Size Distribution, and Zeta Potential
      The mean hydrodynamic diameter, size distribution, and polydispersity index (PDI) were
determined by dynamic light scattering (DLS) and the data were analyzed by photon correlation
spectroscopy (PCS). Measurements were performed with a 4 mW HeNe Laser (633 nm) in an Autosizer
4700, Zetasizer Nano Series (Malvern, Malvern, UK), at a fixed angle of 173◦ and a temperature of
25 ◦ C.
      The mean hydrodynamic diameter was expressed as the Z-average:

                                                        X ni d3
                                                                i
                                          Z-average =                                                    (4)
                                                            ni d2i

where n is the number of particles with a given diameter, d.
     Size distributions were analyzed in terms of the spectra of the intensity of scattering, proportional
to the diameter, d, to the power of six (I-distribution α d6 ) for the various size classes and the particle
distribution (N-distribution α d), which is proportional to the diameter, to obtain the predominant
sizes [25].
     The zeta potential was determined by measurements of the electrophoretic mobility at a
set potential, using a 4 mW HeNe Laser (633 nm) in an Autosizer 4700, Zetasizer Nano Series
(Malvern, Malvern, UK).

2.6. Mucoadhesion
     Mucoadhesion assays were carried out with two models of biological substrate: Type III mucin of
a porcine stomach and fresh tissue from rat intestinal mucosa.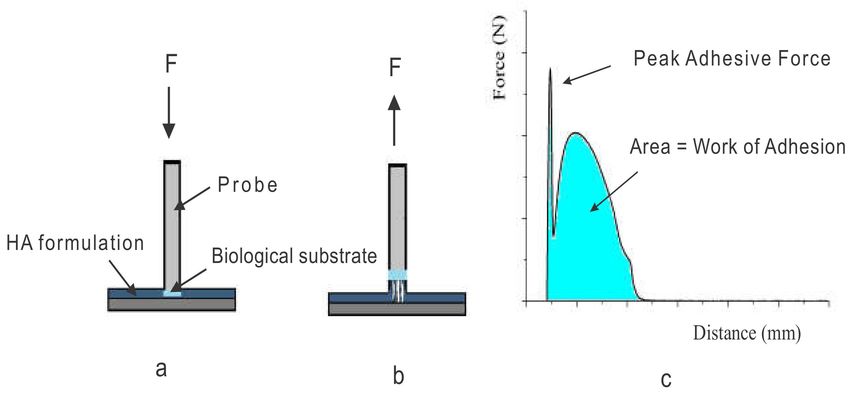
Biomolecules 2020, 10, 1422                                                                        5 of 20

     Type III mucin of the porcine stomach is a partially purified powder, containing 0.5–1.5% of sialic
acid bound to a glycoprotein polymer. Mucin tablets were manufactured by machine compression
(LM-D-8, Lemaq, São Paulo, Brazil). Tablets in the dry form with a plane and smooth surface (120 mg,
8 mm diameter, and 2.2 ± 0.12 mm thickness) were obtained according to the principles described in
the Brazilian Pharmacopoeia reference standards. The friability and hardness of the mucin tablets were
2.9% ± 0.4% and 37.5 ± 3.8 N, respectively. Loss of mass by friability and hardness were 0.3% ± 0.08%
and 8 ± 0.11 Kg, respectively.
     The intestinal mucosa of rats was extracted from male Wistar rat Mus norvegicus albinis sourced
from a local supplier (Anilab, Paulínia, Brazil). The study with animals of this work was approved by
the Animal Ethics Committee of the University of Sorocaba, São Paulo, Brazil (application number
091/2016).
     Preparation of the animal substrate followed the following protocol: Adult male rats of the same
age and weighing 260–280 g fasted for 10 h and were provided with water ad libitum. The operative
procedure began with intraperitoneal anesthesia using thiopental sodium (0.05 mg/100 g body weight).
The small intestine was exposed after a longitudinal scission of the abdomen. A non-traumatic
hemostatic tweezer was used to facilitate the scission and occlusion of the duodenum proximal (0.5 cm
below the pylorus) and duodenum distal (8.5 cm below the pylorus). Then, the mesentery over 8 cm
length duodenum was carefully removed. Fresh tissue sections (duodenum, jejunum, and ileum) were
cut off in approximately 10 cm2 pieces. Each segment was opened lengthwise, everted with the aid of
a flexible rod (2.5 mm in diameter) with an end covered by fine silk fabric and gently washed with
0.9% NaCl solution at 37 ◦ C. All mucosa was visualized for integrity and viability.
     The mucoadhesive properties of the HA formulations were investigated using a TA-XTplus texture
analyzer (Stable Micro Systems, Surrey, UK) [26]. Mucin tablets were preconditioned by pre-swelling
with purified water at 37 ◦ C for 15 min [27], and the fresh intestinal mucosa was used after washing
with 0.9% NaCl solution at 37 ◦ C. The mucin tablets and tissue sections were horizontally attached to
the lower end of the analytical P/10 probe using double-sided adhesive tape and suture thread.
     Selected HA dispersions with the f-HA, n-HA, and mixed-HA structures were placed into a
constant volume compartment and conditioned in a water bath at 37 ◦ C. For intimate contact with the
substrates, the analytical probe descended onto the surface of each dispersion, at a constant speed of
0.2 mm/s, along a penetration length 10 mm, and a downward tensile force (F) of 0.49 N was applied
for 3 min. The biological substrate returned vertically to the surface at a constant speed of 5.0 mm/s.
After every cycle, the HA dispersions and the biological substrate were replaced. The force versus
distance profiles provided the peak force, the maximum force of detachment (Fadh ), and the work of
adhesion (Wadh ) or adhesion energy as the integral of the resulting force–distance profile.
     Statistical analysis of the responses of adhesion was carried out using one-way analysis of variance
(ANOVA) with post-hoc Tukey. A significance level of p < 0.05 was used. Values were expressed as the
mean ± standard deviation (SD) of at least three replicates in mucin tablets and six replicates in fresh
tissue sections.

2.7. Intestinal Perfusion
     The in vivo intestinal perfusion assays were performed on rats. Anesthesia, surgical, and perfusion
procedures were justified in detail and were approved by the Animal Ethics Committee of the University
of Sorocaba, São Paulo, Brazil (application number 091/2016), following the guidelines described
in the Brazilian national laws governing the use of animals in research. Mus norvegicus albinis rats
(male, 260–280 g in weight, age 8–10 weeks) were kept in a 12 h light/dark cycle at 25 ◦ C and 50%
relative humidity. They came from the same local supplier (Anilab, Paulínia, Brazil) and were kept
under the same diet and housing conditions.
     Twelve healthy rats were divided into four groups randomly, with three rats in each group.
The four groups were as follows: (1) Normal saline (NS) control group; (2) free HA group; (3) mixed
HA group; and (4) nanoparticulate HA group.
Biomolecules 2020, 10, 1422 6 of 20
Three HA dispersions were used in the perfusion experiments: (I) (f-HA) I-MM HA 10 g/L
prepared from a 1% (w/v) sodium hyaluronate solution; (II) (n-HA) 2.5 g/L; (III) mixed-HA 25 wt.%
n-HA to a final concentration of 10 g/L; NaCl 0.9 wt.% was used as a control in the perfusion assays.
2.8. HA Concentration Analysis
2.8.1. Analysis in the Perfusate
The analysis of the HA concentration in the perfusate was carried out according to the protocol
described in Section 2.2.1.
2.8.2. Analysis in the Permeated
The blood of rats was drawn from the brachiocephalic vein at a variety of time points and
centrifuged after serum separation. Afterwards, a HA ELISA-like assay was used to quantify the
amount of HA from the serum. The detection range varied from 1.56–100 ng/mL and presented
sensitivityBiomolecules 2020, 10, 1422 7 of 20
from the outside. This set up ensured the isolation of the small intestine, and HA aqueous dispersion
can be introduced and sampled with the aid of the peristaltic pump and stopcock valves.
Inlet tubing was attached to the peristaltic pump (Petro Gas Ausrüstungen, Berlin, Germany).
Saline solution (37 ◦ C) was gently pumped through the inlet tubing until it filled the whole intestine to
remove adherent and non-adherent particulates present inside the intestinal lumen. The procedure
lasted 15 min until the outlet is clear. Then, at the starting point of each experiment, a 17.6–19.2 mL of
37 ◦ C perfusate formulation was infused (5 mL/min) to fill the entire segment. The small intestine was
fed under a steady-state regime with a flow rate varying with the used formulation depending on its
viscosity. Free HA with high viscosity (349 mPa·s) was pumped at a flow rate of 0.5 mL/min. The other
two formulations (mixed and nanoparticulate HA) of low viscosity (1.5 and 1.8 mPa·s, respectively)
were pumped at a flow rate of 0.2 mL/min.
Blood was collected following a pre-established schedule of 6, 30, 60, 90, and 120 min in continuous
perfusion. The samples of blood were manipulated according to the description in Section 2.8.2.
Weight and volume measurements quantified the net water flux (NWF). NWF is the ratio of the
volume of perfusion solution in the outgoing perfusate to the volume of perfusion solution in the
ingoing perfusate. Steady-state levels of HA in the perfusate volumes were reached after 60–90 min.
At the end of the experiment, the intestine was emptied with air pressure, and the rats were
euthanized by a single lethal intracardiac dose of anesthetic (thiopental sodium). The length of the
intestinal segment was measured and macerated using a digital disperser Ultraturrax (T-25—IKA
Works GmbH & Co. KG, Staufen, Germany) for further rheological measurements.
The effective permeability coefficient (Peff ) of HA structures was calculated using the parallel-tube
model [29] from the steady-state concentrations in the perfusate collected, after correcting for NWF.
Permeability values (mm/min) were calculated by Equation (5):
C
out
Cin
Pe f f = Qin × −ln (5)
A
where Qin is the flow rate; Cin and Cout are the inlet and outlet concentrations of HA, respectively;
A = 2πrL is the area of the exposed intestinal segment described as a smooth cylinder with a radius r
(set to 0.2 cm) [30] and length L, measured after completion of the experiment.
All animal experiments were replicated with n = 3. The data are expressed as mean ± standard
deviation (SD). Student’s t-tests were performed for experimental groups, and a value of p < 0.05 was
considered significant.
3. Results
3.1. Structural Properties
The hydrophobic character of some parts of the polymer induces spontaneous aggregation in an
aqueous medium which, added to the physical crosslinks of the entanglement chains, results in soft
colloids with structural properties driving their functionality [31,32]. In the intestinal tract, the structural
properties influence membrane interactions and uptake. The crosslinked HA nanoparticles (n-HA)
have lower hydrophilicity and softness. The mixed system of free HA and crosslinked nanoparticles
(mixed-HA) was considered for intermediate properties.
Table 1 shows the physicochemical characterization of the structures in terms of zeta potential
(ZP), hydrodynamic diameter (Z-average), and polydispersity index (PDI), as well as the percentages
of distribution in the classes of 106 , 105 and 104 Da for H-MM, I-MM, and L-MM. Size spectra were
recorded in terms of intensity (I) distribution that highlight all sizes present in the sample due to the
signal amplification to diameter raised to the sixth power (I α d6 ) and the (N) distribution (N α d),
where light scattering corresponds to the predominant network size (Supplementary Figures S1–S3).Biomolecules 2020, 10, 1422 8 of 20
Table 1. Average hydrodynamic size (Z-average), zeta potential (ZP), average molar mass (MM),
polydispersity index (PDI) and MM distribution: Free hyaluronic acids (HAs) (f-HA) with high (H-MM),
intermediate (I-MM), and low (L-MM) molar mass (MM); the crosslinked HA nanoparticles (n-HA)
and the mixed formulations (nanoparticles + IMM − HA) (mixed-HA) with 25% or 50% (wt.) of
nanoparticles. All formulations were buffered in pH 7.4 aqueous dispersions. (-) not determined.
Free HA
Property n-HA Mixed-HA
H-MM I-MM L-MM
Z-average 114.0 ± 14.51 538.3 ± 186.5 345.7 ± 105.3 268.7 ± 3.57 928.8 ± 170.9
ZP (mV) −4.9 ± 1.7 −40.0 ± 6.1 −24.0 ± 5.7 −20.0 ± 0.14 −7.41 ± 0.0
Average MM (×105 ), (Da) 7.2 5.2 0.08 - -
PDI 0.59 ± 0.04 0.66 ± 0.12 0.75 ± 0.22 0.56 ± 0.11 0.73 ± 0.07
MM Distribution, (%)
106 ; 34.0 ± 0.4 16.0 ± 0.1 ≈0 - -
105 ; 50.0 ± 0.7 74.0 ± 0.8 6 ± 0.0
104 (Da) 16.0 ± 0.0 10.0 ± 0.0 94.0 ± 1.9
L-MM: Hydrolyzed I-MM; measurements were carried out in semi-diluted states (0.2 g/L). Purity: H-MM (>95%),
I-MM and L-MM (~90%). The yield in n-HA was 31.2 ± 1.1%.
3.2. Rheological Behavior
Rheological behavior plays an important role in the adhesion properties of the structures. For
the required mucoadhesion at the intestinal membrane, the surface interactions of polymer–intestinal
mucosa depend on the viscoelasticity of materials. The solid-like and liquid-like contributions perform
together with the deformation on the surface and the energy dissipation, both of which are essential for
adhesion. Therefore, the characterization of rheological behavior can predict adhesion properties [33].
Linear oscillatory rheology provides the most sensitive measure of the critical gel point—the point
when the material changes from a viscoelastic liquid to a viscoelastic solid. The gels are capable of
storing and dissipating energy. Figure 1 describes the rheological behavior of the studied structures.
Figure 1. Rheological behavior of the free hyaluronic acids (f-HAs) with high (H-MM) (a) and
intermediate MM (I-MM) molar mass (b), crosslinked HA nanoparticles (n-HA) (c) and mixed
formulations (nanoparticles + free HA) (mixed-HA) (d). All formulations were buffered in pH 7.4
aqueous dispersions.Biomolecules 2020, 10, 1422 9 of 20
The curves of viscosity vs. shear rate shows the pseudoplastic nature and shear thinning behavior
(decreasing viscosity) of the free HAs, while lower and constant viscosities were observed for n-HA
and mixed-HA (Figure 1a). Figure 1b shows the evolution of the viscous or dissipative (G”) and elastic
or energy storage (G0 ) modules as a function of frequency for the H-MM and I-MM f-HAs. Transitions
(cross-over points) from a liquid-like (G” > G0 ) to a solid-like (G0 > G”) state occurred at a lower
frequency (ωx = 1 rad s−1 ) for H-MM than I-MM (ωx = 38.4 rad s−1 ), as expected.
The n-HA and mixed-HA structures exhibited gel-type mechanical spectra, i.e., G0 > G” throughout
the studied range, with a low degree of frequency dependence Figure 1c,d. The mechanical properties
of the structures in terms of (n) values in the Ostwald-de-Waele power law (η = K·γn−1 ), G0 , G”,
tan δ = G”/G0 and the B parameter for the relationship G0 = A.ωB , which determines the degree of
frequency dependence were determined. The flow index (n < 1) indicates non-Newtonian pseudoplastic
behavior. The B values define the strength and nature of the gels. It is known that B = 0 for a covalent
gel, whereas B > 0 for physical gels, according to Khondkar et al. [34].
A strong shear thinning was observed at higher shear rates with values of flow indexes (n) as low
as 0.13 Pas, indicating non-Newtonian pseudoplastic behavior for the f-HAs. The contributions of the
modules were similar for the crosslinked nanoparticles, while the viscous module contribution was
much lower than the elastic module for the mixed-HA system. Although similar tan δ = G”/G0 ~0.3,
the order of magnitude of the individual values for mixed-HA was 10 times lower than that of the
crosslinked nanoparticles and I-MM at the plateau. The gels were covalent type.
Table 2 shows the viscosities of HA formulations as a function of the concentration.
Table 2. Viscosities of HA formulations as a function of the concentration. (f-HAs) with high (H-MM)
and intermediate (I-MM) molar mass, crosslinked HA nanoparticles (n-HA) and mixed formulations
(nanoparticles + IMM- HA) (mixed-HA) with 25% or 50% (wt.) of nanoparticles. (-) not determined.
f-HA Mixed-HA (%)
n-HA
HA Structure I-MM H-MM L-MM 25 wt. 50 wt.
Viscosity at 25 ◦ C (mPa·s)
0.5 13.7 49.6 - 1.1 - -
2.5 - - - 1.8 - -
Concentration (g/L)
5 37.6 86.9 - 4.9 - -
10 349 390 7.8 - 1.5 0.7
3.3. Mucoadhesion Functionality in vitro
The mucoadhesion measurements were accomplished as described in Section 2.5. Figure 2 shows
the mucoadhesion assay, the profiles of force vs. distance, and the determined parameters of the peak
force, the maximum force of detachment (Fadh ), and the work of adhesion (Wadh ) or adhesion energy as
the integral of the resulting force–distance profile. The measured adhesion depends on the probe speed,
contact time, and force, as well as the probe shape and surface characteristics [33]. Here, assays were
carried out with a mucin II tablet as a probe or a viable rat intestinal mucosa attached to a rigid probe.
3.3.1. Mucoadhesion in Mucin III Tablets
Figure 3 shows the profiles obtained from the mucoadhesion assays. For I-MM at 10 g/L and 5 g/L
composition, the Wadh was achieved by removing the probe from the viscous medium (Figure 3a).
However, in Figure 3b, for H-MM, the events occurred outside the formulation (negative distance
values) in the compositional range studied. Nanoparticles at 2.5 g/L performed a Wadh at 8 mm depth,
meaning that this composition reached an enhanced depth in the mucin network. Fadh and Wadh
occurred outside the penetration depth at 0.5 g/L and 5 g/L with the formation of overlapping peaks
(Figure 3c). For the mixed formulation (Figure 3d) this occurred at a single concentration (10 g/L) and
two compositions of nanoparticles 25% and 50% (wt.) exhibited two stages of detachment. In theBiomolecules 2020, 10, 1422 10 of 20
first stage, from 6 mm to 2 mm of depth, whereas in the second stage it occurred at over 2 mm up to
negative distance values (i.e., above the surface).
Figure 2. Scheme of a typical tack adhesion system during (a) contact and (b) separation steps. (c) A
typical force vs. distance curve obtained from a tack measurement.
Figure 3. Profiles of mucoadhesion of HA dispersions on the mucin tablets. (a) I-MM HA (b) H-MM,
(c) nanoparticles (c) and (d) mixed, at compositions of 0.5 g/L ( ), 2.5 g/L ( ), 5 g/L ( ) and 10 g/L
( , ).
Table S1 shows the Fadh (N) and Wadh (N.mm) as a function of the concentration of HA in the
dispersions. An intra- and inter-assay statistical analysis was conducted using ANOVA with post-hoc
Tukey’s multiple comparisons test. Most of the results were not significantly different. Intra-assay
significant statistical difference was identified for Fadh at a more diluted composition (0.5 g/L) for
the I-MM formulation. There was a statistically significant difference in the inter-assay for Wadh in
mixed-HA at 25 wt.%.
3.3.2. Mucoadhesion in Rat Intestinal Mucosa
Figure 4 shows the values of the peak force Fadh and adhesion work Wadh in intestinal segments
for the HA dispersions in the range of concentrations studied. Figure 5 shows the profiles of force vs.
distance in the intestinal segments where the parameters presented significant differences.Biomolecules 2020, 10, 1422 11 of 20
Figure 4. Mean values of the mucoadhesion parameters of the structures in the intestinal segments.
(a,b) I-MM peak force and work of adhesion, (c,d) H-MM peak force and work of adhesion (e,f) n-HA
peak force and work of adhesion, and (g,h) mixed-HA peak force and work of adhesion. Values are
summarized as mean ± S.D. (*) refers to a difference between means between the duodenum and jejunum.
(**) refers to inter-assay difference of means from L-MM at 10 g/L and other compositions. (***) refers to
inter-assay difference of means from I-MM at 10 g/L and other compositions. (****) refers to intra-assay
difference of means from H-MM at 10 g/L in ileum segment and other compositions. (*****) refers to
inter-assay difference of means from mixed-HA (25 wt.% n-HA) at 10 g/L and other compositions.
Figure 4a,b shows the highest values for Fadh and Wadh in the jejunum for I-MM HA. L-MM
presented a higher peak force, but the lowest Wadh . Figure 5a shows the force vs. distance profiles at
the studied concentrations, evidencing that the adhesion curves were inside the dispersions at 10g/L in
the jejunum for both dispersions.
Fadh for free H-MM was not responsive at the compositional range studied, while the Wadh was
significantly different at 10 g/L in ileum only (Figure 4c,d). However, the profiles were above the
surface (Figure 5b). Figure 4e,f summarizes the profiles of Fadh and Wadh for the HA nanoparticles.
No statistical difference intra- and inter-assay was identified. The profiles in jejunum for 0.5 g/L
and 5 g/L overlapped outside the surface (Figure 5c). Figure 4g,h shows a significant difference for
Wadh in the jejunum and ileum for mixed-HA dispersion containing 25 wt.% nanoparticles at 10 g/L.
Figure 5d shows the profiles for 25 wt.% nanoparticles at 10 g/L. The profiles indicate that mixed-HA
interpenetrate the three intestinal segments, and penetrate jejunum and ileum the most.
3.4. Intestinal Perfusion and Improved In Situ Single-Pass Intestinal Permeability
The improved single-pass intestinal perfusion (SPIP) method, which considers the whole length
of the animal intestine, was used to assesses the perfusates and effective intestinal permeability (Peff )
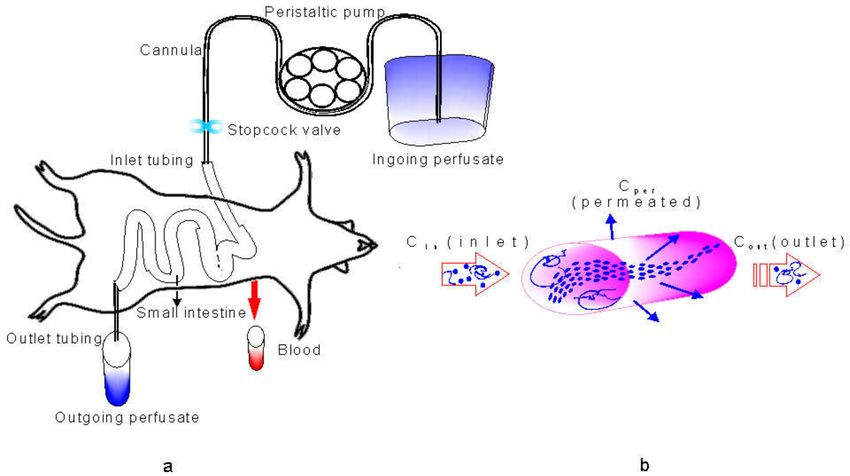
of the structures in vivo. Figure 6 illustrates fluxes involved in the continuous intestinal perfusion and
the improved in situ SPIP. Initially, HA is tangentially fed across the intestinal lumen. The microvilli
retain the structures that permeate the membrane by paracellular transport, which is regulated by
tight junctions, while the carrier-mediated transcellular transport is activated by the receptors and the
interacting structures [35].Biomolecules 2020, 10, 1422 12 of 20
Figure 5. The top image shows the variation in the thickness of the mucus layer in the three different
intestinal segments: Duodenum, jejunum, and ileum (a). Mucoadhesion profiles of intestinal segments
that present the peak force in the presence of f-HA I-MM (b), f-HA H-MM (c), f-HA n-HA (d), and
mixed-HA (e). Variations of the force for the detachment of the HA structures adhered to rat intestinal
mucosa. The force was a function of upward probe distance for the following compositions: 0.5 g/L
( ), 2.5 g/L ( ), 5 g/L ( ), 10 g/L ( ), 10 g/L hydrolyzed ( ), and 25 wt.% n-HA 10 g/L.
Figure 6. Scheme illustrative of the improved in situ single-pass intestinal perfusion (SPIP) method
that uses the whole length of the animal intestine (a), and the fluxes involved in continuous intestinal
perfusion (b).Biomolecules 2020, 10, 1422 13 of 20
Physicochemical Characterization of Perfusate HAs
Table 3 shows the molar mass (MM) distribution of f-HA in the classes of 106 , 105 , and 104 Da.
There were changes in the ingoing and outgoing perfusate as a consequence of the permeation of
the MM classes. The values indicate that 105 Da was the best class of permeated MM (40% ± 4%),
followed by 104 Da (20% ± 1%) and 106 Da (6% ± 0%). Furthermore, the permeability coefficients (Peff )
that characterize the HA intestinal uptake for the studied structures in the small intestine wall of rats
were calculated.
Table 3. Ingoing and outgoing concentrations, permeate and permeability coefficient (Peff ) as function
of HA structures.
MM Peff
HA Structure Ingoing Outgoing Permeate (%)
(% Class) (×10−5 mm/min)
106 16 ± 0.0 15 ± 0.0 6±0
I-MM 10 g/L 0.9 ± 0.1
105 74 ± 0.8 46 ± 0.0 40 ± 4
104 10 ± 0.0 8 ± 0.0 20 ± 1
n-HA 2.5 g/L 2.5 ± 0.1 0.5 ± 0.0 80 ± 5 2.6 ± 0.2
Mixed-HA 10 g/L 10 ± 0.0 5.5 ± 0.0 45 ± 4 1.0 ± 0.0
Permeate (%): calculated by the difference between the ingoing and outgoing MM classes for free HA structures and
by the difference between the ingoing and outgoing concentration for n-HA and Mixed-HA structures. Permeability
coefficients (Peff ) calculated according to (Eq. 2): Flow rate (mL/min): 0.5, 0.2 and 0.2, for free (10 g/L), n-HA (2.5 g/L)
and mixed-HA 25 wt.% n-HA (10 g/L) respectively.
The free I-MM class from 105 Da presented a higher percentage of permeation in relation to the
other MM classes. However, the heterogeneity of MM distribution reduced the effective permeability
of f-HA. On the other hand, the homogeneity and reduced sizes of n-HA positively impacted its
permeability, raising Peff . Mixed-HA showed a slight improvement in the percentage permeated;
however, its Peff did not differ from f-HA.
Figure 7a–d shows the shear viscosity profiles as well as the viscous and viscoelastic modulus of
the macerated small intestine of rats before and after perfusion. The control group corresponds to the
intestine that was perfused with a normal saline solution.
Figure 7. Profiles of shear viscosity (a,c) and viscous and viscoelastic modulus (b,d) of macerated small
intestine of rats emptied after perfusion with saline solution (control) (a,b) and the HA formulations
(c,d). Error bars represent SD = 3.Biomolecules 2020, 10, 1422 14 of 20
Figure 7a shows the pseudoplastic behavior and shear-thinning (shear viscosity decreasing with
shear rate) of the intestinal membrane macerate before perfusion with the structures. This macerate
also has an elastic gel behavior, with G0 > G” and constant in the frequency range studied (Figure 7b).
The profiles of the membrane macerate rat small intestine perfused with the HA formulations are
shown in Figure 7c,d.
Figure 8 shows the clearance kinetics for the exogenous HA absorbed. The exogenous HA is
removed from the bloodstream, never exceeding endogenous levels (standard saline group control).
The clearance of n-HA occurred in little time (0.5 h), while the plasmatic clearance of I-MM HA
structures occurred within 1 h, and the clearance of mixed-HA started earlier (before 6 min), ending
within 1.5 h. The concentration of HA in the blood tended to normalize after the period of clearance of
exogenous HA, recovering homeostasis within 2 h.
Figure 8. Kinetic behavior of HA clearance in the serum of rats perfused with HA formulations. The
cumulative exogenous HA in the serum pool during perfusion. Error bars represent (standard deviation)
SD = 3. The Student’s t-test was used to analyze data for significant differences. Values of p < 0.05 were
regarded as significant. Significant statistical difference was identified for HA formulations: †,†† and †††
p < 0.05 for f-HA (10 g/L), # p < 0.05 for n-HA (2.5 g/L), *, ** and *** p < 0.05 for Mixed HA 25 wt.%
n-HA (10 g/L), compared to the same time point in the normal saline control.
4. Discussion
In previous work, we reviewed the structural changes of HA related to concentration, MM,
pH, the gastrointestinal system and the molecular dynamics of intestinal uptake and signaling,
immunomodulation at intestinal and systemic levels, and HA fate in other tissues. Detailed studies still
need to be devised to determine the effect of the physicochemical properties of HA in the formation
of TLR4/CD44 clusters in the intestinal environment. The nanotechnological approach represents
progress in the field of oral HA administration [36]. Here, we carried out an experimental investigation
on the physicochemical, rheological, and in vitro mucoadhesion properties of the HA structures and
their influence on the intestinal uptake in vivo. Dispersions containing high (H-MM HA), intermediate
(I-MM HA), and low (L-MM HA) molar mass HA (f-HA) were prepared and characterized, as well as
dispersions of ADH crosslinked nanoparticles (n-HA) and containing mixed structures composed of
I-MM HA + n-HA (mixed-HA). The physicochemical characterization showed that f-HA chains form
colloidal structures with physical entanglement. The hydrodynamic diameter, size distribution, and
zeta potential of the structures were controlled by concentration, MM, density, viscosity, and dissociation
of the carboxyl groups on the surface. MM distribution was crucial to the architecture of the structures.
Table 1 shows the results in a semi-diluted state (0.2 g/L) for the studied structures. H-MM HA formed
larger and more stable structures (lower Z-average and PDI) due to a greater amount of physical
crosslinking [31,37,38] and larger chains of the 106 Da fraction (Table 1). The hydrodynamic diameter
distribution showed sizes predominantly in the 200 nm class (N-distribution) but also in the 100 nm
class (I-distribution) (Figure S1a,b, Supplementary Information). The denser core inside the structureBiomolecules 2020, 10, 1422 15 of 20
of H-MM HA provided a higher exposition of the carboxyl groups on the surface of the structures.
However, the high density of the groups and the viscosity of the dispersions made its dissociation
difficult, providing the lowest zeta potential (ZP) (−4.9 ± 1.7 mV). ZP determines the electrostatic
potential at the slipping plane, which includes the Debye length, that represents the length of the double
electric layer provided by the ions around a particle. ZP represents the charge exposed to the medium
that determines the adhesion behavior of the HA structures on the surfaces in vitro and in vivo [34,39].
Therefore, ZP reflects the differences among materials, such as structure, architecture and surface
charge due to different MM HA. An abrupt increase in the absolute value of ZP (−40 ± 6.1 mV) was
observed for I-MM HA.The reduction of the physical crosslinks distributed the carboxyl groups inside
and on the surface, and the lower viscosity promoted its dissociation, which explains the determined
ZP (Table 1). Furthermore, I-MM HA formed less dense, more hydrated, and flexible structures,
explained by the high SD in Z-average 538.3 ± 183.5 and the size distribution in the I-distribution
(Figure S1c, Supplementary Information). As the scattering of light is proportional to the density
of the structure [24], the predominant size was 10 nm according to (N) distributions (Figure S1d,
Supplementary Information). L-MM had a smaller average MM and a structure similar to I-MM, with
the carboxyl groups at the surface (ZP= −24 ± 5.7), but with a lower Z-average (345.7 ± 105.3) and
distribution due to the shorter chains. A predominant peak was observed at 50 nm (Figure S1e,f,
Supplementary Information).
HA crosslinked nanoparticles at semi-dilute regimes, 0.2 g/L, and at 0.5 g/L, presented sizes
dependent on concentrations. The crosslinking reduced the size dispersion compared to free I-MM,
as expected. Furthermore, the crosslinking with ADH via EDC (reaction with carboxyl groups) also
reduced the negative charge on the surface yielding lower ZP compared to I-MM (from −40.0 ± 6.1 to
−20.0 ± 5.7 mV). Although the stability criterion, ZP > 30 mV or ZP < −30 mV [39], the reduction in ZP
does not severely compromise the electrostatic stability of the nanoparticles.
Free I-MM was mixed with 25 or 50 wt.% of nanoparticles to obtain mixed HA structures.
Both compositions were prepared in concentrated form (10 g/L). At the lower concentration
(25 wt.%), the interactions between free HA and the nanoparticles formed large, dense, unstable,
and heterogeneous structures with a Z-average of 928.8 ± 170.9, a predominant size of 342 nm
(Figure S2g,h), and ZP of −7.41 mV. However, when the nanoparticle concentration was increased
to 50 wt.%, the Z-average changed to 2652 ± 222.1 nm with a predominant size of 10 nm and ZP of
−11.60 ± 0.70 mV. From these results, it can be inferred the mixed structure contained heterogeneous
and highly hydrated domains filled with nanoparticles.
The rheological characterization showed a pseudoplastic microstructural behavior with a lower
“n” index and lower crossover point for H-MM than I-MM, indicating that H-MM HA can be used at
lower concentrations to obtain the same rheological effects (Figure 1a,b). As a consequence, H-MM
HA has a higher relaxation time due to the higher fraction of 106 Da. The nanoparticles produced
a weak gel-like structure with viscous (G”) and elastic components (G0 ), and tan δ = G”/G0 ~0.3.
Although they had a similar value for tan δ, both moduli were reduced for the mixed-HA structures
(Figure 1c,d). Table 2 shows that the apparent viscosity decreased with MM of the structures, as
expected. The structuration in crosslinked nanoparticles produced less viscous dispersions. Similar
values were observed to the apparent viscosity of the mixed-HA structures, justifying the smaller and
lesser flexible domains compared to free I-MM, due to the presence of the nanoparticles.
The capability for adhesion—the first step for intestinal uptake—was initially assayed in vitro in
mucin. It is noted that the native mucus concentration was greater than 20 mg/mL [40]. Thus, it is
clear that mucins in the native state are well entangled. Mucoadhesion is a function of various factors,
such as electrostatic charge, hydration, hydrophobic interactions, and the rheological behavior of the
dispersions, so that the structures play an important role. In particular, the abundance of COOH
groups promote adhesion through hydrogen bond formation with biological substrates [41].
One common criterion for material with good adhesive properties is an elastic modulus of less
than 105 Pa [42]. Materials with elastic moduli exceeding the Dahlquist criterion have poor adhesiveBiomolecules 2020, 10, 1422 16 of 20
characteristics due to their inability to dissipate energy via viscous contributions or to deform to make
good contact with a surface [43]. In biological materials, the magnitude of the elastic modulus was
much lower (G0 = 10 for n-HA and G0 = 1 for mixed-HA), as expected.
The mucoadhesion assays carried out using a mucin tablets probe showed that all systems
were responsive to detachment force (Fadh ) and adhesion work (Wadh ) (Table S1), with similar
values for the assayed concentrations. However, the force vs. distance profiles showed different
mucoadhesion mechanisms (Figure 3). The profiles of H-MM had Fadh and Wadh out of the probe path
(negative values), inferring the presence of fibrils at the surface before detachment [44]. Therefore,
the cohesion of HA chains in the larger and denser structures of H-MM did not penetrate the mucin
network (Figure 3a). The profiles of I-MM HA (10 g/L) showed that the hydration capacity and
flexibility of the structures provided penetration of HA into the mucin network, counterbalancing
electrostatic repulsion (Figure 3b). The nanoparticles interacted with mucin into dispersion at 2.5 g/L
only. The profiles of n-HA and mixed-HA showed detachment in steps, indicating different interaction
mechanisms compared to I-MM HA. It can be inferred that the size and stability produced by the
crosslinking allowed the nanoparticles to penetrate deeper into the mucin network (20–200 nm cut-off
pores). Furthermore, the gel’s behavior with the elastic and viscous components promoted the retention
and interaction of energy with n-HA and mixed-HA structures.
With the rat intestinal membrane covering the probe, there was a difference in the responses
among the duodenum, jejunum, and ileum due to their variable thicknesses (Figures 4 and 5).
The tendency of the responses in the scope of the assays was similar to those obtained by the mucin
probe, with significant differences for I-MM HA (10 g/L), n-HA (2.5 g/L), and mixed-HA (25 wt.%). The
effects were pronounced in the jejunum segment for I-MM and n-HA, and along the small intestine for
mixed-HA. When using the intestinal membrane, the cellular viability [45] and the functionality of the
TLR4 receptors from the freshly excised mucosa raise new questions. Stabilization of the binding of
HA structures provides synergistic effects on TLR4 receptors [46]. The HA structures (roughly 65 nm)
in the specific MM range (100–300 kDa) positively influenced the structuring of multiple HA receptors
into the transmembrane assembly, essential to enable the stabilization of binding [47].
By measuring HA concentrations in ingoing and outgoing fluxes, the effective permeability
coefficients (Peff ) that characterize HA intestinal uptake of the structures in the small intestine wall
of rats were calculated. The best uptake, Peff 2.62 × 10⁻⁵ mm/min, which corresponds to 80% ± 5%
permeated mass, was obtained with the n-HA structure, while the f-HA and mixed-HA structures
were more poorly permeated (Table 3).
The rheology of the intestinal membrane after perfusions showed no significant differences in
pseudoplasticity for the intestinal membrane perfused with n-HA or mixed-HA, but changes could
be observed for IMM-HA (Figure 7b) compared to the membrane perfused with saline as a control
(Figure 7a). Oscillatory measurements in the membrane macerate showed that the membrane retained
its viscoelastic behavior after perfusion with the n-HA structure. However, the gel-like behavior was
lost after IMM-HA perfusion and was much weaker for mixed-HA structure. These results explain
the significant difference in the effective permeability coefficients for n-HA compared to the other
structures. Moreover, these results confirmed the behavior inferred from the in vitro assays. Therefore,
most of the IMM-HA and mixed-HA structures diffused slowly due to the tight junctions sealing the
enterocytes in the membrane. Hisada et al. [44] found that the transmural flux of free HA (5 mg/mL)
and MM < 5 kDa in a monolayer of Caco-2 cells was 0.04% (m/v), and it was size-dependent.
The paracellular transport of free macromolecules larger than 250–300 kDa makes only a minor
contribution to overall intestinal permeation [48,49]. However, it has been suggested that the structuring
in nanoparticles is largely absorbed [50]. Nanoparticles can be substrates to TLR4 intestinal transporter
protein in a carrier-mediated uptake of HA larger than 250–300 kDa and with a specific diameter
size of roughly 65 nm [35,47,51]. Therefore, the n-HA structure may be diffused by paracellular and
transcellular mechanisms, thus promoting its uptake into the intestinal mucosa.Biomolecules 2020, 10, 1422 17 of 20
After uptake, the TLR4 receptor releases the intact HA to the Peyer’s patches, following from the
lymphoid follicles to the systemic bloodstream [52]. HA concentrations in serum were also analyzed.
As known, the levels of exogenous HA in the bloodstream cannot exceed endogenous levels, due to
the deleterious effect on plasma even for low MM. Studies have shown that the removal of exogenous
HA from the bloodstream compartment occurs from 2 to 6 min after intravenous administration in the
healthy adult human, and residual fractions were degraded in the lymph nodes and excreted by the
kidneys at a three-fold clearance to the urinary tract in relation to total systemic turnover [53].
Figure 8 shows that exogenous absorbed HA is rapidly removed from the bloodstream, never
exceeding endogenous levels (standard saline group control). By analyzing the clearance time,
the profiles showed the clearance of n-HA occurred in a short time (0.5 h). Barua and Mitragotri [54]
reported that stable and smaller sizes (Biomolecules 2020, 10, 1422 18 of 20
Conflicts of Interest: The authors declare no conflict of interest.
References
1. Kogan, G.; Soltés, L.; Stern, R.; Mendichi, R. Hyaluronic acid: A biopolymer with versatile physico-chemical
and biological properties. In Handbook of Polymer Research: Monomers, Oligomers, Polymers and Composites;
Pethrich, R.A., Antonio, B., Zaikov, G.E., Eds.; Nova Science Publishers Inc.: New York, NY, USA, 2007;
pp. 393–439.
2. Fukuda, K.; Takayama, M.; Ueno, M.; Oh, M.; Asada, S.; Kumano, F.; Tanaka, S. Hyaluronic acid inhibits
interleukin-1-induced superoxide anion in bovine chondrocytes. Inflamm. Res. 1997, 46, 114–117. [CrossRef]
[PubMed]
3. De la Motte, C.A. Hyaluronan in intestinal homeostasis and inflammation: Implications for fibrosis. Am. J.
Physiol. Gastrointest. Liver Physiol. 2011, 301, G945–G949. [CrossRef] [PubMed]
4. Toole, B.P. Hyaluronan: From extracellular glue to pericellular cue. Nat. Rev. Cancer 2004, 4, 528–539.
[CrossRef] [PubMed]
5. Bowers, W.H. Lubrication of human joints. In The Musculoskeletal System. Basic Processes and Disorders;
Wilson, F.C., Ed.; Lippincott Company: Philadelphia, PA, USA, 1983; pp. 225–230.
6. Hansen, I.M.; Ebbesen, M.F.; Kaspersen, L.; Thomsen, T.; Bienk, K.; Cai, Y.; Malle, B.M.; Howard, K.A.
Hyaluronic acid molar weight-dependent modulation of mucin nanostructure for potential mucosal
therapeutic applications. Mol. Pharm. 2017, 14, 2359–2367. [CrossRef] [PubMed]
7. Balazs, E.A.; Band, P.A. Therapeutic use of hyaluronan-based products. In Carbohydrate Chemistry, Biology
and Medical Applications, 1st ed.; Garg, H.G., Cowman, M.K., Hales, C.A., Eds.; Elsevier Ltd.: New York, NY,
USA, 2008; pp. 311–332.
8. Kawada, C.; Yoshida, T.; Yoshida, H.; Matsuoka, R.; Sakamoto, W.; Odanaka, W.; Sato, T.; Yamasaki, T.;
Kanemitsu, T.; Masuda, Y.; et al. Ingested hyaluronan moisturizes dry skin. Nutr. J. 2014, 13, 70. [CrossRef]
9. Martinez-Puig, D.; Möller, I.; Fernández, C.; Chetrit, C. Efficacy of oral administration of yoghurt
supplemented with a preparation containing hyaluronic acid (Mobilee™) in adults with mild joint discomfort:
A randomized, double-blind, placebo controlled intervention study. Mediterr. J. Nutr. Metab. 2013, 6, 63–68.
[CrossRef]
10. Baranova, N.S.; Foulcer, S.J.; Briggs, D.C.; Tilakaratna, V.; Enghild, J.J.; Milner, C.M.; Day, A.J.; Richter, R.P.
Inter-α-inhibitor Impairs TSG-6-induced Hyaluronan Cross-linking. J. Biol. Chem. 2013, 288, 29642–29653.
[CrossRef]
11. Dyer, D.P. Understanding the mechanisms that facilitate specificity, not redundancy, of chemokine-mediated
leukocyte recruitment. J. Immunol. 2020, 160, 336–344. [CrossRef]
12. Oe, M.; Tashiro, T.; Yoshida, H.; Nishiyama, H.; Masuda, Y.; Maruyama, K.; Koikeda, T.; Maruya, R.; Fukui, N.
Oral hyaluronan relieves knee pain: A review. Nutr. J. 2016, 15, 11. [CrossRef]
13. Schultz, R.H.; Wollen, T.H.; Greene, N.D.; Brown, K.K.; Mozier, J.O. Remote Administration of Hyaluronic
Acid to Mammals (Mobay Corporation, Pittsburgh, PA, USA). US4808576A, 28 February 1989.
14. Teubl, B.J.; Meindl, C.; Eitzlmayr, A.; Zimmer, A.; Fröhlich, E.; Roblegg, E. In-vitro permeability of neutral
polystyrene particles via buccal mucosa. Small 2013, 9, 457–466. [CrossRef]
15. Serra, L.; Doménech, J.; Peppas, N. Engineering design and molecular dynamics of mucoadhesive drug
delivery systems as targeting agents. Eur. J. Pharm. Biopharm. 2009, 71, 519–528. [CrossRef]
16. Bistoletti, M.; Bosi, A.; Caon, I.; Chiaravalli, A.M.; Moretto, P.; Genoni, A.; Moro, E.; Karousou, E.; Viola, M.;
Crema, F.; et al. Involvement of hyaluronan in the adaptive changes of the rat small intestine neuromuscular
function after ischemia/reperfusion injury. Sci Rep. 2020, 10, 11521. [CrossRef] [PubMed]
17. Filpa, V.; Bistoletti, M.; Caon, I.; Moro, E.; Grimaldi, A.; Moretto, P.; Baj, A.; Giron, M.C.; Karousou, E.;
Viola, M.; et al. Changes in hyaluronan deposition in the rat myenteric plexus after experimentally-induced
colitis. Sci. Rep. 2017, 7, 17644. [CrossRef] [PubMed]
18. Rabba, A.K.; Si, L.; Xue, K.; Li, M.; Li, G. In situ intestinal perfusion of irinotecan: Application to P-gp
mediated drug interaction and introduction of an improved HPLC assay. J. Pharm. Pharm. Sci. 2011, 14,
138–147. [CrossRef] [PubMed]Biomolecules 2020, 10, 1422 19 of 20
19. Han, X.; Wang, Z.; Wang, M.; Li, J.; Xu, Y.; He, R.; Guan, H.; Yue, Z.; Gong, M. Liver-targeting
self-assembled hyaluronic acid-glycyrrhetinic acid micelles enhance hepato-protective effect of silybin
after oral administration. Drug Deliv. 2016, 23, 1818–1829. [CrossRef]
20. Kim, T.H.; Paik, S.H.; Chi, Y.H.; Bulitta, J.B.; Lee, D.Y.; Lim, J.Y.; Chung, S.E.; Song, C.H.; Jeong, H.M.; Shin, S.;
et al. Regional absorption of fimasartan in the gastrointestinal tract by an improved in situ absorption
method in rats. Pharmaceutics 2018, 10, 174. [CrossRef]
21. Cavalcanti, A.D.D.; Melo, B.A.G.; Oliveira, R.C.; Santana, M.H.A. Recovery and purity of high molar mass
bio-hyaluronic acid via precipitation strategies modulated by pH and sodium chloride. Appl. Biochem. 2019,
188, 527–539. [CrossRef]
22. Chen, Y.-H.; Wang, Q. Establishment of CTAB turbidimetric method to determine hyaluronic acid content in
fermentation broth. Carbohydr. Polym. 2009, 78, 178–181. [CrossRef]
23. Hu, Z.; Xia, X.; Tang, L. Process for Synthesizing Oil and Surfactant-Free Hyaluronic Acid Nanoparticles and
Microparticles (University of North Texas, Denton, TX, USA). US 20060040892A1, 23 February 2006.
24. Bicudo, R.C.; Santana, M.H. Effects of organic solvents on hyaluronic acid nanoparticles obtained by
precipitation and chemical crosslinking. J. Nanosci. Nanotechnol. 2012, 12, 2849–2857. [CrossRef]
25. Vincent, B. Particle size analysis. In Materials Science; Stanley-Wood, N.G., Lines, R.W., Eds.; The Royal
Society of Chemistry: Cambridge, MA, USA, 1992; p. 538.
26. Otero-Espinar, F.J.; Delgado-Charro, B.; Anguiano-Igea, S.; Blanco-Mendez, J. Use of tensile test in the study
of the bioadhesive and swelling properties of polymers. In Data Acquisition and Measurement Techniques;
Muñoz-Ruiz, A., Vromans, H., Eds.; Interpharm. Press Inc.: Buffalo Grove, IL, USA, 1998; pp. 295–342.
27. Ponchel, G.; Touchard, F.; Duchene, D.; Peppas, N.A. Bioadhesive analysis of controlled-release systems. I.
Fracture and interpenetration analysis in poly(acrylic acid)-containing systems. J. Control. Release 1987, 5,
129–141. [CrossRef]
28. Li, M.; Si, L.; Pan, H.; Rabba, A.K.; Yan, F.; Qiu, J.; Li, G. Excipients enhance intestinal absorption of ganciclovir
by P-gp inhibition: Assessed in vitro by everted gut sac and in situ by improved intestinal perfusion. Int. J.
Pharm. 2011, 403, 37–45. [CrossRef]
29. Ahmad, A.B.; Bennett, P.N.; Rowland, M. Models of hepatic drug clearance: Discrimination between the
‘well stirred’ and ‘parallel-tube’ models. J. Pharm. Pharmacol. 1983, 35, 219–224. [CrossRef] [PubMed]
30. Zakeri-Milani, P.; Barzegar-Jalali, M.; Tajerzadeh, H.; Azarmi, Y.; Valizadeh, H. Simultaneous determination of
naproxen, ketoprofen and phenol red in samples from rat intestinal permeability: HPLC method development
and validation. J. Pharm. Biom. Anal. 2005, 39, 624–630. [CrossRef] [PubMed]
31. Scott, J.E. Secondary structures in hyaluronan solutions: Chemical and biological implications. The Biology
of Hyaluronan. In Ciba Foundation Symposium; Evered, D., Whelan, J., Eds.; Novartis Foundation Symposia:
Boston, MA, USA, 1989; pp. 6–14.
32. Scott, J.E.; Cummings, C.; Brass, A.; Chen, Y. Secondary and tertiary structures of hyaluronan in aqueous
solution, investigated by rotary shadowing-electron microscopy and computer simulation. Hyaluronan is a
very efficient network-forming polymer. Biochem. J. 1991, 274, 699–705. [CrossRef] [PubMed]
33. Hunter, R.J. Foundations of Colloid Science, 2nd ed.; University Press: Oxford, MS, USA, 2001; p. 816.
34. Khondkar, D.; Tester, R.F.; Hudson, N.; Karkalas, J.; Morrow, J. Rheological behaviour of uncross-linked and
cross-linked gelatinised waxy maize starch with pectin gels. Food Hydrocoll. 2007, 21, 1296–1301. [CrossRef]
35. Lennernäs, H. Intestinal permeability and its relevance for absorption and elimination. Xenobiotica 2007, 37,
1015–1051. [CrossRef]
36. De Souza, A.; Chaud, M.; Santana, M.H. Hyaluronic acid behavior in oral administration and perspectives
for nanotechnology-based formulations: A review. Carbohydr. Polym. 2019, 115001. [CrossRef]
37. Hennink, W.E.; Nostrum, C.F.v. Novel crosslinking methods to design hydrogels. Adv. Drug Deliv. Rev. 2002,
54, 13–36. [CrossRef]
38. Hardingham, T. Chemistry and Biology of Hyaluronan. In Solution Properties of Hyaluronan, 1st ed.;
Hales, H.G.C., Ed.; Elsevier Science: Boston, MA, USA, 2004; pp. 1–19.
39. Kerker, M. The Scattering of Light and other Electromagnetic Radiation. In Physical Chemistry: A Series of
Monographs, 1st ed.; Loebl, E.M., Ed.; Academic Press: Cambridge, MA, USA, 1969; Volume 16, pp. 311–413.
40. Dekker, J.; van der Ende, A.; Aelmans, P.H.; Strous, G.J. Rat gastric mucin is synthesized and secreted
exclusively as filamentous oligomers. Biochem. J. 1991, 279, 251–256. [CrossRef]You can also read