Impact of dust addition on the microbial food web under present and future conditions of pH and temperature
←
→
Page content transcription
If your browser does not render page correctly, please read the page content below
Research article
Biogeosciences, 19, 1303–1319, 2022
https://doi.org/10.5194/bg-19-1303-2022
© Author(s) 2022. This work is distributed under
the Creative Commons Attribution 4.0 License.

Impact of dust addition on the microbial food web under present
and future conditions of pH and temperature
Julie Dinasquet1,2,a , Estelle Bigeard3 , Frédéric Gazeau4 , Farooq Azam1 , Cécile Guieu4 , Emilio Marañón5 ,
Céline Ridame6 , France Van Wambeke7 , Ingrid Obernosterer2 , and Anne-Claire Baudoux3
1 Scripps Institution of Oceanography, University of California San Diego, La Jolla, CA 92037, USA
2 Sorbonne  Université, CNRS, Laboratoire d’Océanographie Microbienne, LOMIC, 66650 Banyuls-sur-Mer, France
3 Sorbonne Université, CNRS, Station Biologique de Roscoff, UMR 7144 Adaptation et Diversité en Milieu Marin,

Roscoff, France
4 Sorbonne Université, CNRS, Laboratoire d’Océanographie de Villefranche, LOV, 06230 Villefranche-sur-Mer, France
5 Department of Ecology and Animal Biology, Universidade de Vigo, 36310 Vigo, Spain
6 Laboratoire d’Océanographie et du Climat: Expérimentation et Approches Numériques (LOCEAN-IPSL),

Sorbonne Université, CNRS-IRD-MNHN, 75005 Paris, France
7 Aix-Marseille Université, Université de Toulon, CNRS/INSU, IRD, Mediterranean Institute of Oceanography (MIO),

UM 110, 13288, Marseille, France
a present address: Center for Aerosol Impact on Chemistry of the Environment (CAICE),

Scripps Institution of Oceanography, UCSD, La Jolla, CA, USA

Correspondence: Julie Dinasquet (jdinasquet@ucsd.edu)

Received: 1 June 2021 – Discussion started: 11 June 2021
Revised: 23 November 2021 – Accepted: 26 January 2022 – Published: 3 March 2022

Abstract. In the oligotrophic waters of the Mediterranean         ments. Different microbial and viral responses to dust were
Sea, during the stratification period, the microbial loop re-     observed rapidly after addition and were, most of the time,
lies on pulsed inputs of nutrients through the atmospheric        more pronounced when combined with future environmen-
deposition of aerosols from both natural (e.g., Saharan dust),    tal conditions. The dust input of nutrients and trace metals
anthropogenic, or mixed origins. While the influence of dust      changed the microbial ecosystem from a bottom-up limited
deposition on microbial processes and community composi-          to a top-down controlled bacterial community, likely from
tion is still not fully constrained, the extent to which future   grazing and induced lysogeny. The relative abundance of
environmental conditions will affect dust inputs and the mi-      mixotrophic microeukaryotes and phototrophic prokaryotes
crobial response is not known. The impact of atmospheric          also increased. Overall, these results suggest that the effect
wet dust deposition was studied both under present and fu-        of dust deposition on the microbial loop is dependent on the
ture environmental conditions (+3 ◦ C warming and acidifi-        initial microbial assemblage and metabolic state of the tested
cation of −0.3 pH units), through experiments in 300 L cli-       water and that predicted warming and acidification will in-
mate reactors. In total, three Saharan dust addition experi-      tensify these responses, affecting food web processes and
ments were performed with surface seawater collected from         biogeochemical cycles.
the Tyrrhenian Sea, Ionian Sea, and Algerian basin in the
western Mediterranean Sea during the PEACETIME (Pro-
cEss studies at the Air–sEa Interface after dust deposition in
the MEditerranean sea) cruise in May–June 2017. Top-down          1   Introduction
controls on bacteria, viral processes, and community, as well
as microbial community structure (16S and 18S rDNA am-            Input of essential nutrients and trace metals through aerosol
plicon sequencing), were followed over the 3–4 d experi-          deposition is crucial to the ocean surface water biogeochem-
                                                                  istry and productivity (at the global scale, e.g., Mahowald

Published by Copernicus Publications on behalf of the European Geosciences Union.
1304 J. Dinasquet et al.: Impact of dust addition on the microbial food web et al., 2017 and in the Mediterranean Sea, e.g., Guieu and future projected conditions of temperature and pH. To our Ridame, 2020), with episodic fertilization events driving mi- knowledge, this is the first study assessing the effect of at- crobial processes in oligotrophic regions such as the Pacific mospheric deposition on the microbial food web under future Ocean, the Southern Ocean, and the Mediterranean Sea. environmental conditions. The summer Mediterranean food web is characterized by low primary production (PP) and heterotrophic prokaryotic production (more classically abbreviated as BP for bacterial 2 Material and method production) constrained by nutrient availability. Low BP fur- ther limits dissolved organic matter (DOM) utilization and 2.1 Experimental setup export, resulting in DOM accumulation. Therefore, inputs of bioavailable nutrients through the deposition of atmospheric During the ProcEss studies at the Air–sEa Interface after dust particles are essential to the Mediterranean Sea microbial deposition in the MEditerranean sea project cruise (PEACE- ecosystem. Indeed, these nutrient pulses have been shown TIME), on board the research vessel (R/V) Pourquoi Pas? to support microbial processes, but the extent to which the in May/June 2017, three experiments were conducted in microbial food web is affected might be dependent on the 300 L climate reactors (minicosms) filled with surface sea- degree of the oligotrophy of the water (Marín-Beltrán et al., water collected at three different stations (Table 1) in the 2019; Marañon et al., 2010). Tyrrhenian Sea (TYR), Ionian Sea (ION), and in the Al- In the Mediterranean Sea, dust deposition may stimulate gerian basin (FAST). The experimental setup is described PP and N2 fixation (Guieu et al., 2014; Ridame et al., 2011, in detail in Gazeau et al. (2021a). Briefly, the experiments 2022) but also BP, bacterial respiration, virus production, and were conducted for 3 d (TYR and ION) and 4 d (FAST) in grazing activities and can alter the composition of the micro- trace-metal-free conditions, under light-, temperature-, and bial community (e.g., Pulido-Villena et al., 2014; Tsiola et pH-controlled conditions, following ambient or future pro- al., 2017; Guo et al., 2016; Pitta et al., 2017; Marín-Beltrán jected conditions of temperature and pH. For each experi- et al., 2019). Overall, in such an oligotrophic system, dust de- ment, the biogeochemical evolution of the water, after dust position appears to predominantly promote heterotrophic ac- deposition, under present and future environmental condi- tivity, which will increase respiration rates and CO2 release. tions was followed in three duplicate treatments: (i) CON- Anthropogenic CO2 emissions are projected to induce an TROL (C1 and C2) with no dust addition and under present increase in seawater temperature and an accumulation of pH and temperature conditions, (ii) DUST (D1 and D2) with CO2 in the ocean, leading to its acidification and an alteration dust addition under present environmental conditions, and of ocean carbonate chemistry (IPCC, 2014). In response to (iii) GREENHOUSE (G1 and G2) with dust addition un- ocean warming and increased stratification, low-nutrient– der projected temperature and pH for 2100 (IPCC, 2014; low-chlorophyll (LNLC) regions, such as the Mediterranean ca. +3 ◦ C and −0.3 pH units). Water was acidified by ad- Sea, are projected to expand in the future (Durrieu de Madron dition of CO2 -saturated 0.2 µm filtered seawater and slowly et al., 2011). Moreover, dust deposition is also expected to in- warmed overnight (Gazeau et al., 2021a). The same dust ana- crease due to desertification (Moulin and Chiapello, 2006). log was used as during the DUNE 2009 experiments, as de- For these reasons, in the future ocean, the microbial food scribed in Desboeufs et al. (2014), and the same dust wet web might become even more dependent on the atmospheric flux of 10 g m−2 was simulated (as described in Gazeau et deposition of nutrients. Expected increased temperature and al., 2021a). Briefly, the dust was derived from the < 20 µm acidification might have complex effects on the microbial fraction of soil collected in southern Tunisia (a major source loop by modifying the microbial and viral and community for material transported and deposited in the northwest- (e.g., Highfield et al., 2017; Krause et al., 2012; Hu et al., ern Mediterranean), with most particles (99 %) smaller than 2021; Allen et al., 2020; Malits et al., 2021). While increas- 0.1 µm (Desboeufs et al., 2014). The collected material un- ing temperature in combination with nutrient input might en- derwent an artificial chemical aging process by the addi- hance heterotrophic bacterial growth (Degerman et al., 2012; tion of nitric and sulfuric acid (HNO3 and H2 SO4 , respec- Morán et al., 2020) more than PP (Marañón et al., 2018), tively) to mimic cloud processes during atmospheric trans- future environmental conditions could push this microbial port of aerosol with anthropogenic acid gases (Guieu et al., community even further towards heterotrophy. But, so far, 2010, and references therein). To mimic a realistic wet flux the role of dust on the microbial food web in future climate event for the Mediterranean of 10 g m−2 , 3.6 g of this analog scenarios is unknown. dust were quickly diluted in 2 L ultrahigh purity water and Here, we studied the response of Mediterranean micro- sprayed at the surface of the dust amended treatments (D1 bial and viral communities (i.e., viral strategies, microbial and D2; G1 and G2; Gazeau et al., 2021a). Such a deposition growth, and controls, as well as community composition) event represents a high but realistic scenario, as several stud- to simulated wet Saharan dust deposition during on-board ies reported even higher short wet deposition events in this minicosm experiments conducted in three different basins of area of the Mediterranean Sea (Ternon et al., 2010; Bonnet the western and central Mediterranean Sea under present and and Guieu, 2006; Loÿe-Pilot and Martin, 1996), suggesting Biogeosciences, 19, 1303–1319, 2022 https://doi.org/10.5194/bg-19-1303-2022
J. Dinasquet et al.: Impact of dust addition on the microbial food web                                                        1305

that wet deposition is the main pathway of dust input in the        free water was obtained by filtering 1 L of seawater through
western Mediterranean Sea.                                          a 30 kDa pore size cartridge (Vivaflow 200©; PES). In total,
   Samples for all parameters (except described below) were         six mixtures of HB concentrate (2 mL) diluted in virus-free
taken at t12h (while filling the tanks), t0 (just before dust       water (23 mL) were prepared and distributed into 50 mL Fal-
addition), t1h, t6h, t12h, t24h, t48h, t72h, and t96h (after dust   con tubes. Then, three of the tubes were incubated as con-
addition and t96h only for FAST).                                   trols, while the other three were inoculated with mitomycin
                                                                    C (Sigma-Aldrich; 1 µg mL−1 final concentration) as an in-
2.2   Growth rates, mortality, and top-down controls                ducing agent of the lytic cycle in lysogenic bacteria. All tubes
                                                                    were incubated in darkness in two temperature-controlled in-
BP was estimated at all sampling points from rates of 3 H-          cubators maintained, respectively, at an ambient temperature
leucine incorporation (Kirchman et al., 1985; Smith and             for C1, C2, D1, and D2 and at an ambient temperature +3 ◦ C
Azam, 1992), as described in Gazeau et al. (2021b). Briefly,        for G1 and G2. Samples for HB and viral abundances were
triplicate 1.5 mL samples and one blank were incubated in           collected every 6 h for a total incubation period of 18 h.
the dark for 1–2 h after the addition of 20 nM of a mix of             The estimation of virus-mediated mortality of HB was per-
cold and 3 H-leucine in two temperature-controlled incuba-          formed according to Weinbauer et al. (2002) and Winter et
tors maintained, respectively, at ambient temperature for C1,       al. (2004). Briefly, an increase in virus abundance in the con-
C2, D1, and D2 and at ambient temperature +3 ◦ C for G1             trol tubes represents lytic viral production (VPL), and an in-
and G2. Heterotrophic prokaryotes (HB) and heterotrophic            crease in treatments with mitomycin C represents total viral
nanoflagellate (HNF) abundances were measured by flow               production (VPT), i.e., lytic plus lysogenic viral production.
cytometry, as described in Gazeau et al. (2021a). Briefly,          The difference between VPT and VPL represents lysogenic
samples (4.5 mL) were fixed with glutaraldehyde grade I             production (VPLG). The frequency of lytically infected cells
(1 % final concentration) and stored at −80 ◦ C until analy-        (FLIC) and the frequency of lysogenic cells (FLC) was cal-
sis. Counts were performed on a FACSCanto II flow cytome-           culated as follows:
ter (Becton, Dickinson, and Company). Cells were stained
with SYBR Green I at 0.025 % (vol / vol) final concentration        FLIC = 100 × VPL/BS × HBi                                   (1)
(Gasol and DelGiorgio, 2000; Christaki et al., 2011). Bacte-        FLC = 100 × VPLG/BS × HBi ,                                 (2)
rial biomass specific growth rates (BBGRs) were estimated           where HBi is the initial HB abundance in the viral production
following Kirchman (2002), BP/bacterial biomass, assuming           experiment, and BS is a theoretical burst size of 20 viruses
a carbon-to-cell ratio of 20 fg C per cell (Lee and Fuhrman,        per infected cell (averaged BS in marine oligotrophic waters;
1987). Mortality was estimated as being the difference be-          Parada et al., 2006).
tween HB present between two successive sampling points
and those produced during that time.                                2.4   DNA sampling, sequencing, and sequence analysis

2.3   Viral abundance, production, and life strategy                To study the temporal dynamics of the microbial diversity,
                                                                    water samples (3 L) were collected in acid-washed contain-
Virus abundances were determined on glutaraldehyde fixed            ers from each minicosm at t0, t24h, and at the end of the
samples (0.5 % final concentration; grade II; Sigma-Aldrich,        experiments (t72h at TYR and ION and t96h at FAST).
St Louis, MO, USA) stored at −80 ◦ C until analysis. Flow           Samples were filtered onto 0.2 µm PES filters (Sterivex©)
cytometry analysis was performed as described by Brus-              and stored at −80 ◦ C until DNA extraction. Nucleic acids
saard (2004). Briefly, samples were thawed at 37 ◦ C, diluted       were extracted from the filters using a phenol–chloroform
in 0.2 µm filtered autoclaved TE buffer (10 : 1 Tris-EDTA;          method, and DNA was then purified using filter columns
pH 8) and stained with SYBR Green I (0.5 × 10⁻⁴ of the              from NucleoSpin® Plant II kit (Macherey-Nagel GmbH &
commercial stock; Life Technologies, Saint Aubin, France)           Co. KG ) following a modified protocol. DNA extracts were
for 10 min at 80 ◦ C. Virus particles were discriminated based      quantified and normalized at 5 ng µL−1 and used as templates
on their green fluorescence and suspended sediment concen-          for the polymerase chain reaction (PCR) amplification of the
tration (SSC) during 1 min analyses (Fig. S1). All cytogram         V4 region of the 18S rRNA (∼ 380 bp), using the primers
analyses were performed with the Flowing Software free-             TAReuk454FWD1 and TAReukREV3 (Stoeck et al., 2010),
ware (Turku Center for Biotechnology, Finland).                     and the V4–V5 region of the 16S rRNA (∼ 411 bp), using the
   Viral production and bacterial losses due to phages were         primers 515F-Y (50 -GTGYCAGCMGCCGCGGTAA) and
assessed by the virus reduction approach (Weinbauer et al.,         926R-R (50 -CCGYCAATTYMTTTRAGTTT; Parada et al.,
2010) at t0 and t24h in all six minicosms. Briefly, 3 L of          2016). Following PCRs, DNA amplicons were purified,
seawater were filtered through a 1.2 µm pore size polycar-          quantified and sent to Genotoul (Toulouse, France) for high
bonate filter (Whatman©), and HB (filtrate) were concen-            throughput sequencing using paired-end 2 × 250 bp Illumina
trated by ultrafiltration (0.22 µm pore size; Vivaflow 200©         MiSeq. Note that although we used universal primer, archaea
polyethersulfone – PES) down to a volume of 50 mL. Virus-           were mostly not detected, and the prokaryotic heterotrophic

https://doi.org/10.5194/bg-19-1303-2022                                                    Biogeosciences, 19, 1303–1319, 2022
1306 J. Dinasquet et al.: Impact of dust addition on the microbial food web
Table 1. Initial conditions (t12h) at the three stations sampled for the dust addition experiments. Other parameters are presented in more
detail in Gazeau et al. (2021a, b).
Variables TYR ION FAST
Location Tyrrhenian basin Ionian basin Algerian basin
Coordinates 39.34◦ N, 12.60◦ E 35.49◦ N, 19.78◦ E 37.95◦ N,2.90◦ E
Temperatures (◦ C) 20.6 21.2 21.5
DOC (µM)2 72.2 70.2 69.6
Chlorophyll a (µg L−1 )1 0.063 0.066 0.072
BP (ng C L−1 h−1 )2 11.6 15.1 34.6
Bacterial abundance (×105 cells per mL−1 )1 4.79 2.14 6.15
BBGR (d−1 ) 0.03 0.08 0.07
Viral abundance (×106 VLP mL−1 ) 3.01 1.44 2.79
Percent lysogenic bacteria FLC 22.7 19.4 7.8
Percent lytic bacteria FLIC 17.5 37.2 42.7
Viral production (×104 VLP mL−1 h−1 ) 2.05 1.36 7.99
HNF abundance (cells per mL−1 )1 110 53 126
Diatoms (cells per L−1 )1 340 900 1460
Dinoflagellates (cells per L−1 )1 2770 3000 3410
Ciliates (cells per L−1 )1 270 380 770
DOC – dissolved organic carbon; BP – heterotrophic prokaryotic production; BBGR – bacterial-biomass-specific growth rate; HNF –
heterotrophic nanoflagellate. 1 Results presented in Gazeau et al. (2021a). 2 Results presented in Gazeau et al. (2021b).
communities corresponded essentially to eubacteria; there- formed with R software (R Core Team, 2020), using the nlme
fore, the taxonomic description referred to the general term package (Pinheiro et al., 2014) to test if the amended treat-
bacterial communities. ments differed from the controls at t24h and t72h or t96h.
All reads were processed using the Quantitative Insight
Into Microbial Ecology 2 pipeline (QIIME 2 v2020.2;
Bolyen et al., 2019). Reads were truncated at 350 bp based on 3 Results
sequencing quality, denoised, merged, and chimera checked
using DADA2 software (Callahan et al., 2016). A total of 714 3.1 Microbial growth, mortality, and top-down controls
and 3070 amplicon sequence variants (ASVs) were obtained
Nutrients inputs were observed with dust addition (Fig. S2);
for 16S and 18S, respectively. Taxonomy assignments were
in response, the autotrophic and heterotrophic microbial
made against the database SILVA 132 (Quast et al., 2013) for
abundances and BP increased (Fig. S3), as described in more
16S and PR2 (Guillou et al., 2013) for 18S. All sequences as-
detail in Gazeau et al. (2021a, b). Already in the 24 h follow-
sociated with this study have been deposited under the Bio-
ing the dust addition, significant increases in heterotrophic
Project ID no. PRJNA693966.
bacterial biomass specific growth rates (BBGRs; p ≤ 0.016
at t24h) were observed in all experiments with dust under
2.5 Statistics D and G, as seen in Figs. 1 (showing data normalized to C)
and S4. The highest growth rates were already observed 24 h
Alpha and beta diversity indices for community composi- after dust seeding (up to 2.9 d−1 in G2 at FAST; Table S1;
tion were estimated after randomized subsampling to 26 000 Fig. S4). At 24 h, in both D and G, the heterotrophic bacte-
reads for 16S rDNA and 19 000 reads for 18S rDNA. Anal- rial mortality rates were higher than in C (Fig. 1), especially
yses were run in QIIME 2 and in the Primer v.6 software at TYR in D (up to 0.5 d−1 ) and in G at ION (up to 0.6 d−1 )
package (Clarke and Warwick, 2001). Differences between and FAST (up to 0.7 d−1 ; Table S1). Over the course of the
the samples’ richness and diversity were assessed using three experiments, the slope of the linear regression between
Kruskal–Wallis pairwise test. Beta diversity was run on the log bacterial biomass and log bacterial production was below
Bray–Curtis dissimilarity. Differences between the samples’ 0.4 in the three treatments, suggesting a weak bottom-up con-
beta diversity were tested using PERMANOVA (permuta- trol (Fig. 2a; Ducklow, 1992). The slope decreased in D and
tional multivariate analysis of variance) with a pairwise test G relative to C. Overall, the top-down index, as described
and 999 permutations. The sequences contributing most to by Morán et al. (2017), was higher in G (0.92) relative to
the dissimilarity between clusters were identified using SIM- C and D (0.80). The relationship between log-transformed
PER (similarity percentage). A linear mixed model was per- HNF and log bacterial abundance (Fig. 3b), plotted according
Biogeosciences, 19, 1303–1319, 2022 https://doi.org/10.5194/bg-19-1303-2022J. Dinasquet et al.: Impact of dust addition on the microbial food web 1307
to the model in Gasol (1994), showed that HNF were below 3.3 Microbial community composition
the MRA (mean realized HNF abundance) in all treatments,
suggesting a top-down control of HNF abundance. HNF and Microbial community structure, bacteria, and microeukary-
bacteria were weakly coupled in all treatments. The rela- otes from 16S rDNA and 18S rDNA sequencing, respec-
tionship between total viruses and bacterial abundance was tively, responded to dust addition in all three experiments
weaker in D and G relative to C (Fig. S5). relative to C (Figs. 5 and 6). After quality controls, reads
were assigned to 714 and 1443 ASVs for 16S and 18S, re-
3.2 Viral dynamics and processes spectively.
The initial abundance and production of virus-like particles 3.3.1 Bacterial community composition
(VLPs) was higher in the western stations (Table 1). Vi-
ral strategy (lysogenic vs. lytic replication) was also differ- The initial community composition (t12h) was significantly
ent between stations, with a higher frequency of lysogenic different at the three stations (PERMANOVA; p = 0.001;
cells (FLC) at TYR and ION (23 % and 19 %, respectively; Figs. S6a, S7). Rapid and significant changes in the bacte-
Table 1) and a higher frequency of lytically infected cells rial community composition were already observed 24 h af-
(FLIC) at FAST (43 %, Table 1). ter dust addition (Fig. 5). Despite the initial different com-
During TYR and ION experiments, the relative contribu- munities, the three stations appeared to converge towards
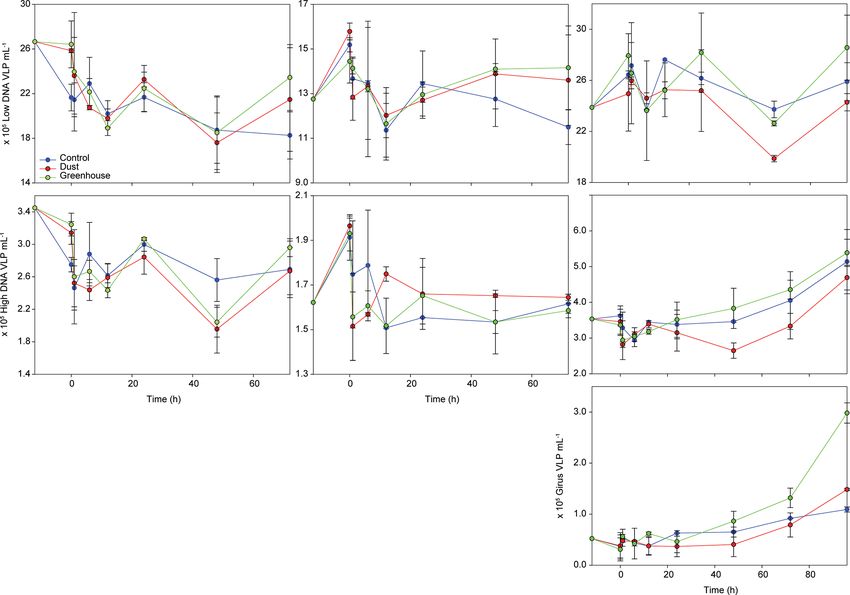
tion of VLP populations was similar and stable over time, a closer community composition in response to dust addi-
with low DNA viruses representing over 80 % of the com- tion (Fig. S7). At TYR, communities in D and G signif-
munity (Figs. 3 and S5). The low DNA VLP abundance was, icantly changed 24 h after dust addition (PERMANOVA;
however, slightly higher in D and G relative to C after 24 h at p = 0.001). This cluster presented no significant differences
TYR and significantly higher at ION after 48 h (p = 0.037; between treatments (D and G) or time (24 and 72 h). The
Fig. 4). In contrast to the other two stations, at FAST, giruses differences between C and D/G were attributed to a rela-
(giant viruses, characterized by high DNA fluorescence and tive increase in ASVs related to different Alteromonas sp.,
high SSC) were also present and increased in all treatments OM60, and Pseudophaeobacter sp. and Erythrobacter sp.,
but especially in G, where they made up to 9 % of the viral and the contribution of ASVs related to SAR11 and Ver-
community at the end of the experiment (Figs. 3 and 4). The rucomicrobia and Synechococcus decreased (Table S2a).
abundance of high DNA viruses at FAST also increased in- At ION, the bacterial community composition significantly
dependently of the treatments and accounted for 16 %–18 % changed 24 h after dust addition (PERMANOVA; p = 0.001)
of the community at the end of the experiment (Figs. 3 and and was significantly different between D and G (PER-
4). MANOVA; p = 0.032). As observed at TYR, no further
The sampling strategy for the production and life strate- change occurred between 24 h and the end of the experiment
gies of HB viruses allowed us to independently discriminate (72 h; Fig. 5). The difference between the controls and dust-
the effect of (i) greenhouse conditions (sampling at t0 before amended minicosms were assigned to an increase in ASVs
dust addition), (ii) dust addition (sampling at t24h), and the related to different Alteromonas sp., Erythrobacter sp., Dok-
combined effects of dust addition and greenhouse. Lytic viral donia sp., and OM60 and a decrease in ASVs related to
production (VPL) increased significantly at t0 in G at TYR SAR11, Synechococcus, Verrucomicrobia, Rhodospirillales,
and ION compared to C (p ≤ 0.036). The addition of dust in- and some Flavobacteria (Table S2b). Several ASVs related
duced higher VPL in D at TYR (normalized to C; Fig. 1). No to Alteromonas sp., Synechococcus sp., and Erythrobacter
significant impact of dust on VPL was observed in G com- sp. were further enriched in G compared to D, while Dok-
pared to D after 24 h for any of the experiments. Changes in donia sp. was mainly present in D. At FAST, the bacterial
the viral infection strategy were observed with G conditions community, after 24 h, only significantly changed in G (PER-
at t0, where FLC decreased relative to the non-G treatments MANOVA; p = 0.011; Fig. 5). However, after 96 h, the com-
at TYR and ION and especially at FAST (Fig. 1; p = 0.047). munity in D and G were similar and appeared to transition
FLIC increased slightly in G at TYR and ION already at back to the initial state at 96 h (PERMANOVA; p = 0.077).
t0. Dust addition had no detectable significant effect on this The higher relative abundance in Erythrobacter sp., Syne-
parameter for any experiment. Looking at the relative share chococcus sp., different ASVs related to Alteromonas sp.,
between lytic and lysogenic infection, dust addition favored and Flavobacteria appeared to contribute mainly to the dif-
lytic infection at TYR (no lysogenic bacteria were observed ference between C and D/G (Table S2), while ASVs related
after 24 h), but the contribution of both infection strategies re- to SAR11, Verrucomicrobia, Celeribacter sp., Thalassobius
mained unchanged compared to C at ION and FAST. Green- sp., and Rhodospirillales were mainly present in C (Table
house conditions also favored replication through lytic cycle S2c).
already at t0 for all three experiments, and this trend was not
impacted by dust addition.
https://doi.org/10.5194/bg-19-1303-2022 Biogeosciences, 19, 1303–1319, 20221308 J. Dinasquet et al.: Impact of dust addition on the microbial food web Figure 1. Bacterial and viral parameters in the three experiments (TYR, ION, and FAST) in each minicosm (D1, D2, G1, and G2). The values are normalized to the controls, and the data are presented as the difference between the treatments and the mean value of the duplicate controls. The first row represents the bacterial biomass specific growth rates (BBGRs) and relative mortality rates at t24h after dust addition. The second raw represents the relative viral productions at t24h and at t0 for the G treatments. The last row represents the viral strategies, with the percentages of lytic (FLIC) or lysogenic (FLC) cells at t24h and at t0 for the G treatments. Figure 2. (a) Log–log linear regression between bacterial biomass and bacterial production. Dotted lines represent the linear regressions for each treatment. (b) Relationships between log HNF abundance and log bacterial prey abundance. Solid black and dotted black lines correspond to the mean realized HNF abundance (MRA) and theoretical maximum attainable HNF abundance line (MAA), respectively. The samples are grouped per treatment. Biogeosciences, 19, 1303–1319, 2022 https://doi.org/10.5194/bg-19-1303-2022
J. Dinasquet et al.: Impact of dust addition on the microbial food web                                                                  1309

Figure 3. Relative abundance of viral populations at the initial (in situ at t12h before dust addition) and final time points in all minicosms
(C1, C2, D1, D2, G1, and G2) during the three experiments (TYR, ION, and FAST).

Figure 4. Evolution of virus-like particle (VLP) abundances of three different viral populations over the course of the three experiments
(TYR, ION, and FAST). The first row represents low DNA viruses or phages, the second row represents high DNA viruses, and the third row
represents giant viruses (giruses).

https://doi.org/10.5194/bg-19-1303-2022                                                           Biogeosciences, 19, 1303–1319, 2022
1310                                                         J. Dinasquet et al.: Impact of dust addition on the microbial food web

Figure 5. Non-metric dimensional scaling (NMDS) plot of bacterial         Figure 6. NMDS plot of the microeukaryotes community composi-
community composition over the course of the three experiments            tion over the course of the three experiments based on Bray–Curtis
based on Bray–Curtis dissimilarities of 16S rDNA sequences. Sam-          dissimilarities of 18S rDNA sequences. Samples clustering at dif-
ples clustering at different levels of similarity are circled together.   ferent levels of similarity are circled together. All circles represent
All circles represent clusters which are significantly different from     clusters which are significantly different (p
J. Dinasquet et al.: Impact of dust addition on the microbial food web                                                      1311

3.3.2   Nano- and microeukaryotes community                       concentrations at the three stations (Gazeau et al., 2021a), PP
        composition                                               was higher at FAST (Table 1; Gazeau et al., 2021b; Marañón
                                                                  et al., 2021). The initial microbial communities differed sub-
The diversity of the initial community was large (Fig. S7) and    stantially between the three stations, as shown by the pig-
significantly different at the three stations (PERMANOVA;         ments (Gazeau et al., 2021a) from the 18S and 16S rDNA
p = 0.001; Fig. S6b). At TYR, the nano- and microeukary-          sequencing (this study). DOC concentrations were slightly
otes community responded rapidly (24 h) to the dust addi-         higher at TYR, where PP was the lowest (Gazeau et al.,
tion (PERMANOVA; p = 0.003). This initial high diversity          2021b). HB, HNF abundances (Gazeau et al., 2021a), and
disappeared after 72 h, with similar communities in all mini-     viral abundance and production increased following the east-
cosms (Fig. S7). They were significantly different from ini-      to-west gradient of the initial water conditions.
tial and t24h communities (p = 0.002 and 0.03, respectively;         The dust addition induced a similar nitrate + nitrite (NOx )
Fig. 6) in D/G. The variations at t24h were attributed to         and dissolved inorganic phosphate (DIP) release during all
changes in the dinoflagellate communities and, in particu-        three experiments. Rapid changes were observed on plank-
lar, to an increase in ASVs related to Heterocapsa rotundata,     ton stocks (autotroph and heterotroph abundances and chl a;
Gymnodiniales and Gonyaulacales, as well as to an increase        Gazeau et al., 2021a) and metabolisms (BP and PP; Gazeau
in Chlorophyta (Table S3a). At ION, no significant changes        et al., 2021b), suggesting that the impact of dust deposition is
were observed between C and D/G after 24 h. However, af-          constrained by the initial composition and metabolic state of
ter 72 h, the communities were significantly different in D       the investigated community. While no direct effect of warm-
(p = 0.018) and G (p = 0.05) compared to the communities          ing and acidification was observed on the amount of nutrient
at t24h in these treatments (Table S3b). In D, diversity was      released from dust, Gazeau et al. (2021a, b) showed that bi-
significantly higher at t72 h compared to t24 h and to C at       ological processes were generally enhanced by these condi-
the same sampling time (p = 0.036). In contrast, diversity in     tions and suggested that deposition may weaken the biolog-
G at t72h was lower than at t24h and lower to the one ob-         ical pump in future climate conditions. Here we are further
served in C at the same sampling time (p = 0.066; Fig. S8).       investigating how the dust addition in present and future con-
These differences were mainly attributed to changes in ASVs       ditions affected, on a short-term scale (≤ 4 d), the microbial
related to dinoflagellates and to the increase at t72h in Emil-   trophic interactions and community composition.
iania huxleyi and Chlorophyta in D and G, respectively (Ta-
ble S3b). At FAST, significant differences were observed be-      4.1   Trophic interactions after dust addition under
tween the controls and initial communities compared to the              present and future conditions
dust-amended (D and G) treatments at t24h (p = 0.036). No
major differences were observed between D/G at t24h and           Parallel nutrient enrichment incubations conducted in dark-
t96h (p = 0.06). The differences were mainly attributed to        ness showed that in situ heterotrophic bacterioplankton com-
changes in dinoflagellates ASVs and to an increase in Acan-       munities (initial conditions of the present experiments) were
tharea and Emiliania huxleyi in D and G treatments at t96h        N, P co-limited at TYR, mainly P limited at ION, and N lim-
(Table S3c).                                                      ited at FAST (Van Wambeke et al., 2021). However, after
                                                                  incubation, the HB appeared to be weakly bottom-up con-
                                                                  trolled (Ducklow, 1992) especially in D and G (Fig. 2a) af-
4   Discussion                                                    ter the dust addition. Such a top-down control on the bac-
                                                                  terioplankton has been previously observed in the Mediter-
Pulsed inputs of essential nutrients and trace metals through     ranean Sea, where the bacterioplankton community lives in
aerosol deposition are crucial to surface microbial commu-        a dynamic equilibrium between grazing pressure and nutri-
nities in LNLC regions such as the Mediterranean Sea (re-         ents limitation (as reviewed by Siokou-Frangou et al., 2010).
viewed in Guieu and Ridame, 2020). Here we assessed the           Moreover, a potential increase under future conditions, as
impact of dust deposition on the late spring microbial loop       suggested by the higher top-down index in G (G = 0.92 vs.
under present and future environmental conditions on the sur-     C/D = 0.80; Morán et al., 2017), should be further assessed.
face water of three different Mediterranean basins (Tyrrhe-          Bacterial mortality increased relative to controls in D and
nian – TYR; Ionian – ION; and Algerian – FAST). The               G at TYR and only in G at ION and FAST. The weak cou-
initial conditions at the three sampled stations for the on-      pling between bacteria and viruses, as well as the increased
board experiments are described in more detail in Gazeau          virus production and relative abundance of lytic cells (see
et al. (2021a). Briefly, very low levels of dissolved inor-       below), only explained a small fraction of the estimated bac-
ganic nutrients were measured at all three stations, highlight-   terial mortality (max. 17 %), suggesting an additional graz-
ing the oligotrophic status of the waters. This is typical of     ing pressure on bacteria. Nanoflagellates bacterivory can ac-
the stratified conditions generally observed in the Mediter-      count for up to 87 % of bacterial production in the Mediter-
ranean Sea in late spring/early summer (e.g., Bosc et al.,        ranean Sea; however, the rates can be variable in space and
2004; D’Ortenzio et al., 2005). Despite similar total chl a       time (Siokou-Frangou et al., 2010). Here, HNF abundances

https://doi.org/10.5194/bg-19-1303-2022                                                  Biogeosciences, 19, 1303–1319, 2022
1312 J. Dinasquet et al.: Impact of dust addition on the microbial food web
increased in D at TYR and at all stations in G (Gazeau et al., and G at TYR and only in G at ION and FAST. Regarding
2021a), which could explain the increased bacterial mortal- the G treatments, an increase in the viral production was de-
ity. An increased grazing rate by HNF on bacteria with a dust tected before the dust addition for all three experiments and
addition has been previously reported in the eastern Mediter- remained mostly unchanged for the remainder of the incu-
ranean Sea (Tsiola et al., 2017). While our results suggest a bation. This suggests that water warming and acidification
strong grazing pressure on bacteria, no direct coupling be- were responsible for most changes in viral activities, while
tween HNF and bacteria was observed, probably because the dust had no detectable impact in such conditions, regardless
HNF appeared to be top-down controlled themselves (Gasol, of the studied station. Based on our results, the most likely
1994, Fig. 3b), potentially by the increasing populations of explanation for the observed changes in viral production is
mixotrophic dinoflagellates and/or giruses (see below). This an activation of a lysogenic to lytic switch. The factors that
suggests an intensification of trophic cascades in the mi- result in prophage induction are still not well constrained,
crobial loop with nutrient input. It is also possible that HB but nutrient pulses and elevated temperatures have been iden-
were grazed by mixotrophic nanoflagellates or by larger pro- tified as potential stressors (Danovaro et al., 2011 and ref-
tozoans or that the HNF abundance was underestimated by erences therein). Consistent with the observation of N and
flow cytometry. Towards the end of the experiment, bacte- P co-limited bacterial community at TYR, it is likely that
rial growth and mortality may also have been linked to DIP nutrients released from dust upon deposition to surface wa-
depletion at TYR and ION. ter activate the productive cycle of temperate viruses at this
Considering the seasonal impact of grazing and the vi- station. Such a mechanism was also speculated during an-
ral mortality in the Mediterranean Sea, where higher graz- other dust addition study (Pulido-Villena et al., 2014). Under
ing pressure and lysogeny were observed in the stratified future conditions (G), the low proportion of lysogens was
nutrient-limited waters in summer (Sánchez et al., 2020), it associated to a higher frequency of lytically infected cells
will be important to further study the seasonal impact of dust relative to C and D at TYR and ION. These trends prob-
deposition on trophic interactions and indirect cascading im- ably reflect an indirect effect of enhanced bacterial growth
pact on microbial dynamics and community composition. with increased temperature, not only on prophage induction
(Danovaro et al., 2011; Vaqué et al., 2019; Mojica and Brus-
4.2 Viral processes and community during dust saard, 2014) but also on the kinetics of lytic infections. In-
enrichment in present and future conditions triguingly, the enhanced viral production did not translate
into marked changes in the viral abundance. The abundance
Viruses represent pivotal components of the marine food of a low DNA virus population, which typically comprises
web, influencing genome evolution, community dynamics, the viruses of bacteria, actually decreased between t0 and
and ecosystem biogeochemistry (Suttle, 2007). The impacts t48h pointing to a possible viral decay, potentially related to
of marine viruses differ, depending on whether they estab- an adsorption onto dust particles (Weinbauer et al., 2009; Ya-
lish lytic or lysogenic infections (Zimmerman et al., 2019; mada et al., 2020) and the potential export of viral particle to
Howard-Varona et al., 2017). Understanding how viral infec- deeper water layers (Van Wambeke et al., 2021). While recur-
tion processes are influenced by changes in environmental rent patterns emerged from this study, the amplitude of viral
conditions is, thus, crucial to better constraining the micro- responses varied between the experiments. At TYR, where
bial mortality and cascading effects on marine ecosystems. heterotrophic metabolism was higher, the dust addition in-
Aerosol deposition was already identified as a factor that duced a higher viral production relative to controls than at
stimulates virus production and the viral-induced mortality the two other sites, which suggests that viral processes, as
of bacteria in the Mediterranean Sea (Pulido-Villena et al., with other microbial processes, are dependent on the initial
2014; Tsiola et al., 2017), and the direct deposition of air- metabolic status of the water.
borne viruses and viruses attached to dust particles may also Overall, no marked changes were observed for viral com-
affect microbial food webs (Sharoni et al., 2015; Rahav et munities and abundances after dust addition under both
al., 2020). However, the impact of future environmental con- present and future conditions relative to controls, except
ditions remains more controversial (Larsen et al., 2008; Brus- at FAST, where the abundance of the girus population in-
saard et al., 2013; Maat et al., 2014; Vaqué et al., 2019; Mal- creased significantly in G from t24h until the end of the ex-
its et al., 2021). The combined effect of aerosol deposition periment. Giruses typically comprise large double-stranded
and the future conditions of temperature and pH on the viral DNA viruses that infect nanoeukaryotes, including photo-
compartment has, to our knowledge, never been investigated. synthetic (microalgae) and heterotrophic (HNF, amoeba, and
The rapid changes in viral production and lifestyle ob- choanoflagellate) organisms (Brussaard and Martinez, 2008;
served in all three experiments support the idea that the viral Needham et al., 2019; Fischer et al., 2010; Martínez et al.,
component is sensitive to the environmental variability, even 2014). The presence of giruses at FAST in this treatment
on short (hourly) timescales. The dynamics in viral activities might be explained by the increase in nano-eukaryote abun-
were, however, impacted differently, depending on the treat- dances at t72h and their decline after 96 h of incubation
ments and the experiments. Viral production increased in D (Gazeau et al., 2021a). The coccolithophore Emiliania hux-
Biogeosciences, 19, 1303–1319, 2022 https://doi.org/10.5194/bg-19-1303-2022J. Dinasquet et al.: Impact of dust addition on the microbial food web 1313
leyi appears as one of the potential host candidates for these The delayed response of microeukaryotes after 72 h, com-
giruses. The abundance of E. huxleyi increased in D and G pared to the quick bacterial response at 24 h, suggests that
at this station, and this phytoplankter is known to be in- HB were better at competing for nutrient inputs at this station
fected by such giant viruses (Jacquet et al., 2002; Schroeder and that autotrophic processes may be responding to bacte-
et al., 2002; Pagarete et al., 2011). It is not clear from our re- rial nutrient regeneration after a lag phase, further suggesting
sults whether increased girus abundance is due to the green- the tight coupling between heterotrophic bacteria and phyto-
house effect only (as discussed above for viruses of HB) or plankton at this station. The combined effect of decreased
the combination of dust addition and the greenhouse effect. pH and elevated temperature on marine microbes is not yet
While temperature warming was shown to accelerate viral well understood (reviewed in O’Brien et al., 2016). The ab-
production in several virus–phytoplankton systems (Mojica sence of significant community changes at TYR and FAST,
and Brussaard, 2014; Demory et al., 2017), a temperature- while changes were observed at ION, suggests that the re-
induced resistance to viral infection was specifically ob- sponse might be dependent on other environmental factors
served in E. huxleyi (Kendrick et al., 2014). Previous experi- which need to be further studied.
ments have also reported a negative impact of acidification on Dust addition likely favors certain group of mi-
E. huxleyi virus dynamics (Larsen et al., 2008). By contrast, croorganisms, suggesting a quicker response of fast-
the nutrient release following dust seeding could indirectly growing/copiotrophic groups and the increase in specialized
stimulate E. huxleyi virus production (Bratbak et al., 1993) or functional groups (Guo et al., 2016; Westrich et al., 2016;
induce switching between the non-lethal temperate to lethal Maki et al., 2016). The potential toxicity effects of metals and
lytic stage (Knowles et al., 2020) under future conditions. biological particles released from dust/aerosols on certain
Targeted analyses are, of course, required to identify the vi- microorganisms have also been reported (Paytan et al., 2009;
ral populations selected in G and the outcomes of their infec- Rahav et al., 2020). Here, the microeukaryotic community
tion. Nonetheless, this is the first time, to our knowledge, that was dominated by a diverse group of dinoflagellates which
dust deposition and enhanced temperature and acidification were responsible for the main variations between treatments
have been shown to induce the proliferation of giruses. The at all stations. The overwhelming abundance of dinoflagel-
impact of dust deposition under future environmental condi- lates sequences over other microeukaryotes could be biased
tions on the viral infections processes could have significant by the large genomes and multiple ribosomal gene copies per
consequences for microbial evolution, food web processes, genome found in dinoflagellates (Zhu et al., 2005) or due to
biogeochemical cycles, and carbon sequestration. their preferential amplification. However, the dominance of
dinoflagellates in surface water at this time of the year in the
4.3 Microbial community dynamic after dust addition Mediterranean Sea is not uncommon (García-Gómez et al.,
under present and future conditions 2020) and was also observed in surface waters of the three
sampled stations by the Imaging Flow Cytobot (Marañón et
While changes in bacterial community composition during al., 2021). While pigment data suggest an increase in hapto-
various type of dust addition experiments have shown only phytes and pelagophytes in D (Gazeau et al., 2021a), the se-
minor transient responses (e.g., Marañon et al., 2010; Hill et quencing data only show the presence of E. huxleyi as being
al., 2010; Laghdass et al., 2011; Pulido-Villena et al., 2014; responsible for some of the community changes after dust ad-
Marín-Beltrán et al., 2019), here the microbial community dition at ION and FAST. These pigments could also indicate
structure showed quick, significant, and sustained changes in the presence of dinoflagellates through tertiary endosymbio-
response to dust addition in all three experiments. Similar sis, in particular for Karlodinium sp. (Yoon et al., 2002; Zap-
to other parameters observed during these experiments (dis- ata et al., 2012), which is an important mixotrophic dinoflag-
cussed above and in Gazeau et al., 2021a, b), the degree of ellate (Calbet et al., 2011) observed in D and G at ION and
response in terms of community composition was specific to FAST. The variations in dinoflagellate groups might have
the tested waters. important trophic impacts due to their diverse mixotrophic
At TYR, where primary production was low, only tran- states (Stoecker et al., 2017), and the effect of dust addition
sient changes after 24 h of incubation were observed before on mixotrophic interactions should be further studied to bet-
the microeukaryotes community converged back close to ini- ter understand the cascading impact of dust on food webs and
tial conditions. In contrast, the bacterial community signifi- the biological pump.
cantly and rapidly changed after 24 h and remained different Positive to toxic impacts on cyanobacteria have been re-
after 72 h. At FAST, where the addition of dust appeared to ported from atmospheric deposition experiments (e.g., Pay-
promote autotrophic processes, the microeukaryotes commu- tan et al., 2009; Zhou et al., 2021, Rahav et al., 2020). Here,
nity responded quickly in the 24 h after dust addition, while Synechococcus appeared to be inhibited at TYR, while it was
minor and delayed changes, probably related to the lower enhanced at ION and FAST, especially under future condi-
growth rates compared to the other tested waters, were ob- tions (this study; Gazeau et al., 2021a). The same ASVs ap-
served in the bacterial community. At ION, both eukaryotes peared to be inhibited at TYR and ION, while being pro-
and the bacterial community responded to the dust addition. moted at FAST, and different ASVs increased at ION. Syne-
https://doi.org/10.5194/bg-19-1303-2022 Biogeosciences, 19, 1303–1319, 20221314 J. Dinasquet et al.: Impact of dust addition on the microbial food web
chococcus has recently been shown to be stimulated by wet lysogeny. The composition of the mixotrophic microeukary-
aerosol addition in P-limited conditions but inhibited in N- otes and phototrophic prokaryotes was also altered.
limited conditions in the South China Sea (Zhou et al., 2021). Overall, the impact of such a simulated pulsed nutrient
It was also shown to be repressed by dust addition in the deposition will depend on the initial biogeochemical condi-
nutrient-limited tropical Atlantic (Marañon et al., 2010). This tions of the ecosystem, likely with a possible large impact
suggests that different Synechococcus ecotypes (Sohm et al., on microbial trophic interactions, particularly viral processes
2016) might respond differently to dust addition, depending and community structure. All effects might be generally en-
on the initial biogeochemical conditions of the water. hanced in future climate scenarios. The impact of dust depo-
In the three experiments, the main bacterial ASVs re- sition on metabolic processes and the consequences for the
sponsible for the differences between the control and treat- carbon and nitrogen cycles and the biological pump based on
ments were closely related to different Alteromonas strains. these minicosm experiments are further discussed in Gazeau
Alteromonas are ubiquitous in the marine environment and et al. (2021b) and Ridame et al. (2022), and the in situ effect
can respond rapidly to nutrient pulses (López-Pérez and of a wet dust deposition event is explored in Van Wambeke
Rodriguez-Valera, 2014). Some Alteromonas are capable of et al. (2021) in this special issue.
growing on a wide range of carbon compounds (Pedler et
al., 2014). They can produce iron-binding ligands (Hogle
et al., 2016) to rapidly assimilate Fe released from dust. Data availability. The PEACETIME dataset will be available at
Thus, they could have significant consequences for the ma- https://doi.org/10.17882/75747 (Guieu et al., 2020b) upon the pub-
rine carbon and Fe cycles during dust deposition events. lication of all papers in the special issue (2022).
Other copiotrophic Gammaproteobacteria, such as Vibrio,
have been observed to bloom after dust deposition in the
Atlantic Ocean (Westrich et al., 2016). Guo et al. (2016), Supplement. The supplement related to this article is available on-
line at: https://doi.org/10.5194/bg-19-1303-2022-supplement.
using RNA sequencing, also show that Gammaproteobacte-
ria quickly outcompete Alphaproteobacteria (mainly SAR11
and Rhodobacterales) that were initially more active. Here,
Author contributions. FG and CG designed the experiment. All au-
while SAR11 relative abundance decreased in all experi-
thors participated in the sampling or sample processes. JD analyzed
ments after 24 h, other Alphaproteobacteria related to the the data and wrote the paper, with contributions from all authors.
aerobic anoxygenic phototroph (AAP) Erythrobacter sp., in-
creased in response to dust, particularly under future con-
ditions. Other AAP, such as OM60, also responded to dust Competing interests. At least one of the (co-)authors is a member
addition in our experiment and in the eastern Mediterranean of the editorial board of Biogeosciences. The peer-review process
Sea (Guo et al., 2016). Moreover, bacteriochlorophyll a, was guided by an independent editor, and the authors also have no
a light-harvesting pigment present in AAP, was generally other competing interests to declare.
higher in dust addition treatments, especially under future
conditions compared to controls (Fig. S9). Fast-growing
AAP might quickly outcompete other HB by supplementing Disclaimer. Publisher’s note: Copernicus Publications remains
their growth with light-derived energy (e.g., Koblížek, 2015). neutral with regard to jurisdictional claims in published maps and
They have also been shown to be stimulated by higher tem- institutional affiliations.
perature (Sato-Takabe et al., 2019). AAP response to dust
and future conditions could have a significant role in marine
biogeochemical cycles. Special issue statement. This article is part of the special issue “At-
mospheric deposition in the low-nutrient–low-chlorophyll (LNLC)
ocean: effects on marine life today and in the future (ACP/BG inter-
journal SI)”. It is not associated with a conference.
5 Conclusions
Acknowledgements. We gratefully acknowledge the onboard sup-
The microbial food web response to dust addition was de- port from the captain and crew of the R/V Pourquoi Pas? and our
pendent on the initial state of the microbial community in chief scientists Cécile Guieu and Karine Desboeuf. We also thank
the tested waters. A different response in trophic interactions Kahina Djaoudi, Julia Uitz, Céline Dimier, Philippe Catala, Bar-
and community composition of the microbial food web to bara Marie, and María Perez-Lorenzo, for their assistance in the
the wet dust addition was observed at each station. Gener- sampling and analysis of pigments, microbial abundance, DOC con-
ally, greater changes were observed in future conditions. A centration, and primary production. We thank the two referees, for
pulsed input of nutrients and trace metals changed the micro- their input.
bial ecosystem from a bottom-up limited to a top-down con-
trolled bacterial community, likely from grazing and induced
Biogeosciences, 19, 1303–1319, 2022 https://doi.org/10.5194/bg-19-1303-2022J. Dinasquet et al.: Impact of dust addition on the microbial food web 1315
Financial support. This study is a contribution to the PEACE- Bosc, E., Bricaud, A., and Antoine, D.: Seasonal and interan-
TIME project (http://peacetime-project.org, last access: 26 Jan- nual variability in algal biomass and primary production in
uary 2022, https://doi.org/10.17600/17000300), a joint initiative of the Mediterranean Sea, as derived from 4 years of SeaW-
the MERMEX and ChArMEx components supported by CNRS- iFS observations, Global Biogeochem. Cy., 18, GB002034,
INSU, IFREMER, CEA, and Météo-France as part of the program https://doi.org/10.1029/2003GB002034, 2004.
MISTRALS, which is coordinated by INSU. PEACETIME was en- Bratbak, G., Egge, J. K., and Heldal, M.: Viral mortality of the ma-
dorsed as a process study by GEOTRACES and SOLAS. Part of rine alga Emiliania huxleyi (Haptophyceae) and termination of
this research has been funded by the ANR CALYPSO attributed to algal blooms, Mar. Ecol. Prog. Ser., 93, 39–48, 1993.
ACB (grant no. ANR-15-CE01-0009). Emilio Marañón has been Brussaard, C. P. and Martinez, J. M.: Algal bloom viruses, Plant
supported by the Spanish Ministry of Science, Innovation, and Uni- Viruses, 2, 1–13, 2008.
versities (grant no. PGC2018-094553B-I00). Julie Dinasquet has Brussaard, C. P. D.: Optimization of Procedures for Counting
been funded by a Marie Skłodowska-Curie Actions International Viruses by Flow Cytometry, Appl. Environ. Microb., 70, 1506–
Postdoctoral Fellowship (grant no. PIOF-GA-2013-629378). 1513, 10.1128/aem.70.3.1506-1513.2004, 2004.
Brussaard, C. P. D., Noordeloos, A. A. M., Witte, H., Collenteur,
M. C. J., Schulz, K., Ludwig, A., and Riebesell, U.: Arctic mi-
Review statement. This paper was edited by Christine Klaas and crobial community dynamics influenced by elevated CO2 lev-
reviewed by two anonymous referees. els, Biogeosciences, 10, 719–731, https://doi.org/10.5194/bg-10-
719-2013, 2013.
Calbet, A., Bertos, M., Fuentes-Grünewald, C., Alacid, E.,
Figueroa, R., Renom, B., and Garcés, E.: Intraspecific variability
in Karlodinium veneficum: growth rates, mixotrophy, and lipid
References composition, Harmful Algae, 10, 654–667, 2011.
Callahan, B. J., McMurdie, P. J., Rosen, M. J., Han, A. W., Johnson,
Allen, R., Hoffmann, L. J., Law, C. S., and Summerfield, T. C.: Sub- A. J. A., and Holmes, S. P.: DADA2: High-resolution sample
tle bacterioplankton community responses to elevated CO2 and inference from Illumina amplicon data, Nat. Methods, 13, 581–
warming in the oligotrophic South Pacific gyre, Env. Microbiol. 583, https://doi.org/10.1038/nmeth.3869, 2016.
Rep., 12, 377–386, https://doi.org/10.1111/1758-2229.12844, Christaki, U., Courties, C., Massana, R., Catala, P., Lebaron,
2020. P., Gasol, J. M., and Zubkov, M. V.: Optimized routine
Bolyen, E., Rideout, J. R., Dillon, M. R., Bokulich, N. A., Abnet, flow cytometric enumeration of heterotrophic flagellates us-
C. C., Al-Ghalith, G. A., Alexander, H., Alm, E. J., Arumugam, ing SYBR Green I, Limnol. Oceanogr.-Meth., 9, 329–339,
M., Asnicar, F., Bai, Y., Bisanz, J. E., Bittinger, K., Brejnrod, https://doi.org/10.4319/lom.2011.9.329, 2011.
A., Brislawn, C. J., Brown, C. T., Callahan, B. J., Caraballo- Clarke, K. R. and Warwick, P. E.: Change in Marine Communi-
Rodríguez, A. M., Chase, J., Cope, E. K., Da Silva, R., Diener, ties: An Approach to Statistical Analysis and Interpretation, Ply-
C., Dorrestein, P. C., Douglas, G. M., Durall, D. M., Duvallet, C., mouth, Ltd Ed., 2001.
Edwardson, C. F., Ernst, M., Estaki, M., Fouquier, J., Gauglitz, D’Ortenzio, F., Iudicone, D., de Boyer Montegut, C., Testor, P., An-
J. M., Gibbons, S. M., Gibson, D. L., Gonzalez, A., Gorlick, K., toine, D., Marullo, S., Santoleri, R., and Madec, G.: Seasonal
Guo, J., Hillmann, B., Holmes, S., Holste, H., Huttenhower, C., variability of the mixed layer depth in the Mediterranean Sea as
Huttley, G. A., Janssen, S., Jarmusch, A. K., Jiang, L., Kaehler, derived from in situ profiles, Geophys. Res. Lett., 32, L12605,
B. D., Kang, K. B., Keefe, C. R., Keim, P., Kelley, S. T., Knights, https://doi.org/10.1029/2005GL022463, 2005.
D., Koester, I., Kosciolek, T., Kreps, J., Langille, M. G. I., Lee, Danovaro, R., Corinaldesi, C., Dell’Anno, A., Fuhrman, J. A., Mid-
J., Ley, R., Liu, Y.-X., Loftfield, E., Lozupone, C., Maher, M., delburg, J. J., Noble, R. T., and Suttle, C. A.: Marine viruses and
Marotz, C., Martin, B. D., McDonald, D., McIver, L. J., Melnik, global climate change, FEMS Microbiol. Rev., 35, 993–1034,
A. V., Metcalf, J. L., Morgan, S. C., Morton, J. T., Naimey, A. T., https://doi.org/10.1111/j.1574-6976.2010.00258.x, 2011.
Navas-Molina, J. A., Nothias, L. F., Orchanian, S. B., Pearson, T., Degerman, R., Dinasquet, J., Riemann, L., Sjostedt de Luna, S.,
Peoples, S. L., Petras, D., Preuss, M. L., Pruesse, E., Rasmussen, and Andersson, A.: Effect of resource availability on bacterial
L. B., Rivers, A., Robeson, M. S., Rosenthal, P., Segata, N., Shaf- community responses to increased temperature, Aquat. Microb.
fer, M., Shiffer, A., Sinha, R., Song, S. J., Spear, J. R., Swaf- Ecol., 68, 131–142, 2012.
ford, A. D., Thompson, L. R., Torres, P. J., Trinh, P., Tripathi, Demory, D., Arsenieff, L., Simon, N., et al.: Temperature is a key
A., Turnbaugh, P. J., Ul-Hasan, S., van der Hooft, J. J. J., Vargas, factor in Micromonas–virus interactions, ISME J., 11, 601–612,
F., Vázquez-Baeza, Y., Vogtmann, E., von Hippel, M., Walters, https://doi.org/10.1038/ismej.2016.160, 2017.
W., Wan, Y., Wang, M., Warren, J., Weber, K. C., Williamson, C. Desboeufs, K., Leblond, N., Wagener, T., Bon Nguyen, E., and
H. D., Willis, A. D., Xu, Z. Z., Zaneveld, J. R., Zhang, Y., Zhu, Guieu, C.: Chemical fate and settling of mineral dust in surface
Q., Knight, R., and Caporaso, J. G.: Reproducible, interactive, seawater after atmospheric deposition observed from dust seed-
scalable and extensible microbiome data science using QIIME 2, ing experiments in large mesocosms, Biogeosciences, 11, 5581–
Nat. Biotechnol., 37, 852–857, https://doi.org/10.1038/s41587- 5594, https://doi.org/10.5194/bg-11-5581-2014, 2014.
019-0209-9, 2019. Ducklow, H.: Factors regulating bottom-up control of bacteria
Bonnet, S. and Guieu, C.: Atmospheric forcing on the an- biomass in open ocean plankton communities, Arch. Hydrobiol.
nual iron cycle in the Western Mediterranean Sea: A Beih. Ergebn. Limnol., 37, 207–217, 1992.
1-year survey, J. Geophys. Res.-Ocean., 111, C09010,
https://doi.org/10.1029/2005JC003213, 2006.
https://doi.org/10.5194/bg-19-1303-2022 Biogeosciences, 19, 1303–1319, 2022You can also read