Nano-encapsulated Iron and Folic Acid-Fortified Functional Yogurt Enhance Anemia in Albino Rats - Frontiers
←
→
Page content transcription
If your browser does not render page correctly, please read the page content below
ORIGINAL RESEARCH
                                                                                                                                                  published: 07 April 2021
                                                                                                                                           doi: 10.3389/fnut.2021.654624

                                               Nano-encapsulated Iron and Folic
                                               Acid-Fortified Functional Yogurt
                                               Enhance Anemia in Albino Rats
                                               Amira M. G. Darwish 1*† , Tarek N. Soliman 2† , Hassan A. Elhendy 3† and Wedad M. El-Kholy 4†
                                               1
                                                Department of Food Technology, Arid Lands Cultivation Research Institute (ALCRI), City of Scientific Research and
                                               Technological Applications (SRTA-City), Alexandria, Egypt, 2 Food Industries and Nutrition Research Division, Department of
                                               Dairy, National Research Centre, Cairo, Egypt, 3 Home Economics Department, Faculty of Agriculture, Alexandria University,
                             Edited by:
                                               Alexandria, Egypt, 4 Department of Dairy Technology Research, Food Technology Research Institute, Agriculture Research
                       Juan E. Andrade,
                                               Center, Giza, Egypt
    University of Florida, United States

                         Reviewed by:
                  Kiruba Krishnaswamy,         Iron deficiency anemia (IDA) is a major health concern in developing countries, and
  University of Missouri, United States        these see an increased incidence in pregnant women and children in particular. The
                       Shivendu Ranjan,
           University of Johannesburg,         contribution of dairy products as natural products in drug delivery approaches is inspiring.
                            South Africa       This study aimed to analyze the application of iron (Fe) and folic acid (FA) bovine serum
           Gustavo F. Gutiérrez-López,
   Instituto Politécnico Nacional (IPN),
                                               albumin-nanoparticles (BSA-NPs) as anti-anemic pharmacological agents that fortify
                                Mexico         stirred functional yogurt (SFY), comparing these with a plain control and SFY fortified
                  *Correspondence:             with Fe and FA in free forms. The physicochemical, cytotoxicity, microbiological, viscosity,
                 Amira M. G. Darwish           oxidative interactions, microstructural, sensorial analyses, and bioavailability properties of
           amiragdarwish@yahoo.com
                                               IDA-induced Albino rats were examined. The Transmission Electron Microscope (TEM),
                           † ORCID:
                                               Zetasizer, and Scan Electron Microscope (SEM) were applied. Nanocapsule-fortified
                 Amira M. G. Darwish
     orcid.org/0000-0003-3586-1575             SFY showed an enhanced apparent viscosity, water-holding capacity, microstructure,
                    Tarek N. Soliman           least lipid oxidation, and overall sensorial acceptability. Feed that included Fe + FA
     orcid.org/0000-0002-1138-9133
                  Hassan A. Elhendy
                                               nanocapsule-fortified SFY (G6) succeeded in restoring hemoglobin (16.53 gdL−1 ), iron
     orcid.org/0000-0002-8302-3552             (109.25 µgdL−1 ), ferritin (33.25 µgdL−1 ), and total protein (8.6 gdL−1 ) at the end of
                  Wedad M. El-Kholy            the 4-week feeding period, with significant competition revealed in calcium and zinc
     orcid.org/0000-0003-4318-5765
                                               absorbance. Nanocapsule-fortified SFY showed no adverse effects or architectural
                    Specialty section:         alterations in the liver, kidney, or spleen, as indicated by biochemical and histological
          This article was submitted to        examinations. Bovine serum albumin-nanoparticles (BSA-NPs) of iron (Fe) and folic
           Nutrition and Food Science
                             Technology,       acid (FA) can be recommended as anti-anemia supplements in different functional
                a section of the journal       food applications.
                    Frontiers in Nutrition
                                               Keywords: anti-anemia, natural products, bioavailability, nano-encapsulated Fe and FA, food supplements, stirred
          Received: 18 January 2021
                                               functional yogurt
           Accepted: 08 March 2021
            Published: 07 April 2021

                             Citation:         Iron deficiency anemia (IDA) is one of the top 20 risk factors for the global distribution of disease
           Darwish AMG, Soliman TN,            burden. The WHO is working with the Egyptian government to address major challenges due to the
 Elhendy HA and El-Kholy WM (2021)
                                               prevalence of IDA, which is found in 40% of children between 2 and 5 years of age and which may
    Nano-encapsulated Iron and Folic
      Acid-Fortified Functional Yogurt
                                               increase to 51% in rural areas. A similar prevalence was reported among women of reproductive
     Enhance Anemia in Albino Rats.            age and in pregnancy in addition to it being associated with other diseases (1, 2).
               Front. Nutr. 8:654624.              Milk is a natural optimized delivery system that provides sufficient bioavailability to sustain
      doi: 10.3389/fnut.2021.654624            life; despite this realization, the use of milk and dairy products in a drug delivery context has not

Frontiers in Nutrition | www.frontiersin.org                                          1                                              April 2021 | Volume 8 | Article 654624
Darwish et al.                                                                                   Nano-capsules in Functional Yogurt Enhance Anemia

been advanced (3). Yogurt is a dairy product produced by                  EXPERIMENTAL SECTION
the fermentation of milk with lactic acid bacteria (LAB),
and it contains insignificant quantities of iron (Fe) (4) and             Chemicals and Materials
folic acid (FA) (5). Fortification of yogurt with Fe and FA               Raw cow’s milk was obtained from the Faculty of Agriculture
could decrease nutritional deficiencies, but, unfortunately,              farm of Alexandria University, Alexandria Governorate, Egypt.
it can chemically interact with various yogurt ingredients,               Its composition was 3% fat, 3.1% protein, 12.25% total solids, and
causing changes in the physicochemical properties (e.g.,                  0.172% lactic acid. Skimmed milk powder (SMP) was obtained
syneresis), fat oxidation, resulting in an oxidized and                   from Dairy America, Inc., California, USA, and it was composed
metallic flavor, organoleptic properties (e.g., color and odor),          of 34% protein, 51% lactose, 1.2% fat, 8.2% minerals, and 4%
shelf life, viscosity, and microbial properties. Generally,               moisture. The other materials used were BSA, FA, L-ascorbic
properties of fortified dairy products are influenced by the              acid, NaCl, and FeSO4 . 7H2 O were purchased from Sigma
type, amount, and form of the mineral source component                    Aldrich, Merck (Sigma Aldrich, Merck St. Louis, MO, USA). All
added (6).                                                                reagents and solvents used were of an analytical grade.
    The growing awareness of functional foods has increased                   Commercial freeze-dried lactic acid starter cultures for
the need to improve the health benefits of traditional foods,             a direct-to-vat set (DVS) included YF-L903, containing
particularly dairy products. This can be achieved by including            Streptococcus salivarius subsp. thermophillus and Lactobacillus
health-promoting ingredients using nanoencapsulation                      delbruckii subsp. bulgaricus (1:1), and a probiotic starter culture
technology (7). This trend has been driven by the nanostructures’         (ABT-5), which consists of Streptococcus thermophilus ST-20Y,
ability to improve the bioavailability and solubility of active           Lactobacillus acidophilus LA-5, and Bifidobacterium bifidum BB-
ingredients and can be achieved without compromising other                12. Both starter cultures were obtained from Christen Hansen
food properties (8).                                                      Laboratories, Copenhagen, Denmark, and kept at −18◦ C. After
    Encapsulation is the method of choice as a technique for              preliminary incubation, ABT-5 was added to the milk for 18 h at
confining a substance in a polymeric matrix. It can confer                37 ± 1◦ C.
stability of the encapsulated compound more than in its
isolated or free forms by protecting from adverse environmental           Preparation and Purification of BSA-NPs
conditions (9), reducing the organoleptic problems, and                   Bovine serum albumin nanoparticles (BSA-NPs) were prepared
increasing the bioavailability of ingredients. The mechanism              using the previously reported desolvation technique (15). This
of forming an impermeable membrane as a barrier to oxygen                 method is a thermodynamically driven self-assembly process
diffusion protects iron from oxidation, masks the flavor and              used for polymeric materials. Both hydrophilic and hydrophobic
color (10), and enhances bioavailability (11). Encapsulated               drugs can be encapsulated into NPs using this technique (17, 18).
Fe aided by ascorbic acid was shown to more efficiently                   BSA powder (200 mg) was dissolved in 2 mL deionized water. We
maintain the quality of Fe and retain the microbial balance of            ensured pH was 7.2 using 0.01 M NaOH, and the solution was
fortified yogurt (12). Bovine serum albumin (BSA) is a natural            left to stir at 500 rpm at room temperature (25◦ C) for 10 min
biomaterial that is used as a matrix to produce non-toxic,                to equilibrate. Subsequently, by continuous dropwise addition of
biodegradable, biocompatible, and easily adaptable nanoparticles          8.0 mL ethanol by a syringe pump at the rate of 1.0 mL/min as a
(NP) (13). BSA is rich in charged amino acids (lysine), which             desolvating agent, an opalescent suspension was achieved, which
allow the positively and negatively charged molecules to                  indicates the formation of the NPs (step i). Ethanol changes
adsorb electrostatically without the participation of any other           the tertiary structure of the protein, and, during the addition
compounds (14). The desolvation method is a simple and fast               of ethanol to the solution, the albumin is phase-separated due
technique for the production of protein-based nanoparticles               to its diminished water solubility (19). Since the formed NPs
with smaller particle diameters that are considered drug carriers         were not sufficiently stabilized and could consequently redissolve
due to their exceptional characteristics: extraordinary adsorption        again after dispersion with water, cross-linking was implemented,
capacity, low toxicity, biodegradability, non-immunogenicity,             which is a major step in the desolvation method. In this step,
long-term stability, shelf life, amphiphilicity, and easy                 37.5 mL of 50% aqueous solution of glutaraldehyde (0.2 mL 50%
scale-up (15, 16).                                                        Gta per mg of BSA) (20) was added gradually for the stabilization
    This study aimed to apply iron (ferrous sulfate) or (ferrous          and cross-linking of the amino moieties in lysine residues and
sulfate and FA) bovine serum albumin-nanoparticles (BSA-                  the guanidine side chains in arginine of BSA via a condensation
NPs) as anti-anemic pharmacological agents to fortify                     reaction with the aldehyde group (step ii). The mixture was
stirred functional yogurt (SFY), comparing this with a                    maintained under stirring conditions for 12 h.
plain control and SFY fortified with Fe and FA in free                        In order to eliminate the non-desolvated albumin, the excess
forms.      Physicochemical,     cytotoxicity,     microbiological,       cross-linking agent, and organic solvent, the resulting NPs
viscosity, oxidative interactions, microstructural, and sensorial         were purified by three successive centrifugations (16,000 rpm,
analyses of the fresh products and after 21 days of cold                  20 min). The first centrifugation supernatant was used for the
storage were conducted to evaluate the potential changes.                 determination of non-desolvated albumin. After that, between
Furthermore, the bioavailability and anti-anemia effect of                each centrifugation, the supernatant solution was thrown away,
iron-fortified SFY products were studied in IDA-induced male              and the pellets were washed with the original volume of deionized
Albino rats.                                                              water (step iii). Then, the redispersion step in deionized water

Frontiers in Nutrition | www.frontiersin.org                          2                                        April 2021 | Volume 8 | Article 654624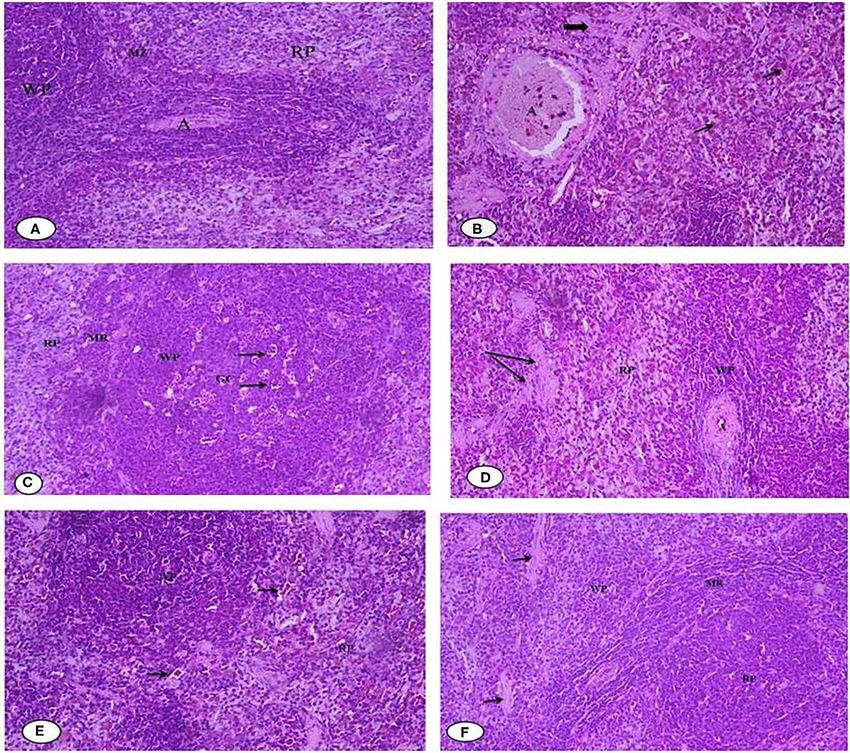
Darwish et al.                                                                                    Nano-capsules in Functional Yogurt Enhance Anemia

(20 mL) was performed in an ultrasonic bath for 30 min (step iv).          were assessed by hemolytic activity assay in 2 mL microtubes
The product was dried in a freeze dryer with a cycle of 24 h at a          according to Farias (23) with some modifications. Two-fold serial
shelf temperature of 55◦ C and then incubated at 4◦ C in the dark          dilution of each sample was prepared with 0.9% NaCl ranging
(step v). Average particle sizes were measured by transmission             from 1,000 to 1.9 µg·mL−1 and reserved. Then, 100 µL of a
electron microscopy (TEM), and the samples were dispersed in               1% red blood cell (A, B, and O human blood types using rabbit
distilled water for dynamic light scattering (DLS) analysis (21).          blood) suspension were added to a new microtube containing
                                                                           900 µL of each sample dilution, incubated at 37◦ C/1 h, and then
CHARACTERIZATION OF BSA-NPS                                                centrifuged at 3,000 ×g/5 min. The supernatant (200µL) was
                                                                           placed in a 96-well plate and led to a microplate reader to measure
Transmission Electron Microscopy                                           the absorbance at 540 nm. The cell suspensions of each human
Samples of nano-encapsulated Fe and FA were prepared for                   blood type (100 µL) were mixed with distilled water or 0.9%
transmission electron microscopy (TEM). The samples were                   NaCl (900 µL) to obtain the absorbance of 100 and 0% of cell
diluted (1:100 v/v) with deionized water. A drop of the diluted            lysis, respectively. The percentage of hemolysis was calculated
suspension was placed on the format-coated electron microscopy             according to the following Equation (1):
grid, left for 1 min, and then a drop of phosphotungstic acid
solution (2% at pH 7.2) was added. The grid was air-dried and                                               Abs test
                                                                                          % hemolysis =              × 100                        (1)
examined by TEM using a JEOL JEM-1400 plus TEM with an                                                      Abs pc
accelerating voltage of 100 kV at a magnification of 200,000
x (21).                                                                    where Abs test = Abs540 of the 1% cell suspension treated with
                                                                           sample test, and Abs pc = Abs540 of the 1% cell suspension
Particle Size and Zeta Potential                                           treated with distilled water.
The nanocapsules’ particle size was measured using a dynamic                   To calculate the relationship between percentages of
light scattering instrument (DLS) (Mastersizer 2000, Malvern               hemolysis and sample concentration, the hemolytic activity
Instruments, Malvern, UK). The particle size of each sample was            was expressed as the lowest sample concentration (µg·mL−1 )
represented as the surface-weighted mean diameter (d32), which             capable of causing hemolysis ≥20%. All determinations were run
was calculated from the full particle size distribution. The droplet       in triplicates.
charge (zeta potential) of the nanocapsules was measured using
particle microelectrophoresis (Zetasizer Nano ZS-90, Malvern
Instruments, Worcestershire, UK) (21).
                                                                           CHARACTERISTICS OF MANUFACTURED
                                                                           SFY
Analysis of Fe and FA Loading to BSA-NPs                                   SFY Preparation
and Encapsulation Efficiency                                               Cow’s milk was standardized to 14% total solids by adding
The BSA-NPs were loaded with Fe and FA, and the loading                    3% SMP and then homogenized at 2,500 psi with an Ultra
efficiency was evaluated. The loading process was done by the              Turrax blender (IKA, Merck, Germany) at 14,000 rpm until all
preparation of nanoparticle solutions by dissolving 25 mg in 1 mL          ingredients were dissolved in the milk. The milk was heated to
deionized water. Then, the volumes of 1, 2, and 4 mg Fe or 0.025,          90◦ C for 5 min then cooled to 42 ± 1◦ C. An ABT-5 probiotic
0.05, and 0.1 mg FA were added to the nanoparticle solutions;              starter culture was enriched in SMP (0.05/Kg w/w) for 18 h
the final volume was adjusted with deionized water to 2 mL and             at 37 ± 1◦ C and then used to inoculate the warmed milk
was magnetically stirred for 12 h (600 rpm) at room temperature.           with the yogurt starter culture (0.03/Kg w/w) at 42 ± 1◦ C
After this, there is an adsorption equilibrium between the Fe              (24). The milk was then was divided into five equal batches
or FA and the surface of the NPs. These suspensions were                   for the five treatments and incubated at 42 ± 1◦ C until a
transmitted to polypropylene centrifuge tubes and centrifuged              firm curd was obtained. The treatments were as follows: C,
at 12,000 rpm for 20 min. The supernatants were separated and              Control plain SFY; T1 , SFY fortified with free Fe + ascorbic
were measured using atomic absorption for Fe or HPLC for FA                acid; T2 , SFY fortified with free Fe + FA + ascorbic acid; T3 ,
to determine the loading efficiency (21).                                  SFY fortified with Fe@-BSA-NPs + ascorbic acid; and T4 , SFY
                                                                           fortified with Fe +FA @-BSA-NPs + ascorbic acid. The curd
Cytotoxicity Assessment by Hemolytic                                       was then refrigerated at 4◦ C overnight before being stirred,
Activity Assay                                                             packaged, and immediately transferred to a refrigerator at 4
Ascorbic acid has been reported to increase Fe absorption by               ± 1◦ C for 21 days (25). The SFY products were analyzed
several folds due to its chelating action and reducing power that          for their physicochemical, microbiological, viscosity, oxidative
facilitates ferric (Fe3+ ) conversion to ferrous ions (22). Ascorbic       interactions, microstructural, and sensory properties on the first
acid was added to the free and nano-encapsulated fortification             day after manufacture and during the storage period.
forms at a concentration of 225 mgL−1 . Before application, the
cytotoxicity of the fortification materials, free ferrous sulfate +        Physiochemical Analysis of SFY
ascorbic acid (45 mgL−1 ), free ferrous sulfate (45 mgL−1 ) + free         The pH was measured using a digital pH meter (Persica pH 900,
FA (1 mgL−1 ) + ascorbic acid, Fe@-BSA-NPs + ascorbic acid (45             Switzerland). According to AOAC 947.05, the titratable acidity
mgL−1 ), and Fe + FA@-BSA-NPs + ascorbic acid (45 mgL−1 )                  (TA) as the % lactic acid was estimated (26).

Frontiers in Nutrition | www.frontiersin.org                           3                                        April 2021 | Volume 8 | Article 654624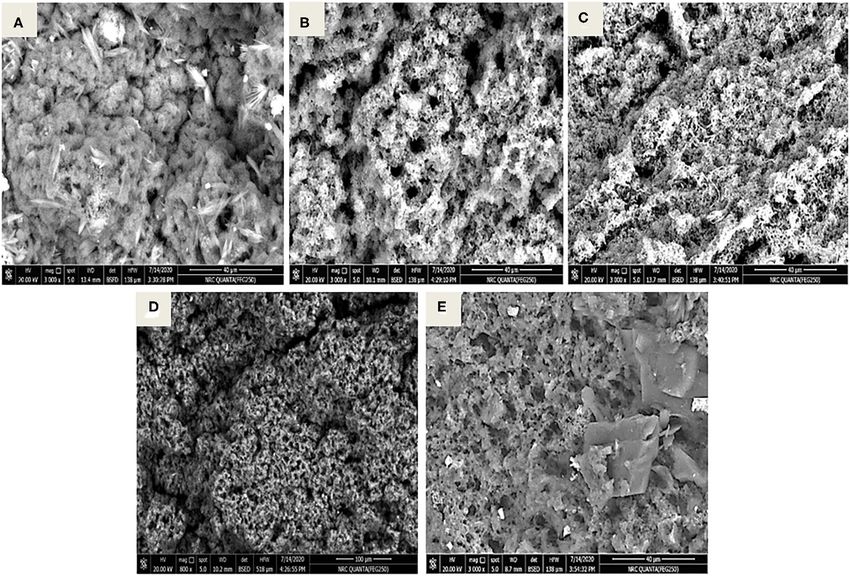
Darwish et al.                                                                                    Nano-capsules in Functional Yogurt Enhance Anemia

   The water-holding capacity (WHC) was determined using the               Microbiological Analysis of SFY
method reported by (27).                                                   Appropriate serial dilutions of SFY samples were prepared for
   The SFY apparent viscosity was measured in fresh products               microbial enumeration by using 2% sodium citrate. For the
and at 21 days of cold storage, using a Bohlin coaxial cylinder            enumeration of S. thermophilus, counts were performed on M17
viscometer (Bohlin Instrument Inc., Sweden) attached to a                  agar (Biolife, Italy) and incubated at 37◦ C for 48 h under aerobic
workstation loaded with V88 viscometer programming software.               conditions. The L. bulgaricus was enumeration on MRS agar
The viscometer probe, system C30, was placed in the yogurt                 (Biolife, Italy) and incubated aerobically at 37◦ C for 72 h (35).
sample cup, and measurements of viscosity were carried out at              The L. acidophilus counts were determined using MRS-bile (MRS
20 ± 2◦ C in the up mode at shear rates ranging from 19 to 126             agar prepared with 1.5 gL−1 bile agar.). Selective enumeration
s−1 (28).                                                                  of B. bifidum was performed on MRS-cysteine agar prepared
   The SFY color analyses were conducted for the fresh products            with 0.05 gL−1 cysteine (36). The B. bifidum and L. acidophilus
and at 21 days of cold storage using a Hunter colorimeter                  culture plates were incubated at 37◦ C for 72 h under anaerobic
(Hunter Ultra Scan VIS). Values were expressed by Hunter L,                conditions using a gas pack (Oxide, UK). The enumeration of
a, and b values where L∗ was the value of the lightness (0–100             yeasts and molds was performed as recommended by Okoye and
representing dark to light), a∗ was the value of the degree of             Animalu (37) using potato dextrose agar (Difico, Italy) acidified
red and green color, where a higher positive value was indicated           with 10% tartaric acid and incubated at 25◦ C for 5 d. Violet red
by more red, and b∗ was the value of the degree of the yellow              bile lactose agar (Oxide, UK) was used for the coliform count
and blue colors, where higher values were indicated by more                according to Marth (38). The plates were incubated at 37◦ C for
yellow (29).                                                               24 h. The colony-forming units were measured as Log10 CFUg−1 .

Phenolic, Flavonoid Content, and                                           Microstructural Characterization
Antioxidant Potentials                                                     The microstructures of the SFY samples were examined by (SEM)
The total phenolic content (TPC) expressed as a gallic acid                (Jeol JSM-6300 F, Japan at 2.5–5.0 kV) according to Munir (39).
equivalent in the µg/g sample was determined by the Folin–                 Cubes (3 ± 0.5 mm3 ) were cut from different areas of the
Ciocalteu method (30). Total flavonoid content (TPC) was                   yogurt cup and fixed in 3% glutaraldehyde in 0.05 M phosphate
assessed via the colorimetric method as described by Sakanaka              buffer pH 7 for 2 h at 48◦ C. The fixed cubes were rinsed with
et al. (31). The results were expressed as µg of catechol equivalent       0.05 M phosphate buffer followed by the primary fixing solutions,
per g of sample. The 2,2-diphenyl-1-picrylhydrazyl (DPPH)                  and finally soaked a secondary fixation solution (1.5% osmium
assay was performed as described by Brand-Williams et al. (32).            tetroxide in phosphate buffer pH 7.0) for 1.5 hrs. The fixed cubes
Antioxidant activity was expressed as IC50 (mgmL−1 ) where the             were rinsed with 0.05 M phosphate buffer. The fixed cubes were
inhibition percent of the DPPH radical was 50%.                            dehydrated by successive soaking in 30, 50, 70, and 95% ethanol
                                                                           each for 20 min and finally by two rinses in absolute ethanol
Evaluation of Lipid Oxidation                                              (100%) at 48◦ C and 58◦ C, respectively. Cubes were immediately
Thiobarbituric Acid Reactive Substances                                    dried in the critical point drier (Samdri PVT-3B, Tousimis,
                                                                           Rockville, MD) for 5 h. using CO2 . The dried cube was fractured
and Peroxide Values                                                        and mounted on sputter. The analysis was carried out after 7 days
The lipid peroxidation changes were assessed in SFY samples
                                                                           of manufacture of yogurt samples.
throughout a cold storage period of 21 days. The SFY
samples were analyzed for thiobarbituric acid reactive substances
according to Radha Krishnan et al. (33). A total of 5 g of the             Sensory Evaluation
sample were homogenized with 15 mL of deionized distilled                  The sensory evaluation of SFY samples was assessed by 20
water; then, 1 mL of the sample homogenate was transferred into            consumer-oriented panelists (11 men and 9 women aged between
a test tube and 50 µL of butylated hydroxytoluene (7.2%) in                27 and 51 years). Under the supervision and approval of
methanol and 2 mL of thiobarbituric acid (TBA)–trichloroacetic             the Institutional Committee, the assessment was conducted at
acid (TCA) (15 mM TBA−15% TCA). The mixture was vortexed                   Food Technology Department, Arid Lands Cultivation Research
and then incubated in a water bath 100◦ C/15 min to develop                Institute, SRTA-City, Alexandria, in fresh products and after 21
color. Samples were subjected to cooling for 10 min, vortexed,             days of cold storage (40, 41). The criteria for selection depended
and centrifuged at 5,000 rpm/15 min. The absorbance of the                 on their experience and background related to yogurt products.
resulting supernatant solution was determined at 531 nm against            The samples, which were stored at (4◦ C), were allowed to rest
a blank containing 1 ml of deionized water and 2 mL of                     at room temperature (25◦ C), 10 min before evaluation. The
TBA–TCA solution. The amount of TBARS was expressed as                     samples were evaluated using a 9-point Hedonic scale (42). This
milligrams of malonaldehyde per kilogram of the sample.                    scale consisted of the test parameters of taste, odor, body and
   The peroxide values (PVs) of the stirred yogurt samples were            texture, appearance and color, and overall acceptability, and it
determined according to official method AOCS (34) (method                  was accompanied by a scale of nine categories: 1 = dislike
Cd8-53) (34) by titration, and standard sodium thiosulfate                 extremely; 2 = dislike much; 3 = dislike moderately; 4 = dislike
(0.01 N) was calculated as mL equivalent peroxides per kilogram            slightly, 5 = neither dislike nor like, 6 = like slightly; 7 = like
sample (meqO2 Kg−1 sample).                                                moderately; 8 = like much; 9 = like extremely.

Frontiers in Nutrition | www.frontiersin.org                           4                                        April 2021 | Volume 8 | Article 654624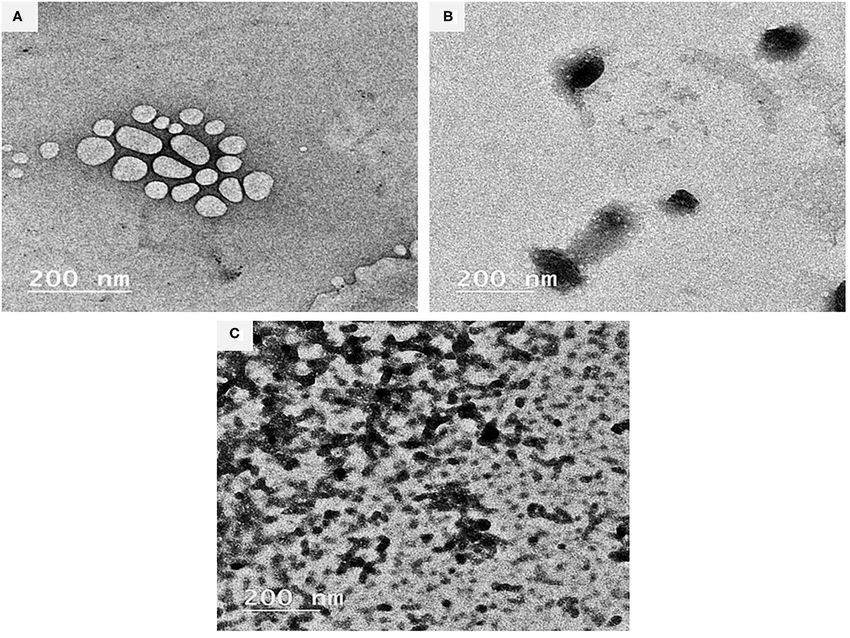
Darwish et al.                                                                                        Nano-capsules in Functional Yogurt Enhance Anemia

BIOLOGICAL EXPERIMENT                                                          Histopathology Examination
                                                                               Fixed samples from the liver, kidney, and spleen were washed and
Animals and Experimental Design                                                embedded in paraffin blocks and sectioned into 5–6 µm sections
A total of 36 male albino rats (150 ± 10 g) were bred                          using Microtome (Reichert-Jung, Germany) for serial specimens
and maintained in Experimental Animals House, Home                             then mounted on glass slides and stained with hematoxylin
Economics Department, Faculty of Agriculture, Alexandria                       and eosin (H & E) stain (46). The slides were observed under
University, Egypt, after approval of Alexandria University                     a histological light microscope (Olympus, Tokyo, Japan) at
Ethical Committee (AlEXU-IACUC), a member of International                     400X magnification.
Council for Laboratory Animal Science (ICLAS) (Permission
number: AU08200415362). All experiments were performed                         Statistical Analysis
in accordance with Alexandria University Ethical Committee                     The data were presented as mean values ± standard deviation.
guidelines and regulations. Animals were housed in stainless                   Statistical analysis was performed using one-way analysis
steel wire-mesh cages in a room maintained at 22 ± 1◦ C. Rats                  of variance (ANOVA) followed by Duncan’s test. The
were acclimatized to being fed laboratory chow (with chemical                  Physicochemical and microbiological properties were statistically
composition as follows: fat 2.8%, protein 18.5%, and fiber 11.2%)              analyzed by two-way analysis of variance (ANOVA) followed
and water ad libitum for 1 week to stabilize their metabolic                   by a t-test (LSD). The differences were considered significant at
condition. After the adaptation week, the rats were randomly                   (p ≤ 0.05) We used IBM SPSS Statistics 23 software program
divided into two groups of six animals each. Group I (G1) was                  for statistical analyses [IBM Corp (47) IBM SPSS Statistics for
the negative control group, and Group II was induced for IDA by                Windows, Version 23.0. IBM Corp, Armonk, NY] with p ≤ 0.05
feeding them a diet containing 20 g/kg of body weight of tannic                considered statistically significant.
acid for 2 weeks. Group II was then randomly divided into five
sub-groups—G2, Positive control group; G3, fed SFY fortified
with 50 mgKg−1 free ferrous sulfate + 125 mgKg−1 ascorbic                      RESULTS AND DISCUSSION
acid; G4, fed SFY fortified with 50 mgKg−1 free ferrous sulfate                Characteristics and Efficiency of
+ 0.5 mgKg−1 free FA + 125 mgKg−1 ascorbic acid; G5, fed
                                                                               Nanocapsules
SFY fortified with 50 mgKg−1 Fe@- BSA-NPs + 125 mgKg−1
                                                                               Table 1. illustrates the encapsulation efficiency of the BSA
ascorbic acid; and G6, fed SFY fortified with 50 mgKg−1 Fe +
                                                                               nanoparticles (BSA-NPs). Results revealed that the sizes of the
FA@ BSA-NPs + 125 mgKg−1 ascorbic acid—for another 4 weeks
                                                                               spherical nanoparticles of BSA-NPs, Fe@ BSA-NPs, FA@ BSA-
as described by Afsana et al. (43).
                                                                               NPs, and Fe + FA@ BSA-NPs were determined by dynamic light
Samples Collection and Preparation                                             scattering were 52.85, 57.98, 77.59, and 206.40 nm, respectively,
Body weights were monitored once/week. Blood analyses were                     with a significant increase in the size when FA, Fe, or both FA
obtained from rat eyes. At the end of 42 days period and                       and Fe were loaded. The polydispersity indices demonstrated
under the approval of the ethical committee, final weights were                their narrow size distribution, this confirmed the chemical cross-
recorded, and rats were sacrificed after overnight fasting under               linking between tyrosine residues that could result in the overall
light diethyl ether anesthesia. Blood samples were collected                   stability of BSA-NPs and BSA-NPs loaded with Fe or FA (48).
from the abdominal aorta in plain tubes, centrifuged at 4,000                      Zeta potentiometry was used to estimate the surface
rpm/20 min at 4◦ C for serum separation, and stored at −20◦ C                  charge of the NPs to determine their suspension stability.
until analyzed. Immediately after necropsy, the rats’ organs (liver,           The results showed the zeta potential for BSA-NPs, Fe@
kidney, spleen, heart, and lungs) were dissected carefully and                 BSA-NPs, FA@ BSA-NPs, and Fe + FA@ BSA-NPs were
weighed, and the weights were recorded and then fixed in 10%                   −22.10, −30.30, −24.6, and −21.20 mV, suggesting strong
(v/v) formalin for 24 h.                                                       repulsive forces and electrostatic stabilization between them.
   The relative organs weights were calculated by Equation (2):                Electrostatically stabilized nanosuspensions have a maximum
                                                                               zeta potential of −30 mV, while the value for satirically stabilized
                                                Organ weight (g)               nanosuspensions is ∼ 20 mV (49). The higher encapsulation
         Organ relative weight (g) =                                 (2)
                                               Rat body weight (g)             efficiency was for FA@ BSA-NPs and Fe@ BSA-NPs (97.54
                                                                               and 95.78%, respectively). BSA can establish hydrophilic and
Biochemical Analyses                                                           hydrophobic bonds with numerous molecules (48).
The complete blood cell count (RBCs, WBCs, Hb, Platelets,
Hct, MCV, MCH, and MCHC) was determined. The iron forms                        BSA-NPs Characterization
represented [plasma iron, total iron-binding capacity (TIBC),                  Figures 1A–C illustrates the TEM images (200 nm, 100 kV,
and transferrin saturation (TS)] were determined. In addition,                 20000X) of the BSA-NPs, Fe@ BSA-NPs, and FA@ BSA-NPs
the plasma total protein, transferrin, ferritin, and albumin were              nanoparticles. TEM can provide a detailed microscopic structure
determined. Furthermore, calcium and zinc were determined                      consistent with the results obtained from the dynamic light
to evaluate their absorbance completion with iron. Glucose,                    scattering (DLS) of particle sizes. The bonding of the Fe and FA
plasma lipid profile, liver, and kidney function were assessed.                with BSA resulted in changes to the BSA structure as shown in
All biochemical analyses were conducted according to Tietz                     the TEM images. Fe and FA nanoparticles (Figures 1B,C) were
Textbook and Tietz clinical Guide (44, 45).                                    shown to possess spherical morphology with some aggregation

Frontiers in Nutrition | www.frontiersin.org                               5                                        April 2021 | Volume 8 | Article 654624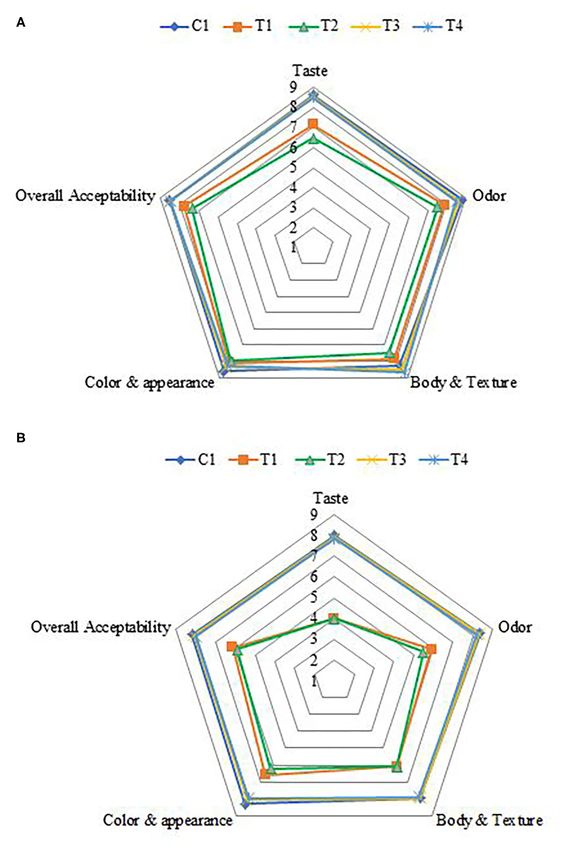
Darwish et al.                                                                                                            Nano-capsules in Functional Yogurt Enhance Anemia

TABLE 1 | Characterization of the bovine serum albumin nanoparticles (BSA-NPs).

Characteristics                    BSA-NPs              Fe@ BSA-NPs              FA@ BSA-NPs              Fe + FA@ BSA-NPs                   Free Fe               Free Fe + FA

Encapsulation efficiency of the bovine serum albumin nanoparticles (BSA-NPs)
Size (nm)                        52.85 ± 1.7d            77.59 ± 2.2b             57.98 ± 1.1c                206.40 ± 83a                       –                        –
Calculated PDI                       0.543a                 0.421b                   0.300c                      0.291d                          –                        –
ζ potential (mv)                  −22.10 ± 5a            −24.61 ± 1b              −30.30 ± 3c                 −21.20 ± 3a                        –                        –
Encapsulation efficiency                –               95.78 ± 5.42b            97.54 ± 3.19a               95.78 & 97.54*                      –                        –
Cytotoxicity assessment for applied forms (Hemolysis %)
5                                       –                1.18 ± 0.00aA                  –                    11.42 ± 0.01aC               3.54 ± 0.01aB           14.17 ± 0.02aD
                                                                      bA                                                    bC                         bB
10                                      –               2.36 ± 0.02                     –                    11.81 ± 0.00                6.69 ± 0.02              20.87 ± 0.01bD
                                                                       cB                                                   cC                          cA
15                                      –               10.63 ± 0.01                    –                    13.39 ± 0.03                 8.27 ± 0.01             22.05 ± 0.01cD
                                                                       dB                                                   dC                          dA
50                                      –               12.20 ± 0.01                    –                    15.35 ± 0.01                 9.84 ± 0.01             24.80 ± 0.00dD
                                                                       eA                                                   eC                          eB
100                                     –               15.35 ± 0.00                    –                    24.02 ± 0.01                22.44 ± 0.00             30.71 ± 0.01eD

Data represented as means of triplicates ± SD. Means in the same column followed by different lower-case letters and means in the same row followed by different upper case letters
are significantly different (p ≤ 0.05). PDI, Polydispersity index; BSA-NPs, Bovine Serum Albumin nanoparticles; FA, Folic Acid.
*As each of Fe and FA encapsulation efficiency were determined separately.

    FIGURE 1 | Characterization of BSA-NPs via Transmission Electron Microscope (TEM). (A) Bovine Serum Albumin nanoparticles (BSA-NPs). (B) Iron Bovine Serum
    Albumin nanoparticles (Fe@ BSA-NPs). (C) Folic Acid Bovine Serum Albumin nanoparticles (FA@ BSA-NPs).

Frontiers in Nutrition | www.frontiersin.org                                            6                                                 April 2021 | Volume 8 | Article 654624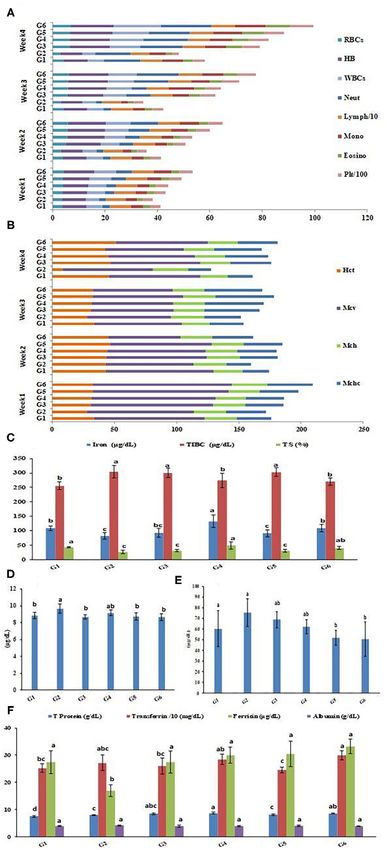
Darwish et al.                                                                                                                  Nano-capsules in Functional Yogurt Enhance Anemia

TABLE 2 | Physiochemical characteristics of SFY products during storage.

                                                                                           Storage period (days)

Treatments                                           Fresh                            7                              14                             21                          Means

pH value
C                                                4.58 ± 0.01                    4.55 ± 0.03                    4.49 ± 0.01                    4.44 ± 0.03                        4.52A
T1                                               4.55 ± 0.04                    4.52 ± 0.04                    4.44 ± 0.01                    4.39 ± 0.03                       4.48BC
T2                                               4.53 ± 0.03                    4.50 ± 0.03                    4.42 ± 0.04                    4.37 ± 0.01                        4.46C
T3                                               4.58 ± 0.01                    4.56 ± 0.04                    4.48 ± 0.01                    4.43 ± 0.03                        4.51A
T4                                               4.57 ± 0.04                    4.54 ± 0.03                    4.47 ± 0.03                    4.42 ± 0.03                       4.50AB
                                                            a                              b                              c                              d
Means                                                4.56                           4.53                           4.46                           4.41                       LSD = 0.027
Titratable acidity (%)
C                                                0.86 ± 0.01                    0.89 ± 0.01                    0.91 ± 0.03                    0.96 ± 0.03                        0.91B
T1                                               0.88 ± 0.01                    0.93 ± 0.03                    0.96 ± 0.04                    1.01 ± 0.04                        0.95A
T2                                               0.90 ± 0.01                    0.95 ± 0.03                    0.97 ± 0.04                    1.03 ± 0.04                        0.96A
T3                                               0.86 ± 0.04                    0.89 ± 0.01                    0.92 ± 0.01                    0.98 ± 0.03                        0.91B
T4                                               0.86 ± 0.01                    0.89 ± 0.01                    0.92 ± 0.01                    0.98 ± 0.03                        0.91B
Means                                                0.87c                          0.91b                          0.94b                          0.99a                      LSD = 0.026
Water holding capacity (%)
C                                                66.49 ± 0.38                   64.80 ± 0.14                   55.80 ± 0.14                   47.20 ± 0.28                      58.57B
T1                                               62.54 ± 0.42                   58.74 ± 0.32                   46.45 ± 0.21                   41.74 ± 0.14                      52.37C
T2                                               60.76 ± 0.28                   53.34 ± 0.20                   47.66 ± 0.28                   42.34 ± 0.20                      51.03D
T3                                               69.67 ± 0.42                   66.22 ± 0.28                   56.89 ± 0.28                   47.34 ± 0.28                      60.03A
T4                                               69.90 ± 0.35                   66.92 ± 0.17                   56.62 ± 0.17                   46.92 ± 0.28                      60.09A
Means                                               56.87a                         62.00b                         52.68c                         45.11d                      LSD = 0.258

Data represented as means of duplicates ±SD. C, Control plain SFY; T1 , SFY fortified with free Fe + ascorbic acid; T2 , SFY fortified with free Fe + FA + ascorbic acid; T3 , SFY fortified
with Fe@BSA-NPs + ascorbic acid; T4 , SFY fortified with Fe +FA @BSA-NPs + ascorbic acid. LSD, Least significant differences at 0.05 % level. Means with different superscripts in a
raw or column are significantly different at p ≤ 0.05 level. BSA-NPs, Bovine Serum Albumin nanoparticles; FA, Folic Acid.

indicating successful immobilization of BSA. Similar results were                                  stated that hemolysis values below 10% are considered non-
reported by Li et al. (50). In spite of what was previously                                        hemolytic while values above 25% are considered to be hemolytic.
reported—that nanoparticles disrupt the basic structure of BSA                                     Consequently, all forms of applied fortification concentrations in
(51, 52)—Morozova et al. (53), when compared BSA with BSA-                                         this study were kept below 50 µg mL−1 to ensure that the percent
NPs, reported that the characteristics of the circular dichroism                                   of hemolysis was within the safe range.
signal did not change in the BSA-NPs spectrum.
                                                                                                   SFY PHYSIOCHEMICAL
Cytotoxicity Assessment of BSA-NPs by
                                                                                                   CHARACTERISTICS
Hemolytic Activity Assay
Table 1 shows the cytotoxicity assessment (Hemolysis %) of                                         Physiochemical Analyses
applied forms (Fe and FA free and their nanocapsules).                                             Fortification with Fe and FA, either free or nano-encapsulated,
Hemolysis represents the most commonly employed initial                                            showed no effect on SFY’s incubation time up to pH 4.6, as all
toxicity assessment (54). The results revealed that that the                                       batches reached pH 4.6 ± 0.1 after 6 h. This observation agrees
percentage of hemolysis increased significantly by increasing                                      with previously reported results (58). The changes in the pH,
concentrations and added FA to Fe either in free or nano-                                          TA, and WHC values of SFY products during 21 days of cold
encapsulated forms. Furthermore, the comparison between the                                        storage are shown in Table 2. The results showed no significant
free and nano-encapsulated forms revealed the significant role of                                  differences between the treatments at the fresh product stage. The
nanoencapsulation in reducing cytotoxicity. For instance, when                                     pH values showed a significant decrease (p ≤ 0.05) at 21 days of
comparing the highest examined concentration (100 µg/mL) of                                        storage in all products, and values ranged from 4.58 to 4.37. The
free Fe and Fe@ BSA-NPs, nanoencapsulation reduced hemolysis                                       least pH value was recorded in T2 products fortified with free Fe
from 22.44 to 15.35%, respectively, and reduced the hemolysis                                      at the 21st day of storage. The results are comparable to those
of free Fe + FA from 30.71 to 24.02% in the Fe + FA@BSA-NPs                                        reported by Santillan-Urquiza et al. (59).
from. This effect is well-documented, as nano-encapsulated drugs                                      The opposite trend was observed in the TA of all products
formulated BSA-NPs, enhanced cytotoxicity, and drug delivery                                       that increased gradually during the storage period up to the 21st
(55, 56). The hemolytic activity results were used as a guide for                                  day. The TA of the SFY was significantly higher in T1 and T2
safe fortification based on Amin and Dannenfelser (57), who                                        SFY products containing free Fe and Fe + FA compared to the

Frontiers in Nutrition | www.frontiersin.org                                                   7                                                 April 2021 | Volume 8 | Article 654624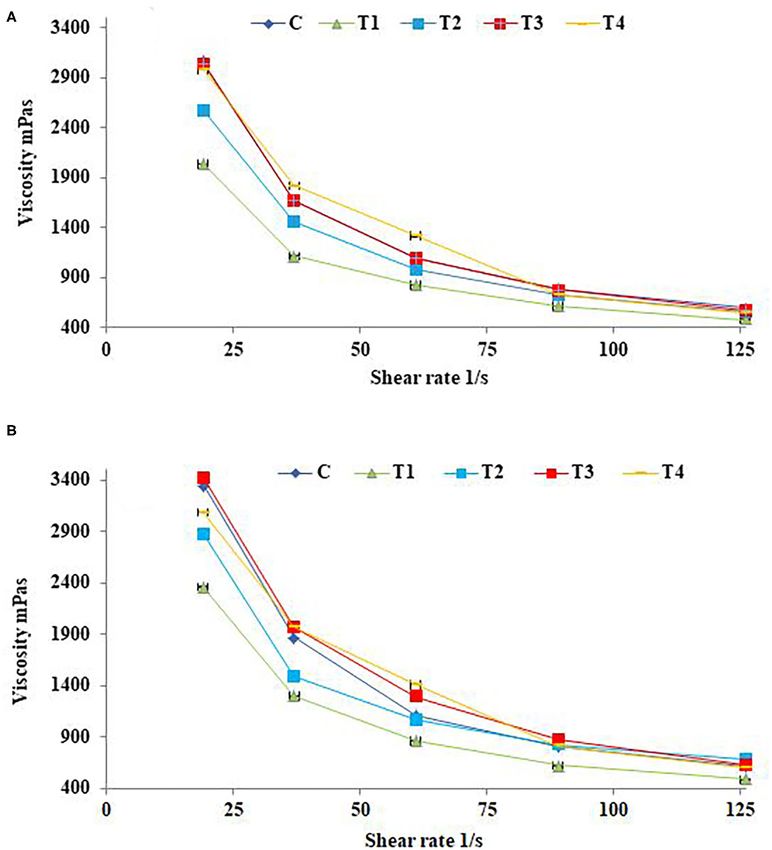
Darwish et al. Nano-capsules in Functional Yogurt Enhance Anemia
control. Iron is an essential micronutrient in the metabolism of be due to the effect of nanoencapsulation on masking the color
most living organisms, and increased viability, metabolic activity, (10, 41). These results were confirmed by the sensory evaluation
and fermentation power in presence of Fe have been previously results (Figure 6). After 21 days of storage, there were significant
reported (60, 61). These results are consistent with those reported decreases in L and b and an increased a value (p ≤ 0.05) in
by Güven et al. (62). all products. During storage, the presence of Fe promoted the
SFY fortified with nanocapsules Fe@BSA-NPs and Fe + oxidation of lipids (Figure 4), consequently decreased lightness
FA@BSA-NPs (T3 and T4 ) showed the highest WHC values, and changes in a and b values. These values are comparable to
which were significantly higher than the control. On the other those reported by Gaucheron (6).
hand, yogurt products fortified with free Fe or Fe + FA (T1 and
T2 ) showed a significant decrease (p ≤ 0.05) in WHC values Phenolic, Flavonoid Content, and
on the 21st day of storage. These effects may be related to the Antioxidant Potentials
pH decreasing below 4.6, contributing to casein rearrangement, The estimated concentrations of total phenolic content (TPC),
water release (24), and the porous structure exhibited by the total flavonoid content (TFC), and antioxidant potentials in SFY
microstructure (Figures 5B,C). While functional yogurt fortified with different fortifications were analyzed when fresh and during
with nanocapsules showed more stability due to the NP size, 21 days of cold storage Figures 3A–C. Figures 3A,B shows the
this did not affect the yogurt microstructure (Figures 5D,E). increased TPC and TFC values with fortification, particularly in
These observations agreed with previously obtained results for the free Fe + FA and Fe + FA@BSA-NP treatments (T2 and
Fe-fortified yogurt (9, 63, 64). T4 ). The results showed the same trend in antioxidant potentials
(Figure 3C). On the 21st day of the storage period a decline in
Apparent Viscosity of SFY TPC, TFC, and the SYF products’ antioxidant effects was noticed.
The effects of shear rate on fresh SFY apparent viscosity after The results showed that the optimum shelf life of products is <
21 days of storage are illustrated in Figures 2A,B. Yogurts 14 days of cold storage. Similar patterns have been reported by
exhibit a complex, shear-thinning, time-dependent flow behavior, Citta et al. (68).
and yogurt viscosity is therefore very important for processing,
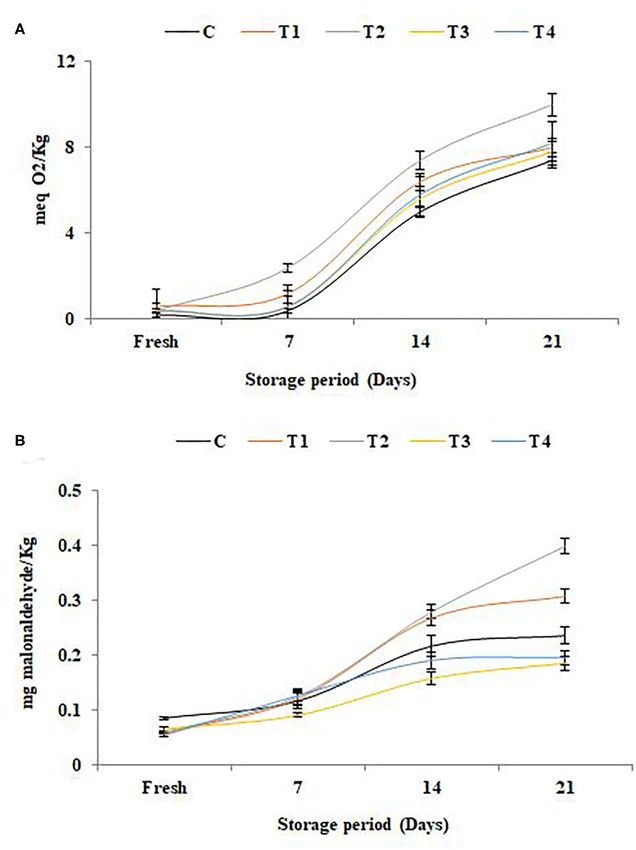
handling, process design, product development, and quality Lipid Oxidation
control aspects (65). The up-mode shear rates showed the SFY The results of lipid oxidation in SFY during storage illustrated
shear-thinning as the apparent viscosity of all samples was in Figures 4A,B were correlated to the antioxidant potential
significantly reduced along with increasing the shear rate. There (Figure 3). The elevation in free radical peroxide oxygen
were differences between different treatments on the apparent (Figure 4A) caused an overproduction of malonaldehyde
SFY viscosity. Treatments T3 and T4 fortified with nanocapsules (MDA), a known marker of the final products of polyunsaturated
scored the highest values of apparent viscosity comparing to fatty acids peroxidation (Figure 4B). The results indicated
the control (C). While T1 and T2 fortified with free forms that the antioxidants in yogurt (Figure 3) are prone to protect
of Fe and Fe + FA, respectively, showed lower values. These the products against lipid peroxidation. These results are in
results are consistent with the WHC values (Table 2), indicating agreement with Citta et al. (68). It was noteworthy that the
that SFY products are a gel system of casein micelles with products fortified with nanocapsules (T3 and T4 ) showed the
entrapped water (66). The apparent viscosity of all fortified SFY least lipid oxidation due to the effect of nanoencapsulation on
products showed slight increases in viscosity after 21 days of lipid protection. The protective role of nanoencapsulation has
storage (Figure 2B). This may be attributed to the fact that the been previously documented (69).
SFY viscosity was affected by the number, strength, structure,
and spatial distribution of casein micelle bonds enhanced by Microbiological Analysis of SFY
storage (67). The changes in the viable counts of S. thermophillus, L. bulgaricus,
L. acidophilus, and B. bifidum for the different yogurt products
Color Analysis are shown in Table 4. In the fresh products, the S. thermophillus,
The changes in the color parameters in fresh SFY treatments L. bulgaricus, and B. bifidum counts for treatments were
and after 21 days of storage are shown in Table 3. The comparable to the control. These results are in agreement with
products fortified with free Fe and Fe + FA (T1 and T2 ) those reported by Hekmat and McMahon (58). This microbial
were significantly darker, and the reddishness tended toward imbalance is a little more challenging compared to other dairy
yellowishness (p ≤ 0.05) compared to the control. T3 and T4 products because it may create an imbalance between the LAB
showed decreased lightness (L) and increased a and b values. The and other bacteria Fe for their growth. The L. acidophilus
color red-yellowish color differences were primarily due to the count in SFY fortified with free supplements (T1 and T2 ) was
ferrous sulfate and the yellow color due to FA, which imparted higher than the control and nano-encapsulated supplements
some color when added in its free form. The organoleptic (T3 and T4 ) due to free Fe that activated microbial growth. L.
properties had a significant effect on the sensory evaluation acidophilus can uptake Fe to enhance its growth. These results
results (Figure 6). On the other hand, products fortified with were reflected in the TA, which showed higher values in T1 and
nanocapsules Fe@BSA-NPs and Fe + FA@BSA-NPs (T3 and T2 (Table 2), confirming the microbiological analysis results. The
T4 ) tended to be significantly lighter with higher L and lower S. thermophillus, L. bulgaricus, L. acidophilus, and B. bifidum
a and b values (p ≤ 0.05) compared to T1 and T2 . This may counts showed insignificant decreases during the storage period
Frontiers in Nutrition | www.frontiersin.org 8 April 2021 | Volume 8 | Article 654624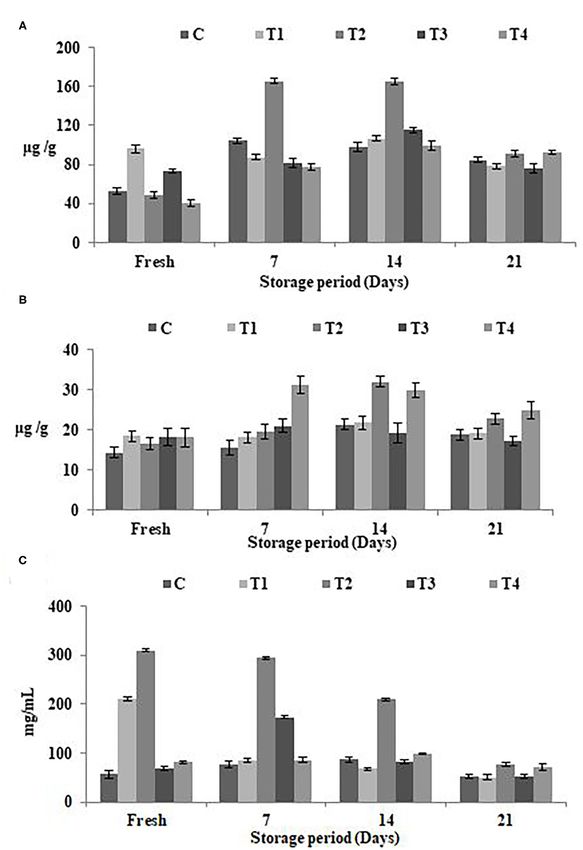
Darwish et al.                                                                                                        Nano-capsules in Functional Yogurt Enhance Anemia

 FIGURE 2 | Apparent viscosity of stirred functional yogurt products at different shearing rates. (A) Fresh products. (B) After 21 days of cold storage. Data represented
 as means of duplicates ±SD. C, Control plain SFY; T1 , SFY fortified with free Fe + ascorbic acid; T2 , SFY fortified with free Fe + FA + ascorbic acid; T3 , SFY fortified
 with Fe@BSA-NPs + ascorbic acid; T4 , SFY fortified with Fe +FA @BSA-NPs + ascorbic acid. BSA-NPs, Bovine Serum Albumin nanoparticles; FA, Folic Acid.

for all treatments. One of the most important factors affecting                          Microstructural Characterization of SFY
the viability of S. thermophillus, L. bulgaricus, L. acidophilus,                        Figures 5A–E shows the SEM micrographs of SFY products
and B. bifidum is acidity (35). However, up to the 21st day,                             at 500X, 50 µm, and 10 kV. In the micrograph (Figure 5A),
the counts remained at levels sufficient for it to have beneficial                       the control SFY appeared relatively uniform with a smooth
effects as a probiotic by FAO/WHO standards (>6 log CFUg−1 )                             surface. The micrographs in Figures 5B,C indicated that the
(70). Moreover, no coliforms, yeasts, and molds were detected                            microstructure of the free-supplement fortified products (T1
in any treatments either when fresh or throughout the storage                            and T2 ) were affected, showing a clumpy porous structure that
period (data not shown), However, yeasts and molds started to                            reflected the decreased WHC values (Table 2). On the other
be detected after 21 days of storage in the samples fortified with                       hand, nanocapsule-fortified products (T3 and T4 ) exhibited an
free supplements (T1 and T2 ).                                                           intact microstructure with fewer gaps between the particles and

Frontiers in Nutrition | www.frontiersin.org                                         9                                                April 2021 | Volume 8 | Article 654624
Darwish et al.                                                                                                                  Nano-capsules in Functional Yogurt Enhance Anemia

TABLE 3 | Color parameters of SFY.

Treatments                           Storage period (days)                                     L*                                        a*                                       b*

C                                                 1                                    88.80aB ± 0.28                           −0.96bA ± 0.04                              8.67aA ± 0.12
                                                 21                                    88.49bB ± 0.13                           −0.75aB ± 0.02                              8.19bA ± 0.05
T1                                                1                                    84.53aA ± 0.09                            0.57bB ± 0.03                              12.88aC ± 0.14
                                                                                               bA                                       aA
                                                 21                                    84.12        ± 0.01                       1.98        ± 0.04                         11.28bC ± 0.07
                                                                                               aA                                       bB
T2                                                1                                    83.69        ± 0.20                       0.46        ± 0.01                         14.36aC ± 0.16
                                                                                               bA                                       aA
                                                 21                                    83.21        ± 0.04                       1.53        ± 0.02                         13.02bC ± 0.02
                                                                                               aB                                       bC
T3                                                1                                    88.86        ± 0.26                      −0.25         ± 0.02                        9.79aB ± 0.08
                                                                                               bB                                       aD
                                                 21                                    88.78        ± 0.30                       0.08        ± 0.01                         9.27bB ± 0.04
                                                                                               aB                                       bC
T4                                                1                                    88.82        ± 0.19                      −0.32         ± 0.02                        9.89aB ± 0.08
                                                                                               bB                                       aD
                                                 21                                    87.80        ± 0.14                       0.02        ± 0.01                         9.66bB ± 0.07

Data represented as means of duplicates ±SD. C, Control plain SFY; T1 , SFY fortified with free Fe + ascorbic acid; T2 , SFY fortified with free Fe + FA + ascorbic acid; T3 , SFY fortified
with Fe@ BSA-NPs + ascorbic acid; T4 , SFY fortified with Fe +FA @ BSA-NPs + ascorbic acid. * L, value represents lightness from black (0) to white (100), a, value represents color
ranging from red (+) to green (–); b, value represents yellow (+) to blue (–). Means in the same column followed by different lower-case letters and means in the same row followed by
different upper case letters are significantly different (p ≤ 0.05). BSA-NPs, Bovine Serum Albumin nanoparticles; FA, Folic Acid.

were softer and with higher WHC (Table 2). These results were                                       BIOLOGICAL EXPERIMENT
verified by the sensory evaluation (Figure 6) that showed that
the nanocapsule-fortified products (T3 and T4 ) were comparable                                     Impact of Fe Fortified Yogurt Diet on Body
to the control. Similar results reported positive effects of                                        and Relative Organ Weights
nanoencapsulation on microstructure have been reported by                                           The relative weight gain and organ weights of the liver, kidney,
El-Kholy (41).                                                                                      spleen, heart, and lungs of the rat groups are exhibited in
                                                                                                    Table 5. The results indicated that the relative body weights of the
                                                                                                    iron-deficiency anemia (IDA)-induced rats (G2) were severely
Sensory Evaluation                                                                                  affected and showed a significant decrease that reached 38%,
The effects of fortification on the sensory properties of SFY in                                    while the groups (G3–G6) treated with fortified SFY showed
the four fortified treatments comparing to plain control when                                       varied significant increases in the relative body weights compared
fresh and after 21 days of storage are illustrated in Figures 6A,B.                                 to induced group G2. G4 that received SFY fortified with
Overall, the acceptability scores of products fortified with                                        free Fe + FA showed a significant weight increase of up to
nanocapsules (T3 and T4 ) showed great similarity to the plain                                      35% with no mentioned effects on relative organ weights. It
control compared to products fortified with free supplements                                        was noteworthy that G3 that received the free Fe supplement
(T1 and T2 ). Obtained results agreed with previous researchers                                     showed the highest relative organs weights, which included the
who reported that fortification with microencapsulated ferrous                                      liver, kidney, spleen, and lungs at 4.23, 0.84, 0.88, and 0.86 g,
sulfate did not show notable effects on sensory properties                                          respectively, compared with negative control G1, positive control
and was similar to the control (71, 72). No changes were                                            G2, and the other treated groups G4–G6. Ferrous sulfate is
observed in the sensory parameters or acceptance after 21 days                                      a permitted Fe supplement food additive in many countries;
of cold storage in products fortified with nanocapsules (T3                                         however, it causes undesirable side effects. It is necessary to
and T4 ). These results indicated that the nano-encapsulation                                       develop new Fe supplements to increase Fe utilization and reduce
effectively reduced the negative changes in taste and odor,                                         its side effects (73). Nanotechnology is a means of decreasing the
thus improving the sensory properties of Fe and Fe + FA.                                            side effects while increasing its bioavailability (74).
These results agreed with Kim et al. (12), who reported that
Fe and ascorbic acid microcapsules are an effective means                                           Monitoring Fortification Effects on
of fortification and can fortify dairy products without any                                         Complete Blood Count
changes in sensory parameters. In contrast, 21 days of cold                                         Complete blood cell count (CBC) and red cell indices of rat
storage negatively affected the taste and odor of SFY fortified                                     groups throughout the 4 weeks of treatment are exhibited in
with free supplements (T1 and T2 ), and this was especially                                         Figures 7A,B. Figure 7A illustrates the complete blood count
due to the effect of lipids oxidation (Figure 4) on flavor.                                         represented in red blood cells (RBCs), protein hemoglobin
This observation agrees with Gaucheron (6), who reported                                            (Hb), white blood cells (comprising neutrophils, lymphocytes,
that fortification with Fe complex causes oxidation-related                                         monocytes, and eosinophils), and platelets of the rat groups
off-flavor. It also negatively affected the products’ color by                                      throughout the 4 weeks of treatment. The data revealed that the
imparting reddish-yellowness color to the SFY fortified with free                                   IDA was reflected in all blood parameters and showed decreased
supplements (T1 and T2 ), which was confirmed by color analyses                                     levels in the anemia-induced rat group G2 compared to the
(Table 3).                                                                                          healthy control group G1. Treatments with Fe supplemented SFY

Frontiers in Nutrition | www.frontiersin.org                                                10                                                        April 2021 | Volume 8 | Article 654624
Darwish et al. Nano-capsules in Functional Yogurt Enhance Anemia FIGURE 3 | Phenolic, flavonoid content, and antioxidant potentials in SFY during storage. (A) Total phenolic content (TPC) (µg gallic acid equivalents/g sample). (B) Total flavonoid content (TFC) (µg catechol equivalents/g sample). (C) Antioxidant potentials represented as IC50 (mg mL−1 ), the inhibitory concentration at which 50% of DPPH radical is scavenged. Data represented are means of duplicates ±SD. C, Control plain SFY; T1 , SFY fortified with free Fe + ascorbic acid; T2 , SFY fortified with free Fe + FA + ascorbic acid; T3 , SFY fortified with Fe@BSA-NPs + ascorbic acid; T4 , SFY fortified with Fe +FA @BSA-NPs + ascorbic acid. BSA-NPs, Bovine Serum Albumin nanoparticles; FA, Folic Acid. Frontiers in Nutrition | www.frontiersin.org 11 April 2021 | Volume 8 | Article 654624
Darwish et al.                                                                                                         Nano-capsules in Functional Yogurt Enhance Anemia

 FIGURE 4 | Lipid oxidation in stirred functional yogurt during storage. (A) Thiobarbituric acid reactive substances (TBARS) value. (B) Peroxide value. Data represented
 are means of duplicates ±SD. C, Control plain SFY; T1 , SFY fortified with free Fe + ascorbic acid; T2 , SFY fortified with free Fe + FA + ascorbic acid; T3 , SFY fortified
 with Fe@BSA-NPs + ascorbic acid; T4 , SFY fortified with Fe +FA @BSA-NPs + ascorbic acid. BSA-NPs, Bovine Serum Albumin nanoparticles; FA, Folic Acid.

products (G3–G6) achieved gradual enhancements in all blood                               (17.025 µgdL−1 ) and transferrin levels (259.75, 284.5, 246, and
parameters throughout the 4 weeks of feeding. In the fourth week                          299.75 mg dL−1 ), and the control (252.75 mg dL−1 ), as illustrated
of treatment, the RBCs counts in the treated groups G3, G4, G5,                           in Figures 7C,F, which showed the same pattern as the blood cell
and G6 were 11.40, 12.70, 13.80, and 18 106 µL−1 , respectively,                          count. The restoration of blood Hb from (8.30 gdL−1 ) in the IDA
compared to the 6.17 106 µL−1 in the healthy control group G1.                            induced group G2 was more pronounced in G5 and G6, which
The same pattern was recorded for red cell indices illustrated in                         received Fe nanocapsules (16.27 and 16.53 gdL−1 , respectively),
Figure 7B. This regeneration of blood cells was correlated with                           and this was more than in groups G3 and G4, which received
the significantly elevated Fe (93, 132.5, 91, and 109.25 µgdL−1 ),                        the free forms with recorded Hb levels (15.48 and 15.53 gdL−1 ,
compared to the induced group G2 (81.75 µgdL−1 ) and ferritin                             respectively). These results encourage recommending nano-
(27.5, 30, 30.5, and 33.25 µgdL−1 ) levels, the induced group G2                          encapsulation as an efficient form of Fe delivery, especially in IDA

Frontiers in Nutrition | www.frontiersin.org                                         12                                                April 2021 | Volume 8 | Article 654624
Darwish et al.                                                                                                                  Nano-capsules in Functional Yogurt Enhance Anemia

TABLE 4 | Microbiological analysis (Log10 CFUg−1 ) of SFY during storage.

                                                                                       Storage period (days)

Treatment                                 Fresh                               7                                 14                              21                              Means

S. thermophilus
C                                     7.42 ± 0. 10                      7.39 ± 0.08                      7. 25 ± 0.07                     7. 05 ± 0.06                           7.28A
T1                                     7.44 ± 0.11                      7.41 ± 0.08                      7.30 ± 0.06                       7.10 ± 0.03                           7.31A
T2                                     7.45 ± 0.08                      7.42 ± 0.10                      7.33 ± 0.07                       7.12 ± 0.03                           7.33A
T3                                     7.42 ± 0.11                      7.39 ± 0.10                      7.24 ± 0.06                       7.07 ± 0.01                           7.28A
T4                                     7.43 ± 0.11                      7.40 ± 0.10                      7.27 ± 0.06                       7.09 ± 0.01                           7.30A
Means                                     7.43a                             7.40a                              7.28b                          7.09c                         LSD = 0. 082
L. bulgaricus
C                                      7.18 ± 0.10                      7.16 ± 0.10                      7.12 ± 0.07                       6.88 ± 0.01                           7.08A
T1                                     7.19 ± 0.10                      7.18 ± 0.08                      7.15 ± 0.07                       6.93 ± 0.03                           7.11A
T2                                     7.20 ± 0.11                      7.18 ± 0.10                      7.15 ± 0.08                       6.95 ± 0.04                           7.12A
T3                                     7.23 ± 0.13                      7.20 ± 0.10                      7.12 ± 0.07                       6.83 ± 0.03                           7.09A
T4                                     7.24 ± 013                       7.22 ± 0.10                      7.13 ± 0.07                       6.82 ± 0.03                           7.10A
                                                 a                                 a                                  a                              b
Means                                     7.21                              7.19                               7.13                           6.88                          LSD = 0.088
L. acidophilus
C                                      7.15 ± 0.10                      7.13 ± 0.08                      7.06 ± 0.06                       6.86 ± 0.01                           7.05B
T1                                    7. 39 ± 0.13                      7.38 ± 0.11                      7.30 ± 0.08                       7.11 ± 0.06                           7.30A
T2                                    7. 40 ± 0.13                      7.39 ± 0.11                      7.33 ± 0.07                       7.15 ± 0.03                           7.31A
T3                                     7.14 ± 0.08                      7.11 ± 0.07                      7.02 ± 0.04                      6. 88 ± 0.03                           7.04B
T4                                     7.16 ± 0.08                      7.13 ± 0.07                      7.06 ± 0.06                      6. 92 ± 0.03                           7.06B
Means                                     7.25a                             7.23a                              7.15b                          6.98c                         LSD = 0.083
B. bifidum
C                                      7.15 ± 0.10                      7.12 ± 0.08                      6.94 ± 0.04                       6.71 ± 0.01                           6.98A
T1                                     7.14 ± 0.10                      7.12 ± 0.08                      6.92 ± 0.04                       6.75 ± 0.01                           6.98A
T2                                     7.16 ± 0.10                      7.15 ± 0.10                      6.96 ± 0.04                       6.73 ± 0.02                           7.00A
T3                                    7. 15 ± 0.09                      7.13 ± 0.08                      6.96 ± 0.07                       6.74 ± 0.07                           6.99A
T4                                    7. 17 ± 0.07                      7.15 ± 0.07                      6.98 ± 0.04                       6.75 ± 0.02                          7.01 A
                                                 a                                 a                                  b                              c
Means                                     7.15                              7.13                               6.95                           6.74                          LSD = 0.073

Data represented as means of duplicates ±SD. C, Control plain SFY; T1 , SFY fortified with free Fe + ascorbic acid; T2 , SFY fortified with free Fe + FA + ascorbic acid; T3 , SFY fortified
with Fe@ BSA-NPs + ascorbic acid; T4 , SFY fortified with Fe +FA @ BSA-NPs + ascorbic acid. LSD, Least significant differences at 0.05 % level. Means with different superscripts in
a row or column are significantly different at p ≤ 0.05 level. BSA-NPs, Bovine Serum Albumin nanoparticles; FA, Folic Acid.

treatment. Targeted drug delivery refers to nanocarriers carrying                                  reached (81.75 µgdL−1 and 26.67%, respectively) in the IDA-
drugs to organs, tissues, and cells through local or systemic                                      induced group (G2). Treatments with different Fe forms in SFY
blood circulation, which allows the drugs to act directly on the                                   products succeeded in restoring serum Fe levels with varied
targeted disease sites and thus more effectively generating their                                  responses. The highest serum Fe content was recorded for G4
curative effects (75). No adverse effects on blood parameters or                                   (132.5 µgdL−1 ), which was significantly higher than the healthy
indices were recorded, which is unlike the significant changes that                                control rat group G1 (108.5 µgdL−1 ), followed by G6 (109.25
were reported for WBC, HCT, MCV, and MCHC in hematology                                            µgdL−1 ), which was comparable to control group G1. The serum
parameters after NP treatment (76). This may refer to size-, dose-,                                calcium and zinc concentrations were inversely correlated with
and coating-dependent uptake of NPs (77). Additionally, the                                        the Fe concentrations, as shown in Figures 7D,E, respectively.
overall stability shown by the physicochemical characterization                                    The Fe-Ca and Fe-Zn interactions and competition in absorbance
of BSA-NPs loaded with Fe or FA (Table 1) may interlink with its                                   have been previously documented; over a range of “physiological”
safe consumption results.                                                                          calcium intakes, Fe absorption was inversely correlated to the
                                                                                                   calcium content of the meal (78). Additionally, the Fe:Zn molar
Fortification Effects on Serum Profile of                                                          ratio was shown to be an important determinant of Fe-Zn
Rat Groups                                                                                         interactions. A significant reduction in Zn absorption from Zn
Figures 7C–F exhibits the impact of fortification on the serum                                     solution in water was observed when Fe:Zn was 25:1 (79).
mineral and protein profiles of the rat groups. Figure 7C                                             The serum protein profile Figure 7F shows different patterns.
indicated that serum Fe parameters: Fe and transferrin saturation                                  Ferritin is a blood cell protein-containing Fe that stores Fe
(TS) were negatively affected, showing the significant decreases                                   in tissues and is a well-known IDA marker (2). The rat

Frontiers in Nutrition | www.frontiersin.org                                                  13                                                 April 2021 | Volume 8 | Article 654624
You can also read