Physical and chemical properties of urban aerosols in São Paulo, Brazil: links between composition and size distribution of submicron particles
←
→
Page content transcription
If your browser does not render page correctly, please read the page content below
Atmos. Chem. Phys., 21, 8761–8773, 2021
https://doi.org/10.5194/acp-21-8761-2021
© Author(s) 2021. This work is distributed under
the Creative Commons Attribution 4.0 License.

Physical and chemical properties of urban aerosols
in São Paulo, Brazil: links between composition
and size distribution of submicron particles
Djacinto Monteiro dos Santos1 , Luciana Varanda Rizzo2 , Samara Carbone3 , Patrick Schlag1,a , and Paulo Artaxo1
1 Instituteof Physics, University of São Paulo, São Paulo, Brazil
2 Institutode Ciências Ambientais, Químicas e Farmacêuticas, Universidade Federal de São Paulo, Diadema, São Paulo, Brazil
3 Federal University of Uberlândia, Uberlândia, Minas Gerais, Brazil
a now at: Shimadzu Deutschland GmbH, 47269 Duisburg, Germany

Correspondence: Djacinto Monteiro dos Santos (djunior@if.usp.br)

Received: 2 June 2020 – Discussion started: 25 January 2021
Revised: 22 April 2021 – Accepted: 10 May 2021 – Published: 10 June 2021

Abstract. In this work, the relationships between size and      ticle growth processes. Submicron mass loading in the ac-
composition of submicron particles (PM1 ) were analyzed         cumulation mode was mostly associated with highly oxi-
at an urban site in the Metropolitan Area of São Paulo          dized OOA and also traffic-related emissions. To the au-
(MASP), a megacity with about 21 million inhabitants. The       thors’ knowledge, this is the first work that uses the MLR
measurements were carried out from 20 December 2016 to          methodology to estimate the chemical composition of the
15 March 2017. The chemical composition was measured            different aerosol size modes. The chemical composition with
with an Aerodyne Aerosol Chemical Speciation Monitor and        size-dependent PM provides innovative information on the
size distribution with a TSI Scanning Mobility Particle Sizer   properties of both primary and secondary organic aerosols,
3082. PM1 mass concentrations in the MASP had an av-            as well as inorganic aerosols in a complex urban environ-
erage mass concentration of 11.4 µg m−3 . Organic aerosol       ment. The results emphasize the relevance of vehicular emis-
(OA) dominated the PM1 composition (56 %), followed by          sions to the air quality at MASP and highlight the key role of
sulfate (15 %) and equivalent black carbon (eBC, 13 %).         secondary processes on the PM1 ambient concentrations in
Four OA classes were identified using positive matrix fac-      the region since 56 % of PM1 mass loading was attributed to
torization: oxygenated organic aerosol (OOA, 40 % of OA),       SOA and secondary inorganic aerosol.
biomass burning organic aerosol (BBOA, 13 %), and two
hydrocarbon-like OA components (a typical HOA related to
vehicular emissions (16 %) and a second HOA (21 %) rep-
resenting a mix of anthropogenic sources). Particle number      1   Introduction
concentrations averaged 12 100 ± 6900 cm−3 , dominated by
the Aitken mode. The accumulation mode increased under          Air pollution has become a major problem in large urban
relatively high-PM1 conditions, suggesting an enhancement       conglomerates, particularly in megacities with a population
of secondary organic aerosol (SOA) production. Conversely,      exceeding 10 million inhabitants (Fuzzi et al., 2015). In these
the contribution of nucleation-mode particles was less depen-   megacities, industrial and vehicular emissions are generally
dent on PM1 levels, consistent with vehicular emissions. The    the main air pollution sources (Beirle et al., 2011; Zhu et al.,
relationship between aerosol size modes and PM1 compo-          2012). The Metropolitan Area of São Paulo (MASP) is the
sition was assessed by multilinear regression (MLR) mod-        largest South American megacity, with a population of about
els. Secondary inorganic aerosols were partitioned between      21 million inhabitants (IBGE, 2021), an area of 7947 km2
Aitken and accumulation modes, related to condensation par-     comprising 39 municipalities, and a fleet of 8 million ve-
                                                                hicles. An important characteristic of the Brazilian vehicle

Published by Copernicus Publications on behalf of the European Geosciences Union.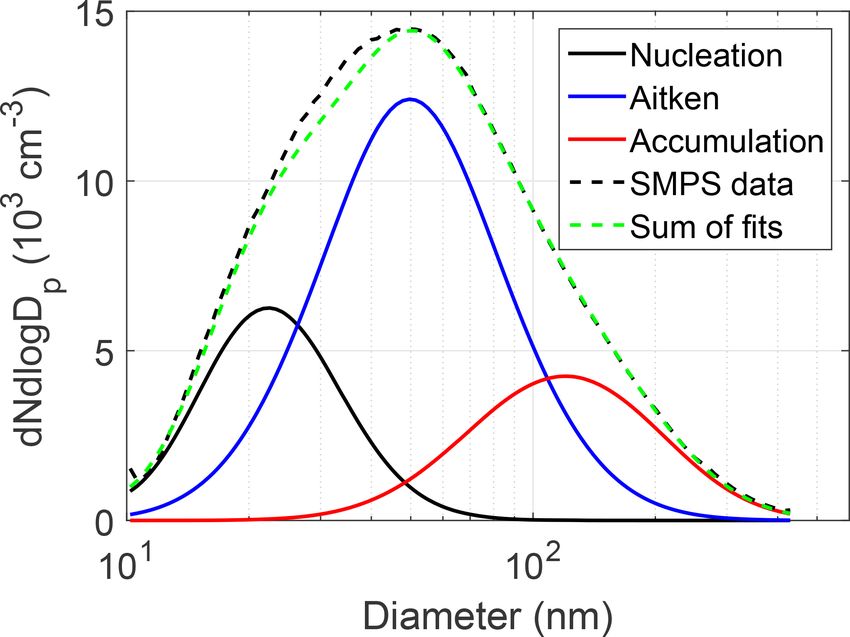
8762                       D. Monteiro dos Santos et al.: Physical and chemical properties of urban aerosols in São Paulo

fleet is that gasohol with 24 % ethanol and pure ethanol are       2     Methodology
the main fuels, making Brazil, and especially the MASP,
a unique case of large-scale biofuel usage worldwide. Suc-         2.1    Sampling site and measurements
cessful public policies for controlling and monitoring indus-
trial and vehicular pollutant sources have been implemented        An aerosol and trace gas monitoring station was operated
over recent decades in the MASP, leading to positive impacts       at one of the municipalities of the Metropolitan Area of
in reducing the emission of primary pollutants to the atmo-        São Paulo (MASP), at the Federal University of São Paulo
sphere (Andrade et al., 2017). However, many uncertainties         (UNIFESP, 23◦ 430 800 S, 46◦ 370 4000 W, 769 m above mean sea
are still found on the effect of emission reduction policies       level) in Diadema city (Fig. 1). The municipality of Diadema
on the concentration of secondary pollutants, for example,         is located 20 km southeast from São Paulo downtown in a re-
ozone and secondary aerosols.                                      gion characterized by high population density and strong ve-
   Aerosol particles have recognized effects on human health       hicular impact, besides emissions from industrial activities
(Cohen et al., 2017) and affect the Earth’s radiation bud-         and proximity to preserved Atlantic forest areas. The com-
get (Boucher et al., 2013). However, the knowledge of the          bination of different anthropogenic and biogenic emissions
dynamics of physicochemical properties of submicron par-           results in complex physicochemical processes that promote
ticles remains limited. The chemical composition and the           the formation of SOA and ozone.
size distribution of ambient aerosol are key parameters con-          The measurements were carried out from 20 December
cerning its optical properties (Romano et al., 2019), abil-        2016 to 15 March 2017, comprising 105 d of data acqui-
ity to act as cloud condensation nuclei (CCN) (Che et al.,         sition. Trace gas analyzers Thermo 49i and Thermo 43i
2016), and deposition efficiency into the human respiratory        were used to monitor the concentration of trace gases O3
tract (Ching and Kajino, 2018). Furthermore, aerosol proper-       and SO2 , respectively. NO2 concentration was monitored us-
ties range widely in the atmosphere as a result of interaction     ing a cavity attenuated phase shift (CAPS, Aerodyne Re-
between local and regional sources (Costabile et al., 2009)        search Inc.) analyzer. Submicron particle number size dis-
and atmospheric processing (Jimenez et al., 2009). There-          tributions (PNSD) in the range 10–450 nm were measured
fore, a current scientific effort is the characterization of the   every 2 min, using TSI-SMPS Model 3082, associated with
mechanisms of aerosol production and aging under ambient           TSI-CPC Model 3772. Particle absorption coefficients were
conditions, in particular the formation of secondary organic       measured at 637 nm using a Thermo Scientific Model 5012
aerosols (SOA).                                                    MAAP (multi-angle absorption photometer), compensated
   Source apportionment studies carried out at MASP (Cas-          by a +5 % factor and converted to equivalent black carbon
tanho and Artaxo, 2001; Andrade et al., 2012; Pereira et al.,      (eBC) mass concentration assuming a mass absorption effi-
2017; de Miranda et al., 2018) have shown that vehicle traf-       ciency value of 6.6 m2 g−1 (Müller et al., 2011).
fic, resuspended soil dust, and secondary processes are the           The chemical composition of non-refractory submicron
main sources of PM2.5 in the region. Although such stud-           aerosol was measured using a quadrupole aerosol chemi-
ies have provided novel knowledge about the main air pollu-        cal speciation monitor (Q-ACSM, Aerodyne Research Inc.),
tion sources in MASP, most of them derived from filter-based       described in detail by Ng et al. (2011a). Briefly, aerosol
offline chemical analyses. Low-time-resolution offline mea-        particles are sampled using a PM2.5 cyclone inlet and fo-
surements are unable to describe the dynamic of the sources        cused through an aerodynamic lens forming a narrow particle
and processes of urban aerosols. To our knowledge, Brito           beam, which is transmitted into the detection chamber un-
et al. (2018) were the only ones to report high-resolution         der a high vacuum onto a 600 ◦ C vaporizer. According to Ng
measurements of chemical composition of submicron parti-           et al. (2011a) the aerodynamic lens used in the Q-ACSM has
cles recently in the MASP, so that conducting further studies      a high transmission efficiency in the aerodynamic diameter
in the region is fundamental for a better understanding of         range 70–500 nm. Non-refractory material is flash-vaporized
such dynamic processes.                                            and ionized by electron impact at 70 eV. According to their
   Herein, near-real-time PM1 chemical composition was             mass-to-charge ratio (m/z), the fragments are analyzed in the
evaluated, including black carbon, inorganic aerosols, and         quadrupole spectrometer. In this study, an averaging interval
chemical classes of organic aerosol, using positive matrix         of 30 min was adopted. The collection efficiency (CE, de-
factorization (PMF). Furthermore, the relationships between        fined as the ratio of the mass of particles detected by the in-
aerosol chemical composition and particle number size dis-         strument to the mass of particles introduced in the inlet) was
tribution (PNSD) were investigated by using a multilinear          calculated using the parametrization of Middlebrook et al.
regression (MLR) approach. The results presented here pro-         (2011) and resulted in an average of 0.45 ± 0.01. The trans-
vide innovative insights into the association between sources      mission of the ACSM lens makes the instrument measure
and processes governing physical–chemical properties of at-        particles from 70 nm to about 900 nm, normally referred to as
mospheric aerosol in a megacity largely impacted by traffic        PM1 . Detection limits of ACSM were calculated as 3 times
emissions and extensive biofuel usage.                             the average noise level, using data of ambient air sampled
                                                                   through a HEPA filter. For 30 min of averaging time, the 3σ

Atmos. Chem. Phys., 21, 8761–8773, 2021                                             https://doi.org/10.5194/acp-21-8761-2021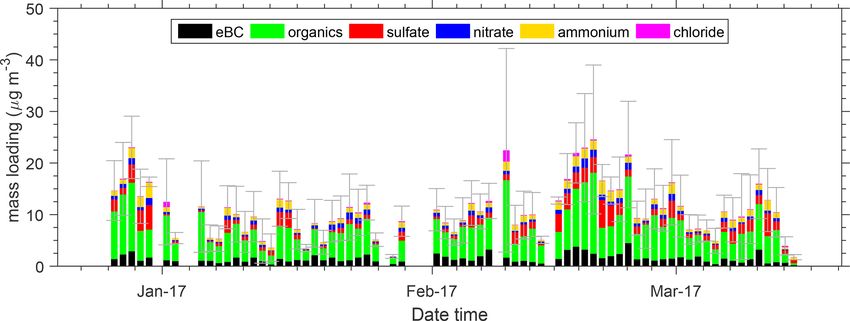
D. Monteiro dos Santos et al.: Physical and chemical properties of urban aerosols in São Paulo                                        8763

Figure 1. Map of Brazil indicating São Paulo state and showing a detailed view of the sampling site (red point), located in the southeastern
part of the MASP in Diadema city. Source: Esri, DigitalGlobe, GeoEye, Earthstar Geographics, CNES/Airbus DS, USDA, USGS, AeroGRID,
IGN, and the GIS User Community. Wind rose during the campaign was calculated from data from the Institute of Astronomy, Geophysics
and Atmospheric Sciences of the University of São Paulo (IAG) meteorological station.

detection limits for chloride, ammonium, nitrate, organics,             2.2    Identification of OA components with positive
and sulfate are 0.03, 0.36, 0.03, 0.57, and 0.09 µg m−3 , re-                  matrix factorization (PMF)
spectively.
   Ambient aerosols were sampled under dry conditions                   Positive matrix factorization (PMF) is a statistical model that
(RH < 40 %) using a nafion dryer, and concentrations were               uses weighted least-square fitting for factor analysis (Paatero
compensated for standard temperature and pressure condi-                and Tapper, 1994; Paatero, 1997). It uses a bilinear factor
tions (1013.25 mbar; 273.15 K). Aerosol and trace gas mea-              analytic model defined in matrix notation as follows:
surements were averaged in periods of 30 min. Meteorolog-
ical parameters (wind speed, wind direction, temperature,               X = GF + E,                                                     (1)
RH, solar radiation, and precipitation) were provided by the
                                                                        where X denotes the matrix of the measured values; G and F
Institute of Astronomy, Geophysics and Atmospheric Sci-
                                                                        are matrices computed by the model that represent the scores
ences of the University of São Paulo (IAG) meteorological
                                                                        and loading, respectively; and E is the residual matrix, made
station (23◦ 390 02.6100 S, 46◦ 370 18.5500 W), 10 km north from
                                                                        up of the elements eij . For the ACSM and AMS (aerosol
the sampling site.
                                                                        mass spectrometer) data, the measured organic mass spectra
                                                                        are apportioned in terms of source- and process-related com-
                                                                        ponents (Zhang et al., 2011). In this case, the columns j in
                                                                        X are the m/z ratios and each row i represents a single mass
                                                                        spectrum, G represents the time series and F the profile mass
                                                                        spectrum for the p factors computed by the algorithm. The

https://doi.org/10.5194/acp-21-8761-2021                                                   Atmos. Chem. Phys., 21, 8761–8773, 2021
8764 D. Monteiro dos Santos et al.: Physical and chemical properties of urban aerosols in São Paulo
model adjusts G and F using a least-squares algorithm that it- Table 1. Summarized statistics of meteorological data and mixing
eratively minimizes the quantity Q, defined as the sum of the ratios of trace gases from 20 December 2016 to 15 March 2017.
squared residuals weighted by their respective uncertainties: Statistics includes mean concentration, SD (σ ), median, and in-
terquartile interval (IQ).
m X n
eij 2
X
Q= , (2) Variables (and units) Mean (and σ ) Median (and IQ)
i=1 j =1
σij
RH (%) 79 (16) 85 (68–92)
where σij is the uncertainty for each element in the matrix X. Air temperature (◦ C) 23.0 (3.6) 22.1 (20.5–25.4)
An IGOR™ -based source finder (Canonaco et al., 2013, Sofi) Midday O3 (ppb) 43.5 (19.8) 40.6 (29.0–55.0)
with a multilinear engine algorithm (Paatero, 1999, ME-2) NO2 (ppb) 13.2 (8.9) 11.2 (5.9–18.8)
was used to prepare the data, estimate error, execute the anal- SO2 (ppb) 0.61 (0.85) 0.36 (0.19–0.67)
ysis, and evaluate the results.
2.3 Multilinear regression (MLR) model
in an MLR, the variance inflation factor (VIF; Hair et al.,
An analysis of the relationship between chemical composi- 2006) was determined. The VIF is a means of detecting mul-
tion and size distribution was performed using a multilin- ticollinearities between the independent variables of a model.
ear regression (MLR) model. Previous studies have applied If the VIF > 10, the multicollinearity is high and the variable
the MLR model to estimate aerosol mass scattering and ex- should be excluded (Hair et al., 2006). A fit linear regression
tinction efficiencies, and for source apportionment of optical model was performed using the fitlm function for MATLAB
properties (Ealo et al., 2018). A linear regression model de- 2015a by using a standard least-squares fit.
scribes the relationship between a dependent variable, y, and
one or more independent variables, x. The dependent vari-
able is also called the response variable, and independent 3 Results and discussion
variables are also called explanatory or predictor variables.
3.1 Meteorology and trace gases
The MLR model is as follows:
yi = β0 + β1 xi1 + β2 xi2 + . . . + βp xip + i , i = 1, . . ., n, (3) The campaign was carried out during the Southern Hemi-
sphere spring–summer, with an average (± SD) air temper-
where yi is the ith observation of the response variable, βj ature of 23.0 ± 3.5 ◦ C, varying from 14 to 33 ◦ C. RH was
is the j th coefficient, β0 is the constant term in the model, 79.6 ± 15.7 %, on average (Table 1). The monthly accumu-
xij is the ith observation on the j th predictor variable, j = lated precipitation ranged between 140 and 370 mm. The
1, . . ., p, and i is the ith error term. wind rose (Fig. 1) indicates dominant winds from the north-
For the MLR model, the time series of PM1 chemical con- east, northwest, and southeast along the measurement period.
stituents (i.e., eBC, inorganic species, and OA PMF-derived Average mixing ratios of trace gases are shown in Ta-
chemical classes) were used as dependent variables, and the ble 1. The midday O3 (averaged between 10:00–18:00 LT)
volume of particle size modes were taken as predictors. Ini- peak was 43.5 ppb, comparable to the measurements at the
tially, we use the volume of nucleation, Aitken, and accumu- Ibirapuera Park, one of the areas of MASP that often ex-
lation modes as independent variables in the model. How- ceeds ozone air quality standards (Andrade et al., 2017).
ever, the chemical mass balance has been violated for the The Diadema site is surrounded by green areas, an important
nucleation mode, suggesting that more particles in the nu- contributor source of biogenic volatile organic compounds,
cleation model are required by MLR than actual measure- adding to VOC (volatile organic compounds) emissions from
ment. This effect is caused by the fact that the nucleation anthropogenic sources (Brito et al., 2015), in promoting the
mode (local maximum at 22.5 nm) is out of the particle size formation of ground-level ozone and SOA. In the MASP, the
range measured by the ACSM (75–650 nm). Taking this into ozone levels are more sensitive to changes in VOC emissions
account, we modified the model, using Aitken and accumu- rather than NOX (VOC-limited), being the only pollutant that
lation modes as predictors. Since the nucleation mode repre- shows an increasing trend for concentrations in the MASP
sents only a small fraction of the aerosol volume (< 0.5 %), it over the years due to the large use of fossil fuel and biofuels
is reasonable to explain the PM mass concentration based on (Andrade et al., 2017).
these two modes. Volume size distribution was used in MLR The average NO2 concentration in this study was 13 ppb,
calculations since it represents the accumulation and Aitken significantly lower compared to São Paulo downtown (An-
modes better than number size distribution. drade et al., 2017). According to emission inventories
For MLR analysis, intercept (constant term in the model) (CETESB, 2019), vehicles account for 64 % of NOX emis-
was set to 0, as it holds no physical significance for the sions in the MASP, particularly diesel engines in HDVs
mass attribution. Since the presence of multicollinearity (i.e., (heavy-duty vehicles: mostly buses and trucks), which rep-
correlation between predictors) can adversely affect results resent 44 % of total NOX emissions. The average SO2 con-
Atmos. Chem. Phys., 21, 8761–8773, 2021 https://doi.org/10.5194/acp-21-8761-2021D. Monteiro dos Santos et al.: Physical and chemical properties of urban aerosols in São Paulo 8765
Figure 2. Time series of mass concentration of PM1 chemical species. Each bin represents 1 d average of measured data. The error bars
represent the SD of the sum of all components.
centration is 0.61 ppb, approximately half of the observed Table 2. Summarized statistics of near real-time aerosol measure-
values in São Paulo downtown during springtime in 2013 ments (PM1 and its individual constituents) from 20 December
(Monteiro dos Santos et al., 2016). Few episodes (15 % of 2016 to 15 March 2017. Statistics includes mean concentration, SD
the dataset) presented SO2 levels above 1 ppb. In the MASP, (σ ), median, and interquartile interval (IQ).
SO2 emissions are related to industrial sources and the sulfur
content in diesel and gasohol. Variables (and units) Mean (and σ ) Median (and IQ)
PM1 (µg m−3 ) 11.4 (7.8) 9.7 (5.9–14)
3.2 Aerosol chemical composition eBC (µg m−3 ) 1.5 (1.4) 1.1 (0.6–1.9)
Organics (µg m−3 ) 6.3 (5.0) 5.1 (3.2–7.7)
Near real-time submicron mass concentration (PM1 ) can be Sulfate (µg m−3 ) 1.6 (1.8) 1.02 (0.42–2.30)
obtained by the non-refractory PM1 (NR-PM1 ) and eBC Nitrate (µg m−3 ) 0.70 (0.67) 0.46 (0.24–0.98)
measurements (Table 2). Average PM1 ± SD during the cam- Ammonium (µg m−3 ) 1.03 (0.92) 0.77 (0.08–1.50)
paign was 11.4 ± 7.8 µg m−3 . These results are similar to ob- Chloride (µg m−3 ) 0.19 (0.34) 0.05 (0.01–0.13)
servations in São Paulo downtown (10.8 µg m−3 , Brito et al.,
2018, during the spring), New York (11.7 µg m−3 , Sun et al.,
2011, during the summer), Barcelona (18.5 µg m−3 , Mohr
et al., 2012, during the winter), and Santiago (18.1 µg m−3 , nent containing typical biomass burning spectral signature,
Carbone et al., 2013, during the spring). On average, or- named biomass burning organic aerosol (BBOA); and two
ganic aerosols dominated the composition, contributing up hydrocarbon-like OA components (HOAI and HOAII ) that
to 55 %, followed by sulfate (15 %) and eBC (14 %). Am- represent primary emissions from anthropogenic sources, but
monium (9 %), nitrate (6 %), and chloride (1 %) presented with distinct mass spectra and diurnal variability patterns.
smaller contributions to the mass loading. The time series of The OOA component is dominated by m/z 44, which is
PM1 chemical species in the submicron size range is shown mainly the fragment CO+ 2 (Zhang et al., 2005), typically
in Fig. 2. from thermal decarboxylation of organic acid groups, pre-
Components of OA were identified using PMF analysis viously described as aged aerosol and related to the for-
following the procedure described by Ulbrich et al. (2009). mation of SOA (Jimenez et al., 2009). The OOA factor is
The choice of the number of factors was based on the qual- the dominant component, comprising, on average, 40 % of
ity of the fit parameter, the correlation analysis with exter- OA total mass concentration. The mass spectrum of OOA
nal tracers, spectral analysis and comparisons with AMS (Fig. 3) correlates strongly with the standard AMS LV-OOA
database mass spectra, and their diurnal variability. More- mass spectra database (R = 0.99, Table 3), indicating that the
over, the examination of rotational ambiguity was done by OOA factor is dominated by low volatile organic compounds,
varying the FPEAK parameter. Solutions with more than rather than semi-volatile organic compounds (R = 0.72, Ta-
four factors were examined and showed only the splitting ble 3). The OOA time series present moderate correlations
behavior of existing factors, instead of providing new con- with oxidant concentration (OX = NO2 + O3 , Table 4) and
sistent factors. Details of the PMF analysis procedure are secondary inorganic species, such as sulfate, nitrate, and am-
given in the Supplement. The four OA factors identified in- monium. Moreover, the OOA mass concentration signifi-
clude: a highly oxidized component, linked to secondary pro- cantly increases in the afternoon, similarly to the ozone diels
cesses, named oxygenated organic aerosol (OOA); a compo- (Fig. 4), indicating that its formation is partially driven by
https://doi.org/10.5194/acp-21-8761-2021 Atmos. Chem. Phys., 21, 8761–8773, 20218766 D. Monteiro dos Santos et al.: Physical and chemical properties of urban aerosols in São Paulo
Table 4. Pearson correlation coefficients (R) between time series of
OA factors and time series of aerosol components and trace gases.
Aerosol components include sulfate, nitrate, ammonium, chloride,
and equivalent black carbon time series. Trace gases include sulfur
dioxide, nitrogen dioxide, ozone, and oxidant concentration (Ox =
O3 + NO2 ) time series.
Pearson correlation (R) OOA HOA I HOA II BBOA
with external tracers
OX 0.48 −0.06 −0.07 −0.03
Sulfate 0.46 0.04 0.04 0.15
SO2 0.35 0.08 0.07 0.08
Ammonium 0.53 0.16 0.19 0.30
Nitrate 0.63 0.43 0.58 0.48
eBC 0.40 0.45 0.69 0.47
NO2 0.23 0.55 0.60 0.31
O3 0.36 −0.23 −0.28 −0.14
Chloride 0.19 0.23 0.32 0.58
Figure 3. PMF mass spectra of the four PMF solutions con-
taining oxygenated organic aerosol (OOA), biomass burning or-
ganic aerosols (BBOA) and two hydrocarbon-like organic aerosols
(HOAI and HOAII ). (R = 0.56) (Table 4). The average contribution of BBOA is
13 % of total OA and almost 7 % of PM1 , significantly lower
Table 3. Pearson correlation coefficients (R) between mass spectra than reported in Pereira et al. (2017), who found consider-
of OA PMF factors and AMS database (http://cires1.colorado.edu/ able biomass burning contributions (approximately 18 % of
jimenez-group/AMSsd/, last access: 7 June 2021). PM2.5 ) associated with long-range transport from regional
sugarcane burning in São Paulo during wintertime, in addi-
Pearson correlation (R) OOA HOA I BBOA HOA II tion to local emission sources.
with AMS database Both HOA components present mass spectra characterized
HOA (Ng et al., 2011b) 0.26 0.90 0.53 0.89 by hydrocarbon-like structures typical of alkanes, alkenes,
SV-OOA (Ng et al., 2011b) 0.72 0.68 0.70 0.58 and cycloalkanes (m/z ratios of 27, 29, 41, 43, 55, 57, 67,
LV-OOA (Ng et al., 2011b) 0.99 0.30 0.41 0.10 69, 71, 81, 83, 85) related to anthropogenic primary emis-
OOA (Ng et al., 2011b) 0.98 0.30 0.41 0.10 sions (Canagaratna et al., 2004; Zhang et al., 2005). Both
BBOA (Ng et al., 2011b) 0.64 0.79 0.90 0.52 mass spectra correlate with the AMS standard HOA mass
spectrum (R = 0.90 and R = 0.89 for HOAI and HOAII , re-
spectively). Although both factors are HOA related, it is not
photochemistry. Considering the sum of secondary inorganic reasonable to interpret them as a split of the same source. The
aerosols (sulfate, nitrate, and ammonium) and SOA (OOA) HOAI factor presents an elevated signal at m/z 55 that has
as a lower limit for the contribution of secondary aerosols to been related to cooking OA (COA), an important source of
the total of PM1 , it is possible to estimate that at least 56 % primary organic aerosol (POA) in urban environments (Mohr
of submicron particles mass loading results from secondary et al., 2012). The HOAII factor presents a higher signal at
production. m/z 57 than at m/z 55, and higher correlation with eBC
The BBOA component has a mass spectrum dominated (RHOAII = 0.69, RHOAI = 0.45), which is related to vehicular
by the m/z ratios of 29, 60, and 73 (Fig. 3). The signal at emissions in the MASP, mostly heavy-duty vehicles (de Mi-
m/z 60 is associated with the C2 H4 O+ ion (Alfarra et al., randa et al., 2018). The results indicate that HOAII is more
2007) and correlates with levoglucosan and similar anhydro- consistent with traffic, while the HOAI seems like a mixture
sugar species (mannosan, galactosan) that result from the py- of anthropogenic sources. Together, the HOA factors present
rolysis of cellulose. The BBOA mass spectrum presents a an average contribution of 37 % to OA (21 % from HOAI
strong correlation with standard AMS database BBOA (R = and 16 % from HOAII ). For both HOA factors, the diurnal
0.90, Table 3). The diurnal variability of BBOA (Fig. 4), profiles of mass concentrations (Fig. 4) increase during the
with an average concentration almost 3 times higher dur- traffic rush hour time, 06:00-08:00 LT. However, HOAI also
ing nighttime, seems modulated by atmospheric dynamics, shows a peak between 12:00 and 14:00 LT, probably associ-
such as boundary layer height evolution. The boundary layer ated with local cooking activities.
height decreases during nighttime, trapping freshly emitted Although the sampling site is located in an industrialized
smoke particles. The time series of BBOA correlates moder- region, a distinct industrial-related OA factor could not be
ately with eBC (R = 0.47), nitrate (R = 0.48) and chloride identified in this study. As a matter of comparison, Bozzetti
Atmos. Chem. Phys., 21, 8761–8773, 2021 https://doi.org/10.5194/acp-21-8761-2021D. Monteiro dos Santos et al.: Physical and chemical properties of urban aerosols in São Paulo 8767
Figure 4. Diurnal trends for OA PMF factors (OOA, HOAI , BBOA, and HOAII ); black carbon, sulfate, nitrate, ammonium trace gases (NO2 ,
SO2 , and O3 ); and geometric mean diameter, and submicrometer aerosol modes (nucleation, Aitken, and accumulation). Solid line represents
the median and shaded areas represent the interquartile interval.
et al. (2017) identified OA related to industrial emissions in The algorithm automatically decides between two or three
an urban background site in Marseille under the influence mode fittings based on the percentual concentration of 10–
of industries and petrochemical companies. Some similari- 40 nm particles, and based on goodness-of-fit proxies like the
ties can be observed between the mass spectrum of HOAI root mean square error and the ratio between fit and data to-
in this study and the mass spectrum of industrial-related OA tal particle number concentration. The algorithm is able to
that they found, particularly substantial signals at m/z 27, automatically reduce the number of fitted modes (from three
m/z 29, m/z 43, and m/z 55. This fact could indicate the to two modes and from two modes to one mode) if a com-
influence of industrial emissions on HOAI ; however, further plete superposition is detected, based on the ratio between the
investigation is necessary. Furthermore, a significant part of modes Dpg. The algorithm uses the previous fitting parame-
ammonium sulfate could be produced from the oxidation of ters as a first guess to the current fitting, so that continuity is
anthropogenic SO2 from industrial sources. favored.
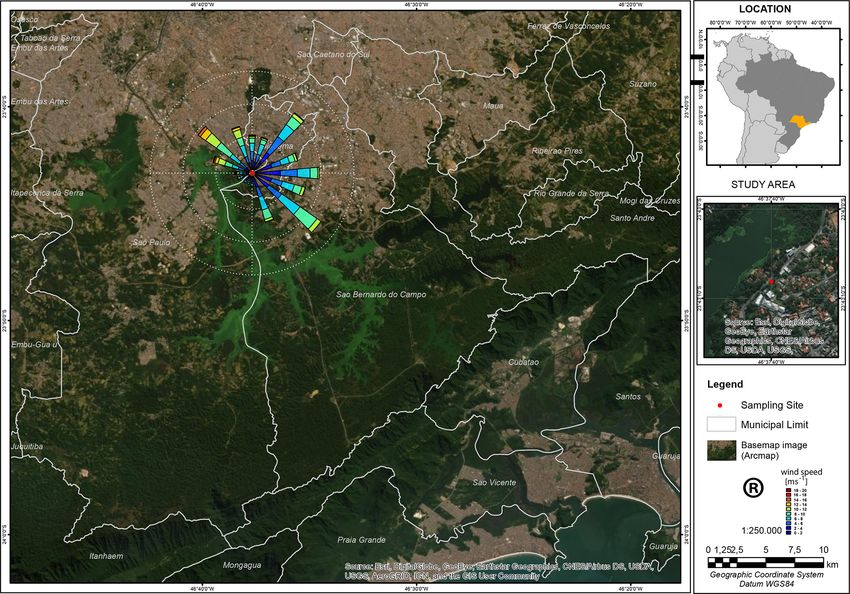
Considering the average PNSD, nucleation, Aitken, and
3.3 Aerosol size modes accumulation modes were centered at mobility diameters of
22, 50, and 122 nm, respectively (Fig. 5). For nucleation
An algorithm in MATLAB was developed to fit one to three and Aitken modes these results are very similar to previ-
lognormal modes to the measured particle number size dis- ous observations in the São Paulo region during spring and
tributions, based on Hussein et al. (2005), using the standard early summer (Backman et al., 2012); however, the diam-
method of least-squares. The center of each mode is allowed eter for the accumulation mode is significantly lower than
to vary from one size distribution to another, constrained to that reported in such studies (> 200 nm). The sum of the
the following diameter ranges: nucleation-mode mean geo- number concentration of nucleation, Aitken, and accumula-
metric diameter (Dpg) must be smaller than 30 nm; Aitken- tion modes explains the measured total particle number con-
mode Dpg must be ≥ 30 and < 90 nm; accumulation-mode centration (slope = 0.98 and R 2 = 0.99). The Aitken mode
Dpg must be ≥ 90 nm. There is also a restriction in the geo- dominated the PNSD with an average concentration ± SD of
metric SD, which must be within 1.2 and 2.1 for all modes. 6900 ± 4600 cm−3 (56 % of total number concentration) fol-
https://doi.org/10.5194/acp-21-8761-2021 Atmos. Chem. Phys., 21, 8761–8773, 20218768 D. Monteiro dos Santos et al.: Physical and chemical properties of urban aerosols in São Paulo Figure 5. Average particle number size distribution for measured and lognormal fits for nucleation, Aitken, and accumulation modes. Mean geometric diameter (and geometric SD) of the modes are 12.6 nm (1.2 nm), 30.7 nm (1.3 nm), and 83.8 nm (1.3 nm). The lo- cal maximum of the number distribution (mode diameter) is at 22.5 nm for nucleation, at 49.6 nm for Aitken, and at 121.9 nm for accumulation modes. The average ± SD for particle number con- centration is 12 500 ± 7200 cm−3 . lowed by the nucleation mode, with average particle number concentration of 2800 ± 2100 cm−3 . The contribution of the accumulation mode is the lowest in terms of particle num- ber (19 % of total number concentration), but the highest in terms of particle volume concentration. The nucleation Figure 6. PNSD for nucleation, Aitken, and accumulation modes mode presented a peak concentration in the morning rush under high (black) and low (green) PM1 levels. Solid line repre- hour, similar to eBC, HOAII , and NO2 (Fig. 4). Backman sents median PNSD. Shaded areas represent the interquartile inter- et al. (2012) identified similar diurnal cycles for nucleation- val. PM1 values higher than 75th percentile of time series are con- mode particles and attributed it to vehicular emissions and sidered high-PM1 concentrations and PM1 values lower than 25th new particle formation (NPF) events. The nucleation-mode percentile of time series are considered low-PM1 concentrations. peak in the morning is consistent with a simultaneous drop in the particle mean geometric diameter. Conversely, in the afternoon a strong increase in accumulation-mode particles Considering that nucleation-mode particles are mainly traffic was observed, simultaneously with the larger presence of related (Fig. 4), its relative contribution to the total number secondary species such as OOA, sulfate, and O3 . Similarly, concentration tends to increase during low-PM1 episodes. Aitken-mode particles increase during the afternoon. Ac- The results are similar to Martins et al. (2010), where aerosol cording to Backman et al. (2012) the shift from nucleation to size distributions were measured during a transition period Aitken mode can be attributed to the growth of pre-existing between a highly polluted episode and a clean one in São nucleation-mode particles into the Aitken regime. Paulo downtown. The authors found particles distributed in Figure 6 shows median PNSD for nucleation, Aitken, the nucleation and Aitken mode during the clean period, and and accumulation modes under low (below 25th percentile) larger geometric mean diameters during polluted periods, and high (above 75th percentile) PM1 concentrations. From with particles partitioned between Aitken and accumulation this comparison, total number concentrations increase from modes. At the MASP, the meteorological conditions that fa- 7000 cm−3 (for PM1 < 5.6 µg m−3 ) to 18 400 cm−3 (for vor the occurrence of high PM concentrations are typically PM1 > 13.7 µg m−3 ). Interestingly, the enhancement differs a low boundary layer with a low inversion layer, weak ven- notably between aerosol size modes. The accumulation tilation, absence of precipitation and clear skies (Sánchez- mode shows the largest increase from low-PM1 conditions Ccoyllo and Andrade, 2002; Santos et al., 2018), favoring (1200 cm−3 ) to high-PM1 conditions (5200 cm−3 ). On the aerosol secondary production and particle size increase by other hand, the nucleation mode shows a smaller increase condensation. Similarly, Rodríguez et al. (2007) attributed from low-PM1 to high-PM1 scenario, and therefore the con- high ultrafine particle events to low PM2.5 conditions in Mi- tribution of the nucleation-mode particles to the total num- lan, Barcelona, and London. The authors also found that ber concentration is higher under low PM1 (30 %) than un- high PM2.5 pollution events tend to occur when condensa- der high PM1 (16 %). Local traffic emissions likely remain at tion processes produce significant number concentrations of similar levels during both low-PM1 and high-PM1 episodes. accumulation-mode particles. Atmos. Chem. Phys., 21, 8761–8773, 2021 https://doi.org/10.5194/acp-21-8761-2021
D. Monteiro dos Santos et al.: Physical and chemical properties of urban aerosols in São Paulo                                   8769

Figure 7. Contributions of aerosols size modes into mass concentrations for PM1 chemical species and confidence intervals. Results from
the MLR model.

Figure 8. Reconstructed mass loading into Aitken and accumulation modes, as attributed by the MLR model.

   The strong occurrence of accumulation-mode particles un-           species. For predictors used in MLR, the calculated variance
der polluted conditions can be explained by the fact that a           inflation factor (VIF) was in the range of 1.11 to 2.16. In
larger surface area of pre-existing particles favors coagula-         general, VIFs below 10 indicate no collinearity (Hair et al.,
tion processes. Consequently, nucleation is suppressed by             2006), ensuring the reliability of the regression results.
coagulation loss and particles become larger. Moreover, the              Contribution of aerosol size modes to mass concentrations
submicron aerosol size distribution is strongly influenced by         of PM1 chemical species (Fig. 7) was obtained by multi-
the competition between nucleation of new particles and con-          plying regression coefficients (Table 5) and average volume
densation of gas-phase components onto pre-existing parti-            concentrations. Their confidence intervals were calculated
cles (Rodríguez et al., 2005). Under polluted conditions, the         according to the confidence intervals of regression coeffi-
aerosol surface is enough to favor the condensation of vapors         cients. PM1 mass loadings were reconstructed by the sum
onto pre-existing particles, inhibiting nucleation, and result-       of the partial contributions determined for each size mode
ing in particle growth. During low-PM1 conditions, the avail-         (Fig. 8), i.e., Aitken (1.05 µg m−3 ) and accumulation modes
able aerosol surface is low, decreasing both condensation and         (7.23 µg m−3 ). This explains 80.4 % of the mean of measured
coagulation rates, which favors homogeneous nucleation.               PM1 .
                                                                         Secondary inorganic species (ammonium, nitrate, and
3.4   Relationships between particle size and chemical                sulfate) are partitioned between Aitken and accumulation
      composition of submicron particles                              modes. Similarly, Rodríguez et al. (2007) observed strong
                                                                      correlation between ammonium nitrate and ammonium sul-
The contribution of aerosol size modes to the ambient con-            fate with the accumulation mode, attributing it to conden-
centrations of the PM1 chemical species was assessed by per-          sation mechanisms and particle growth processes. A large
forming a multilinear regression (MLR) model. In the MLR              fraction of inorganic species are in the Aitken mode, and it
model, the time series of volume concentration at Aitken and          looks like the most acidic size mode. Carbone et al. (2013)
accumulation modes were used as predictors. PM1 compo-                suggested that the presence of nitrate and ammonium in the
nents were used as species of interest. The results of MLR            Aitken mode is likely to result from the reaction between ni-
are summarized in Table 5. The model explained more than              tric acid (HNO3 ) and ammonia (NH3 ) from traffic emissions.
90 % of the average measured concentrations for the PM1               Moreover, Backman et al. (2012) associated the growth of

https://doi.org/10.5194/acp-21-8761-2021                                               Atmos. Chem. Phys., 21, 8761–8773, 2021
8770 D. Monteiro dos Santos et al.: Physical and chemical properties of urban aerosols in São Paulo
Table 5. Fit parameters of MLR model results between PM1 components (species of interest) and volume of aerosol size modes (predictors)
and adjusted R 2 .
PM1 species Aitken mode Accumulation mode Adj. R 2
β(σ ) p value β(σ ) p value
HOAI 0.054 (0.017) 0.002 0.116 (0.003) < 0.001 0.46
HOAII 0.019 (0.012) 0.104 0.103 (0.002) < 0.001 0.58
eBC 0.103 (0.021) < 0.001 0.164 (0.004) < 0.001 0.57
BBOA 0.017 (0.006) 0.002 0.071 (0.002) < 0.001 0.57
Sulfate 0.244 (0.013) < 0.001 0.075 (0.003) < 0.001 0.54
Nitrate 0.103 (0.004) < 0.001 0.048 (0.001) < 0.001 0.74
Ammonium 0.085 (0.009) < 0.001 0.085 (0.002) < 0.001 0.52
Chloride 0.012 (0.001) < 0.001 0.005 (0.001) < 0.001 0.35
OOA −0.057 (0.016) 0.001 0.284 (0.005) < 0.001 0.62
pre-existing nucleation-mode aerosols with particle coating nated by organic aerosols (56 %), with significant contribu-
by sulfates and inorganic nitrates. tions of sulfate (15 %) and black carbon (13 %). Using PMF
The BBOA presents only a small fraction in the Aitken analysis it was possible to identify four OA classes including
mode, and the highest loading attributed to the accumulation oxygenated organic aerosol (OOA), biomass burning organic
mode. This result indicates that this urban site can be influ- aerosol (BBOA), and two hydrocarbon-like OA components
enced by regional biomass burning emissions. The enhance- (a typical HOA related to vehicular emissions and a HOA as-
ment of accumulation-mode particles under the influence of sociated with a mix of anthropogenic sources). Considering
regional biomass burning emissions has been observed else- the sum of secondary inorganic aerosols and SOA as a lower
where, such as in the Amazon. Kumar et al. (2016) discussed limit, more than 50 % of PM1 mass loading was estimated as
the relevance of unregulated PM sources in MASP, includ- resulting from secondary production.
ing wood burning in pizzerias that could emit 321 kg d−1 of Nucleation, Aitken, and accumulation lognormal size
PM2.5 , according to their estimates. modes were fitted to the measured PNSD. The Aitken mode
Submicron mass loading in the accumulation mode has a dominated the total number concentration with an average
great contribution of OOA (32 %), probably resulting from concentration of 6900 cm−3 and submicron aerosol size dis-
SOA formation and aging. The accumulation mode also tribution was strongly influenced by the PM1 levels. The ac-
presents significant contributions of HOA factors (24 %) and cumulation mode shows a large increase from low-PM1 con-
BC (21 %). Similarly, Costabile et al. (2009) related the ditions to high-PM1 conditions. The shift in the particle size
accumulation mode to particles containing aged secondary distribution to larger sizes provides more aerosol surface,
aerosol and also direct anthropogenic emissions. Interest- which can favor the condensation of vapors onto pre-existing
ingly, most of eBC concentration is in the accumulation particles and likely inhibit nucleation. It corroborates with
mode and only a small fraction of mass is in the Aitken mode. lower contribution of particles at the nucleation mode ob-
The same behavior is observed for traffic-related HOA fac- served under high-PM1 conditions. Conversely, the contribu-
tors. It can indicate that a substantial fraction of the BC is tion of particles from the nucleation mode to the total number
heavily coated by organics from regional transport, in ad- concentration is higher during low-PM1 conditions, when the
dition to local vehicular fresh emissions; however, it needs available aerosol surface is low, decreasing both condensa-
further investigations. A suggestion for future studies is the tion and coagulation rates and favoring homogeneous nucle-
analysis of BC mixing state and BC coating thickness using ation. Because of the high contribution of nucleation parti-
a single-particle soot photometer (SP2). cles under low-PM1 loadings, PM2.5 and PM10 (parameters
frequently used in the air quality index) may be insufficient
to assess human PM exposure in urban areas.
4 Summary and conclusions The relationships between size modes and chemical con-
stituents of PM1 were assessed by performing an MLR
Physicochemical properties of aerosols are key parameters model. Secondary inorganic species (ammonium, sulfate,
in terms of their impacts on human health and climate ef- and nitrate) were partitioned between Aitken and accumu-
fects. In this study, a detailed characterization of submicron lation modes, related to condensation particle growth pro-
particles was performed at an urban site in the MASP. The cesses. Submicron mass loading in the accumulation mode
results show PM1 mass concentrations in close agreement included aged secondary organic aerosol and vehicular emis-
with other megacities, with an average mass concentration of sions.
11.4 µg m−3 . As expected, chemical composition was domi-
Atmos. Chem. Phys., 21, 8761–8773, 2021 https://doi.org/10.5194/acp-21-8761-2021D. Monteiro dos Santos et al.: Physical and chemical properties of urban aerosols in São Paulo 8771
The results presented here emphasize the well-established Review statement. This paper was edited by Frank Keutsch and re-
impact of traffic-related sources in the MASP and reinforce viewed by two anonymous referees.
the need to reduce emissions rates in the region by apply-
ing new technologies such as the EURO VI emission stan-
dard. It is also essential to expand public mass transporta-
References
tion systems, resulting in a better transportation system for
20 million people, since the metro system in São Paulo is Alfarra, M. R., Prevot, A. S. H., Szidat, S., Sandradewi, J.,
heavily underdeveloped. Additionally, encouraging alterna- Weimer, S., Lanz, V. A., Schreiber, D., Mohr, M., and Bal-
tive transportation, implementing strong incentives for elec- tensperger, U.: Identification of the Mass Spectral Signature of
trical vehicles and the restriction of passenger car circula- Organic Aerosols from Wood Burning Emissions, Environ. Sci.
tion can improve air quality significantly in urban areas. Al- Technol., 41, 5770–5777, https://doi.org/10.1021/es062289b,
though the implementation of regulatory programs to con- 2007.
trol stationary and mobile sources in the MASP over recent Andrade, M. F., Miranda, R. M., Fornaro, A., Kerr, A., Oyama, B.,
decades has been successful in reducing primary emissions, de Andre, P. A., and Saldiva, P.: Vehicle emissions and PM
secondary processes have been recognized as critical to air 2.5 mass concentrations in six Brazilian cities, Air Qual. At-
mos. Hlth., 5, 79–88, https://doi.org/10.1007/s11869-010-0104-
quality in the region. The findings presented provide inno-
5, 2012.
vative insights into the association between sources and pro- Andrade, M. F., Kumar, P., de Freitas, E. D., Ynoue, R. Y., Martins,
cesses governing physicochemical properties of atmospheric J., Martins, L. D., Nogueira, T., Perez-Martinez, P., de Miranda,
aerosol and highlight the key role of SOA formation on the R. M., Albuquerque, T., Gonçalves, F. L. T., Oyama, B., and
PM1 ambient concentrations in a megacity largely impacted Zhang, Y.: Air quality in the megacity of São Paulo: Evolution
by traffic emissions and extensive biofuel usage. over the last 30 years and future perspectives, Atmos. Environ.,
159, 66–82, https://doi.org/10.1016/j.atmosenv.2017.03.051,
2017.
Data availability. The datasets are available upon request (dju- Backman, J., Rizzo, L. V., Hakala, J., Nieminen, T., Manni-
nior@if.usp.br). nen, H. E., Morais, F., Aalto, P. P., Siivola, E., Carbone, S.,
Hillamo, R., Artaxo, P., Virkkula, A., Petäjä, T., and Kul-
mala, M.: On the diurnal cycle of urban aerosols, black carbon
Supplement. The supplement related to this article is available on- and the occurrence of new particle formation events in spring-
line at: https://doi.org/10.5194/acp-21-8761-2021-supplement. time São Paulo, Brazil, Atmos. Chem. Phys., 12, 11733–11751,
https://doi.org/10.5194/acp-12-11733-2012, 2012.
Beirle, S., Boersma, K. F., Platt, U., Lawrence, M. G., and
Wagner, T.: Megacity emissions and lifetimes of nitro-
Author contributions. DMdS conducted most of the data analysis
gen oxides probed from space, Science, 333, 1737–1739,
and wrote the paper. PA supervised the work. LVR, PS, and SC con-
https://doi.org/10.1126/science.1207824, 2011.
tributed to specific parts of the data analysis. DMdS, LVR, and
Boucher, O., Randall, D., Artaxo, P., Bretherton, C., Feingold, G.,
PS conducted the measurements. All the authors contributed to the
Forster, P., Kerminen, V.-M., Kondo, Y., Liao, H., Lohmann,
interpretation of the results and writing of the paper.
U., Rasch, P., Satheesh, S. K., Sherwood, S., Stevens, B., and
Zhang, X.: Clouds and aerosols, in: Climate change 2013: the
physical science basis. Contribution of Working Group I to the
Competing interests. The authors declare that they have no conflict Fifth Assessment Report of the Intergovernmental Panel on Cli-
of interest. mate Change, Cambridge University Press, Cambridge, 571–
657, https://doi.org/10.1017/CBO9781107415324.016, 2013.
Bozzetti, C., El Haddad, I., Salameh, D., Daellenbach, K. R.,
Acknowledgements. We thank Fernando Morais, Fábio Jorge, and Fermo, P., Gonzalez, R., Minguillón, M. C., Iinuma, Y.,
Simara Morais for technical and logistics support in the successful Poulain, L., Elser, M., Müller, E., Slowik, J. G., Jaffrezo, J.-
operation of the sampling site. We thank the IAG Meteorological L., Baltensperger, U., Marchand, N., and Prévôt, A. S. H.:
Station for providing meteorological data. Djacinto Monteiro dos Organic aerosol source apportionment by offline-AMS over a
Santos acknowledges the scholarship from CNPq (162649/2015-0) full year in Marseille, Atmos. Chem. Phys., 17, 8247–8268,
for supporting his doctoral studies at the IFUSP, São Paulo, Brazil. https://doi.org/10.5194/acp-17-8247-2017, 2017.
Brito, J., Wurm, F., Yaannez-Serrano, A. M., de Assuncao, J. V.,
Godoy, J. M., and Artaxo, P.: Vehicular emission ratios of VOCs
Financial support. This research has been supported by the Fun- in a megacity impacted by extensive ethanol use: results of am-
dação de Amparo à Pesquisa do Estado de São Paulo (grant bient measurements in Sao Paulo, Brazil, Environ. Sci. Tech-
no. 2017/17407-0). nol., 49, 11381–11387, https://doi.org/10.1021/acs.est.5b03281,
2015.
Brito, J., Carbone, S., dos Santos, D. A. M., Dominutti, P.,
de Oliveira Alves, N., Rizzo, L. V., and Artaxo, P.: Disentangling
vehicular emission impact on urban air pollution using ethanol as
https://doi.org/10.5194/acp-21-8761-2021 Atmos. Chem. Phys., 21, 8761–8773, 20218772 D. Monteiro dos Santos et al.: Physical and chemical properties of urban aerosols in São Paulo
a tracer, Sci. Rep.-UK, 8, 10679, https://doi.org/10.1016/S0140- western Mediterranean, Atmos. Chem. Phys., 18, 1149–1169,
6736(17)30505-6, 2018. https://doi.org/10.5194/acp-18-1149-2018, 2018.
Canagaratna, M. R., Jayne, J. T., Ghertner, D. A., Hern- Fuzzi, S., Baltensperger, U., Carslaw, K., Decesari, S., Denier van
don, S., Shi, Q., Jimenez, J. L., Silva, P. J., Williams, P., der Gon, H., Facchini, M. C., Fowler, D., Koren, I., Langford, B.,
Lanni, T., Drewnick, F., Demerjian, K. L., Kolb, C. E., and Lohmann, U., Nemitz, E., Pandis, S., Riipinen, I., Rudich, Y.,
Worsnop, D. R.: Chase Studies of Particulate Emissions from in- Schaap, M., Slowik, J. G., Spracklen, D. V., Vignati, E.,
use New York City Vehicles, Aerosol Sci. Tech., 38, 555–573, Wild, M., Williams, M., and Gilardoni, S.: Particulate matter,
https://doi.org/10.1080/02786820490465504, 2004. air quality and climate: lessons learned and future needs, At-
Canonaco, F., Crippa, M., Slowik, J. G., Baltensperger, U., mos. Chem. Phys., 15, 8217–8299, https://doi.org/10.5194/acp-
and Prévôt, A. S. H.: SoFi, an IGOR-based interface for 15-8217-2015, 2015.
the efficient use of the generalized multilinear engine (ME- Hair, J. F., Black, W. C., Babin, B. J., Anderson, R. E., and Tatham,
2) for the source apportionment: ME-2 application to aerosol R. L.: Multivariate data analysis, Vol. 6, Pearson Prentice Hall,
mass spectrometer data, Atmos. Meas. Tech., 6, 3649–3661, Upper Saddle River, NJ, 2006.
https://doi.org/10.5194/amt-6-3649-2013, 2013. Hussein, T., Dal Maso, M., Petaja, T., Koponen, I. K., Paatero, P.,
Carbone, S., Saarikoski, S., Frey, A., Reyes, F., Reyes, P., Castillo, Aalto, P. P., Hameri, K., and Kulmala, M.: Evaluation of an auto-
M., Gramsch, E., Oyola, P., Jayne, J., Worsnop, D. R., and matic algorithm for fitting the particle number size distributions,
Hillamo, R.: Chemical characterization of submicron aerosol Boreal Environ. Res., 10, 337–355, 2005.
particles in Santiago de Chile, Aerosol Air Qual. Res., 13, 462– IBGE: Instituto Brasileiro de Geografia e Estatística, Brazilian In-
473, https://doi.org/10.4209/aaqr.2012.10.0261, 2013. stitute of Geography and Statistics, available at: http://cod.ibge.
Castanho, A. and Artaxo, P.: Wintertime and summertime São Paulo gov.br/QHF, last access: 7 June 2021.
aerosol source apportionment study, Atmos. Environ., 35, 4889– Jimenez, J. L., Canagaratna, M., Donahue, N., Prevot, A., Zhang,
4902, https://doi.org/10.1016/S1352-2310(01)00357-0, 2001. Q., Kroll, J. H., DeCarlo, P. F., Allan, J. D., Coe, H., Ng, N.
CETESB: Relatório de Qualidade do Ar no Estado de São L., Aiken, A. C., Docherty, K. S., Ulbrich, I. M., Grieshop, A.
Paulo 2018, Série Relatórios, São Paulo, available at: P., Robinson, A. L., Duplissy, J., Smith, J. D., Wilson, K. R.,
https://cetesb.sp.gov.br/ar/publicacoes-relatorios/ (last access: Lanz, V. A., Hueglin, C., Sun, Y. L., Tian, J., Laaksonen, A.,
7 June 2021), 2019. Raatikainen, T., Rautiainen, J., Vaattovaara, P., Ehn, M., Kul-
Che, H., Zhang, X., Wang, Y., Zhang, L., Shen, X., Zhang, Y., mala, M., Tomlinson, J. M., Collins, D. R., Cubison, M. J.,
Ma, Q., Sun, J., Zhang, Y., and Wang, T.: Characterization and Dunlea, E. J., Huffman, J. A., Onasch, T. B., Alfarra, M. R.,
parameterization of aerosol cloud condensation nuclei activation Williams, P. I., Bower, K., Kondo, Y., Schneider, J., Drewnick,
under different pollution conditions, Sci. Rep.-UK, 6, 24497, F., Borrmann, S., Weimer, S., Demerjian, K., Salcedo, D., Cot-
https://doi.org/10.1038/srep24497, 2016. trell, L., Griffin, R., Takami, A., Miyoshi, T., Hatakeyama, S.,
Ching, J. and Kajino, M.: Aerosol mixing state matters for parti- Shimono, A., Sun, J. Y., Zhang, Y. M., Dzepina, K., Kimmel,
cles deposition in human respiratory system, Sci. Rep., 8, 8864, J. R., Sueper, D., Jayne, J. T., Herndon, S. C., Trimborn, A.
https://doi.org/10.1038/s41598-018-27156-z, 2018. M., Williams, L. R., Wood, E. C., Middlebrook, A. M., Kolb,
Cohen, A. J., Brauer, M., Burnett, R., Anderson, H. R., Frostad, J., C. E., Baltensperger, U., and Worsnop, D. R.: Evolution of
Estep, K., Balakrishnan, K., Brunekreef, B., Dandona, L., Dan- organic aerosols in the atmosphere, Science, 326, 1525–1529,
dona, R., Feigin, V., Freedman, G., Hubbell, B., Jobling, A., Kan, https://doi.org/10.1126/science.1180353, 2009.
H., Knibbs, L., Liu, Y., Martin, R., Morawska, L., Pope III, C. Kumar, P., de Fatima Andrade, M., Ynoue, R. Y., Fornaro, A.,
A., Shin, H., Straif, K., Shaddick, G., Thomas, M., Dingenen, R., Dias de Freitas, E., Martins, J., Martins, L. D., Albuquerque, T.,
Donkelaar, A., Christopher, T. V., Murray, J. L., and Forouzanfar, Zhang, Y., and Morawska, L.: New directions: from biofuels
M. H.: Estimates and 25-year trends of the global burden of dis- to wood stoves: the modern and ancient air quality challenges
ease attributable to ambient air pollution: an analysis of data from in the megacity of São Paulo, Atmos. Environ., 140, 364–369,
the Global Burden of Diseases Study 2015, Lancet, 389, 1907– https://doi.org/10.1016/j.atmosenv.2016.05.059, 2016.
1918, https://doi.org/10.1016/S0140-6736(17)30505-6, 2017. Martins, L. D., Martins, J. A., Freitas, E. D., Mazzoli, C. R.,
Costabile, F., Birmili, W., Klose, S., Tuch, T., Wehner, B., Wieden- Gonçalves, F. L. T., Ynoue, R. Y., Hallak, R., Albu-
sohler, A., Franck, U., König, K., and Sonntag, A.: Spatio- querque, T. T. A., and de Fatima Andrade, M.: Potential health
temporal variability and principal components of the particle impact of ultrafine particles under clean and polluted urban atmo-
number size distribution in an urban atmosphere, Atmos. Chem. spheric conditions: a model-based study, Air Qual. Atmos. Hlth.,
Phys., 9, 3163–3195, https://doi.org/10.5194/acp-9-3163-2009, 3, 29–39, https://doi.org/10.1007/s11869-009-0048-9, 2010.
2009. Middlebrook, A., Bahreini, R., Jimenez, J., and Cana-
de Miranda, R., Andrade, M., Ribeiro, F., Francisco, K., and Garatna, M.: Evaluation of Composition-Dependent Collection
Perez-Martinez, P.: Source apportionment of fine particulate Efficiencies for the Aerodyne Aerosol Mass Spectrom-
matter by positive matrix factorization in the Metropolitan eter using Field Data, Aerosol Sci. Tech., 46, 258–271,
Area of São Paulo, Brazil, J. Clean. Prod., 202, 253–263, https://doi.org/10.1080/02786826.2011.620041, 2011.
https://doi.org/10.1016/j.jclepro.2018.08.100, 2018. Mohr, C., DeCarlo, P. F., Heringa, M. F., Chirico, R., Slowik, J. G.,
Ealo, M., Alastuey, A., Pérez, N., Ripoll, A., Querol, X., and Richter, R., Reche, C., Alastuey, A., Querol, X., Seco, R.,
Pandolfi, M.: Impact of aerosol particle sources on optical Peñuelas, J., Jiménez, J. L., Crippa, M., Zimmermann, R., Bal-
properties in urban, regional and remote areas in the north- tensperger, U., and Prévôt, A. S. H.: Identification and quan-
tification of organic aerosol from cooking and other sources
Atmos. Chem. Phys., 21, 8761–8773, 2021 https://doi.org/10.5194/acp-21-8761-2021D. Monteiro dos Santos et al.: Physical and chemical properties of urban aerosols in São Paulo 8773 in Barcelona using aerosol mass spectrometer data, Atmos. Rodríguez, S., Van Dingenen, R., Putaud, J.-P., Dell’Acqua, A., Chem. Phys., 12, 1649–1665, https://doi.org/10.5194/acp-12- Pey, J., Querol, X., Alastuey, A., Chenery, S., Ho, K.-F., Har- 1649-2012, 2012. rison, R., Tardivo, R., Scarnato, B., and Gemelli, V.: A study Monteiro dos Santos, D. A., Brito, J., Godoy, J., and Artaxo, P.: Am- on the relationship between mass concentrations, chemistry bient concentrations and insights on organic and elemental car- and number size distribution of urban fine aerosols in Milan, bon dynamics in São Paulo, Brazil, Atmos. Environ., 144, 226– Barcelona and London, Atmos. Chem. Phys., 7, 2217–2232, 233, https://doi.org/10.1016/j.atmosenv.2016.08.081, 2016. https://doi.org/10.5194/acp-7-2217-2007, 2007. Müller, T., Henzing, J. S., de Leeuw, G., Wiedensohler, A., Romano, S., Perrone, M., Pavese, G., Esposito, F., and Calvello, M.: Alastuey, A., Angelov, H., Bizjak, M., Collaud Coen, M., En- Optical properties of PM2.5 particles: Results from a monitor- gström, J. E., Gruening, C., Hillamo, R., Hoffer, A., Imre, K., ing campaign in southeastern Italy, Atmos. Environ., 203, 35–47, Ivanow, P., Jennings, G., Sun, J. Y., Kalivitis, N., Karlsson, H., https://doi.org/10.1016/j.atmosenv.2019.01.037, 2019. Komppula, M., Laj, P., Li, S.-M., Lunder, C., Marinoni, A., Mar- Sánchez-Ccoyllo, O. and Andrade, M. F.: The influence of me- tins dos Santos, S., Moerman, M., Nowak, A., Ogren, J. A., teorological conditions on the behavior of pollutants concen- Petzold, A., Pichon, J. M., Rodriquez, S., Sharma, S., Sheri- trations in São Paulo, Brazil, Environ. Pollut., 116, 257–263, dan, P. J., Teinilä, K., Tuch, T., Viana, M., Virkkula, A., Wein- https://doi.org/10.1016/S0269-7491(01)00129-4, 2002. gartner, E., Wilhelm, R., and Wang, Y. Q.: Characterization and Santos, T. C. d., Reboita, M. S., and Carvalho, V. S. B.: In- intercomparison of aerosol absorption photometers: result of two vestigation of the Relationship Between Atmospheric Vari- intercomparison workshops, Atmos. Meas. Tech., 4, 245–268, ables and the Concentration of MP10 and O3 in the State of https://doi.org/10.5194/amt-4-245-2011, 2011. São Paulo, Revista Brasileira de Meteorologia, 33, 631–645, Ng, N., Herndon, S., Trimborn, A., Croteau, P., Onasch, T., https://doi.org/10.1590/0102-7786334006, 2018. Sueper, D., Worsnop, D., Zhang, Q., Sun, Y., and Jayne, J.: Sun, Y.-L., Zhang, Q., Schwab, J. J., Demerjian, K. L., Chen, W.-N., An Aerosol Chemical Speciation Monitor (ACSM) for Rou- Bae, M.-S., Hung, H.-M., Hogrefe, O., Frank, B., Rattigan, O. V., tine Monitoring of the Composition and Mass Concentra- and Lin, Y.-C.: Characterization of the sources and processes tions of Ambient Aerosol, Aerosol Sci. Tech., 45, 780–794, of organic and inorganic aerosols in New York city with a https://doi.org/10.1080/02786826.2011.560211, 2011a. high-resolution time-of-flight aerosol mass apectrometer, At- Ng, N. L., Canagaratna, M. R., Jimenez, J. L., Chhabra, P. S., Se- mos. Chem. Phys., 11, 1581–1602, https://doi.org/10.5194/acp- infeld, J. H., and Worsnop, D. R.: Changes in organic aerosol 11-1581-2011, 2011. composition with aging inferred from aerosol mass spectra, At- Ulbrich, I. M., Canagaratna, M. R., Zhang, Q., Worsnop, D. R., and mos. Chem. Phys., 11, 6465–6474, https://doi.org/10.5194/acp- Jimenez, J. L.: Interpretation of organic components from Posi- 11-6465-2011, 2011b. tive Matrix Factorization of aerosol mass spectrometric data, At- Paatero, P.: Least squares formulation of robust non-negative mos. Chem. Phys., 9, 2891–2918, https://doi.org/10.5194/acp-9- factor analysis, Chemometr. Intell. Lab., 37, 23–35, 2891-2009, 2009. https://doi.org/10.1016/S0169-7439(96)00044-5, 1997. Zhang, Q., Alfarra, M. R., Worsnop, D. R., Allan, J. D., Coe, H., Paatero, P.: The Multilinear Engine – A Table-Driven, Canagaratna, M. R., and Jimenez, J. L.: Deconvolution and Least Squares Program for Solving Multilinear Prob- Quantification of Hydrocarbon-like and Oxygenated Organic lems, Including the n-Way Parallel Factor Analy- Aerosols Based on Aerosol Mass Spectrometry, Environ. Sci. sis Model, J. Comput. Graph. Stat., 8, 854–888, Technol., 39, 4938–4952, https://doi.org/10.1021/es048568l, https://doi.org/10.1080/10618600.1999.10474853, 1999. pMID: 16053095, 2005. Paatero, P. and Tapper, U.: Positive matrix factorization: A Zhang, Q., Jimenez, J. L., Canagaratna, M. R., Ulbrich, I. M., non-negative factor model with optimal utilization of er- Ng, N. L., Worsnop, D. R., and Sun, Y.: Understanding at- ror estimates of data values, Environmetrics, 5, 111–126, mospheric organic aerosols via factor analysis of aerosol mass https://doi.org/10.1002/env.3170050203, 1994. spectrometry: a review, Anal. Bioanal. Chem., 401, 3045–3067, Pereira, G. M., Teinilä, K., Custódio, D., Gomes Santos, A., https://doi.org/10.1007/s00216-011-5355-y, 2011. Xian, H., Hillamo, R., Alves, C. A., Bittencourt de Andrade, J., Zhu, T., Melamed, M., Parrish, D., Gauss, M., Klenner, L. Olímpio da Rocha, G., Kumar, P., Balasubramanian, R., An- G., Lawrence, M., Konare, A., and Liousse, C.: WMO/IGAC drade, M. D. F., and de Castro Vasconcellos, P.: Particulate pol- impacts of megacities on air pollution and climate, GAW lutants in the Brazilian city of São Paulo: 1-year investigation Tech. Rep. No. 205, World Meteorological Organization, 149– for the chemical composition and source apportionment, Atmos. 151, 2012. Chem. Phys., 17, 11943–11969, https://doi.org/10.5194/acp-17- 11943-2017, 2017. Rodríguez, S., Van Dingenen, R., Putaud, J.-P., Martins-Dos San- tos, S., and Roselli, D.: Nucleation and growth of new parti- cles in the rural atmosphere of Northern Italy – relationship to air quality monitoring, Atmos. Environ., 39, 6734–6746, https://doi.org/10.1016/j.atmosenv.2005.07.036, 2005. https://doi.org/10.5194/acp-21-8761-2021 Atmos. Chem. Phys., 21, 8761–8773, 2021
You can also read