Seagrass Structural Traits Drive Fish Assemblages in Small-Scale Fisheries
←
→
Page content transcription
If your browser does not render page correctly, please read the page content below

ORIGINAL RESEARCH
                                                                                                                                           published: 12 April 2021
                                                                                                                                  doi: 10.3389/fmars.2021.640528

                                            Seagrass Structural Traits Drive Fish
                                            Assemblages in Small-Scale
                                            Fisheries
                                            Benjamin L. Jones 1,2* , Lina M. Nordlund 3 , Richard K. F. Unsworth 2,4 ,
                                            Narriman S. Jiddawi 5 and Johan S. Eklöf 1
                                            1
                                             Department of Ecology, Environment and Plant Sciences, Stockholm University, Stockholm, Sweden, 2 Project Seagrass,
                                            Bridgend, United Kingdom, 3 Department of Earth Sciences, Natural Resources and Sustainable Development, Uppsala
                                            University, Uppsala, Sweden, 4 Department of Biosciences, Swansea University, Swansea, United Kingdom, 5 Institute
                                            of Fisheries Research, Ministry of Agriculture, Natural Resources, Livestock and Fisheries, Zanzibar, Tanzania

                                            Seagrasses – a group of foundation species in coastal ecosystems – provide key
                                            habitat for diverse and abundant faunal assemblages and support numerous ecosystem
                                            functions and services. However, whether the habitat role of seagrasses is influenced
                                            by seagrass diversity, by dominant species or both, remains unclear. To that end,
                        Edited by:          we sought to investigate the specific seagrass characteristics (e.g., species diversity,
                  Brett W. Molony,
                                            seagrass traits) that influence tropical fish assemblages, and place this in the context
   Oceans and Atmosphere (CSIRO),
                          Australia         of small-scale fishery use. We surveyed seagrass variables at 55 plots, nested within
                     Reviewed by:           12 sites around Zanzibar (Tanzania) in the Western Indian Ocean, and used Baited
              Catherine Jane Collier,       Remote Underwater Video (BRUV) systems to assess fish assemblages across plots.
     James Cook University, Australia
              W. Judson Kenworthy,
                                            Using linear mixed models, we reveal that seagrass structural complexity and depth
   Independent Researcher, Beaufort,        were the best predictors of fish abundance, with higher abundance occurring in deeper
                      United States
                                            meadows or meadows with high canopy, leaf length and number of leaves per shoot.
                 *Correspondence:
                                            Moreover, an interaction between seagrass cover and land-use was the best predictor of
                   Benjamin L. Jones
               Benjamin.Jones@su.se         fish species richness, where sites closer to human impacts were less affected by cover
                                            than sites with lower human impact. Overall, models with seagrass species richness
                   Specialty section:
                                            or functional diversity as predictors poorly explained fish assemblages. Fish taxa that
         This article was submitted to
          Marine Ecosystem Ecology,         were important for small-scale fishery sectors (e.g., emperors, snappers, rabbitfish, and
               a section of the journal     parrotfish) were primarily driven by seagrass structural complexity. Our results provide
          Frontiers in Marine Science
                                            a unique analysis of the relationship between seagrass habitat and its associated fish
       Received: 11 December 2020
          Accepted: 19 March 2021           assemblages in that we show that seagrass species diversity had little effect on seagrass
           Published: 12 April 2021         fish assemblages, which instead appear driven by specific seagrass traits and seagrass
                              Citation:     cover. If conserving high value species that support adjacent fisheries is the priority for
              Jones BL, Nordlund LM,
                                            protecting seagrass meadows, then seagrass areas should be chosen with high cover
      Unsworth RKF, Jiddawi NS and
  Eklöf JS (2021) Seagrass Structural       and structural complexity that are in deeper waters. Any conservation measures also
        Traits Drive Fish Assemblages       need to balance the needs of fishers that use the resources supported by seagrasses.
              in Small-Scale Fisheries.
            Front. Mar. Sci. 8:640528.      Keywords: seagrass meadows, fish assemblages, species diversity, small-scale fisheries, habitat structure,
    doi: 10.3389/fmars.2021.640528          functional ecology

Frontiers in Marine Science | www.frontiersin.org                                1                                            April 2021 | Volume 8 | Article 640528
Jones et al.                                                                                              Seagrass Structure Drives Fish Assemblages

INTRODUCTION                                                                   Given the Indo-Pacific region is one of the most densely
                                                                           populated by humans (Williams, 2013), sustaining the important
Foundation species like trees, corals and seagrasses play a                ecosystem services that biodiversity provides is vital. Human
pivotal role in driving ecosystem functions and services globally          dependence on seafood is substantial (Donner and Potere, 2007),
(Angelini et al., 2011), notably by facilitating the creation of           but the foundation habitats that contribute to this provision are
habitats. Therefore, loss of biodiversity, particularly habitat            being degraded (Burke et al., 2011; Coles et al., 2011; Giri et al.,
biodiversity, as well as the homogenization of ecosystems is               2011). In response, much research and conservation funding
a global threat (Hoag, 2010; Oliver, 2016). Two not mutually               in the region has been directed toward coral reefs (Unsworth
exclusive ecological hypotheses are proposed to influence the              et al., 2019a), partly due to a failure to recognize that coastal
effects of biodiversity on ecosystem function. First, the ‘mass            fishers utilize multiple habitats, like seagrass meadows (Nordlund
ratio’ hypothesis proposes that ecosystem functions, like complex          et al., 2018b), and partly because coral reefs are much more
habitats favoring high biodiversity, are primarily determined by           well-known and researched than other coastal habitats (UN
the functional traits of dominant species within the community             Environment et al., 2018). Yet we now know the vital role
(Grime, 1998). In contrast, the ‘complementarity hypothesis’               seagrass plays globally in supporting fisheries and food supply
proposes that the taxonomic and/or functional diversity within             (Unsworth et al., 2019b), which in the Western Indian Ocean
the community are instead the key drivers of ecosystem                     can provide economic gains that locally may be four times
functions (Tilman et al., 1997). In order to manage ecosystems             greater than coral reefs (de la Torre-Castro et al., 2014). Previous
for the services they provide, it is vital to understand how               research shows that tropical fish assemblages are influenced
biodiversity drives ecosystem functions (e.g., whether it is species       by variations in the structure of seagrass habitats (Heck and
composition or diversity, or both), especially in the context of           Orth, 1980), by seagrass canopy complexity (Bell and Westoby,
global change (Benkwitt et al., 2020). While the topic has become          1986a,b; Nakamura and Sano, 2004) and by seagrass landscapes
a heated debate, especially with regards to terrestrial ecosystems         (Salita et al., 2003). Yet, the extent to which this is driven by
(Picasso, 2018), meta-analyses of hundreds of experiments                  seagrass diversity and/or by traits of dominant species remains
in terrestrial (Cardinale et al., 2011) and marine ecosystems              unclear. The UN Decade of Ocean Science for Sustainable
(Gamfeldt et al., 2015) suggest that both the species composition          Development mandates for solution orientated science and
and diversity can jointly influence ecosystem functions.                   management that balances biodiversity conservation with the
    In the marine environment, structure-forming foundation                needs of local people (von Schuckmann et al., 2020). The aspects
species can strongly influence fish assemblage organization                of seagrass diversity that are key to sustaining biodiversity, and
(Gorham and Alevizon, 1989; Caley and St John, 1996; Beukers               thus ecosystem services, remain unclear in general and for the
and Jones, 1998; Harding and Mann, 2001). Indeed, many                     (relatively speaking) ‘hyper-diverse’ seagrass meadows within the
small-scale fishers have their own opinions on where the best              Indo-Pacific Ocean in particular (Nordlund et al., 2018a). This is
place to fish is, be it a complex structure or a specific area             especially pressing when we consider the multiple threats facing
defined by certain species traits, which might also shift over             seagrass (Unsworth et al., 2018).
time (Katikiro, 2014). Yet in general, we value the role of                    The aim of this study was to assess to what extent the
marine foundation species either in isolation (e.g., kelp) or by           fish habitat function of seagrass meadows is explained by
grouping species into much broader functional entities (e.g., coral        the diversity and/or composition of seagrasses, from both a
reefs). As a result, we see a focus on protecting flagship and             taxonomic and traits perspective. We surveyed seagrass meadows
iconic foundation species or habitats, regardless of their state,          across a gradient of fishing pressure and anthropogenic impact
qualities or characteristics (Caveen et al., 2014). However, this          around Zanzibar, Tanzania. We sought to determine (i) which
overlooks the fact that most ecosystems are structured by co-              seagrass meadow attributes best influenced seagrass meadow
occurring foundation species, which can range greatly in their             fish assemblages, and (ii) investigate the relationships between
structural and functional attributes (Bruno and Bertness, 2001).           seagrass meadow attributes and the presence of fish important to
One example is seagrasses, a group of habitat-forming marine               small-scale fisheries. In the context of documented seagrass loss
plants occurring along the world’s coastlines (McKenzie et al.,            across the Indo-Pacific (Harcourt et al., 2018; Unsworth et al.,
2020). Pooling seagrass assemblages into bioregions reveal the             2018; Tin et al., 2020), we seek to indicate which attributes are
highest species richness in the tropical Indo-Pacific (Short et al.,       key for managing seagrass for the maintenance of important
2007), consistent with the latitudinal diversity gradient (Willig          ecosystem functions.
et al., 2003; Jablonski et al., 2006). Up to 14 seagrass species
co-occur with each other in the region (Miguel et al., 2018),
yet many of these have very different functional attributes (e.g.,         METHODS
low-high root biomass, short-long leaf length, low-high nutrient
content). With reported seagrass loss across the region being              Study Design
high (Waycott et al., 2009), and some species being more at risk           We used standard Baited Remote Underwater Video (Cappo
than others (Short et al., 2011), we need to urgently unpack this          et al., 2007) and benthic quadrat assessment methods (McKenzie
broad functional entity of seagrass meadows to understand how              et al., 2001) to survey seagrass flora and motile fauna at 55 distinct
specific seagrass species losses could influence ecosystem service         plots nested within 12 sites around Zanzibar (Unguja Island),
provision, and target management accordingly.                              Tanzania, between October and November 2018 (Figure 1).

Frontiers in Marine Science | www.frontiersin.org                      2                                        April 2021 | Volume 8 | Article 640528
Jones et al.                                                                                                              Seagrass Structure Drives Fish Assemblages

  FIGURE 1 | Map of Zanzibar, Tanzania showing the location of 55 plots, nested within 12 distinct sites (identifiable by names), where fish assemblage and seagrass
  surveys were conducted during October-November 2018.

Seagrass meadows around Zanzibar provide a suitable setting to                        Seagrass Community Structure
examine the influence of seagrass species composition, diversity                      At each of the 55 plots, two 50 m transects were placed in
and structure on faunal productivity in that they are complex                         a cross, centered around the location of the fish sampling
and comprised of a number of species in varying densities                             point (Figure 2). Within twenty-two 0.25 m2 quadrats, placed
(Gullström et al., 2002). These are characteristically comprised                      at 5 m intervals along transects (0-50 m), we collected
of mixed, or monospecific Halodule uninervis, Halophila ovalis,                       data on various seagrass meadow attributes pertinent to
and Cymodocea rotundata areas toward the upper intertidal                             our hypothesis (structure, cover, diversity and composition;
limits of the meadow, shifting to both mixed and monospecific                         Table 1). We estimated seagrass shoot density (0.0225 m2 ),
H. uninervis, C. rotundata, Thalassia hemprichii and H. ovalis                        total percentage cover (0-100%) and floral species composition
areas in the lower intertidal limits of the meadow. The upper                         (McKenzie et al., 2001). Canopy height (cm), leaf length
subtidal areas are comprised of C. serrulata, T. hemprichii,                          (cm), leaf width (cm) and number of leaves per shoot were
H. ovalis and Syringodium isoetifolium, shifting to C. serrulata,                     recorded from three random shoots within in each quadrat,
T. hemprichii, H. ovalis, S. isoetifolium and Thalassodendron                         and the mean was later used in the statistical analyses
ciliatum before being often dominated by T. ciliatum and Enhalus                      (McKenzie et al., 2001). Seagrass species were sorted into
acoroides, growing in monospecific or mixed strands, in deeper                        two structural trait categories - leaf growth form (strap,
areas. While one site was adjacent to a no-take marine reserve                        branched, paddle, and cylindrical) and canopy type (low,
(but not within), all sites were typically fished. Plots were selected                middle and high) - to calculate community weighted functional
non-randomly to encapsulate variability in both seagrass species                      trait indices (functional dispersion) and functional richness
composition and species richness; we wanted to include mixed                          (see data analysis). Prior to data analysis, the seagrass trait
and monospecific plots for multiple seagrass genera. However,                         characteristics (n = 1210) were averaged for each plot (n = 55)
not all sites had the same seagrass species which ultimately led                      to match the scale of the fish sampling (see site averages in
to the unbalanced nature of number of plots within each site.                         Supplementary Table 1).

Frontiers in Marine Science | www.frontiersin.org                                 3                                              April 2021 | Volume 8 | Article 640528
Jones et al.                                                                                                            Seagrass Structure Drives Fish Assemblages

  FIGURE 2 | Conceptual diagram of survey setup at each sample location, showing the location of the Baited Remote Underwater Video (BRUV) system toward the
  center of the sample plot and location of the two 50m transects (not to scale).

Environmental Characteristics and                                                   that used by Quiros et al. (2017) to assess land-use characteristics
Anthropogenic Impact                                                                at a site level. We estimated human land-use characteristics
For each plot, we then calculated several seascape variables that                   within a 2 km radius from each site (using Google Earth Pro
have been previously shown to structure fish assemblages (see                       v. 7.3) and calculated the proportion (km2 ) of land utilized in
site averages in Supplementary Table 2), including distance to                      this 2 km radius by six categories. These were bare ground
nearest reef or area of coral bommies (Campbell et al., 2011)                       (exposed soil, shrub), human development (houses, villages,
and nearest mangrove area (Dorenbosch et al., 2007). Individual                     industry, and roads), aquaculture, farmland, vegetation (forest,
mangrove trees were not considered and only areas with sufficient                   mangrove) and water (ocean, river). We also recorded distance
mangrove cover were included. Water depth, which ranged from                        to nearest catchment.
0.6 to 6.3 m, was recorded at time of fish sampling for each plot                      Fishing pressure is also a well-known driver of seagrass fish
(Pogoreutz et al., 2012).                                                           assemblages, including those around Zanzibar (Alonso Aller
    Human land-use intensity can strongly affect seagrass state                     et al., 2014). Even though the influence of fishing was not
(Quiros et al., 2017). Therefore, we utilized a similar method to                   a main factor in our analysis, we sought to account for its

TABLE 1 | Seagrass meadow structure, cover, composition, richness and community-weighted trait values investigated as predictors of fish abundance and species
richness in the present study.

Category                     Variables                   Description                                                                                     Hypothesis

Meadow structure             Shoot density               Total number of seagrass shoots per 0.25   m2                                                   Mass ratio
                             Leaves per shoot            Average number of leaves of three random shoots
                             Canopy height               Average canopy height for three random shoots
                             Leaf length                 Average length of leaves for three random shoots
                             Leaf width                  Average width of leaves for three random shoots
Seagrass cover               Seagrass cover              Total% cover of seagrass per 0.25 m2                                                            Mass ratio
and composition
                             Seagrass composition        Abundance of each seagrass species present (% cover) as a proportion of total
                                                         seagrass cover
Richness                     Seagrass richness           Number of seagrass genera                                                                       Diversity
                             Functional richness         Number of functional groups based on two seagrass traits (leaf type and canopy type)
Functional                   Functional dispersion       Trait dispersion based on two seagrass traits (leaf type and canopy type), weighted by          Diversity
dispersion                                               seagrass composition

Descriptions and hypothesis are provided for each seagrass category included.

Frontiers in Marine Science | www.frontiersin.org                               4                                               April 2021 | Volume 8 | Article 640528
Jones et al. Seagrass Structure Drives Fish Assemblages
influence as a covariate. First, distance to fishery landing site for several reasons: they have been shown to be more effective
was calculated for each plot based on landing sites reported by for describing seagrass fish assemblages given the “diver effect”
the Department of Fisheries Development (2016). Second, fishing caused by traditional methods (Edgar et al., 2004; Zarco-Perello
effort was approximated using a semi-quantitative two-level scale and Enríquez, 2019) have greater statistical power at low sample
(low, high). This was developed based on discussions with local numbers and also attract herbivores (e.g., Harvey et al., 2007;
fishers and resource users (McCluskey and Lewison, 2008) and Langlois et al., 2010; Watson et al., 2010; Andradi-Brown et al.,
further quantified using field observations of ongoing fishery 2016; Schramm et al., 2020). While this choice may result in
activity during Oct-Dec 2018 (Table 2). With observations, we fewer cryptic species being recorded (Watson et al., 2005), we
considered both the number of fishers and the fishing gear considered traditional methods inappropriate for use in such
used. For example, observations of multiple spear and trap intensely fished areas (Lindfield et al., 2014). The ability to ensure
fishermen operating from non-motorized boats were considered a consistent methodology between observations (Jones et al.,
to be lower intensity than a single > 10 person drag net team 2021) was considered of greater importance than greater species
operating from a larger motorized boat since drag nets catch resolution afforded by other methods.
more fish (Jiddawi and Öhman, 2002) and are less selective The mono-BRUV system was constructed based on designs by
(McClanahan and Mangi, 2004). Cappo et al. (2004). An aluminium tripod (Smatree X1S; 50 cm
high) was used as a mount for a GoPro Hero 5 camera, with 2 kg
Surveys of Seagrass Fish Assemblages lead weight placed at the base for stability underwater. A bait
The abundance and diversity of seagrass fish assemblages were arm (20 mm ∅ PVC) extending 1 m from the camera supported
evaluated at each of the 55 plots using a single Baited Remote a plastic bait container (Trappy Betesbox; 112 cm3 ), which was
Underwater Video system (BRUVs) (Jones et al., 2018). BRUVs filled with standardized oily bait (Sardinella sp. purchased locally)
are a widely used and established method for understanding before all deployments. Oily fish were used as they are considered
motile fauna in marine environments. Examples include their the most effective bait for use in BRUVs (Bond et al., 2012;
use in understanding the effects of marine reserves and protected Dorman et al., 2012).
areas (e.g., Whitmarsh et al., 2014; Bornt et al., 2015; Coleman BRUVs were deployed for 35 min, with the first 5 min
et al., 2015; Gilby et al., 2017), assessing the faunal communities considered a buffer time to allow fauna to respond to disturbance.
of reef systems (e.g., Lindfield et al., 2016), quantifying shark The remaining 30 min were used for analysis which is considered
populations (e.g., MacNeil et al., 2020) and investigating demersal adequate time to assess fish assemblages (Wraith et al., 2013). All
fish populations in different habitat types (e.g., Furness and BRUVs were deployed from a boat during daylight hours on an
Unsworth, 2020). Such assessments focus on fish diversity as a incoming tide, around one hour after low tide in order to reduce
response and not only focus on top predators, but numerous variability in bait plume area caused by current velocity (e.g.,
demersal fish species. Moreover, the use of different types of video Taylor et al., 2013; Piggott et al., 2020). All deployments were
methods is becoming increasingly common for investigations conducted within 5 days of a low spring tide and therefore the
into seagrass habitat and fish interactions (e.g., Smith et al., 2011; majority of plots were placed in seagrass areas that were almost
Whitmarsh et al., 2014; Díaz-Gil et al., 2017; Henderson et al., always subtidal.
2017; Kiggins et al., 2018). We chose to use a BRUV system Each of the 55 plot videos was analyzed to determine the
MaxN of each fish species and fish species richness; a metric
commonly used for the quantification of the relative abundance
of fish observed in underwater video (Cappo et al., 2004;
TABLE 2 | Observations of ongoing fishing activity between October and
December 2018 at 12 sites in Zanzibar, Tanzania. Unsworth et al., 2014). MaxN is equal to the maximum number of
fish recorded at any one time (single video frame) and therefore
Site Field Observations Fishing removes concerns associated with double counting of individual
activity
fish (Priede et al., 1994). MaxN was determined for each species in
Bweleo Fishers utilizing basket traps Low every video frame throughout the 30 min of footage. The highest
Changuu Drag net teams in operation within seagrass areas High MaxN for each species at the end of each 30 min was used in
Chapwani Drag net teams in operation within seagrass areas High further analysis.
Chumbe Drag net teams in operation within seagrass areas High Fish were identified to species level where possible using
Kibandiko Drag net teams in operation within seagrass areas High FishBase (Froese and Pauly, 2015) and numerous identification
Kilimani No fishing activity observed Low guides (Richmond, 2011; Smith and Heemstra, 2012; Taquet and
Maruhubi Fishers using fishing rod, high boat traffic Low Alain, 2012). All fish species identified were then categorized into
Mwbeni Fishers utilizing basket traps and spear Low four categories based on perceived value to small-scale fisheries
Stone Town Bay No fishing activity observed Low sectors [based on Thyresson et al. (2013)]; (i) Low Value [species
Stone Town Harbor No fishing activity observed, high boat traffic Low not mentioned by Thyresson et al. (2013)], (ii) Local Household,
Sume Drag net teams in operation within seagrass High (iii) Small-Scale Trader and (iv) Town Market (Table 3).
Unguja Ukuu Drag net teams in operation within seagrass, fishers High
utilizing basket traps Data Analysis
A semi-qualitative two-point scale was used to classify fishing activity based off All statistical analyses were conducted using R version 3.6.3 (R
observations in leu of publicly available reported data. Development Core Team, 2020). We first calculated community
Frontiers in Marine Science | www.frontiersin.org 5 April 2021 | Volume 8 | Article 640528Jones et al. Seagrass Structure Drives Fish Assemblages
weighted functional trait indices (functional dispersion) and Principle Component Analysis (PCA) was performed using the
functional richness using the FD package in R (Laliberté and prcomp() function in R and the values for PC1 decomposed and
Legendre, 2010). Using a trait matrix based on leaf growth exported to create a single variable accounting for the majority
form and canopy type (see seagrass community structure), of variance (James and McCulloch, 1990; Harrison et al., 2018).
we calculated functional dispersion by using species trait We accounted for dispersion in meadow structure (e.g., whether
scores and species abundance (based on species composition). meadows are similar in their structural properties) by computing
Functional dispersion, a measure of functional diversity, is a PCA on all structural quadrat variables (n = 1210) and
defined as the mean distance in multidimensional trait space calculated the coefficient of variation (mean/standard deviation)
of individual species to the centroid of all species, weighted by for the PC1 values for each of the 55 plots. We called this variable
abundance (Laliberté and Legendre, 2010); in other words how meadow structure variability. We also used the PCA approach
morphologically different each seagrass species is compared to for seagrass composition (% composition of each species present
the average seagrass morphology in the local community. The as a proportion of total cover) and for land-use (% area of bare
same approach was used for functional richness, but negated ground, human development, aquaculture, farmland, vegetation,
species abundance and instead used species presence to account ocean within a 2 km radius and distance to catchment).
for richness. Seagrass community variables were grouped into In the PCA of meadow structure, PC1 accounted for 58.02%
four distinct categories pertinent to the hypotheses: meadow of the variance. All variables had substantial factor loadings on
structure (shoot density, canopy height, leaf length, leaf width, PC1 which was negatively correlated with canopy height, leaf
and number of leaves per shoot), cover and composition (seagrass length, leaf width and number of leaves per shoot and positively
cover, seagrass composition), richness (species richness, functional correlated with shoot density (Supplementary Figure 1). We
richness) and functional dispersion (Table 1). Given that multiple inverted this axis so that high PC1 values represent high
variables were included within the category meadow structure, a seagrass structural complexity (e.g., higher canopy, longer
TABLE 3 | Fish families recorded in this study and their frequency across samples.
Small-scale fishery sector
Fish Family Frequency (%) Limited value (LV) Local household (LH) Small-scale trader (SST) Town market (TM)
Apogonidae 4 X
Atherinidae 4 X
Aulostomidae 2 X
Belonidae 2 X
Carangidae 4 X X
Chaetodontidae 2 X
Ephippidae 2 X
Fistulariidae 2 X
Gerridae 13 X
Gobiidae 2 X
Haemulidae 5 X X
Labridae 51 X
Lethrinidae 75 X X
Lutjanidae 2 X X X
Monacanthidae 2 X
Mullidae 35 X X
Muraenidae 20 X
Nemipteridae 5 X
Ophichthidae 2 X
Ostraciidae 2 X
Pomacentridae 15 X
Scaridae 55 X
Siganidae 53 X X
Sphyraenidae 9 X
Teraponidae 4 X
Tetraodontidae 11 X
Families are also grouped by their value to small-scale fishery agent categories based on data presented in Thyresson et al. (2013). Limited value represents fish
species not mentioned by fishermen in Thyresson et al. (2013). Families were only included in categories if they were reportedly sold to that agent category by over
50% of fishermen.
Frontiers in Marine Science | www.frontiersin.org 6 April 2021 | Volume 8 | Article 640528Jones et al. Seagrass Structure Drives Fish Assemblages
and wider leaves, greater number of leaves per shoot) and the rsquared() function from the piecewiseSEM package for R
low values represent low seagrass structural complexity. For (Lefcheck, 2016).
seagrass composition, PC1 accounted for 53.35% of variation
and was positively associated with higher abundance of canopy-
forming species (e.g., T. ciliatum) and negatively associated with RESULTS
shorter, meadow-forming species (e.g., C. serrulata, T. hemprichi;
Supplementary Figure 2). In the PCA for land-use, PC1 was General Description of Fish Assemblages
responsible for 58.14% of variance and negatively associated A total of 1,676 individual fish, representing 65 species and
with area of human development and farmland, and positively 26 families, were recorded. Many of the species were rare
associated with distance from catchment and area of ocean ( 0.7) (Dormann et al., 2013). Based on these tests we excluded had a positive effect on fish abundance; meadows with taller
distance to mangrove, distance to coral reef, distance to landing canopies, longer, broader and more numerous leaves and lower
site and fishing pressure from the final variable set, as all were shoot density had higher fish abundances (Figure 3). All other
strongly correlated with land-use (Supplementary Figure 4). models had a 1 AIC > 10, and only seagrass cover, functional
Our final variable set consisted of 9 predictors (seven seagrass dispersion and meadow structure variability were better predictors
community predictors, two environmental predictors), all with of fish abundance than the null model (Table 4).
VIF values < 3 (Zuur et al., 2010). In terms of fish richness, the best model included an
Using linear mixed-effects models (Zuur et al., 2009), we interaction between seagrass cover and land-use, as well as the
explored the relative importance of seven seagrass variables effect of depth, and had an AICc weight of 0.36 (R2 = 0.40;
(meadow structure, meadow structure variability, seagrass cover, Table 4). Seagrass cover positively influenced fish richness at
seagrass species richness, community composition, functional sites with low levels of human development. This influence
richness and functional dispersion), depth and land-use on two declined with increasing human development, with no effect
response variables: fish abundance and fish species richness. We at the highest levels of development (e.g., sites close to large
also computed models to evaluate the effects of seagrass variables human populations; Figure 4). However, while seagrass cover
on the abundance of fish within the four value categories. Linear had little effect at sites with the highest levels of human
mixed-effects models were fitted with the lmer() function in the development, it was at these sites where we recorded high fish
lme4 package for R (Bates et al., 2015). Each of the seagrass species richness – regardless of whether seagrass cover was low or
predictors was tested independently with an interaction with high. Meanwhile, fishing pressure was negatively associated with
land-use and depth as fixed predictors, given that land-use human development (see Supplementary Material Appendix 1
influences seagrass condition (Quiros et al., 2017) and depth and Figure 1). Consequently, sites with higher fish richness were
influences fish abundance (Alonso Aller et al., 2014). Given that also sites with lower fishing pressure. Finally, depth influenced
the 55 plots were nested within 12 sites, all models included a fish assemblages, with generally greater richness observed in
random effect of site to account for biogeographic differences deeper seagrass areas.
in environmental conditions and potential differences in fishing Meadow structure was also a strong predictor of seagrass fish
pressure (given we excluded it). Based on Akaike’s Information richness, with an AICc weight of 0.20 (R2 = 0.44), with an additive
Criterion (AIC) scores (Akaike, 1974), we then pruned each effect of depth (1 AIC < 2). As with fish abundance, meadow
model without removing the seagrass variable itself. We also structure and depth had a positive effect on fish richness; generally
included a null model that included land-use, depth and the deeper seagrass meadows with complex canopy structures (high
random factor of site to compare against seagrass predictors. We canopy, long and more numerous leaves, but low shoot density)
report the fit of models using R2 GLMM which was calculated using had greater fish richness (Figure 5). All other models had a 1
Frontiers in Marine Science | www.frontiersin.org 7 April 2021 | Volume 8 | Article 640528Jones et al. Seagrass Structure Drives Fish Assemblages
TABLE 4 | Candidate models for fish abundance (MaxN) and richness, sorted by AIC corrected for small sample sizes.
Response Predictors K AICc 1 AICc AICc Wt R2 GLMM
Fish Abundance (MaxN) Meadow structure + depth 5 156.8 0.0 0.99 0.73
Seagrass cover * land-use + depth 7 166.8 10.0 0.01 0.49
Functional dispersion + land-use + depth 6 168.1 11.3 0.00 0.57
Meadow structure variability + depth 5 170.4 13.6 0.00 0.53
Land-use + depth (null model) 5 170.5 13.7 0.00 0.50
Seagrass composition + depth 5 171.9 15.1 0.00 0.53
Functional richness + depth 5 172.0 15.2 0.00 0.53
Seagrass richness + depth 5 172.2 15.4 0.00 0.52
Fish Richness Seagrass cover * land use + depth 7 289.8 0.0 0.36 0.40
Meadow structure + depth 5 290.9 1.2 0.20 0.44
Meadow structure variability * land-use + depth 6 291.8 2.1 0.14 0.37
Land-use + depth (null model) 5 291.9 2.2 0.12 0.35
Seagrass composition + land-use + depth 6 293.6 3.8 0.05 0.34
Functional dispersion + land-use + depth 6 294.0 4.2 0.04 0.37
Functional richness + land-use + depth 6 294.1 4.3 0.04 0.36
Seagrass richness + land-use + depth 6 294.3 4.5 0.04 0.35
All models included a random effect of site. Models in bold represent models with a 1 AICc < 2.
FIGURE 3 | Conditional effect plots for the model best predicting log fish abundance (R2 = 0.73) in tropical seagrass meadows across 12 sites. Predictor variables
include (A) meadow structure (inverse of PC1) and (B) log depth (m). Shaded areas represent 95% confidence intervals, reflecting the variance of the fixed effects.
Frontiers in Marine Science | www.frontiersin.org 8 April 2021 | Volume 8 | Article 640528Jones et al. Seagrass Structure Drives Fish Assemblages
FIGURE 4 | Conditional effect plots for the model best predicting fish richness (R2 = 0.47) in tropical seagrass meadows across 12 sites. Predictor variables include
(A) the interaction between land-use (low, medium, high) and seagrass cover (%), and (B) log depth (m). Shaded areas represent 95% confidence intervals, reflecting
the variance of the fixed effects.
FIGURE 5 | Conditional effect plots for the second-best model predicting fish richness (R2 = 0.42) in tropical seagrass meadows across 12 sites. Predictor variables
include (A) meadow structure (inverse of PC1) and (B) log depth (m). Shaded areas represent 95% confidence intervals, reflecting the variance of the fixed effects.
AIC score > 2, and only meadow structure variability was a better Seagrass Meadow Variables Driving
predictor than the null model (Table 3).
Abundance of Fish Important to
For both response variables tested (fish abundance and
richness), seagrass richness, functional richness and seagrass Small-Scale Fishery Sectors
composition were poor predictors of fish richness, all with AICc Three models with a cumulative AICc weight of over 0.83, were
weights of less than 0.05 for both response variables (Table 4) and important for driving the abundance of fish important for sale
performing worse than the null model. at town markets (e.g., Carangidae, Sphyraenidae, and Mullidae;
Frontiers in Marine Science | www.frontiersin.org 9 April 2021 | Volume 8 | Article 640528Jones et al. Seagrass Structure Drives Fish Assemblages
Table 5). These were seagrass meadow structure (R2 = 0.47), human development. Seagrass meadow structure was positively
functional dispersion (R2 = 0.44) and seagrass cover (R2 = 0.34; associated to fish abundance.
Table 5). Meadow structure and depth had positive effects on Finally, the abundance of fish species with a limited or low
abundance for this fish group (Figure 6), as did seagrass cover, value to small-scale fisheries sectors was best explained by two
which included the additive effects of land-use and depth (both models, with a cumulative AICc weight of 0.69. These were
of which were positive for abundance). However, functional meadow structure variability (R2 = 0.25) and seagrass cover
dispersion had a negative effect on abundance, with more fish (R2 = 0.30; Table 5). Both models included an effect of depth,
present when certain functional traits are present. and the seagrass cover model also included an interaction between
The abundance of fish important for sales to small-scale seagrass cover and land-use. As with total fish richness, the
traders was primarily explained by seagrass meadow structure models suggested that seagrass cover was important for driving
(Figure 6), with an AICc weight of 0.78 (R2 = 0.63). Meadow fish abundance in areas of low human development but not
structure and depth influenced fish abundance (Table 5), with in high. Meadow structure variability had a negative effect on
deeper and more complex meadows (e.g., high canopy height, the abundance of fish with limited or low value; sites with
leaf length) characteristic of higher abundance of fish from this higher more variable structural traits had lower abundance
fishery sector. All other models had a 1AIC of > 2. of fish species.
The abundance of fish important to local household
consumers was best predicted by two candidate models with a
cumulative AICc weight of 0.70 (Table 5). Functional dispersion DISCUSSION
was the best predictor (R2 = 0.47) followed by seagrass
structure (R2 = 0.21). In the top model, functional dispersion The present study provides a unique analysis of the relationship
and land-use both had a negative effect on fish abundance, between different features of seagrass habitats and their
suggesting more fish are present when certain functional traits associated fish assemblages. We show that specific seagrass
are in high abundance, situated away from areas with high traits and seagrass cover drive seagrass fish assemblages, and
TABLE 5 | Candidate models for fish abundance across small-scale fishery sectors, sorted by AIC corrected for small sample sizes.
Response Predictors K AICc 1 AICc AICc Wt R2 GLMM
Town Market Meadow structure + depth 5 166.0 0.0 0.30 0.47
Functional dispersion + depth 6 166.1 0.0 0.30 0.44
Seagrass cover + land-use + depth 6 166.6 0.6 0.23 0.34
Seagrass composition + depth 5 169.4 3.4 0.06 0.41
Seagrass richness + land-use + depth 6 170.0 4.0 0.04 0.37
Meadow structure variability + land-use + depth 6 170.4 4.3 0.03 0.35
Functional richness + land-use + depth 6 170.5 4.4 0.03 0.35
Small-scale trader Meadow structure + depth 5 165.7 0.0 0.78 0.63
Functional dispersion + land-use + depth 6 169.1 3.4 0.14 0.56
Seagrass cover + land-use + depth 6 171.8 6.1 0.04 0.43
Meadow structure variability + depth 5 173.8 8.1 0.01 0.49
Seagrass composition + depth 5 174.1 8.4 0.01 0.50
Seagrass richness + depth 5 174.2 8.5 0.01 0.50
Functional richness + depth 5 174.3 8.6 0.01 0.50
Local household Functional dispersion + land-use + depth 6 190.2 0.0 0.51 0.47
Seagrass cover + land-use + depth 6 192.2 2.0 0.19 0.21
Meadow structure + land-use + depth 6 192.9 2.7 0.13 0.31
Functional richness + land-use + depth 6 194.3 4.2 0.06 0.28
Seagrass richness + land-use + depth 6 195.2 5.0 0.04 0.24
Meadow structure variability + land-use + depth 6 195.7 5.5 0.03 0.24
Seagrass composition + land-use + depth 6 195.7 5.5 0.03 0.24
Low value Meadow structure variability + depth 5 142.3 0.0 0.45 0.25
Seagrass cover * land-use + depth 7 143.5 1.2 0.24 0.30
Meadow structure + depth 5 144.7 2.4 0.13 0.26
Seagrass richness * land-use + depth 7 146.0 3.7 0.07 0.27
Seagrass composition * land-use + depth 7 146.9 4.6 0.05 0.26
Functional richness + depth 5 147.9 5.6 0.03 0.17
Functional dispersion + depth 5 148.2 5.9 0.02 0.18
All models included a random effect of site. Models in bold represent models with a 1 AICc < 2.
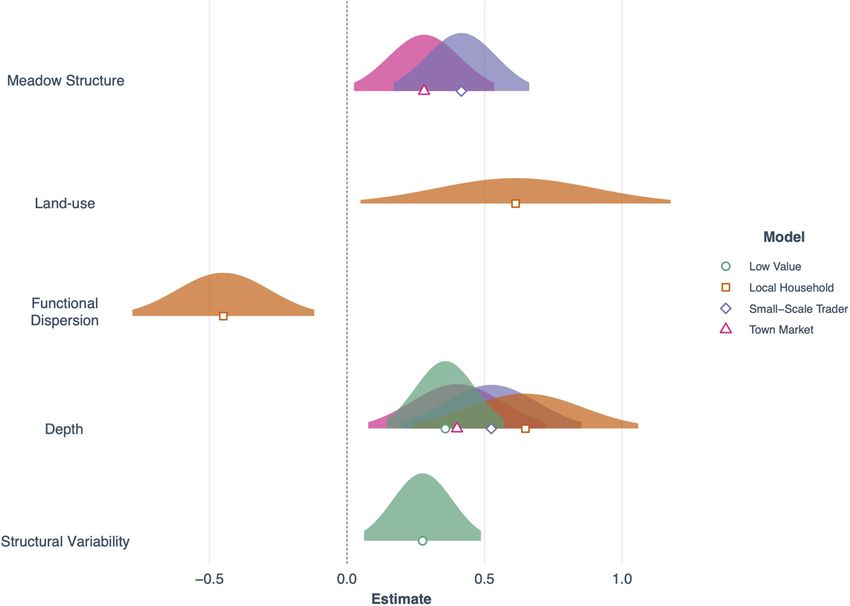
Frontiers in Marine Science | www.frontiersin.org 10 April 2021 | Volume 8 | Article 640528Jones et al. Seagrass Structure Drives Fish Assemblages FIGURE 6 | Forest plot showing the effects of seagrass and environmental predictors across the four fish value categories used in this study (Low value, Local household, Small-scale trader and Town market). Plotted are normal distributions of 95% confidence intervals. that seagrass species diversity (both taxonomic and functional) Unlike any previous work (which focus on one or two seagrass had little effect. Understanding how biodiversity influences the species), our study tested the relative importance of all seagrass structure and function of faunal assemblages is key (Morin et al., genera found within the tropical seascape and can suggest that the 2018), and a necessity for more effective marine protection. important traits (e.g., long leaves, high canopy) were primarily While trait-based approaches have been utilized to gain a greater driven by dominant seagrass species rather than high seagrass understanding of the mechanisms that drive fish assemblages in species diversity (e.g., mass ratio: Grime, 1998; Díaz et al., coral reefs (Darling et al., 2017), this study is one of few to use 2007). So far we can only speculate on the reason(s) behind such an approach for seagrass meadows. the lack of a seagrass diversity (richness, functional dispersion, In our study, seagrass meadow structure consistently etc.) effect. One potential reason could be that the diversity drove two fish assemblage indicators; abundance (MaxN) gradient is relatively short (1-6 co-occurring species in plots) and richness. Specifically, seagrass meadows with greater compared to that in e.g., terrestrial grasslands, or that co- structure (e.g., higher canopy, longer and wider leaves, occurring seagrass species may compete more than complement greater numbers of leaves per shoot, and lower overall shoot each other (e.g., many are functionally similar in terms of density) harbored faunal assemblages with greater abundance structure). It should also be noted that our results do not and richness (Figure 7). We stress here the importance of exclude the possibility of stronger seagrass diversity effects at structural complexity in influencing seagrass fish assemblages larger spatial and/or temporal scales (Bracken et al., 2017) or (Gullstrom et al., 2008), given that more structurally complex for other processes/functions or ‘ecosystem multifunctionality’ meadows increase habitat complexity and the availability (Lefcheck et al., 2015). of food resources, and reduce predation pressure (Hovel Depth was also a factor driving fish assemblages, supported et al., 2002; Vonk et al., 2010). However, in our analysis, we by previous studies conducted in Zanzibar (Gullstrom et al., compressed numerous seagrass trait characteristics into a 2008; Alonso Aller et al., 2014), as well as others in the tropics single variable, meadow structure, which accounted for 58% that show that deep seagrass meadows are important for species of variability across sites. Therefore, in our attempt to create such as emperors and rabbitfish (Hayes et al., 2020). Given an index for seagrass structural complexity, we advertently both these fish groups accounted for a large proportion of lost variability which is important to note when interpreting overall fish abundance, this may explain these findings. Using a these findings. novel technique to locate seagrass meadows within the region, Frontiers in Marine Science | www.frontiersin.org 11 April 2021 | Volume 8 | Article 640528
Jones et al.                                                                                                            Seagrass Structure Drives Fish Assemblages

  FIGURE 7 | Conceptual diagram showing how seagrass structural complexity influences seagrass social-ecological systems. Seagrass meadows with taller
  canopies, longer and wider leaves and more numerous leaves per shoot have greater fish abundance and richness, and in particular support species of value to
  small-scale fisheries.

Esteban et al. (2018) showed that deep seagrass meadows,                             et al., 2019), but still harbored high abundances of both fish
comprised of a single dominant species (T. ciliatum), supported                      and perceivably healthy seagrass communities. In these areas,
diverse and near-pristine fish assemblages. The broadly positive                     seagrass cover (or meadow structure) had no effect on fish
effects that we see here may be due to several factors such                          richness; the simple presence of seagrass was enough to support
as their likely position within the seascape and the increased                       high fish richness.
likelihood of being in closer proximity to adjacent coral habitat                       In general, the strong effects of seagrass meadow structure,
(Gullstrom et al., 2008).                                                            seagrass cover and depth were also observed when looking at the
    Seagrass fish richness was best explained by an interaction                      abundance of fish species valuable to town markets and small-
between seagrass cover and land-use intensity; a variable                            scale traders. The fish species included in these value categories
negatively correlated with fishing pressure. Conforming to                           were primarily predators (fish and invertebrate feeders), with
previous studies in the region (e.g., Alonso Aller et al., 2014),                    exception of herbivorous parrotfish and rabbitfish. For the
the positive effect of seagrass cover on fish richness decreased                     predators, the positive effects of complexity are likely driven
with increasing human impact (higher land-use), with no effect                       by increased food availability (Hovel et al., 2002; Vonk et al.,
where human populations were highest. However, in our study,                         2010); more complex structures provide a greater range of
we surprisingly found that human impacts had no single effect                        habitats for fish and invertebrates. However, these predators
on fish richness. Where there was greatest human development,                        are in turn also eaten by larger predators occasionally feeding
fish richness remained high regardless of whether seagrass cover                     in seagrass areas (e.g., sharks), so they may also benefit from
was low or high. One possible explanation for this lack of                           seagrasses for shelter. The key role of depth here is specifically
effect may be that high human development in fact acts to                            important for herbivores given commercially valuable rabbitfish
buffer local fishing pressure and benefit local fish populations,                    species use networked habitats (coral and seagrass), but have
because of the high frequency of boat traffic but also potential                     a small home range of
Jones et al. Seagrass Structure Drives Fish Assemblages sustain humans populations (Grandcourt and Cesar, 2003), our (Phalla et al., 2014), which based on our analysis here could findings provide evidence that high structure seagrass meadows provide very limited function as a fish habitat due to their are key in supporting this provision. Moreover, meadows of trait characteristics (e.g., low canopy, small leaves, low number this type support the fish species of value to fish traders (so of leaves per shoot). BRUV surveys conducted within the called ‘middlemen’); a stakeholder group instrumental in shaping MPA in Cambodia support this, with very low fish abundance social-ecological small-scale fishery systems (Crona et al., 2010; (Gourlay, 2017). Fröcklin et al., 2013). It is prudent to acknowledge that traits associated with fish Three families key in the household consumption category – assemblages may not be the only important variables to consider grunts, snappers and rabbitfish (Thyresson et al., 2013) – when thinking about ecosystem services more broadly. For are reportedly declining in the region (Benansio and Jiddawi, example, the aboveground traits that were important for driving 2016). Their abundance was negatively influenced by functional fish assemblages in this study, such as high canopy and increased dispersion – seagrass meadows with similar traits were more seagrass cover, have little effect on sedimentary carbon trapping, important – but positively influenced by depth and land use. which is instead driven by belowground traits and sediment type Given that seagrass structure was not a driver, these effects (Gullström et al., 2018). Therefore, for effective management were likely driven by meadows comprised of intermediate of seagrass meadows across the Indo-Pacific, we stress the genera like Thalassia and Cymodocea which have similar importance of pairing reason for protection with ecological traits, that were closer to areas of human populations with functions. This is fundamental given calls for community seagrass greater epiphyte coverage. Epiphytic material is an important conservation based on payments for ecosystem services (UNEP, food source for many small invertebrate grazers in tropical 2020). As seagrass ecosystem provision is non-linear among seagrass meadows (Belicka et al., 2012), which can be a seagrass taxa it is not economically, ecologically or socially primary food source for juvenile grunts and snappers (de efficient and sustainable to protect seagrass meadows if the la Moriniere et al., 2003). Likewise, epiphytes constitute an seagrass species present do not provide the ecosystem services in important food source for generalist herbivores like rabbitfish question (Nordlund et al., 2016). (Ebrahim et al., 2020b). In conclusion, we show that fish assemblages in tropical Fish categorized as low value were primarily small bodied seagrass meadows are driven by characteristics provided by omnivores, and while the effect size was low, the local dominant species, such as high structural complexity and cover, abundance of these species was driven by high variability as more broadly by depth. Consequently, we show that seagrass in seagrass structural traits (i.e., high coefficient of variation diversity (both functional and species) had little effect on fish for seagrass structure). Omnivores select food based on a assemblages. While this study was conducted in Zanzibar Island, range of characteristics including nutrition, shape and texture. Tanzania, the seagrass species studied here are common across Meanwhile, Prado and Heck (2011) found that variability in the Indo-Pacific in similar densities (e.g., Short et al., 2007; seagrass structural traits — different seagrass shapes and sizes — Ambo-Rappe et al., 2013; Jones et al., 2018; Jinks et al., 2019), were a dominant driver of food choice. Specifically, this is because provide habitat for the same groups of fish families (Unsworth narrow (e.g., Halodule, Syringodium) and paddle shaped (e.g., et al., 2008; Pogoreutz et al., 2012; Honda et al., 2013) and Halophila) seagrass leaves are easier to manipulate for smaller are subsequently targeted by small-scale fishers (e.g., Cullen- bodied fish (Prado and Heck, 2011). This likely explains why the Unsworth et al., 2014; de la Torre-Castro et al., 2014; Quiros et al., abundance of this fish category increased with trait variability 2018). Our findings are therefore not just useful for Zanzibar, but was not influenced to the same extent by meadow structure but across the Indo-Pacific and show that different types of (e.g., dominant traits). Finally, it should be noted that while these seagrass meadows have different values for both ecology and species were low value in fishery terms, they can contribute to society. Placing the results of this study in a social-ecological important ecological functions such as regulating epiphyte loads systems context, focusing on fisheries, then leaves us in a (Gilby et al., 2016). predicament. From an ecological perspective, priority areas for Conservation is generally underpinned by protecting key seagrass conservation are high cover and high canopy, as these species or habitats (Caveen et al., 2014). This has led to the are areas with both the highest abundance and richness of fish creation of numerous well intentioned yet misplaced marine species. Yet from a social perspective, these areas are likely the protected area’s (MPA’s), which fail to meet the function best and most favorable fishing grounds. On the one hand, they were intended for Jantke et al. (2018). In the wake protecting these habitats either as an MPA or no take area of calls to acknowledge seagrass meadows within the marine would therefore force fishers to increase fishing effort in other conservation agenda (e.g., Unsworth et al., 2019a), we are areas, with implications for livelihoods and food security. On the increasingly seeing seagrass meadows protected or highlighted other hand, protecting seagrass areas with the most abundant as priority areas for protection (e.g., as nursery areas or for fish assemblages may, in theory, generate enough ‘spillover’ to ‘blue carbon’). However, a failure to align policy with science, enhance fisheries in those nearby areas (McClanahan and Mangi, means these protected seagrass areas could have a limited 2000; Januchowski-Hartley et al., 2013). Our study revealed that function for the reasons that they have been protected. For seagrass sites in Zanzibar close to large human populations example, Cambodia’s first MPA designates seagrass for its nursery have high fish richness and abundance, and low relative fishing function (Boon et al., 2014), yet the meadow in question is intensity. While the mechanisms underpinning this need further dominated by sparse growing Halodule and Halophila spp. study, qualitative observations suggest that fishers perceive these Frontiers in Marine Science | www.frontiersin.org 13 April 2021 | Volume 8 | Article 640528
Jones et al.                                                                                                                           Seagrass Structure Drives Fish Assemblages

areas as either too ’dirty’ (polluted) or inaccessible due to the                              BJ collected and analyzed all data and led the writing of the
high frequency of boat traffic, to utilize as fishing grounds. These                           manuscript. All authors contributed critically to the drafts and
findings somewhat flip the so called human ‘gravity’ hypothesis                                gave final approval for publication.
that exists for coral reefs (Cinner et al., 2018), i.e., that with
increasing human population size and accessibility to coral reefs
conservation gains are diminished (increased fish biomass and
                                                                                               FUNDING
predators). Whether this is specific to Zanzibar or a wider case
for seagrass warrants further investigation. If this is indeed the                             This research was supported by the Swedish Research Council
case, then these relatively unfished areas adjacent to areas of                                (Grant Numbers 2017-05535 and 2017-05411). Open Access fees
high land-use could become a priority, or an easy win, for                                     were provided by Stockholm University.
fisheries management strategies, that could help fuel recruitment
for nearby and fished areas.

                                                                                               ACKNOWLEDGEMENTS
DATA AVAILABILITY STATEMENT
                                                                                               The authors would like to thank local boat operators in Zanzibar,
The datasets presented in this study can be found in online                                    and in particular Mwinyi Mwaka of Unguja Ukuu for providing
repositories. The names of the repository/repositories and                                     valuable local ecological knowledge.
accession number(s) can be found below: All data and R code is
available from https://github.com/BoardshortsBen/SeagrassFish.
                                                                                               SUPPLEMENTARY MATERIAL
AUTHOR CONTRIBUTIONS
                                                                                               The Supplementary Material for this article can be found
BJ, JE, and LN conceived the ideas and designed the study with                                 online at: https://www.frontiersin.org/articles/10.3389/fmars.
methodological input from RU and site choice input from NJ.                                    2021.640528/full#supplementary-material

REFERENCES                                                                                     Benkwitt, C. E., Wilson, S. K., and Graham, N. A. J. (2020). Biodiversity increases
                                                                                                  ecosystem functions despite multiple stressors on coral reefs. Nat. Ecol. Evol. 4,
Akaike, H. (1974). A new look at the statistical model identification. IEEE Trans.                919–926. doi: 10.1038/s41559-020-1203-9
   Autom. Control 19, 716–723. doi: 10.1109/tac.1974.1100705                                   Beukers, J. S., and Jones, G. P. (1998). Habitat complexity modifies the impact of
Alonso Aller, E., Gullström, M., Eveleens Maarse, F. K. J., Gren, M., Nordlund,                   piscivores on a coral reef fish population. Oecologia 114, 50–59. doi: 10.1007/
   L. M., Jiddawi, N., et al. (2014). Single and joint effects of regional- and local-            s004420050419
   scale variables on tropical seagrass fish assemblages. Mar. Biol. 161, 2395–2405.           Bond, M. E., Babcock, E. A., Pikitch, E. K., Abercrombie, D. L., Lamb, N. F., and
   doi: 10.1007/s00227-014-2514-7                                                                 Chapman, D. D. (2012). Reef sharks exhibit site-fidelity and higher relative
Ambo-Rappe, R., Nessa, M. N., Latuconsina, H., and Lajus, D. L. (2013).                           abundance in marine reserves on the Mesoamerican Barrier Reef. PLoS One
   Relationship between the tropical seagrass bed characteristics and the structure               7:e32983. doi: 10.1371/journal.pone.0032983
   of the associated fish community. Open J. Ecol. 3, 331–342. doi: 10.4236/oje.               Boon, P. Y., Mulligan, B., Benbow, S., Thorne, B., Phalla, L., and Longhurst, K.
   2013.35038                                                                                     (2014). Zoning cambodia’s first marine fisheries management area. Cambodian
Andradi-Brown, D. A., Macaya-Solis, C., Exton, D. A., Gress, E., Wright, G.,                      J. Nat. Hist. 2014, 55–65.
   and Rogers, A. D. (2016). Assessing caribbean shallow and mesophotic reef                   Bornt, K. R., Mclean, D. L., Langlois, T. J., Harvey, E. S., Bellchambers, L. M., Evans,
   fish communities using baited-remote underwater video (BRUV) and diver-                        S. N., et al. (2015). Targeted demersal fish species exhibit variable responses to
   operated video (DOV) survey techniques. PLoS One 11:e0168235. doi: 10.1371/                    long-term protection from fishing at the Houtman Abrolhos Islands. Coral Reefs
   journal.pone.0168235                                                                           34, 1297–1312. doi: 10.1007/s00338-015-1336-5
Angelini, C., Altieri, A. H., Silliman, B. R., and Bertness, M. D. (2011). Interactions        Bracken, M. E. S., Douglass, J. G., Perini, V., and Trussell, G. C. (2017). Spatial
   among foundation species and their consequences for community organization,                    scale mediates the effects of biodiversity on marine primary producers. Ecology
   biodiversity, and conservation. BioScience 61, 782–789. doi: 10.1525/bio.2011.                 98, 1434–1443. doi: 10.1002/ecy.1812
   61.10.8                                                                                     Bruno, J. F., and Bertness, M. D. (2001). “Habitat modification and facilitation
Bates, D., Mächler, M., Bolker, B., and Walker, S. (2015). Fitting linear mixed-effects           in benthic marine communities,” in Marine Community Ecology, eds M. D.
   models usinglme4. J. Stat. Softw. 67:48.                                                       Bertness, S. D. Gaines, and M. E. Hay (Sunderland, MA: Sinauer Associates),
Belicka, L. L., Burkholder, D., Fourqurean, J. W., Heithaus, M. R., Macko,                        201–216.
   S. A., and Jaffé, R. (2012). Stable isotope and fatty acid biomarkers of                    Burke, L., Reytar, K., Spalding, M., and Perry, A. (2011). Reefs at Risk Revisited.
   seagrass, epiphytic, and algal organic matter to consumers in a pristine                       Washington, DC: World Resources Institute.
   seagrass ecosystem. Mar. Freshw. Res. 63, 1085–1097. doi: 10.1071/mf                        Caley, M. J., and St John, J. (1996). Refuge availability structures assemblages of
   12027                                                                                          tropical reef fishes. J. Anim. Ecol. 43, 414–428. doi: 10.2307/5777
Bell, J. D., and Westoby, M. (1986a). Importance of local changes in leaf height and           Campbell, S. J., Kartawijaya, T., and Sabarini, E. K. (2011). Connectivity in reef fish
   density to fish and decapods associated with seagrasses. J. Exp. Mar. Biol. Ecol.              assemblages between seagrass and coral reef habitats. Aquat. Biol. 13, 65–77.
   104, 249–274. doi: 10.1016/0022-0981(86)90109-7                                                doi: 10.3354/ab00352
Bell, J. D., and Westoby, M. (1986b). Variation in seagrass height and density over            Cappo, M., De’ath, G., and Speare, P. (2007). Inter-reef vertebrate communities of
   a wide spatial scale - effects on common fish and decapods. J. Exp. Mar. Biol.                 the Great Barrier Reef Marine Park determined by baited remote underwater
   Ecol. 104, 275–295. doi: 10.1016/0022-0981(86)90110-3                                          video stations. Mar. Ecol. Prog. Ser. 350, 209–221. doi: 10.3354/meps07189
Benansio, J. S., and Jiddawi, N. (2016). Investigating changes in fish biodiversity in         Cappo, M., Speare, P., and De’ath, G. (2004). Comparison of baited remote
   coastal villages of Zanzibar Island, Tanzania. Int. J. Fish. Aquac. 8, 117–125.                underwater video stations (BRUVS) and prawn (shrimp) trawls for assessments

Frontiers in Marine Science | www.frontiersin.org                                         14                                                  April 2021 | Volume 8 | Article 640528
You can also read