Untangling irrigation effects on maize water and heat stress alleviation using satellite data
←
→
Page content transcription
If your browser does not render page correctly, please read the page content below
Hydrol. Earth Syst. Sci., 26, 827–840, 2022
https://doi.org/10.5194/hess-26-827-2022
© Author(s) 2022. This work is distributed under
the Creative Commons Attribution 4.0 License.

Untangling irrigation effects on maize water
and heat stress alleviation using satellite data
Peng Zhu and Jennifer Burney
School of Global Policy and Strategy, University of California, San Diego, CA, USA

Correspondence: Peng Zhu (zhuyp678@gmail.com)

Received: 29 November 2020 – Discussion started: 20 January 2021
Revised: 15 September 2021 – Accepted: 25 December 2021 – Published: 15 February 2022

Abstract. Irrigation has important implications for sustain-      1   Introduction
ing global food production by enabling crop water demand
to be met even under dry conditions. Added water also cools       Irrigation – a large component of freshwater consumption
crop plants through transpiration; irrigation might thus play     sourced from water diversion from streams and groundwa-
an important role in a warmer climate by simultaneously           ter (Wallace, 2000; Howell, 2001) – allows crops to grow
moderating water and high temperature stresses. Here we           in environments that do not receive sufficient rainfall, and
used satellite-derived evapotranspiration estimates, land sur-    buffers agricultural production from climate variability and
face temperature (LST) measurements, and crop phenologi-          extremes. Irrigated agriculture plays an outsized role in
cal stage information from Nebraska maize to quantify how         global crop production and food security: irrigated lands ac-
irrigation relieves both water and temperature stresses. Un-      count for 17 % of total cropped area, yet they provide 40 %
like air temperature metrics, satellite-derived LST revealed a    of global cereals (Rosegrant et al., 2002; Siebert and Döll,
significant irrigation-induced cooling effect, especially dur-    2010). Meeting the rising food demands of a growing global
ing the grain filling period (GFP) of crop growth. This cool-     population will require either increasing crop productivity
ing appeared to extend the maize growing season, espe-            and/or expansion of cropped areas; both strategies are daunt-
cially for GFP, likely due to the stronger temperature sen-       ing under projected climate change. Cropland expansion may
sitivity of phenological development during this stage. Our       be in marginal areas that require irrigation even in the present
analysis also revealed that irrigation not only reduced wa-       climate (Bruinsma, 2009); increasing temperatures will drive
ter and temperature stress but also weakened the response         higher atmospheric vapor pressure deficits (VPDs) and raise
of yield to these stresses. Specifically, temperature stress      crop water demand and crop water losses. This increasing
was significantly weakened for reproductive processes in irri-    water demand poses a water ceiling for crop growth and
gated maize. Attribution analysis further suggested that wa-      might necessitate irrigation application over present rainfed
ter and high temperature stress alleviation was responsible       areas to increase or even maintain yields (DeLucia et al.,
for 65 ± 10 % and 35 ± 5.3 % of the irrigation yield benefit,     2019).
respectively. Our study underlines the relative importance of        However, the provision of additional irrigation water mod-
high temperature stress alleviation in yield improvement and      ifies both the land surface water and energy budgets. Addi-
the necessity of simulating crop surface temperature to bet-      tional water can result in an evaporative cooling effect, which
ter quantify heat stress effects in crop yield models. Finally,   may be beneficial for crop growth indirectly through lower-
considering the potentially strong interaction between water      ing the frequency of extreme heat stress (Butler et al., 2018).
and heat stress, future research on irrigation benefits should    High temperature stress will be more prevalent (Russo et al.,
explore the interaction effects between heat and drought al-      2014) under future warming and might result in more severe
leviation.                                                        yield losses than water stress (Zhu et al., 2019) due to re-
                                                                  duced photosynthesis, pollen sterility, and accelerated crop
                                                                  senescence in major cereals (Eyshi Rezaei et al., 2015; Rat-
                                                                  talino Edreira et al., 2011; Ruiz-Vera et al., 2018). A bet-

Published by Copernicus Publications on behalf of the European Geosciences Union.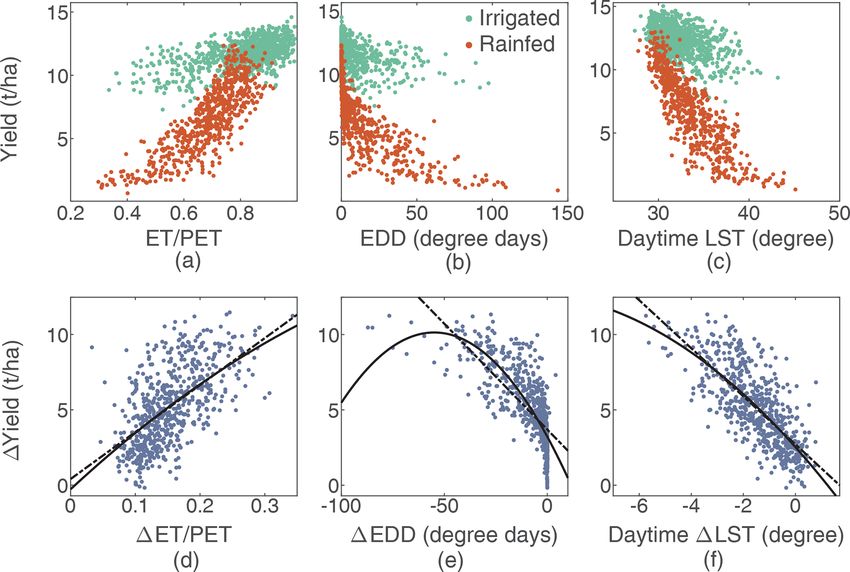
828 P. Zhu and J. Burney: Untangling irrigation effects on maize water and heat stress alleviation using satellite data

Figure 1. The spatial pattern of county-level multi-year (2003–2016) mean daily precipitation (a) and air temperature (b) during the maize
growing season. County-level multi-year (2003–2016) mean maize irrigation fraction across Nebraska (c). The maize irrigation fraction is
based on the USDA NASS report. Box plot of county-level irrigated and rainfed maize yield in Nebraska over the study period (d). The
lines in (d) show the linear fitted yield trend with a 95 % confidence interval. Box plots indicate the median (horizontal line), mean (cross),
interquartile range (box), and 5th–95th percentile (whiskers) of rainfed or irrigated yield across all counties.

ter understanding of irrigation’s potential to alleviate high             status information. For example, satellite-derived soil mois-
temperature stress will therefore be important for agricul-               ture has been used to characterize irrigation patterns and im-
tural management. More broadly, understanding how irriga-                 prove irrigation quantity estimations (Felfelani et al., 2018;
tion can or should contribute to a portfolio of agricultural              Lawston et al., 2017; Jalilvand et al., 2019; Zaussinger et
adaptation strategies thus requires improved understanding                al., 2019). Integration of satellite products like LST there-
of its relative roles in mitigating both water and heat stresses.         fore have the potential to improve our understanding of how
   Climate models and meteorological data have been used                  irrigation and climate change impact crop yields and thus
to investigate how historical expansion of irrigation at global           provide guidance for farmers to optimize management de-
and regional scales has influenced the climate system, in-                cisions.
cluding surface cooling and precipitation variation (Kang and                In this study, we focused on Nebraska, the third largest
Eltahir, 2019; Thiery et al., 2017; Bonfils and Lobell, 2007;             maize producer in the United States. Multi-year mean cli-
Sacks et al., 2009). However, many crop models still use                  mate data showed that conditions have been drier in west-
air temperature rather than canopy temperature to estimate                ern areas and warmer in southern areas of the state (Fig. 1a
heat stress; this may overestimate heat stress effects in irri-           and b). Importantly, Nebraska has historically produced a
gated cropland (Siebert et al., 2017), since canopy tempera-              mixture of irrigated and rainfed maize that facilitated com-
ture can deviate significantly from air temperature depending             parison (more than half, 56 %, of the Nebraska maize crop-
on the crop moisture conditions (Siebert et al., 2014). Re-               land was irrigated, with more irrigated maize in the western
cently, a comparison of crop-model-simulated canopy tem-                  area – see Fig. 1c – according to the United States Depart-
peratures suggests that most crop models lack sufficient abil-            ment of Agriculture; USDA, 2018a). County yield data from
ity to reproduce the field-measured canopy temperature, even              the USDA showed that interannual fluctuations in rainfed
for models with a good performance in grain yield simulation              maize yield have in general been much larger than for irri-
(Webber et al., 2017).                                                    gated maize (Fig. 1b). Although irrigated yields were higher,
   Satellite-derived land surface temperature (LST) measure-              rainfed maize yields grew faster than irrigated (an average
ments have been used to directly quantify regional-scale sur-             of 3.9 % per year versus 1.0 % per year) over the study pe-
face warming or cooling effects resulting from surface en-                riod (2003–2016) (Fig. 1b), in part because breeding tech-
ergy budget changes due to changes in land cover and land                 nology progress has improved the drought tolerance of maize
management (Loarie et al., 2011; Tomlinson et al., 2012;                  hybrids (Messina et al., 2011).
Peng et al., 2014). Importantly, yield prediction model com-                 As noted above, irrigation potentially benefits crop yields
parisons suggest that replacing air temperature with MODIS                by moderating both water and high temperature stress. Here
LST can improve yield predictions because LST accounts for                we used satellite-derived LST and satellite-derived water
both evaporative cooling and water stress (Li et al., 2019).              stress metrics to statistically tease apart the contributions of
Satellite data also provide the observational evidence to con-            irrigation to water and heat stress alleviation separately. We
strain model performance or directly retrieve crop growth                 (1) evaluated the difference in temperature and moisture con-

Hydrol. Earth Syst. Sci., 26, 827–840, 2022                                                   https://doi.org/10.5194/hess-26-827-2022
P. Zhu and J. Burney: Untangling irrigation effects on maize water and heat stress alleviation using satellite data 829
ditions over irrigated and rainfed maize croplands, (2) ex- to maturity date, and the growing season (GS) as the period
plored how irrigation mitigated water and high temperature from emergence date to maturity date. Details can be found
stresses using panel statistical models, (3) quantified the rel- in our previous studies (Zhu et al., 2018). WDRVI was used
ative contributions of irrigation-induced water and high tem- due to its higher sensitivity to changes at high biomass than
perature stress alleviation to yield improvements, and (4) ex- other vegetation indices (Gitelson, 2004) and was estimated
plored whether current crop models reproduced the observed with the following equations:
irrigation benefits for maize growth status.
NDVI = (ρNIR − ρred ) / (ρNIR + ρred ) , (1)
[(α − 1) + (α + 1) × NDVI]
2 Materials and methods WDRVI = 100 · , (2)
[(α + 1) + (α − 1) × NDVI]
We first describe the data used, followed by a brief descrip- where ρred and ρNIR are the MODIS surface reflectance in
tion of the statistical methodology. the red and near-infrared (NIR) bands, respectively. To mini-
mize the effects of aerosols, we used the 8 d composite prod-
2.1 Satellite products to identify irrigated and
ucts in MOD09Q1 and MYD09Q1 and quality-filtered the re-
non-irrigated maize areas
flectance data using the band quality control flags. Only data
We used the United States Department of Agriculture’s Crop- passing the highest quality control were retained (Zhu et al.,
land Data Layer (CDL) to identify maize croplands for each 2018). The scaling factor, α = 0.1, was adopted based on a
year in the study period 2003–2016 (USDA, 2018b). The ir- previous study to degrade the fraction of the NIR reflectance
rigation distribution map across Nebraska was obtained from at moderate-to-high green vegetation and best linearly cap-
a previous study that used Landsat-derived plant greenness ture the maize green leaf area index (LAI) (Guindin-Garcia
and moisture information to create a continuous annual ir- et al., 2012).
rigation map across US Northern High Plains (Deines et
2.3 Temperature exposure during maize growth
al., 2017). The irrigation map showed very high accuracy
(92 % to 100 %) when validated with randomly generated We used daily 1 km spatial resolution MODIS Aqua
test points and was also highly correlated with county statis- LST (MYD11A1) data to characterize the crop surface
tics (R 2 = 0.88–0.96) (Deines et al., 2017). Both the CDL temperature; since its overpassing times are at 01:30 and
and irrigation map are at 30 m resolution. We first projected 13:30 LT, it is closer to the times of daily minimum and max-
them to MODIS sinusoidal projection and then aggregated imum temperature than the MODIS Terra LST (Wan, 2008)
them to 1 km resolution to align with MODIS ET and LST and is therefore better for characterizing crop surface tem-
products. Then, pixels containing more than 60 % maize and perature stress (Johnson, 2016; Li et al., 2019). For qual-
an irrigation fraction > 60 % were labeled as irrigated maize, ity control, pixels with an LST error > 3◦ were filtered out
while pixels with > 60 % maize and < 10 % irrigation frac- based on the corresponding MODIS LST quality assurance
tion were labeled as rainfed maize croplands. As always, layers. Missing values (less than 3 % of total observations)
threshold selection involves a trade-off between mixing sam- were interpolated with robust spline function (Teuling et al.,
ples and retaining as many samples as possible. Our choices 2010). Aqua LST data are available after July 2002; we thus
of < 10 % as the threshold for rainfed maize and 60 % to de- restricted our study to the period 2003–2016. For compar-
fine irrigated maize represented the best optimization in our ison, we also obtained daily minimum and maximum sur-
sample, as we found that a more stringent threshold had a face air temperature (Tmin and Tmax ) at 1 km resolution from
very small effect on LST differences between irrigated and Daymet version 3 (Thornton et al., 2018). For both MODIS
rainfed maize at county level but resulted in significant data LST and air temperature, we calculated integrated crop heat
omission (more details in Figs. S1 and S2 in the Supplement). exposure – the growing degree days (GDD) and extreme de-
gree days (EDD) – according to the following definitions.
2.2 Maize phenology information
N
X
Maize growth stage information derived in a previous study GDD30
8 = DDt , DDt
was used to assess the influence of irrigation on maize growth t=1
during different growth stages (Zhu et al., 2018). Stage in-
0, when T < 8 ◦ C
formation, including emergence date, silking date, and matu- = T −8 when 8 ◦ C ≤ T < 30 ◦ C (3)
rity date, was derived with MODIS WDRVI (Wide Dynamic
22, when T ≥ 30 ◦ C
Range Vegetation Index, 8 d and 250 m resolution) based on
a hybrid method combining shape model fitting (SMF) and
threshold-based analysis. Then we defined the vegetative pe-
riod (VP) as the period from emergence date to silking date,
the grain filling period (GFP) as the period from silking date
https://doi.org/10.5194/hess-26-827-2022 Hydrol. Earth Syst. Sci., 26, 827–840, 2022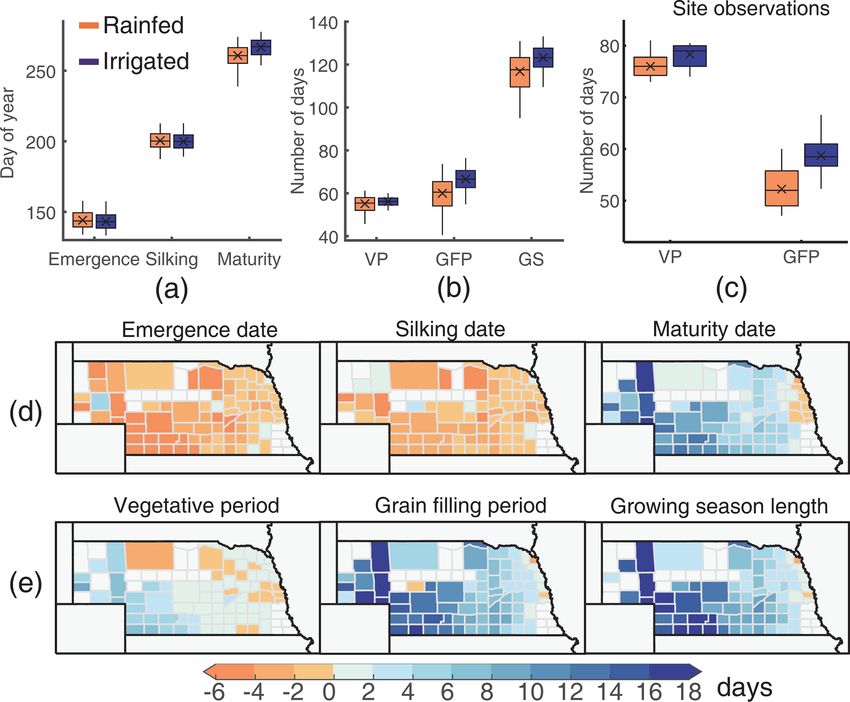
830 P. Zhu and J. Burney: Untangling irrigation effects on maize water and heat stress alleviation using satellite data

           N
           X                                                     nearly perfectly irrigated conditions. These models simulated
EDD∞
   30 =          DDt , DDt                                       maize yield, total biomass, ET, and growing stage informa-
           t=1                                                   tion (planting date, flowering date, and maturity date). Plant-
                       when T < 30 ◦ C

               0,                                                ing date occurs on the first day following the prescribed sow-
       =                                                   (4)   ing date on which soil temperature is at least 2◦ above the
               T − 30, when T ≥ 30 ◦ C
                                                                 8 ◦ C base temperature. Harvest occurs once the specified heat
Here, temperature (T ) could be either air temperature or LST,   units are reached. Heat units to maturity were calibrated from
interpolated from daily to hourly values with sine function      the prescribed crop calendar data (Elliott et al., 2015). Crop
(Tack et al., 2017). t represents the hourly time step, and      model simulation was evaluated by calculating the Pearson
N is the total number of hours in a specified growing period     correlation between simulated yields in the baseline simula-
(either the entire growing season or a specific phenological     tions and detrended historical yields for each county from the
growth phase, as defined below). Following previous studies      Food and Agriculture Organization. The management sce-
(Lobell et al., 2011; Zhu et al., 2019), we used 30 ◦ C as the   nario “harmnon” was selected, meaning the simulation us-
high temperature threshold, although higher values might be      ing harmonized fertilizer inputs and assumptions on grow-
applicable in some settings (Sanchez et al., 2014).              ing seasons. More details on the simulation protocol can be
                                                                 found in Elliott et al. (2015) and Müller et al. (2019). We
2.4   Maize water stress
                                                                 used this model comparison project outputs to shed light on
Water stress during maize growth was characterized by the        how well crop models simulated the irrigation benefits we
ratio of evapotranspiration (ET) to potential evapotranspi-      identified in different phases of crop growth.
ration (PET), as in a previous study (Mu et al., 2013). We
                                                                 2.6   Method
used MODIS products (MYD16A2) for both ET and PET
based on its good performance for natural vegetation (Mu         We used standard panel statistical analysis techniques to
et al., 2011); however, our comparison using flux-tower-         identify the impacts of irrigation on maize productivity via
observed ET at an irrigated maize site in Nebraska suggested     heat stress reduction and water stress reduction pathways.
that ET for the irrigated maize was significantly underesti-        Comparison of LST, ET, PET, ET / PET, GDD, and EDD
mated by MODIS ET (Fig. S3). We therefore also used an-          between irrigated and rainfed maize areas was performed
other ET product (SSEBop ET) to replace MODIS ET. SSE-           within each county to minimize the effects of other spatially
Bop ET was also estimated with MODIS products (Senay et          varying factors, like background temperature and manage-
al., 2013), like LST, vegetation index, and albedo as input      ment practices, on surface temperature and evapotranspira-
variables, but used a revised algorithm including predefined     tion. These biophysical variables (LST, ET, PET, ET / PET,
boundary conditions for hot and cold reference pixels (Senay     GDD, and EDD) averaged over each county were then in-
et al., 2013) and showed better performance than MODIS ET        tegrated over the vegetative period (VP, from emergence
(Velpuri et al., 2013). We also saw improved performance         date to silking date), grain filling period (GFP, from silk-
when we compared it with flux-tower-observed ET at an irri-      ing date to maturity date), and whole growing season (GS,
gated maize site (Fig. S4). The comparison of MODIS PET          from emergence date to maturity date) so we could evalu-
and flux-tower-estimated PET showed satisfactory perfor-         ate whether and how irrigation had differentially influenced
mance for MODIS PET (Fig. S5). Since MODIS PET from              maize growth during early VP and late GFP.
MYD16A2 has a spatial resolution of 500 m with 8 d tempo-           We further examined how irrigation had changed the sen-
ral resolution, while SSEBop ET has 1 km spatial resolution      sitivity of maize yield and its components to temperature
with daily time step, we reconciled the two datasets to 1 km     variation. As done in our previous study (Zhu et al., 2019),
spatial resolution and 8 d temporal resolution.                  we decomposed the total yield (t ha−1 ) variation into three
                                                                 components: biomass growth rate (BGR, t ha−1 d−1 ), grow-
2.5   Crop model simulation results
                                                                 ing season length (GSL, days), and harvest index (HI) based
We compared the results of our statistical analysis with         on the following equation:
four gridded crop models. Simulation results from pAP-
                                                                 Yield = HI · AGB = HI · BGR · GSL.                         (5)
SIM, pDSSAT, LPJ-GUESS, and CLM-crop for both rain-
fed and irrigated maize across Nebraska were obtained            Aboveground biomass (AGB, t ha−1 ) was retrieved through
from the Agricultural Model Intercomparison and Improve-         a regression model:
ment Project (AgMIP) (Rosenzweig et al., 2013) and Inter-
Sectoral Impact Model Intercomparison Project 1 (ISIMIP1)        AGB = β · IWDRVIγ ,                                        (6)
(Warszawski et al., 2014). The four models were driven
by the same climate forcing dataset (AgMERRA) and run            which was built in the previous study by regressing field-
at a spatial resolution of 0.5 arcdegree longitude and lati-     measured maize AGB against MODIS-derived integrated
tude. All simulations were conducted for purely rainfed and      WDRVI (IWDRVI) (Zhu et al., 2019). The coefficients β and

Hydrol. Earth Syst. Sci., 26, 827–840, 2022                                        https://doi.org/10.5194/hess-26-827-2022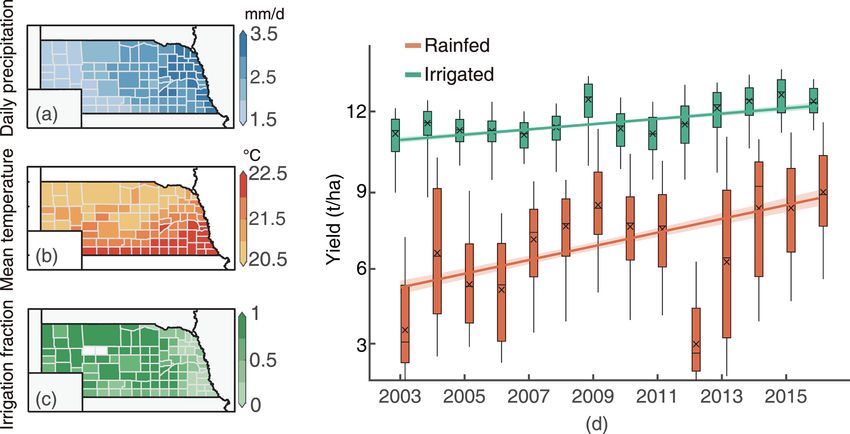
P. Zhu and J. Burney: Untangling irrigation effects on maize water and heat stress alleviation using satellite data 831

γ were estimated as 16.4 ± 2.5 (t ha−1 ) and 0.8 ± 0.08. Then          The relative contribution of water and high temperature stress
HI could be estimated as yield / AGB and BGR could be esti-            alleviation was estimated as
mated as AGB / GSL. This decomposition allowed us to ex-                                 P ET            P ET 2
amine how different crop growth physiological processes re-                            γ1 1 PET  i,t
                                                                                                     + γ2 1 PET i,t
sponded to external forcing: HI characterizes dry matter par-            P ET           P ET 2
                                                                       γ1 1 PET i,t + γ2 1 PET i,t + γ3 1EDDi,t + γ4 1EDD2i,t
                                                                                                        P           P
titioning between source organ and sink organ and is mainly
related to processes determining grain size and grain weight;          and
BGR is related to physiological processes of daily carbon as-
                                                                                         1EDDi,t + γ4 1EDD2i,t
                                                                                                 P     P
similation rate through photosynthesis, and GSL is related                                 γ3
                                                                                        P ET 2                                ,
to crop phenological development. The uncertainties in AGB               P ET
                                                                       γ1 1 PET     + γ2 1 PET     + γ3 1EDDi,t + γ4 1EDD2i,t
                                                                                                       P            P
                                                                                i,t            i,t
estimation result from the parameters in the regression model
(Eq. 6) converting IWDRVI to AGB. Here we quantified the               respectively. We also ran the model above using daytime LST
uncertainties rooted in the estimated parameters by running            difference (1LST) in lieu of 1EDD as a robustness check:
the panel model 1000 times with the samples generated from
each parameter’s 95 % confidence interval (Zhu et al., 2019).                                 ET            ET 2
                                                                       1Yieldi,t = γ1 1              + γ2 1         + γ3 1LSTi,t
    Temperature sensitivity of irrigated or rainfed                                          PET i,t        PET i,t
yield (STYield ) was estimated using a panel data model                              + γ4 1LST2i,t + Countyi + εi,t .                               (9)
(Eq. 7) with growing season mean LST and ET / PET as the
explanatory variables:                                                 To diagnose any potential collinearity between 1 PETET
                                                                                                                               and
                                    ET                                1LST, we calculated the variance inflation factor (VIF) for
log Yieldi,t = γ1 t + γ2 LSTi,t + γ3         + Countyi + εi,t . (7)    the model above. In this formulation the relative contribu-
                                     PET i,t
                                                                       tions of water and high temperature stress alleviation were
Yieldi,t is maize yield (t ha−1 ) in county i and year t. It is a      estimated as
function of overall yield trends (γ1 t) that fairly steadily in-                                 P      ET            P     ET  2
                                                                                            γ1       1 PET     + γ2       1 PET
creased over the study period (Fig. 1b), local crop temper-                                                i,t                  i,t
                                                                                                           2
ature stress (LSTi,t ), and local crop water stress ( PET                         ET                    ET
                                                                                                                                             1LST2i,t
                                                                            P                    P                    P                  P
                                                           ET i,t ).   γ1       1 PET i,t
                                                                                          + γ2       1 PET i,t
                                                                                                               + γ3       1LSTi,t + γ4
The Countyi terms provide an independent intercept for each
county (fixed effect) and thus account for time-invariant              and
county-level differences that contributed to variations in
                                                                                                                          1LST2i,t
                                                                                                 P                    P
                                                                                           γ3        1LSTi,t + γ4
yield, like the soil quality. εi,t is an idiosyncratic error term.                                                                                      ,
                                                                                                           2
γ2 or ∂ ln(Yield)                                                                 ET                    ET
                                                                                                                                             1LST2i,t
                                                                            P                    P                    P                  P
          ∂LST    defines the temperature sensitivity of yield.        γ1       1 PET i,t
                                                                                          + γ2       1 PET i,t
                                                                                                               + γ3       1LSTi,t + γ4
The temperature sensitivity of BGR (STBGR ), HI (STHI ), and
GSL (STGSL ) could be estimated with Eq. (7) in a similar              respectively.
way by using BGR, HI, and GSL as dependent variables.
Here, the dependent variable Yield (BGR, GSL, and HI) was              3     Results
logged, so the estimated temperature sensitivity represented
the percentage change in Yield (BGR, GSL, and HI) with a               As expected, irrigation improved maize yield and the yield
1 ◦ C temperature increase.                                            benefit showed a distinct spatial variation when we com-
   To quantify the relative contribution of water and high             pared areas we identified as irrigated versus rainfed maize.
temperature stress alleviation to yield benefit, we related the        The yield benefit of irrigation was much higher in the west-
yield difference between irrigated and non-irrigated maize             ern area of the state (Fig. 2a) because the drier environment
(irrigation yield-rainfed yield, 1Yield) to a quadratic func-          in the western area featured a wider yield gap between irri-
tion of growing season EDD and ET / PET differences be-                gated and rainfed cropland in an average year. The satellite-
tween irrigated and rainfed maize:                                     derived vegetation index WDRVI reflected these differences,
                                                                       with higher values in areas we identified as irrigated maize,
                      ET              ET 2                             especially around maize silking (Fig. 2b). Importantly, this
1Yieldi,t = γ1 1              + γ2 1         + γ3 1EDDi,t
                      PET i,t        PET i,t                           suggested that irrigated and rainfed croplands were distin-
              + γ4 1EDD2i,t + Countyi + εi,t .                   (8)   guishable based on satellite-derived crop seasonality infor-
                                                                       mation.
The yield improvement explained by heat and water stress                  When county-level LST data were averaged over 2003–
alleviation was estimated as                                           2016, the daytime LST in irrigated maize was 1.5◦ cooler
                                                                       than rainfed maize, while nighttime LST showed a very
                                ET 2
            ET
                                        + γ3 1EDDi,t + γ4 1EDD2i,t     slight difference (0.2◦ ) (Fig. 3a and b). When the LST
     P                    P                 P            P
γ1       1 PET i,t
                   + γ2       1 PET i,t
                                  P                                .   differences were integrated over different growing periods
                                      1Yieldi,t

https://doi.org/10.5194/hess-26-827-2022                                                   Hydrol. Earth Syst. Sci., 26, 827–840, 2022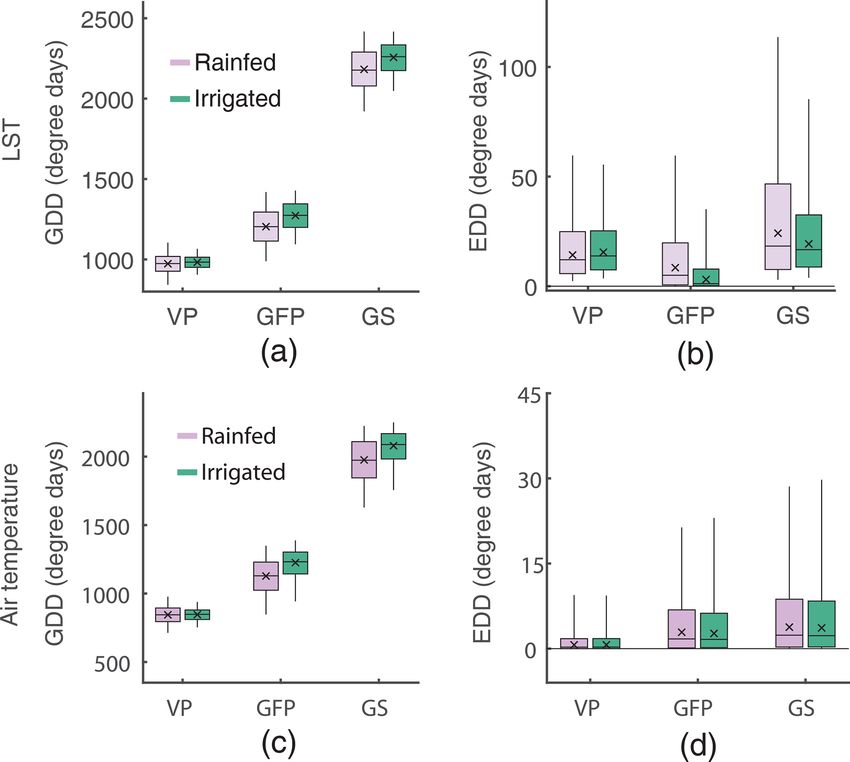
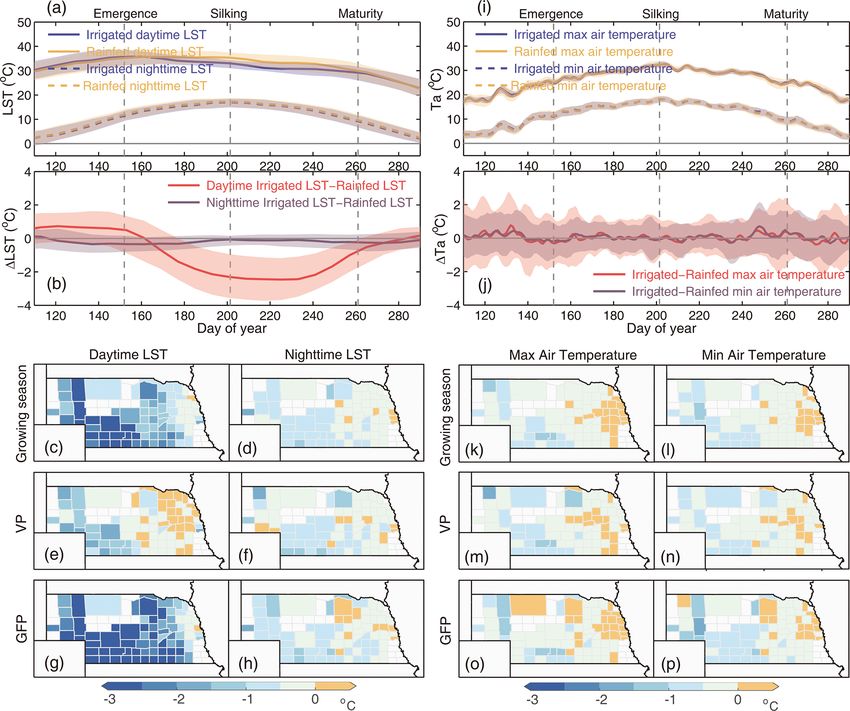
832 P. Zhu and J. Burney: Untangling irrigation effects on maize water and heat stress alleviation using satellite data

Figure 2. The difference between irrigated and rainfed maize yield (a) and satellite-observed vegetation index (b, c). The shaded area in (b)
and (c) shows 1 standard deviation of the WDRVI (b) and WDRVI difference (c).

Figure 3. Spatial–temporal patterns of daytime and nighttime MODIS LST differences (a–h) and surface air temperature differences (i–p)
between irrigated and rainfed maize in different growth stages: vegetative period and grain filling period. The shaded areas in (a), (b), (i),
and (j) show 1 standard deviation of corresponding variables.

(Fig. 3e–h), we found that the daytime cooling effect was                effect (Fig. 3i and j). The mean daytime and nighttime air
greatest in the GFP (Fig. 3g), probably due to the higher                temperature differences between irrigated and rainfed maize
LAI (or ground cover) and transpiration during that stage of             were −0.2 and −0.3◦ , respectively, and the spatial pattern
growth. This was also consistent with previous field studies             of air temperature difference over VP and GFP was also
showing that irrigation was mainly applied during the middle             relatively small between counties and crop growth periods
to late reproductive period, which corresponded to the great-            (Fig. 3k–p). The difference between spatial–temporal pat-
est water demand period (Chen et al., 2018). The spatial pat-            terns identified using LST and air temperature likely arises
tern of the LST difference showed a stronger cooling effect in           because LST reflects canopy energy partition between the la-
the western area (Fig. 3c–h), which was similar to the spatial           tent heat flux and sensible heat flux. Additional moisture pro-
pattern of yield benefit identified in Fig. 2a. In contrast, sur-        vided by irrigation results in more heat transferred as latent
face air temperature showed a much smaller daytime cooling               heat flux, creating a cooling effect.

Hydrol. Earth Syst. Sci., 26, 827–840, 2022                                                  https://doi.org/10.5194/hess-26-827-2022
P. Zhu and J. Burney: Untangling irrigation effects on maize water and heat stress alleviation using satellite data 833

Figure 4. Box plot of maize phenological date (a) and duration (b, c) for irrigated and rainfed maize areas. The spatial pattern of phenological
date and duration differences between irrigated and rainfed maize areas (d, e).

    Temperature is an important driver of crop phenology and
has been used as the primary environmental variable in crop
phenology models (Wang and Engel, 1998). Given the iden-
tified irrigation cooling, we further examined how irrigation
altered maize phenological stages. We found that irrigated
maize showed an earlier emergence and silking but delayed
maturity (Fig. 4a). Consequently, GFP was extended by 7.5 d
on average, which contributed to most of the total GS ex-
tension (8.1 d) (Fig. 4b). Site measurements of phenologi-
cal stage information confirmed that irrigated maize had a
longer GS, especially during GFP (Fig. 4c). That this exten-
sion mainly occurred during GFP could be due to the fact that
(1) LST cooling was more prominent during GFP, (2) pheno-
logical development during GFP was more sensitive to tem-
perature variation than development during VP (Egli, 2004),
and there were (3) variety differences between irrigated and
rainfed maize. The spatial pattern suggested that GS and GFP
extension was more significant in the western area of the state
(Fig. 4g and h), likely due to the corresponding stronger cool-
ing effect.                                                               Figure 5. Box plot of GDD and EDD estimated with MODIS
                                                                          LST (a, b) and surface air temperature (c, d) for irrigated and rain-
    We integrated LST or air temperature as described above
                                                                          fed maize areas. Box plots indicate the mean (cross), median (hor-
(Sect. 2.3) to estimate total heat exposure (GDD and EDD)                 izontal line), 25th–75th percentile (box), and 5th–95th percentile
over the maize growing season. We found that both LST                     (whiskers) of corresponding variables in all year and county combi-
and air-temperature-estimated GDD were greater in irri-                   nations.
gated maize than GDD in rainfed maize across most coun-
ties, especially during GFP (Fig. 5a and c), which was

https://doi.org/10.5194/hess-26-827-2022                                                    Hydrol. Earth Syst. Sci., 26, 827–840, 2022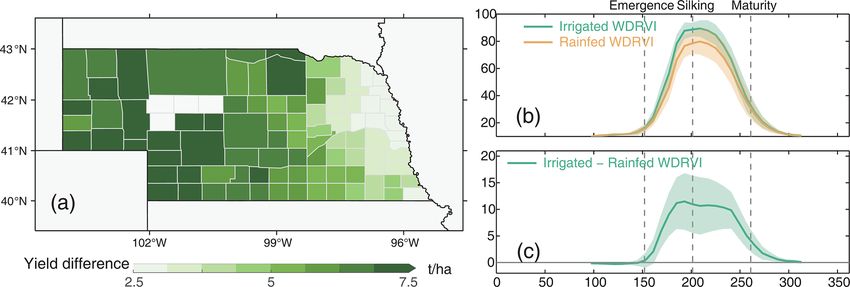
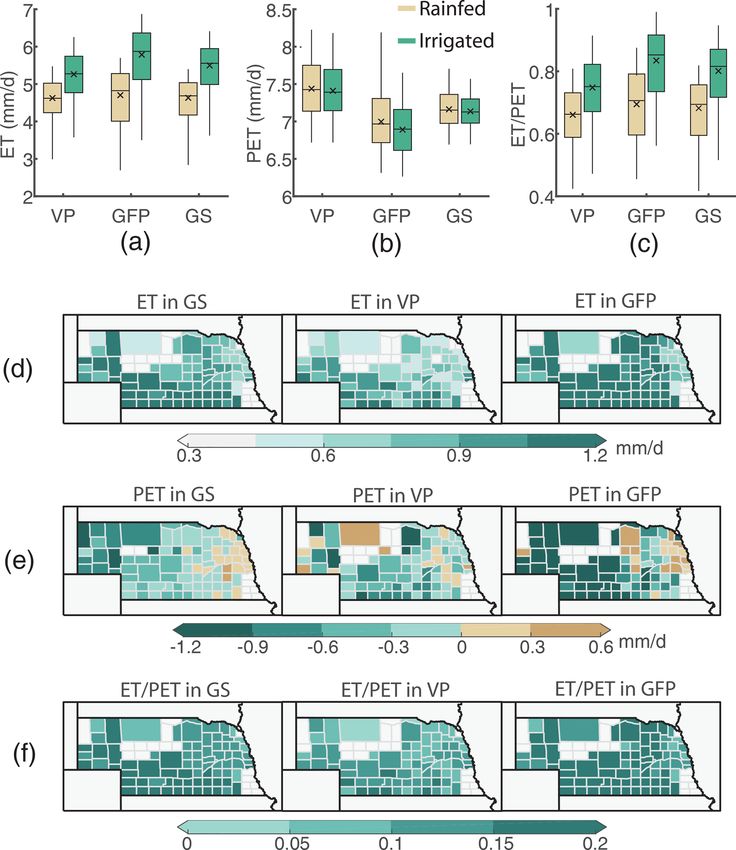
834 P. Zhu and J. Burney: Untangling irrigation effects on maize water and heat stress alleviation using satellite data

Figure 6. Box plot of SSEBop ET, MODIS PET, and ET / PET for irrigated and rainfed maize areas (a–c). Spatial pattern of SSEBop ET,
MODIS PET, and ET / PET differences between irrigated and rainfed maize areas (d–f).

very likely due to the GFP extension. As GDD character-             ing at their full potential in the ambient conditions. This ra-
izes the beneficial thermal time accumulation, the greater          tio was higher for irrigated maize, especially during the GFP
GDD in irrigated maize might contribute to the higher yield.        (Fig. 6c), and the spatial distribution suggested that the dif-
In terms of EDD, LST-estimated EDD suggested that ir-               ference was greater in western counties than eastern counties
rigation suppressed high temperature stress, especially for         (Fig. 6d and e), similar to the distribution of the local cooling
GFP (Fig. 5b), while air-temperature-estimated EDD failed           effect identified in Fig. 3c.
to characterize the irrigation-induced lower high temperature          We divided the temperature sensitivity of yield into three
stress (Fig. 5d).                                                   components (sensitivity of BGR, GSL, and HI) to investigate
   SSEBop ET and MODIS PET were used to explore how                 how irrigation changed the response of maize physiological
irrigation influenced water demand and water supply across          processes to temperature. Because collinearity between LST
maize. We found that irrigation led to 27 % higher (p <             and ET / PET was potentially worrisome, we quantified the
0.001) ET and 2 % lower (p > 0.05) PET (Fig. 6a and b).             variance inflation factor (VIF) in the model; this was found
Higher ET was anticipated in irrigated maize, and lower PET         to be well below standard thresholds, with a value of 2.8
might be due to the irrigation cooling effect, which resulted       and 3.6 for irrigated and rainfed maize yield, respectively.
in lower VPD and thus lower evaporative demand. We used             (VIFs over 10 indicate strongly collinear variables, with 5 be-
the ratio of ET to PET as a proxy for water stress in this study,   ing a more strict standard.) As shown in Fig. 7, we found
whereby low values indicated that plants were not transpir-         that temperature sensitivity of yield was significantly weak-

Hydrol. Earth Syst. Sci., 26, 827–840, 2022                                           https://doi.org/10.5194/hess-26-827-2022
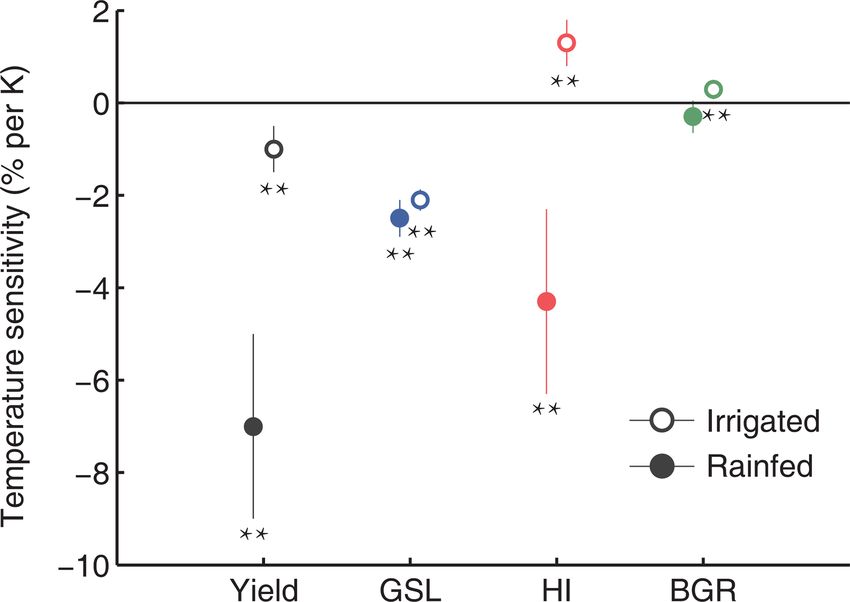
P. Zhu and J. Burney: Untangling irrigation effects on maize water and heat stress alleviation using satellite data 835
the explanatory variables. We also note that the high temper-
ature stress alleviation estimated here appears larger than the
estimation in a recent study (Li et al., 2019) wherein LST
was also employed to detect the yield benefit of the irrigation
cooling effect. But this is due to the fact that we estimated
cooling effect benefits relative to the total sum of cooling
and water stress effects, whereas Li et al. (2019) calculated
the cooling effect relative to net yield differences between ir-
rigated and rainfed maize. Since other effects (like cultivar
difference and fertilizer application) might also contribute to
the yield difference between irrigated and rainfed maize, the
denominator used in Li et al. (2019) was larger.
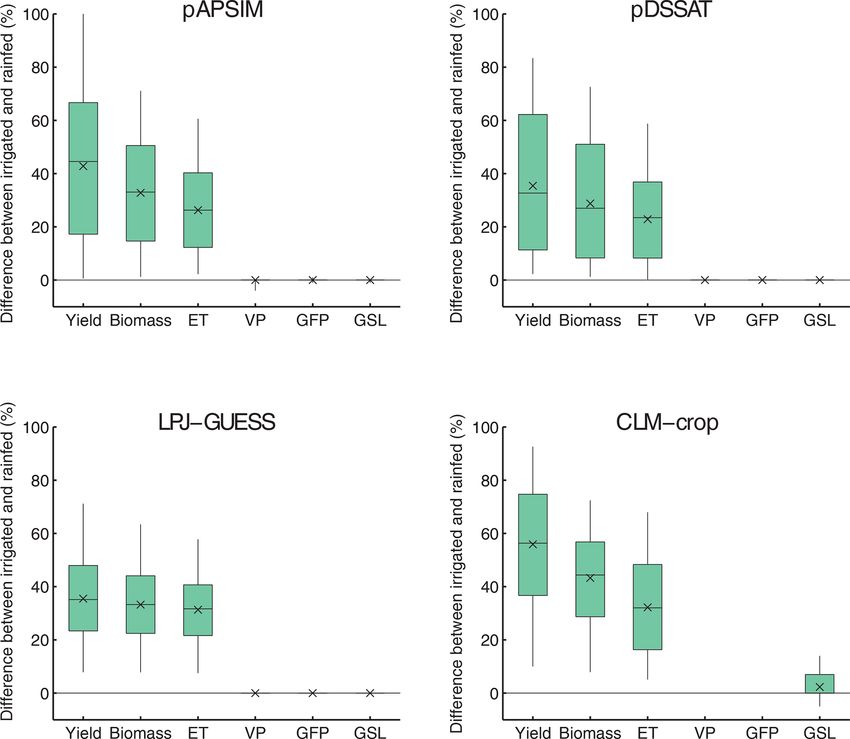
Because we found a strong effect on yields via alleviation
Figure 7. Temperature sensitivity of yield and yield compo- of heat stress (and not simply water stress), we compared
nents (GSL, HI, and BGR) for irrigated and rainfed maize areas. our results with four process-based crop models that simu-
The error bars represent the 95 % confidence interval of estimated
lated crop growth under both rainfed and irrigated conditions.
temperature sensitivity. Double asterisks (∗∗ ) indicate a significant
estimation of temperature sensitivity with p < 0.01, while a single
These simulations qualitatively reproduced the irrigation-
asterisk (∗ ) indicates significance with p < 0.05. induced higher maize yield, biomass, and ET (Fig. 9) but
to different degrees. The highest modeled improvement was
identified in CLM-crop, with increases of 57 %, 43 % and
32 % in yield, biomass and ET, respectively. However, all
ened from −6.9 % per degree (p < 0.01) to −1 % per degree models except CLM-crop failed to reproduce the grow-
(p < 0.01) in rainfed vs. irrigated areas, and this yield sen- ing stage extension under irrigation (Fig. 9), likely because
sitivity change was mainly driven by a change in the sensi- CLM-crop was the only one of the tested models to have
tivity of the HI, which was weakened from −4.2 % per de- implemented a canopy energy balance module to simulate
gree (p < 0.01) to 1 % per degree (p < 0.01). In both rainfed canopy temperature. CLM-crop was thus the only model able
and irrigated maize, temperature sensitivity of GSL was quite to capture the irrigation-induced evaporative cooling effect
close at approximately −2 % per degree (p < 0.01), while (heat stress reduction). That the best agreement between ob-
BGR was only slightly influenced by temperature (Fig. 7). served and modeled results occurred with the only model that
We found that irrigation not only lowered water and high plausibly accounted for heat stress alleviation due to irriga-
temperature stress, but also made yield less sensitive to wa- tion was further evidence that this was the phenomenon we
ter and high temperature stress (Fig. 8a–c), consistent with captured in our satellite observational study.
previous studies (Troy et al., 2015; Tack et al., 2017). For
example, field data across Africa suggest that better water
management can reduce yield loss due to heat stress from 4 Discussion and conclusion
−1.7 % per degree day to −1 % per degree day (Lobell et al.,
2011). We statistically related yield differences to climatic By integrating satellite products and ground-based informa-
variables differences using the linear model (Eq. 8) and es- tion on cropping and irrigation, we showed that irrigated
timated that 61 ± 9.4 % of yield improvement between irri- maize yields were higher than rainfed maize yields because
gated and rainfed maize could be explained by the irrigation- added irrigation water reduced heat stress in addition to water
induced heat and water stress alleviation. We further calcu- stress. Our study underlines the relative importance of heat
lated that 79 ± 13 % of that yield improvement was due to stress alleviation in yield improvement and the necessity of
water stress alleviation and 21 ± 3.2 % was due to heat stress incorporating crop canopy temperature models to better char-
alleviation. Because the distribution of 1EDD was truncated acterize heat stress impacts on crop yields (Teixeira et al.,
for points with 1EDD > 0 (Fig. 8e), we explored an alterna- 2013; Kar and Kumar, 2007). In addition, disentangling the
tive model with quadratic functions of 1LST and 1ET/PET two effects allows crop models to better predict crop phe-
(Eq. 9). In this specification, 72±12 % of yield improvement nology, considering that the irrigation-induced cooling effect
was explained by water and high temperature stress allevia- alters maize growing phases.
tion, with 65 ± 10 % and 35 ± 5.3 % of yield improvement Although ours is not the first study to suggest replacing air
due to water and high temperature stress alleviation, respec- temperature with MODIS LST for maize yield prediction, es-
tively. We also estimated VIF in the model; this was found pecially under extreme warm and dry conditions, our results
to be well below standard thresholds, with a value of 2.2. underscore important implications of doing so. Given the im-
Intuitively, our low VIF value was likely due to the use of portant role of heat stress in determining crop yield, thermal-
differences in LST and ET / PET between irrigated and rain- band-derived LST information at finer spatial and temporal
fed maize rather than directly using LST and ET / PET as resolution should be a critical input for satellite-data-driven
https://doi.org/10.5194/hess-26-827-2022 Hydrol. Earth Syst. Sci., 26, 827–840, 2022836 P. Zhu and J. Burney: Untangling irrigation effects on maize water and heat stress alleviation using satellite data Figure 8. Response of maize yield to ET / PET (a), EDD (b), and daytime LST (c) in both irrigated and rainfed maize. Response of yield differences to ET/PET (d), EDD (e), and daytime LST (f) differences between irrigated and rainfed maize. The linear (dash black line) and quadratic (solid black line) response curves of 1Yield to 1ET/PET, 1EDD, and 1LST are shown in (d)–(f). Figure 9. Box plot of crop-model-simulated yield, biomass, ET, and phenological duration (VP, GFP, and GSL) differences between irrigated and rainfed maize areas. For phenological duration, CLM-crop only reports GSL. Hydrol. Earth Syst. Sci., 26, 827–840, 2022 https://doi.org/10.5194/hess-26-827-2022
P. Zhu and J. Burney: Untangling irrigation effects on maize water and heat stress alleviation using satellite data 837

yield prediction models (Wang et al., 2015; Huryna et al.,          and other land surface temperature information, which might
2019; Li et al., 2019; Meerdink et al., 2019). In addition,         bias the identified irrigation cooling effect. Specifically, us-
given the differential responses of crop growth to heat and         ing MODIS daytime LST as a proxy for true (measured)
water stresses in different stages, fusing satellite-derived crop   maximum crop surface temperature in an empirical statistical
stage information with the heat and water stressors might im-       model might underestimate the benefit of the cooling effect
prove crop yield prediction.                                        (measurement error in a predictor variable producing attenu-
   This study also has useful implications for process-based        ation bias). These uncertainties in the LST dataset might be
crop model development. In our model evaluation, only the           resolved with the recently launched ECOSTRESS mission,
model that implemented a canopy energy balance scheme               as its hourly revisiting frequency enables better estimation
captured the observed maize growth stage extension. Our re-         of maximum daily temperature. The second issue is that wa-
sults suggest that the heat stress alleviation due to irrigation    ter stress and heat stress are not perfectly separable. As we
identified here is largely overlooked in current crop models.       have shown, the cooling effect of irrigation lowers evapora-
As such, when those crop models are calibrated to match             tive demand (PET) and thus indirectly contributes to lower
observed yields, processes associated with water stress al-         water stress (higher ET / PET). In addition, water stress re-
leviation are probably overestimated, resulting in uncertain-       duced photosynthesis and ET, resulting in higher plant tem-
ties for predicting future irrigation water demand and crop         perature. Our disentangling methods do not account for the
yield. These uncertainties might mislead future adaptation          water stress and heat stress interaction effects, so these “heat”
decisions due to incomplete or biased estimates of the rel-         and “water stress” channels should be interpreted carefully.
ative contributions of heat and water stress.                       We note that our statistical model-estimated temperature co-
   Relatedly, recent studies have compared heat stress repre-       efficient should be interpreted as the net of all effects raising
sentation in crops models which explicitly simulate canopy          surface temperature. The third issue is that our study only ex-
temperature (Webber et al., 2017). For example, STICS es-           amined maize in one state, Nebraska. Although Nebraska is
timates canopy temperature using canopy energy balances             the largest irrigated maize producer in the US, results might
which account for net radiation, soil heat flux, evapotranspi-      differ for other crop types and other landscapes due to differ-
ration, and aerodynamic resistance (Brisson et al., 2003). In       ent crop canopy structures and management practices (Chen
APSIM, canopy temperature is taken as 6 ◦ C higher than air         et al., 2018), as well as spatial variations in water and heat
temperature when the crop is fully stressed and 6 ◦ C cooler        stress mitigation effects (Figs. 3 and 7).
than air temperature when the crop is fully transpiring. Be-           Overall, our study suggests that heat stress alleviation, in
tween these limits, the basis of the expression for canopy          addition to water stress alleviation, plays an important role in
temperature is the relationship between temperature differ-         improving irrigated maize yield. Since current models gener-
ence (canopy temperature minus air temperature) and the             ally cannot accurately simulate the canopy temperature, the
ratio of actual and potential evapotranspiration (Webber et         irrigation-induced yield benefit might have been overly at-
al., 2017). This model comparison study suggests that mod-          tributed to water stress alleviation. This might bias the fu-
els using canopy temperature to account for heat stress ef-         ture yield prediction under irrigation, since high temperature
fects indeed outperform models depending on air tempera-            stress might be more dominant than drought for crop yield
ture, but the model comparison also identified a wide range         formation under future warmer climate (Zhu et al., 2019;
for the simulated canopy temperature in current crop mod-           Jin et al., 2017). Better constrained crop models – perhaps
els. Therefore, assimilating satellite-derived LST might be         through integration of satellite-observed land surface tem-
a potential solution to improving crop models’ heat stress          perature and crop stage information – will be necessary to
representation so that they can better reproduce the observed       improve yield prediction and help policy makers and farmers
heat stress effects (Meng et al., 2009; Xu et al., 2011). These     make better decisions about where and when to implement
remotely sensed LSTs can also be used to validate model-            irrigation.
simulated LST, especially given that the recent ECOsystem
Spaceborne Thermal Radiometer Experiment on Space Sta-
tion (ECOSTRESS) mission makes hourly plant temperature             Code and data availability. All data related to this paper, along
measurements available (Meerdink et al., 2019). However, it         with code for interpretation of data, are available upon request from
is worth noting that the availability of satellite LST presents     the corresponding author.
a constraint when thinking about future climate change im-
pact studies. In addition, some caution is required for validat-
ing model-simulated LST, since LST is sensor- and satellite-        Supplement. The supplement related to this article is available on-
                                                                    line at: https://doi.org/10.5194/hess-26-827-2022-supplement.
specific.
   Several limitations and caveats apply to our study. First,
the daily MODIS daytime LST we used to explain crop max-
                                                                    Author contributions. All co-authors designed the overall study.
imum daily temperature had missing values due to quality
                                                                    PZ performed the analysis and prepared the paper. All co-authors
control checks and was derived from a mix of crop cover

https://doi.org/10.5194/hess-26-827-2022                                             Hydrol. Earth Syst. Sci., 26, 827–840, 2022
838 P. Zhu and J. Burney: Untangling irrigation effects on maize water and heat stress alleviation using satellite data
contributed to the interpretation of the results and writing of the pa- Elliott, J., Müller, C., Deryng, D., Chryssanthacopoulos, J., Boote,
per. K. J., Büchner, M., Foster, I., Glotter, M., Heinke, J., Iizumi, T.,
Izaurralde, R. C., Mueller, N. D., Ray, D. K., Rosenzweig, C.,
Ruane, A. C., and Sheffield, J.: The Global Gridded Crop Model
Competing interests. The contact author has declared that neither intercomparison: data and modeling protocols for Phase 1 (v1.0),
they nor their co-author has any competing interests. Geosci. Model Dev., 8, 261–277, https://doi.org/10.5194/gmd-8-
261-2015, 2015.
Eyshi Rezaei, E., Gaiser, T., Siebert, S., and Ewert, F.: Adap-
Disclaimer. Publisher’s note: Copernicus Publications remains tation of crop production to climate change by crop substi-
neutral with regard to jurisdictional claims in published maps and tution, Mitig. Adapt. Strateg. Glob. Change, 20, 1155–1174,
institutional affiliations. https://doi.org/10.1007/s11027-013-9528-1, 2015.
Felfelani, F., Pokhrel, Y., Guan, K., and Lawrence, D. M.: Uti-
lizing SMAP Soil Moisture Data to Constrain Irrigation in the
Community Land Model, Geophys. Res. Lett., 45, 12892–12902,
Financial support. This research has been supported by the Na-
https://doi.org/10.1029/2018GL080870, 2018.
tional Institute of Food and Agriculture (grant no. NIFA IN-
Gitelson, A. A.: Wide Dynamic Range Vegetation Index for Re-
FEWS T1 1639318).
mote Quantification of Biophysical Characteristics of Vegetation,
J. Plant Physiol., 161, 165–173, https://doi.org/10.1078/0176-
1617-01176, 2004.
Review statement. This paper was edited by Harrie-Jan Hen- Guindin-Garcia, N., Gitelson, A. A., Arkebauer, T. J., Shana-
dricks Franssen and reviewed by three anonymous referees. han, J., and Weiss, A.: An evaluation of MODIS 8-
and 16-day composite products for monitoring maize
green leaf area index, Agr. Forest Meteorol., 161, 15–25,
https://doi.org/10.1016/j.agrformet.2012.03.012, 2012.
References Howell, T. A.: Enhancing water use efficiency in irrigated agricul-
ture, Agron. J., 93, 281–289, 2001.
Bonfils, C. and Lobell, D.: Empirical evidence for a recent slow- Huryna, H., Cohen, Y., Karnieli, A., Panov, N., Kustas, W. P., and
down in irrigation-induced cooling, P. Natl. Acad. Sci. USA, 104, Agam, N.: Evaluation of TsHARP utility for thermal sharpening
13582–13587, https://doi.org/10.1073/pnas.0700144104, 2007. of Sentinel-3 satellite images using Sentinel-2 visual imagery,
Brisson, N., Gary, C., Justes, E., Roche, R., Mary, B., Ripoche, Remote Sens., 11, 2304, https://doi.org/10.3390/rs11192304,
D., Zimmer, D., Sierra, J., Bertuzzi, P., Burger, P., Bussière, F., 2019.
Cabidoche, Y. M., Cellier, P., Debaeke, P., Gaudillère, J. P., Hé- Jalilvand, E., Tajrishy, M., Ghazi Zadeh Hashemi, S. A., and
nault, C., Maraux, F., Seguin, B., and Sinoquet, H.: An overview Brocca, L.: Quantification of irrigation water using remote sens-
of the crop model STICS, Eur. J. Agron., 18, 309–332, 2003. ing of soil moisture in a semi-arid region, Remote Sens. Environ.,
Bruinsma, J.: The resource outlook to 2050: by how much do land, 231, 111226, https://doi.org/10.1016/j.rse.2019.111226, 2019.
water and crop yields need to increase by 2050?, in: How to feed Jin, Z., Zhuang, Q., Wang, J., Archontoulis, S. V., Zobel, Z., and
the World in 2050, Proceedings of a technical meeting of experts, Kotamarthi, V. R.: The combined and separate impacts of climate
24–26 June 2009, Rome, Italy, Food and Agriculture Organiza- extremes on the current and future US rainfed maize and soybean
tion of the United Nations (FAO), 1–33, available at: ftp://ftp.fao. production under elevated CO2 , Global Change Biol., 23, 2687–
org/docrep/fao/012/ak971e/ak971e00.pdf (last access: 6 Febru- 2704, https://doi.org/10.1111/gcb.13617, 2017.
ary 2022), 2009. Johnson, D. M.: A comprehensive assessment of the correla-
Butler, E. E., Mueller, N. D., and Huybers, P.: Peculiarly pleasant tions between field crop yields and commonly used MODIS
weather for US maize, P. Natl. Acad. Sci. USA, 115, 11935– products, Int. J. Appl. Earth Obs. Geoinf., 52, 65–81,
11940, https://doi.org/10.1073/pnas.1808035115, 2018. https://doi.org/10.1016/j.jag.2016.05.010, 2016.
Chen, F., Xu, X., Barlage, M., Rasmussen, R., Shen, S., Miao, Kang, S. and Eltahir, E. A. B.: Impact of Irrigation on Regional Cli-
S., and Zhou, G.: Memory of irrigation effects on hydroclimate mate Over Eastern China, Geophys. Res. Lett., 46, 5499–5505,
and its modeling challenge, Environ. Res. Lett., 13, 064009, https://doi.org/10.1029/2019GL082396, 2019.
https://doi.org/10.1088/1748-9326/aab9df, 2018. Kar, G. and Kumar, A.: Surface energy fluxes and
Deines, J. M., Kendall, A. D., and Hyndman, D. W.: Annual Ir- crop water stress index in groundnut under irri-
rigation Dynamics in the U.S. Northern High Plains Derived gated ecosystem, Agr. Forest Meteorol., 146, 94–106,
from Landsat Satellite Data, Geophys. Res. Lett., 44, 9350–9360, https://doi.org/10.1016/j.agrformet.2007.05.008, 2007.
https://doi.org/10.1002/2017GL074071, 2017. Lawston, P. M., Santanello, J. A., and Kumar, S. V.:
DeLucia, E. H., Chen, S., Guan, K., Peng, B., Li, Y., Gomez- Irrigation Signals Detected From SMAP Soil Mois-
Casanovas, N., Kantola, I. B., Bernacchi, C. J., Huang, Y., ture Retrievals, Geophys. Res. Lett., 44, 11860–11867,
Long, S. P., and Ort, D. R.: Are we approaching a water ceil- https://doi.org/10.1002/2017GL075733, 2017.
ing to maize yields in the United States?, Ecosphere, 10, e02773, Li, Y., Guan, K., Yu, A., Peng, B., Zhao, L., Li, B., and Peng, J.: To-
https://doi.org/10.1002/ecs2.2773, 2019. ward building a transparent statistical model for improving crop
Egli, D. B.: Seed-Fill Duration and Yield Of Grain Crops, yield prediction: Modeling rainfed corn in the US, Field Crop.
Adv. Agron., 83, 243–279, https://doi.org/10.1016/S0065-
2113(04)83005-0, 2004.
Hydrol. Earth Syst. Sci., 26, 827–840, 2022 https://doi.org/10.5194/hess-26-827-2022P. Zhu and J. Burney: Untangling irrigation effects on maize water and heat stress alleviation using satellite data 839 Res., 234, 55–65, https://doi.org/10.1016/j.fcr.2019.02.005, soybean and maize, offsetting the delay in soybean reproductive 2019. development by elevated CO2 concentrations, Plant Cell Envi- Loarie, S. R., Lobell, D. B., Asner, G. P., Mu, Q., and ron. 41, 2806–2820, https://doi.org/10.1111/pce.13410, 2018. Field, C. B.: Direct impacts on local climate of sugar- Russo, S., Dosio, A., Graversen, R. G., Sillmann, J., Car- cane expansion in Brazil, Nat. Clim. Change, 1, 105–109, rao, H., Dunbar, M. B., Singleton, A., Montagna, P., Bar- https://doi.org/10.1038/nclimate1067, 2011. bola, P., and Vogt, J. V.: Magnitude of extreme heat Lobell, D. B., Bänziger, M., Magorokosho, C., and Vivek, waves in present climate and their projection in a warm- B.: Nonlinear heat effects on African maize as evidenced ing world, J. Geophys. Res.-Atmos., 119, 12500–12512, by historical yield trials, Nat. Clim. Change, 1, 42–45, https://doi.org/10.1002/2014JD022098, 2014. https://doi.org/10.1038/nclimate1043, 2011. Sacks, W. J., Cook, B. I., Buenning, N., Levis, S., and Helkowski, Meerdink, S. K., Hook, S. J., Roberts, D. A., and Abbott, E. A.: J. H.: Effects of global irrigation on the near-surface climate, The ECOSTRESS spectral library version 1.0, Remote Sens. En- Clim. Dynam., 33, 159–175, https://doi.org/10.1007/s00382- viron., 230, 111196, https://doi.org/10.1016/j.rse.2019.05.015, 008-0445-z, 2009. 2019. Sanchez, B., Rasmussen, A., and Porter, J. R.: Temperatures and Meng, C. L., Li, Z. L., Zhan, X., Shi, J. C., and Liu, C. Y.: Land sur- the growth and development of maize and rice: a review, Global face temperature data assimilation and its impact on evapotran- Change Biol., 20, 408–417, 2014. spiration estimates from the common land model, Water Resour. Senay, G. B., Bohms, S., Singh, R. K., Gowda, P. H., Velpuri, N. Res., 45, W02421, https://doi.org/10.1029/2008WR006971, M., Alemu, H., and Verdin, J. P.: Operational Evapotranspiration 2009. Mapping Using Remote Sensing and Weather Datasets: A New Messina, C. D., Podlich, D., Dong, Z., Samples, M., and Cooper, Parameterization for the SSEB Approach, J. Am. Water Resour. M.: Yield-trait performance landscapes: From theory to applica- Assoc., 49, 577–591, https://doi.org/10.1111/jawr.12057, 2013. tion in breeding maize for drought tolerance, J. Exp. Bot., 62, Siebert, S. and Döll, P.: Quantifying blue and green virtual wa- 855–868, https://doi.org/10.1093/jxb/erq329, 2011. ter contents in global crop production as well as potential pro- Mu, Q., Zhao, M., and Running, S. W.: Improvements duction losses without irrigation, J. Hydrol., 384, 198–217, to a MODIS global terrestrial evapotranspiration al- https://doi.org/10.1016/j.jhydrol.2009.07.031, 2010. gorithm, Remote Sens. Environ., 115, 1781–1800, Siebert, S., Ewert, F., Eyshi Rezaei, E., Kage, H., and Graß, R.: https://doi.org/10.1016/j.rse.2011.02.019, 2011. Impact of heat stress on crop yield – On the importance of Mu, Q., Zhao, M., Kimball, J. S., McDowell, N. G., and considering canopy temperature, Environ. Res. Lett., 9, 061002, Running, S. W.: A remotely sensed global terrestrial https://doi.org/10.1088/1748-9326/9/4/044012, 2014. drought severity index, B. Am. Meteorol. Soc., 94, 83–98, Siebert, S., Webber, H., Zhao, G., and Ewert, F.: Heat stress is https://doi.org/10.1175/BAMS-D-11-00213.1, 2013. overestimated in climate impact studies for irrigated agriculture, Müller, C., Elliott, J., Kelly, D., Arneth, A., Balkovic, J., Ciais, Environ. Res. Lett., 12, 054023, https://doi.org/10.1088/1748- P., Deryng, D., Folberth, C., Hoek, S., Izaurralde, R. C., Jones, 9326/aa702f, 2017. C. D., Khabarov, N., Lawrence, P., Liu, W., Olin, S., Pugh, T. Tack, J., Barkley, A., and Hendricks, N.: Irrigation offsets wheat A. M., Reddy, A., Rosenzweig, C., Ruane, A. C., Sakurai, G., yield reductions from warming temperatures, Environ. Res. Lett., Schmid, E., Skalsky, R., Wang, X., de Wit, A., and Yang, H.: 12, 114027, https://doi.org/10.1088/1748-9326/aa8d27, 2017. The Global Gridded Crop Model Intercomparison phase 1 sim- Teixeira, E. I., Fischer, G., Van Velthuizen, H., Walter, C., and ulation dataset, Sci. Data, 6, 50, https://doi.org/10.1038/s41597- Ewert, F.: Global hot-spots of heat stress on agricultural crops 019-0023-8, 2019. due to climate change, Agr. Forest Meteorol., 170, 206–215, Peng, S. S., Piao, S., Zeng, Z., Ciais, P., Zhou, L., Li, L. Z. X., My- https://doi.org/10.1016/j.agrformet.2011.09.002, 2013. neni, R. B., Yin, Y., and Zeng, H.: Afforestation in China cools Teuling, A. J., Seneviratne, S. I., Stöckli, R., Reichstein, M., Moors, local land surface temperature, P. Natl. Acad. Sci. USA, 111, E., Ciais, P., Luyssaert, S., Van Den Hurk, B., Ammann, C., Bern- 2915–2919, https://doi.org/10.1073/pnas.1315126111, 2014. hofer, C., Dellwik, E., Gianelle, D., Gielen, B., Grünwald, T., Rattalino Edreira, J. I., Budakli Carpici, E., Sammarro, D., and Klumpp, K., Montagnani, L., Moureaux, C., Sottocornola, M., Otegui, M. E.: Heat stress effects around flowering on kernel set and Wohlfahrt, G.: Contrasting response of European forest and of temperate and tropical maize hybrids, Fiels Crop. Res., 123, grassland energy exchange to heatwaves, Nat. Geosci., 3, 722– 62–73, https://doi.org/10.1016/j.fcr.2011.04.015, 2011. 727, https://doi.org/10.1038/ngeo950, 2010. Rosegrant, M. W., Cai, X., and Cline, S. A.: World water and Thiery, W., Davin, E. L., Lawrence, D. M., Hirsch, A. L., food to 2025: dealing with scarcity, Intl. Food Policy Res. Inst., Hauser, M., and Seneviratne, S. I.: Present-day irrigation https://doi.org/10.1098/rstb.2005.1744, 2002. mitigates heat extremes, J. Geophys. Res., 122, 1403–1422, Rosenzweig, C., Jones, J. W., Hatfield, J. L., Ruane, A. C., https://doi.org/10.1002/2016JD025740, 2017. Boote, K. J., Thorburn, P., Antle, J. M., Nelson, G. C., Porter, Thornton, P. E., Thornton, M. M., Mayer, B. W., Wei, Y., De- C., Janssen, S., Asseng, S., Basso, B., Ewert, F., Wallach, varakonda, R., Vose, R. S., and Cook, R. B.: Daymet: Daily Sur- D., Baigorria, G., and Winter, J. M.: The Agricultural Model face Weather Data on a 1-km Grid for North America, Version 3, Intercomparison and Improvement Project (AgMIP): Proto- ORNL DAAC, Oak Ridge, Tennessee, USA, available at: https: cols and pilot studies, Agr. Forest Meteorol., 170, 166–182, //search.earthdata.nasa.gov/search (last access: August 2019), https://doi.org/10.1016/j.agrformet.2012.09.011, 2013. 2018. Ruiz-Vera, U. M., Siebers, M. H., Jaiswal, D., Ort, D. R., and Tomlinson, C. J., Chapman, L., Thornes, J. E., and Baker, C. J.: Bernacchi, C. J.: Canopy warming accelerates development in Derivation of Birmingham’s summer surface urban heat island https://doi.org/10.5194/hess-26-827-2022 Hydrol. Earth Syst. Sci., 26, 827–840, 2022
You can also read