Vegetation, bird and soundscape characterization: a case study in Braulio Carrillo National Park, Costa Rica
←
→
Page content transcription
If your browser does not render page correctly, please read the page content below
DOI: 10.21068/c2021.v22n01a04

Vegetation, bird and soundscape
characterization: a case study in Braulio
Carrillo National Park, Costa Rica
Caracterización de la vegetación, aves y paisajes sonoros:
un caso de estudio en el Parque Nacional Braulio Carrillo,
Costa Rica
Mónica Isabel Retamosa Izaguirre   , David Segura Sequeira      ,
Jimmy Barrantes-Madrigal     , Manuel Spínola Parallada    , Óscar Ramírez-Alán

Abstract
We assessed the structural complexity of vegetation, birds and soundscapes in two areas of Braulio Carrillo Na-
tional Park, Costa Rica, with different road exposure, as baseline information for conservation and management.
We measured vegetation structure complexity, surveyed birds and recorded soundscapes in an area adjacent to
the National Highway 32 (Quebrada) and another area 20 km away (Ceibo). Quebrada presented a more open
forest structure and lower density of trees and shrubs; lower evenness and higher acoustic complexity, higher
bioacoustic activity and sound pressure level; higher bird abundance and richness. Ceibo showed a higher density
of trees and shrubs, higher complexity of vegetation structure, higher proportion of biophonies than anthropho-
nies, and an acoustic community with higher diversity and entropy. The study sites differed in characteristics of
their bird communities in an unexpected way; these differences appear to be mostly influenced by the structure
and complexity of the vegetation surrounding the road. However, the soundscapes seemed to properly reflect
the habitat condition, and are promising for evaluating the ecological condition of a site.

Keywords. Acoustic indices. Birds. Ecoacoustics. Noise. Road. Tropical rainforest.

Resumen
Evaluamos la complejidad estructural de la vegetación, las aves y los paisajes sonoros en dos áreas del Parque
Nacional Braulio Carrillo, Costa Rica, con diferente exposición a carreteras, como información de base para la
conservación y el manejo. Medimos la complejidad estructural de la vegetación, registramos las aves y grabamos
los paisajes sonoros en un área adyacente a la Carretera Nacional 32 (Quebrada) y otra área a 20 km (Ceibo). Que-
brada presentó una estructura forestal más abierta y menor densidad de árboles y arbustos, menor equitatividad
y mayor complejidad acústica, mayor actividad bioacústica y nivel de presión sonora y mayor abundancia y ri-
queza de aves. Ceibo mostró una mayor densidad de árboles y arbustos, mayor complejidad de la estructura de
la vegetación, mayor proporción de biofonías que antrofonías, y una comunidad acústica con mayor diversidad y
entropía. Los sitios de estudio variaron en las características de sus comunidades de aves de manera imprevista;
estas diferencias parecen estar mayormente influenciadas por la estructura y complejidad de la vegetación que
rodea la carretera. Sin embargo, los paisajes sonoros parecieron reflejar adecuadamente la condición del hábitat
y son prometedores para evaluar la condición ecológica de un sitio.

Palabras clave. Aves. Bosque húmedo tropical. Carretera. Ecoacústica. Índices acústicos. Ruido.

                                                                                       Biota Colombiana 22 (1) - 2021 |   57
DOI: 10.21068/c2021.v22n01a04 Retamosa-Izaguirre et al.
Introduction probably related to decreased bird density where road
noise was highest (Arévalo & Newhard, 2011).
Roads and their traffic can affect wildlife over large
areas and, in regions with dense road networks, may Other authors have used acoustic indices to charac-
influence a high proportion of the ecological landscape terize biotic communities relative to road disturban-
(Cooke et al., 2020a). In Costa Rica, for example, 41.2 % ces, as they offer a relatively fast method of processing
of the protected areas are directly or indirectly influen- acoustic data (Sueur et al., 2008). For example, Pieretti
ced by the effect of roads, and 532.52 km of roads are & Farina (2013) used the Acoustic Complexity Index
adjacent to, or less than 2 km away from protected areas (ACI) (Pieretti et al., 2011) to quantify bird vocalization
(Arévalo & Blau, 2018). dynamics in a landscape influenced by road noise; they
found a positive relationship between ACI and distan-
Due to the complexity of biotic communities in tropical ce to the road. In Costa Rica, Tenez (2016) also found
ecosystems, roads generate a soaring pressure in their higher ACI values a t the edge of the road in Santa Rosa
vicinity (Trombulak & Frissell, 2000). Among the nega- National Park and attributed this result to bird vocali-
tive impacts related to roads are: a) isolation of wildlife zations. In addition, sites located 10 m away from the
populations and road kills (Keller & Largiader, 2003); b) road showed the highest proportion of anthrophonies,
proliferation of exotic species along the roadside (For- while sites located 500 m away presented the highest
man & Deblinger, 2000); c) changes in the microclima- proportion of biophonies.
tic conditions at forest edges (Pohlman et al., 2009); d)
exposure to chemicals pollutants (dust, heavy metals, The Braulio Carrillo National Park (BCNP) is one of the
nutrients, ozone and organic molecules; Laurance et al., most extensive protected areas in central Costa Rica,
2009); e) invasions of hunters, miners, colonists and land with 47 689 hectares. It holds approximately 6000 species
speculators, which can be a cause of additional hunting of plants and thousands of animal species (Boza, 1992).
pressure on wildlife (Laurance et al., 2009); and f) noise This protected area is crossed by National Highway 32,
pollution (Francis & Barber, 2013). through which 80 % of the country’s import and export
goods are transported (Fernández, 2013). Furthermore,
Many studies have associated road disturbances with plans exist to expand Highway 32, which might increa-
noise, since it can interfere with the acoustic commu- se vehicular flow through this protected area. Updated
nication, due to a masking effect from vehicular noise information about possible influences of Highway 32
(Dooling & Popper, 2007). The masking effect occurs on biodiversity is required to assess present and future
when the distance at which an acoustic signal can be impacts, and to support management actions.
heard is reduced by the anthropogenic background noi-
se (Marten & Marler, 1977). Many bird species modify The objective of this study was to assess the struc-
their vocalization behavior to overcome the masking tural complexity of vegetation, soundscape and bird
effect by modifying the amplitude, frequency, duration, communities in two areas of BCNP with different an-
timing or rate of their vocalizations (Pieretti & Farina, thropogenic alteration related to road exposure, as ba-
2013; Roca et al., 2016). Furthermore, noise can impo- seline information for park biodiversity conservation
se selective constraints and pressures on species using and management. The area near the Highway 32 was
acoustic signals to communicate and reproduce (Pieretti expected to show higher habitat disturbance, higher
& Farina, 2013). For instance, short-term noise exposu- sound pressure level and more disturbed vegetation
re may decrease nestling body size and increase in the structure than the remote area. In addition, we expec-
oxidative stress of Tree Swallows (Injaian et al., 2018). ted also the bird community to be less diverse, the
soundscape to have a lower proportion of biophonies
Species spatial distribution can also be affected by road than anthrophonies, and lower acoustic diversity or
exposure. For example, bird movements, abundance, acoustic complexity.
occurrence, and richness have been negatively correla-
ted with road exposure (Reijnen et al., 1997; Laurance
et al., 2004; Herrera-Montes & Aide, 2011; Cooke et al., Materials and methods
2020b). In Costa Rica, the number of biophonies (me-
asured as the seconds occupied by bird vocalizations) Study area. The BCNP is located in the Central Volca-
was significantly lower near the road in Carara Natio- nic Mountain Range in Costa Rica. It receives almost
nal Park (Arévalo & Blau, 2018). This difference was 6000 mm of precipitation annually, with two brief dry
58 | Biota Colombiana 22 (1) - 2021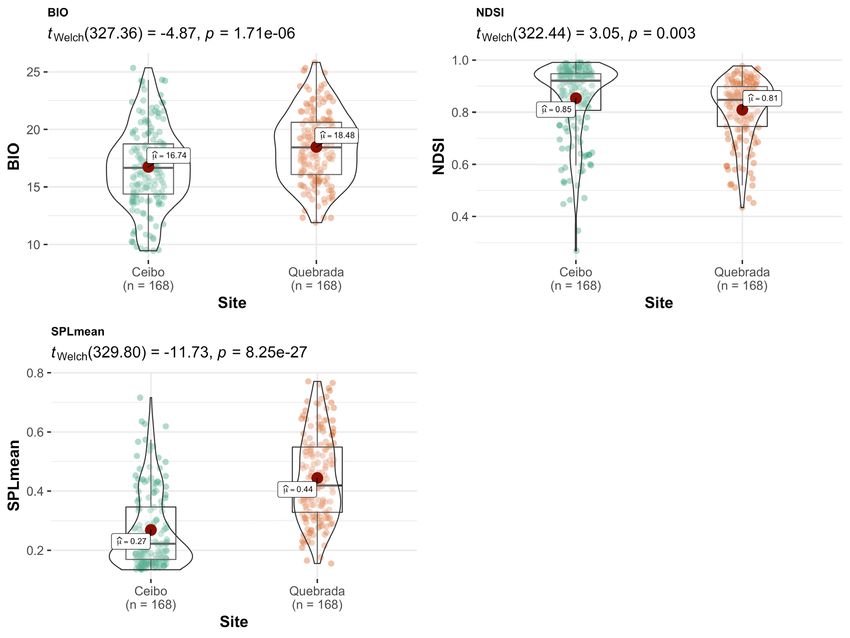
Retamosa-Izaguirre et al.                                                                 Vegetation, bird and soundscape characterization

periods between January-April and September-October                      to public use, and it is located on Highway 32. The
(Blake & Loiselle, 2000). The park belongs to the Phyto-                 area surrounding the trails belonged to cattle farms in
geographic Unit of the Caribbean Foothill, characteri-                   the mid-20th century, thus the vegetation composition
zed by abundant and heterogeneous vegetation, and an                     still maintains the characteristics of a regenerating fo-
understory dominated by palms (Zamora, 2008). The                        rest (Pérez et al., 2009). Ceibo is a Sector of the BCNP
park is crossed by the national Highway 32; this road                    devoted exclusively to protection and research and it
was constructed in 1977 to connect the Central Valley                    is located at about 20 km away from Quebrada. The
with the Caribbean coast. The construction of the road                   access to Ceibo is by a low-traffic unpaved road, and
implied the opening of forest cover in a radius of up to                 there is a minimum distance of 1.5 km from this road
1 km for the passage of machinery and storage of ma-                     to the sampling points. Both Ceibo and Quebrada sites
terials (Pérez et al., 2009). To avoid further destruction               are included in the life zone “Very Humid Tropical Fo-
of the forest, the national park was created in 1978.                    rest Transition to Premontane” and present an altitude
                                                                         between 500 and 600 m a.s.l. (TEC, 2014).
The study was conducted at two sites within the
BCNP, each selected based on its distance from
Highway 32 (Figure 1). The sites are named “Quebra-                      Sampling points:
da” (10°09’42.35”N- 83°56’16.11”W; on Highway 32
and “Ceibo” (10°19’14.25 ”N- 84°04’28.87”W; ~ 20km                       At each study site we systematically placed 12 sam-
from Highway 32, and ~10 km from another paved                           pling points in transects along all available trails, where
road). Quebrada is a Ranger Station dedicated mostly                     permission was granted by park rangers (Figure 1).

Figure 1. Location of Ceibo and Quebrada sites within the Braulio Carrillo National Park, Costa Rica, in reference to their dis-
tance from Highway 32. A, global view of the park; B, zoom view of Ceibo study site; C, zoom view of Quebrada study site

Figura 1. Ubicación de los sitios Ceibo y Quebrada dentro del Parque Nacional Braulio Carrillo, en referencia a su distancia a la carretera 32.
A, vista global del parque; B, vista ampliada del sitio de estudio de Ceibo; C, vista ampliada del sitio de estudio de Quebrada

                                                                                                              Biota Colombiana 22 (1) - 2021 |    59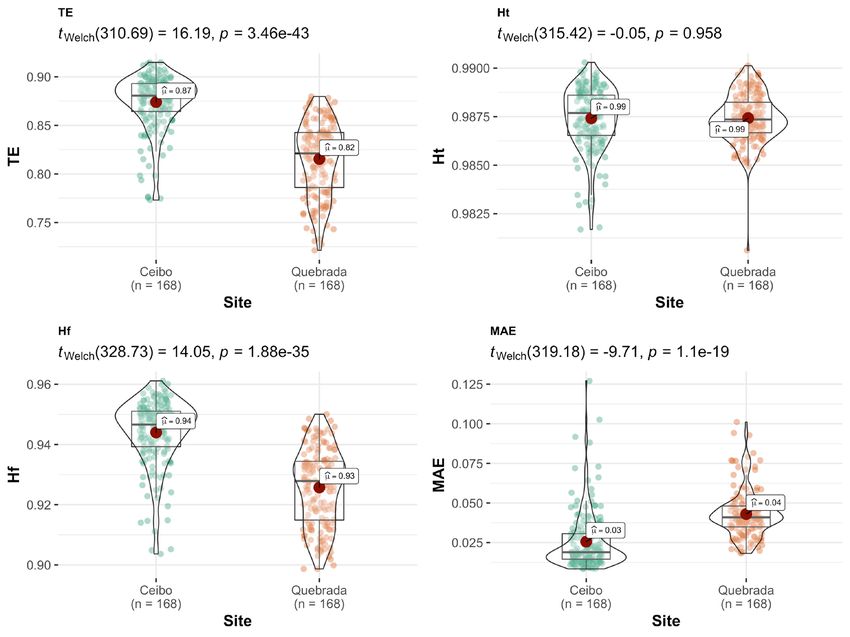
DOI: 10.21068/c2021.v22n01a04                                                                                  Retamosa-Izaguirre et al.

      We placed the recorders 50 m away from the trail, on a                and one visit during the rainy season of 2018 (Ceibo:
      central tree selected trying to avoid obstacles that could            May; Quebrada: August).
      interfere with sound propagation. All sampling points
      were located at a distance of 200 m from each other, to
      reduce the superposition of sounds between two adja-                  Habitat Survey:
      cent recording points and ensure a good spatial sam-
      pling of the soundscape (Farina et al., 2011). However,               We measured the vegetation structure around each of
      we did not quantify detection spaces of the sites (as                 the 12 sampling points. From a central tree we establi-
      recommended in Darras et al., 2015).                                  shed four 3x20 m plots, to measure the stem diameter
                                                                            of trees greater than 5 cm of diameter at breast height
      We made four visits to each study site between June                   (DBH). Within each plot, we established two 3x3 m
      2017 and August 2018. Sampling periods were not si-                   subplots to measure the DBH of those individuals be-
      multaneous at both sites; however, we systematically                  tween 1 and 5 cm with an approximate height ≥1.30 m;
      alternated visits between sites, to get a representative              otherwise, they were only counted for that diameter
      sample of the bird and soundscape events that occur                   class. Within these subplots, we established two 2x1
      throughout the year. Two visits were conducted during                 m subplots to count individuals with less than 1 cm
      the rainy season of 2017 (Quebrada: June and October;                 of DBH. With the vegetation data, we calculated three
      Ceibo: September and November), one visit during the                  vegetation structure variables for each sampling point
      dry season of 2018 (Ceibo: February; Quebrada: April),                (Table 1).

      Table 1. Description of the environmental variables, bird parameters and acoustic indices calculated for each sampling point at Ceibo and
      Quebrada sites of Braulio Carrillo National Park, Costa Rica
      Tabla 1. Descripción de las variables ambientales, parámetros de aves e índices acústicos calculados para cada punto de muestreo en los
      sitios Ceibo y Quebrada del Parque Nacional Braulio Carrillo, Costa Rica.

           Environmental
             Variable
                                           Code                                            Description

       Basal Area                        basal_total     Total Basal Area
       Abundance 5 cm                   abund_ind_5      Number of individuals more than 5 cm DBH
       Abundances 1-5 cm                abund_1 to 5     Number of individuals 1-5 cm DBH
       Vertical canopy                                   Measures the opening of the forest in relation to the number of opening pixels
                                          GAP_v
       opening                                           and forest cover for pictures taken at 45°
       Horizontal canopy                                 Measures the opening of the forest in relation to the number of opening pixels
                                          GAP_h
       opening                                           and forest cover for pictures taken horizontally.
       Vertical Mean informa-
                                          MIG_v          Vegetation vertical structural complexity
       tion gain
       Horizontal Mean infor-
                                          MIG_h          Vegetation horizontal structural complexity
       mation gain
       Bird parameter                                    Description
       Bird abundance                   Abundance        Number of individuals of all bird species.
       Bird richness                     Richness        Number of species.
       Shannon index                     Shannon         Shannon diversity (Shannon & Weaver, 1949).
       Pielou index                        Pielou        Evenness of Pielou (Pielou, 1984).
       Acoustic Indices                                  Description

60   | Biota Colombiana 22 (1) - 2021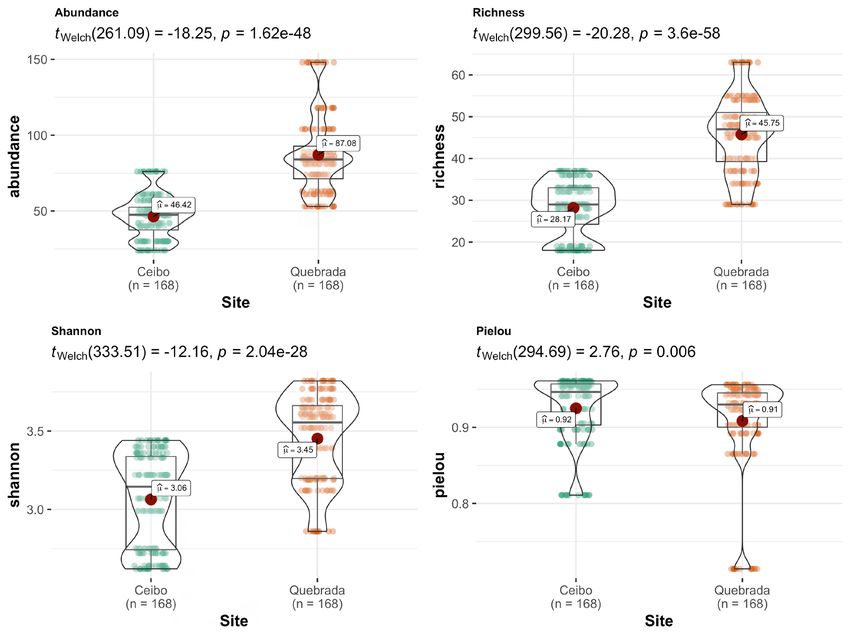
Retamosa-Izaguirre et al.                                                  Vegetation, bird and soundscape characterization

     Environmental
       Variable
                              Code                                        Description

 Acoustic Complexity                      Measures the variability of sound intensity over time and frequency. Higher
                              ACI
 Index                                    values indicate more complex soundscapes (Pieretti et al., 2011).
                                          Summarizes sound intensity distribution applying the Shannon index over
 A c ou st ic D iversity                  the proportion of signals above an intensity threshold across the spectrum.
                              ADI
 Index                                    High values indicate that sound intensity is spread evenly across frequency
                                          bands (Villanueva-Rivera et al., 2011).
                                          Same as the ADI, but the Gini index is applied across all frequency bins
 Acoustic Evenness
                              AEI         (Villanueva-Rivera et al., 2011). High values indicate sound intensity is res-
 Index
                                          tricted to a narrow frequency. range.
                                          Is a function of both amplitude and number of occupied frequency bands
                                          between 2-11 kHz. It is calculated as the area under each curve included all
 Bioacoustic Index            BIO         frequency bands associated with the dB value that was greater than the mi-
                                          nimum dB value for each curve. The higher values indicate greater disparity
                                          between bands (Boelman et al., 2007).
                                          Shows the median of the amplitude envelope normalized by the maximum
 Median Amplitude
                              MAE         value to give results between 0-1. Higher values reflect noisier soundscapes
 Envelope
                                          (Depraetere et al., 2012).
                                          Calculates the ratio (biophony − anthrophony) / (biophony + anthrophony).
 Normalized Difference                    Where biophony is the energy on the frequency range 2-8 kHz and anthro-
                             NDSI
 Soundscape Index                         phony between 1-2 kHz. (Kasten et al., 2012). Higher values indicate a higher
                                          proportion of sound intensity in the biophony band.
                                          Counts the number of major frequency peaks obtained on a mean spectrum
 Number of Peaks               NP         scaled between 0 and 1. Higher values indicates a greater frequency spectral
                                          complexity (Gasc et al., 2013).
                                          Divides intensity values by the sum of intensity in a frequency band. Calcu-
                                          lates the entropy for these values using the negative sum of each value multi-
 Spectral Entropy              Hf         plied by the log of the value and divided by the log of the number of intensity
                                          values (Sueur et al., 2008). Higher values indicate evenly distributed sound
                                          across frequency bands.
                                          Divides intensity values by the sum of intensities in a time step. Calculates
                                          entropy for these values using the negative sum of each value multiplied by
 Temporal Entropy              Ht
                                          the log of the value and divided by the log of the number of intensity values.
                                          (Sueur et al., 2008). Higher values indicate evenly distributed sound over time.
                                          It is the product of Hf * Ht. Quantifies the variation across time and frequency
 Total Entropy                 TE         (Sueur et al., 2008). Higher values indicate evenly distributed sounds across
                                          frequency and time.
 Mean Sound Pressure                      Calculates the average sound pressure level in dB, using a decibel reference
                            SPLMean
 Level                                    value of 2x10⁻⁵ Pa. Higher values indicate louder soundscapes.

Additionally, we took four horizontal and four verti-      settings: variable exposure, 15 mm focal length, f / 6.3
cal photographs (at about 45° angle) at each sampling      aperture, variable ISO, 2816-1880 resolution, automatic
point, following the recommendations provided in           focus, image stabilizer on, and JPG type of compres-
Martin and Proulx (2016), with the modification that       sion. Each group of photographs was sorted by study
no photograph touched the ground. For this, we used        site and sampling point to characterize the geometry of
a Canon 80D camera with an 18-135 mm canon lens            the forest using the following variables: MIG (average
(EF-S f / 3.5-5.6 IS USM, Canon Inc.) and the following    information gain, a measure of structural complexity;

                                                                                             Biota Colombiana 22 (1) - 2021 |   61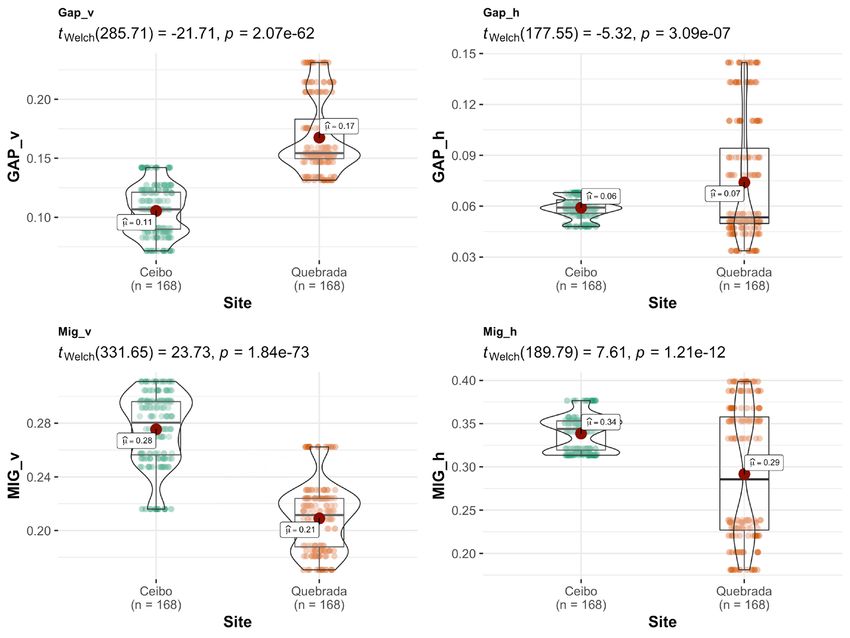
DOI: 10.21068/c2021.v22n01a04                                                                  Retamosa-Izaguirre et al.

      Proulx & Parrott, 2008) and GAP (opening fraction,          total 81 060 minutes of recordings used in the analysis
      which measures the opening of the forest in relation        (42 480 minutes at Ceibo and 38 580 minutes at Quebra-
      to the number of opening pixels and forest cover;           da). We analyzed soundscape recordings using eleven
      Rosin, 2001). The estimation parameters were obtai-         of the most commonly used acoustic indices, because
      ned by using the “gap_fraction” and “calculateHis-          they represent different components of the soundscape
      to” functions of the “LAI and imagemetrics” package         (Table 1). The acoustic indices ACI, ADI, AEI and BIO
      (https://github.com/cmartin/ImageAnalysisPrimer).           were calculated using a maximum frequency of 11 000
      Four vegetation structure complexity variables were         Hz. All acoustic indices were calculated for one-minute
      obtained for each sampling point (Table 1).                 recording fragments and averaged for each study site,
                                                                  sampling point and time of day (4:00 to 17:00).
      Bird Community Survey. We conducted bird point
      counts on each sampling point at a distance of about        Data Analysis. To compare environmental variables,
      20 meters from the recorders, to avoid interference du-     bird parameters and acoustic indices between sites,
      ring recording times. We conducted two daily coun-          we conducted Welch tests for each of them, separa-
      ting sessions (four counts per visit) during peak hours     tely. This approach was chosen to take into account
      of bird activity (~ 6:00-8:00 and ~ 14:00-16:00). At each   variance heterogeneity of the data. The results were
      point, we recorded number of species and number of          represented graphically, showing P value, using an
      individuals of each species detected visually and au-       alpha of 0.05.
      rally during 6 minutes in a 25 meters radius. We ob-
      tained four bird “parameters” for each sampling point       To conduct a multivariable description of variability at
      (Table 1). However, these parameters do not repre-          both sites, based on the measured variables, we used a
      sent actual estimated parameters at the population or       multiple factor analysis (Pagès, 2002). Variables were
      community level, as we did not consider detectability.      assembled into three groups: environmental variables,
      For example, richness represents observed richness          bird parameters and acoustic indices (Table 1). All va-
      (number of species) at each sampling point. Abundan-        riables, except site, were numerical and therefore scaled
      ce represents observed total abundance, i.e. the total      to have a mean of 0 and a variance of 1 (each variable
      numbers of individuals of all species detected at each      was subtracted from its mean and divided by its stan-
      sampling point.                                             dard deviation).

      Soundscape Survey. We located 12 “Song Meter Di-            All analyses and graphs were performed using the R
      gital Field Recorders 2 Plus” (SM2 +; Wildlife Acous-       programming environment (R Core Team, 2019). To cal-
      tics Inc.) to make soundscape recordings. We installed      culate acoustic indices, we used the following packages
      recorders at the central tree of each sampling point at     for R: Sinax (https://rdrr.io/github/osoramirez/Si-
      an approximate height of 1.30 m. In each recorder, two      nax/), Soundecology (Villanueva-Rivera & Pijanowski,
      omnidirectional microphones were placed, so the recor-      2016) and Seewave (Sueur et al., 2016). We used the Bio-
      ding was made through two channels (in stereo). Audio       diversity® package (Kindt, 2015) to analyze bird point
      files were recorded in wav format (16-bit, 44.1 kHz)        count data; ggstatsplot for comparison of variables be-
      and stored on 64GB capacity SDHC memory cards.              tween sites (Patil, 2018), and FactoMine® for multiple
      The recorders were programmed to make continuous            factorial analysis (Lê et al., 2008).
      recordings during bird activity peaks (4:00-6:59 and
      15:00-17:59), and for periods of 10 minutes at the be-
      ginning of each hour between 7:00 and 14:59. This re-       Results
      cording scheme was implemented for two consecutive
      days during each visit to each study site, for a total of   Comparison of variables between sites: Ceibo showed
      four separate visits per site.                              a higher density of trees with a DBH > 5 cm, and shrubs
                                                                  with a DBH of 1-5 cm, and higher complexity of forest
      The soundscape recordings were previewed aurally and        structure (higher MIG, both vertically and horizonta-
      visually through a spectrogram to facilitate identifica-    lly). On the contrary, Quebrada showed more open ve-
      tion of undesired noise such as heavy rain in the audio     getation structure, with larger gaps both vertically and
      file, using the Adobe Audition CC v.6 program. We re-       horizontally. However, total basal area was similar at
      moved the minute files showing heavy rains, keeping in      both sites (Figure 2).

62   | Biota Colombiana 22 (1) - 2021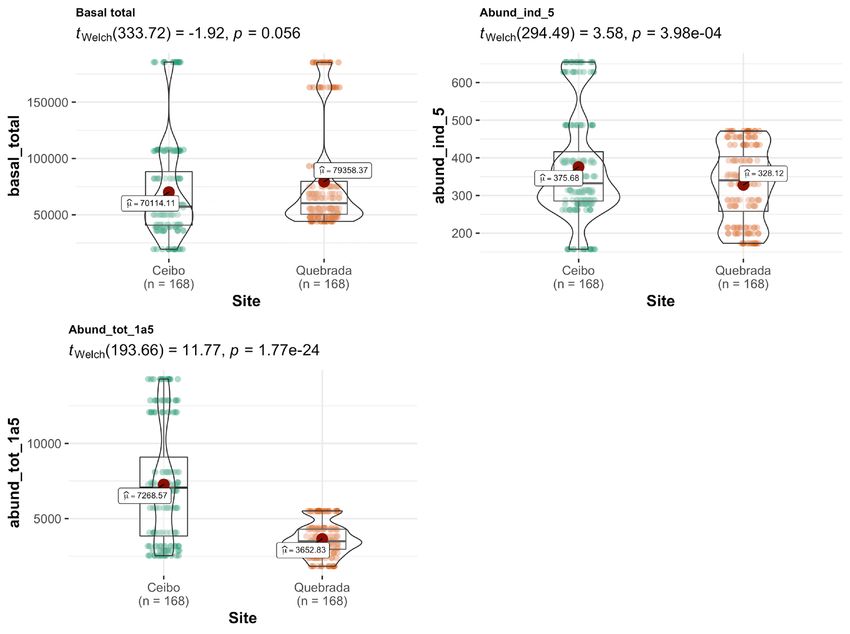
Retamosa-Izaguirre et al.                                                               Vegetation, bird and soundscape characterization

Figure 2. Comparison of environmental variables between Ceibo and Quebrada sites in the Braulio Carrillo National Park,
Costa Rica. Graphic shows Welch test results, 95% confidence interval, p-value (for an alpha value of 0.05) and n.

Figura 2. Comparación de variables ambientales entre los sitios Ceibo y Quebrada en el Parque Nacional Braulio Carrillo, Costa Rica. El grá-
fico muestra los resultados de la prueba de Welch, el intervalo de confianza del 95%, el valor p (para un valor alfa de 0.05) y n.

                                                                                                            Biota Colombiana 22 (1) - 2021 |   63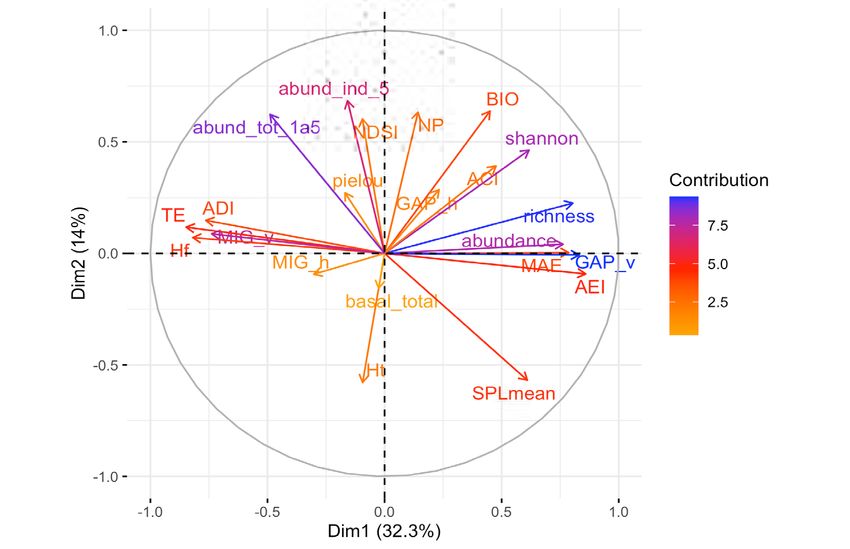
DOI: 10.21068/c2021.v22n01a04                                                                                    Retamosa-Izaguirre et al.

      Based on bird point counts, we found that bird com-                    by both sites, 75 (44 %) were detected only in Que-
      munity was more abundant, rich and diverse at Que-                     brada, and 22 (13 %) were found only in Ceibo. Bird
      brada than at Ceibo; however, it was more even at                      community at Ceibo was mainly composed of forest
      Ceibo than at Quebrada (Figure 3). We detected 127                     and forest-edge species, while Quebrada had seve-
      bird species in Ceibo (33 families and 111 genera),                    ral species from open areas as well (those preferring
      and 157 species in Quebrada (40 families and 124 ge-                   environments with reduced forest cover or early suc-
      nera). Of the total 170 species, 73 (43 %) were shared                 cessional states).

      Figure 3. Comparison of bird parameters between Ceibo and Quebrada sites in the Braulio Carrillo National Park, Costa Rica.
      Graphic shows Welch test results, 95% confidence interval, p-value (for an alpha value of 0.05) and n.

      Figura 3. Comparación de parámetros de aves entre los sitios Ceibo y Quebrada en el Parque Nacional Braulio Carrillo, Costa Rica. El gráfico
      muestra los resultados de la prueba de Welch, el intervalo de confianza del 95%, el valor p (para un valor alfa de 0.05) y n.

      Acoustic indices showed a community with higher                        community with higher diversity, higher frequency
      complexity and bioacoustic activity in Quebrada than                   entropy, and total entropy than Quebrada. Indices
      Ceibo; however, Ceibo presented higher proportion                      SPLmean and MAE also showed higher sound pres-
      of biophonies than anthrophonies, and an acoustic                      sure level in Quebrada than in Ceibo (Figure 4).

64   | Biota Colombiana 22 (1) - 2021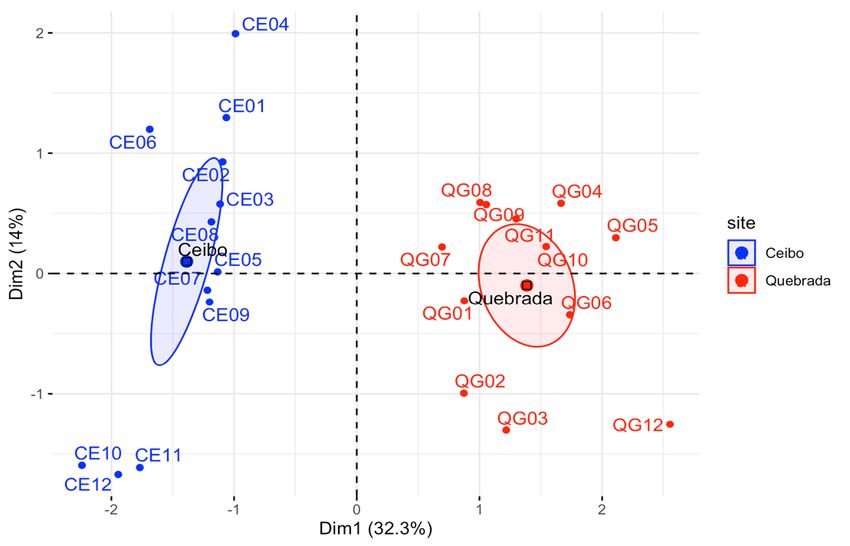
Retamosa-Izaguirre et al.   Vegetation, bird and soundscape characterization

                                              Biota Colombiana 22 (1) - 2021 |   65
DOI: 10.21068/c2021.v22n01a04 Retamosa-Izaguirre et al.
Figure 4. Comparison of acoustic indices between Ceibo and Quebrada sites in the Braulio Carrillo National Park, Costa Rica.
Graphic shows Welch test results, 95% confidence interval, p-value (for an alpha value of 0.05) and n.
Figura 4. Comparación de índices acústicos entre los sitios Ceibo y Quebrada en el Parque Nacional Braulio Carrillo, Costa Rica. El gráfico
muestra los resultados de la prueba de Welch, el intervalo de confianza del 95%, el valor p (para un valor alfa de 0.05) y n.
Multivariable description of variability at the study environmental variables representing abundance of
sites: Ceibo and Quebrada sites separated completely shrubs 1-5 cm DBH and abundance of trees > 5 cm of
in the multiple factor analysis; besides, each of the sam- DBH (Figure 6). The variables with the most explana-
pling points clustered around the ellipse that represents tory value are those representing vegetation structure
the corresponding study site (Figure 5). and complexity, and bird parameters. However, axis
one and axis two together explain 47 % of the varian-
The first axis was mainly explained by bird indices ce, meaning that there are still other factors explai-
(richness and abundance) and the vertical opening of ning data variability, other than the ones measured
the forest. The second axis was mostly explained by in this study.
66 | Biota Colombiana 22 (1) - 2021Retamosa-Izaguirre et al. Vegetation, bird and soundscape characterization
Figure 5. Multiple factor analysis in Ceibo and Quebrada sites at the Braulio Carrillo National Park of Costa Rica, according
to 3 groups of variables used (environmental variables, acoustic indices, and bird parameters). Each sampling point is named
on the graphic using 4 digits, the first two indicate the study site (CE = Ceibo and QG = Quebrada) and the last two refer to
a consecutive number for each point from 1 to 12.
Figura 5. Análisis factorial múltiple en los sitios Ceibo y Quebrada del Parque Nacional Braulio Carrillo de Costa Rica, de acuerdo con 3
grupos de variables utilizadas (variables ambientales, índices acústicos y parámetros de aves). Cada punto de muestreo se nombra en el
gráfico con 4 dígitos, los dos primeros indican el sitio de estudio (CE = Ceibo y QG = Quebrada) y los dos últimos se refieren a un número
consecutivo para cada punto del 1 al 12.
Figure 6. Multiple factor analysis in Ceibo and Quebrada sites of the Braulio Carrillo National Park of Costa Rica, according
to three variable groups used (environmental variables, acoustic indices, and bird parameters). The variables with the larger
value of contribution (darker color of arrow), contribute the most to the definition of the dimensions. Variables that contri-
bute the most to Dim.1 and Dim.2 are the most important in explaining the variability in the data set.
Figura 6. Análisis de factores múltiples en los sitios Ceibo y Quebrada del Parque Nacional Braulio Carrillo de Costa Rica, de acuerdo con
tres grupos variables utilizados (variables ambientales, índices acústicos y parámetros de aves). Las variables con mayor valor de contribu-
ción (color más oscuro de flecha) son las que más contribuyen a la definición de las dimensiones. Las variables que más contribuyen a Dim.1
y Dim.2 son las más importantes para explicar la variabilidad en el conjunto de datos.
Biota Colombiana 22 (1) - 2021 | 67DOI: 10.21068/c2021.v22n01a04 Retamosa-Izaguirre et al.
Discussion et al., 2018). Nevertheless, ACI has been more consis-
tently associated with vehicular noise in other studies,
Our observations suggest that Ceibo was a more ma- showing a positive relationship with traffic noise (Pie-
ture and preserved site than Quebrada, due to its rreti & Farina, 2013; Tenez, 2016). These authors ar-
higher horizontal and vertical complexity of vegeta- gued that birds may be attempting to propagate their
tion structure, and higher density of trees and shrubs signals with greater emphasis (e.g. amplified redun-
(Oosterhoorn & Kappelle, 2000; Proulx & Parrott, 2009). dancy or song intensity) to offset noise masking effect.
However, Quebrada presented a higher richness, abun- On the other hand, BIO has been tested in different
dance and diversity of birds than Ceibo, contrary to environments, showing positive correlation with bird
what we expected. This is inconsistent with other stu- richness (Eldrigde et al., 2018), abundance (Retamosa
dies, which have found higher richness and abundance et al., 2018), number of vocalizations (Pieretti et al.,
in sites with higher complexity of vegetation structu- 2011) and biotic diversity (Fairbrass et al., 2017).
re (Schulze et al., 2004; Mulwa et al., 2012); however,
other authors have shown a higher bird diversity in Despite higher bird diversity in Quebrada, this site
secondary habitats, which provide a variety of niches seemed to be less acoustically diverse than Ceibo, with
for species with different habitat requirements (Becker sound intensity spread unevenly across frequency
& Agreda, 2005; Gray et al., 2007). Furthermore, our bands (Villanueva-Rivera et al., 2011, Bradfer-Lawrence
results are also inconsistent with other studies showing et al., 2019). Characteristics of some bird species found
a negative correlation between abundance, occurren- in Quebrada could help to understand these results.
ce and richness of birds and levels of vehicular noise For example, many species in open areas rely more
(Reijnen et al., 1997; Herrera-Montes & Aide, 2011; Aré- on visual signals compared to species that inhabit the
valo & Newhard, 2011). interior of the forest, which rely primarily on acoustic
signals (Laverde-R. et al., 2017, 2018). In fact, Laver-
We found bird species commonly inhabiting open de-R. et al. (2017) found evidence that birds that occu-
areas, such as Dives dives, Myiozetetes granadensis, and py closed or darker habitats have a greater variety of
Tyrannus melancholicus, only in Quebrada. These re- song syllables and less colorful plumages.
sults could be related to a more disturbed vegetation
structure in Quebrada, as a possible consequence of Furthermore, we observed bird flocks more frequent-
anthropogenic factors, such as road exposure, tourism ly in Quebrada than in Ceibo, and they also inclu-
activity, and historical management in the site (Pérez et ded more individuals. Some species within the flock
al., 2009). Roads themselves create open gaps, favoring use special vocalizations to maintain group cohesion
microclimatic edge gradients (Pohlman et al., 2007), (Powell, 1985). However, these sounds are generally
and the proliferation of plant species that attract and simple with notes designed for close-range communi-
sustain a higher diversity of birds in these areas (Levey, cation to reduce predator detection risk (Greenberg,
1988; Flores & Dezzeo, 2005). Moreover, the nearby 2001). It has also been hypothesized that mixed flock
presence of the Río Sucio canyon could also contribute species may have converged using similar vocaliza-
to explain the higher diversity of birds in Quebrada, tions to mimic members of other species (Powell, 1985;
since it connects the site with grasslands in the lower Goodale & Kotagama, 2006). Based on this, presence of
plains of the Caribbean slope (Gillies & Clair, 2008). more abundant mixed flocks in Quebrada might help
explain high bird abundance in this site, without ne-
ACI and BIO were higher at Quebrada than at Ceibo, cessarily resulting in higher acoustic diversity.
like bird parameters. ACI has shown mixed results
regarding its ability as a bird indicator. Some studies Presence of Highway 32 seemed to reflect in the acous-
found positive relationships between ACI and num- tic environment. For example, SPLMean and MAE in-
ber of bird vocalizations (Pieretti et al., 2011), species dices indicated an environment with higher sound
richness and bird abundance (Eldridge et al., 2018; Re- pressure in Quebrada than Ceibo. Moreover, there
tamosa et al., 2018), or bioacoustic activity in general was a higher proportion of anthrophonies than biopho-
(Towsey et al., 2014). Other studies found weak or ne- nies in Quebrada than in Ceibo. This is consistent with
gative relationships between ACI and species richness Tenez (2018), who found more anthrophonies near the
or biophonic activity (Mammides et al., 2017; Eldridge paved entrance road to Santa Rosa National Park, Costa
68 | Biota Colombiana 22 (1) - 2021Retamosa-Izaguirre et al. Vegetation, bird and soundscape characterization
Rica. However, we found positive, high values in the References
NDSI index in both Ceibo and Quebrada, which indi-
cated that soundscapes at both sites were mostly com- Arévalo, J. E. & Blau, E. (2018). Road encroachment
posed of biophonies. near protected areas alters the natural soundscape
through traffic noise pollution in Costa Rica. Revista
In general, composition of both acoustic communities de Ciencias Ambientales, 52(1), 27-48.
in Ceibo and Quebrada appears to indicate a better https://doi.org/10.15359/rca.52-1.2
partitioned acoustic community in Ceibo. According Arévalo, J. E. & Knewhard, K. (2011). Traffic noise
to the acoustic niche hypothesis, soundscape is a limi- affects bird species in a protected tropical forest.
ted resource, and individuals must compete to com- Revista de Biología Tropical, 59(2), 969-980.
municate effectively, resulting in sound niches, where Becker, C. D. & Ágreda, A. (2005). Bird community di-
the soundscape is spatially and temporally divided fferences in mature and second growth garúa fo-
(Krause, 1987; Pijanowski et al., 2011). Therefore, the rest in Machalilla National Park, Ecuador. Ornitolo-
more complex the habitat, the more complex and spe- gia Neotropical, 16, 297-319.
cific the acoustic partition (Pieretti & Farina, 2013). Blake, J. G. & Loiselle, B. A. (2000). Diversity of birds
along an elevational gradient in the Cordillera Cen-
Some authors have criticized the use of population or tral, Costa Rica. The Auk, 117(3), 663-686.
community parameters as indicators of environmental https://doi.org/10.1093/auk/117.3.663
disturbance (Temple & Wiens, 1989; Niemi et al., 1997; Boelman, N., Asner, G., Hart, P. & Martin, R. (2007).
Campos-Cerqueira et al., 2019). For example, abun- Multi-trophic invasion resistance in Hawaii:
dance of bird species fluctuates in a specific way, and Bioacoustics, field surveys, and airborne remote
may not represent the trend of other species (Venier sensing. Ecological Applications, 17(8), 2137–2144.
& Pearce, 2004). Furthermore, changes in bird popu- https://doi.org/10.1890/07-0004.1
lations are generally associated with various factors, Boza, M. (1992). Parques Nacionales de Costa Rica. Guías
making it difficult to establish a cause-effect relations- Periplo. Costa Rica: Editorial Incafo. 91 pp.
hip with respect to the environmental changes evalua- Bradfer-Lawrence, T., Gardner, N., Bunnefeld, L., Bun-
ted (Temple & Wies, 1989). However, further insight nefeld, N., Willis, S. & Dent, D. (2019). Guidelines
could be attained by studying particular bird species, for the use of acoustic indices in environmental
as well as other parameters related to communication research. Methods in Ecology and Evolution, 10(10),
behavior, condition, or reproductive success. 1796-1807.
https://doi.org/10.1111/2041-210X.13254
Overall, we could argue for an indirect effect of the road Buxton, R., McKenna, M., Clapp, M., Meyer, E., Stane-
on the variables and parameters considered, through bau, E., Angeloni, L., Crooks, K. & Wittemyer, G.
changes in the structural complexity of the vegetation (2018). Efficacy of extracting indices from large-scale
surrounding it. Although bird parameters behaved acoustic recordings to monitor biodiversity. Conser-
unexpectedly in this study, soundscapes did seem to vation Biology, 32(5), 1174-1184.
reflect well the habitat condition of both study sites, as https://doi.org/10.1111/cobi.13119
seen in other studies (Do Nascimento et al., 2020), and Campos-Cerqueira, M., Mena J., Tejeda-Gómez V.,
are promising for evaluating the ecological condition Aguilar-Amuchástegui, N., Gutiérrez, N. & Mit-
of a site. chell Aide, T. (2019). How does FSC forest certifi-
cation affect the acoustically active fauna in Madre
de Dios, Peru? Remote Sensing in Ecology and Con-
Acknowledgements servation.
https://doi.org/10.1002/rse2.120
We thank the staff of Sector Quebrada González and Cooke, S., Balmford, A., Johnston, A., Newson, S. &
Puesto El Ceibo and UNA students for their collabora- Johnston, A. (2020a). Roads as a contributor to
tion during field work. We thank Christopher Vaughan landscape-scale variation in bird communities.
for proof reading of the manuscript and recommenda- Nature communications, 11, 3125.
tions. In memory of our friend and colleague, Óscar https://doi.org/10.1038/s41467-020-16899-x
Ramírez Alán.
Biota Colombiana 22 (1) - 2021 | 69DOI: 10.21068/c2021.v22n01a04 Retamosa-Izaguirre et al.
Cooke, S., Balmford, A., Johnston, A., Newson, S. & Francis, C. D., & Barber, J. R. (2013). A framework for
Donald, P. (2020b). Variation in abundances of com- understanding noise impacts on wildlife: an urgent
mon bird species associated with roads. Journal of conservation priority. Frontiers in Ecology and the En-
Applied Ecology, 57, 1271-1282. vironment, 11(6), 305-313.
https://doi.org/10.1111/1365-2664.13614 https://doi.org/10.1890/120183
Darras, K., Pütz, P., Rembold, K., & Tscharntke, T. Gasc, A., Sueur, J., Pavoine, S., Pellens, R., & Grandco-
(2016). Measuring sound detection spaces for acous- las, P. (2013). Biodiversity sampling using a global
tic animal sampling and monitoring. Biological Con- acoustic approach: contrasting sites with microen-
servation, 201, 29-37. demics in New Caledonia. PloS one, 8(5).
https://doi.org/10.1016/j.biocon.2016.06.021 https://doi.org/10.1371/journal.pone.0065311
Depraetere, M., Pavoine, S., Jiguet, F., Gasc, A., Duvail, Gillies, C. S., & Clair, C. C. S. (2008). Riparian corri-
S. & Sueur J. (2012). Monitoring animal diversity dors enhance movement of a forest specialist bird in
using acoustic indices: implementation in a tempe- fragmented tropical forest. Proceedings of the National
rate woodland. Ecological Indicators, 13(1), 46-54. Academy of Sciences, 105(50), 19774-19779.
https://doi.org/10.1016/j.ecolind.2011.05.006 https://doi.org/10.1073/pnas.0803530105
Do Nascimento, L., Campos-Cerqueira, M. & Bearda, Goodale, E., & Kotagama, S. W. (2006). Context-depen-
K. (2020). Acoustic metrics predict habitat type and dent vocal mimicry in a passerine bird. Proceedings
vegetation structure in the Amazon. Ecological Indi- of the Royal Society B: Biological Sciences, 273(1588),
cators, 117, 106679 875-880.
https://doi.org/10.1016/j.ecolind.2020.106679 https://doi.org/10.1098/rspb.2005.3392
Dooling, R. J. & Popper, A. N. (2007). The Effects of Gray, M. A., Baldauf, S. L., Mayhew, P. J., & Hill, J. K.
Highway Noise on Birds. Sacramento, California: The (2007). The response of avian feeding guilds to tro-
California Department of Transportation, Division pical forest disturbance. Conservation Biology, 21(1),
of Environmental Analysis. 133-141.
Eldridge, A., Guyot, P., Moscoso, P., Johnston, A., Eyre- https://doi.org/10.1111/j.1523-1739.2006.00557.x
Walker, Y. & Peck, M. (2018). Sounding out ecoa- Greenberg, R. (2001). Birds of many feathers: the for-
coustic metrics: Avian species richness is predicted mation and structure of mixed-species flocks of fo-
by acoustic indices in temperate but not tropical ha- rest birds. En Boinski, S. & Garber, P. (Eds.). On the
bitats. Ecological Indicators, 95(1), 939-952. Move: How and Why Animals Travel in Groups. Pp:
https://doi.org/10.1016/j.ecolind.2018.06.012 521-558. Chicago, United States of America: Uni-
Fairbrass, A., Rennett, P., Williams, C., Titheridge, H. versity of Chicago Press.
& Jones, K. (2017). Biases of acoustic indices measu- Herrera-Montes, M. I., & Aide, T. M. (2011). Impacts of
ring biodiversity in urban areas. Ecological Indicators, traffic noise on anuran and bird communities. Urban
83, 169-177. Ecosystems, 14(3), 415-427.
https://doi.org/10.1016/j.ecolind.2017.07.064 https://doi.org/10.1007/s11252-011-0158-7
Farina, A., Pieretti, N., & Piccioli, L. (2011). The sounds- Injaian, A. S., Taff, C. C., & Patricelli, G. L. (2018). Ex-
cape methodology for long-term bird monitoring: A perimental anthropogenic noise impacts avian pa-
Mediterranean Europe case-study. Ecological Infor- rental behaviour, nestling growth and nestling oxi-
matics, 6(6), 354-363. dative stress. Animal behaviour, 136, 31-39.
https://doi.org/10.1016/j.ecoinf.2011.07.004 https://doi.org/10.1016/j.anbehav.2017.12.003
Fernández, E. (2013). Carretera es motor y prioridad para Kasten, E. P., Gage, S. H., Fox, J., & Joo, W. (2012). The
la economía costarricense. San José, Costa Rica: El Fi- remote environmental assessment laboratory’s
nanciero. acoustic library: An archive for studying sounds-
Flores, S., & Dezzeo, N. (2005). Variaciones temporales cape ecology. Ecological Informatics, 12, 50-67.
en cantidad de semillas en el suelo y en lluvia de https://doi.org/10.1016/j.ecoinf.2012.08.001
semillas en un gradiente bosque-sabana en la Gran Keller, I., & Largiader, C. R. (2003). Recent habitat frag-
Sabana, Venezuela. Interciencia, 30(1), 39-43. mentation caused by major roads leads to reduc-
Forman, R. T., & Deblinger, R. D. (2000). The ecological tion of gene flow and loss of genetic variability in
road effect zone of a Massachusetts (USA) suburban ground beetles. Proceedings of the Royal Society of Lon-
highway. Conservation biology, 14(1), 36-46. don. Series B: Biological Sciences, 270(1513), 417-423.
https://doi.org/10.1046/j.1523-1739.2000.99088.x https://doi.org/10.1098/rspb.2002.2247
70 | Biota Colombiana 22 (1) - 2021Retamosa-Izaguirre et al. Vegetation, bird and soundscape characterization
Kindt, R. (2015). Biodiversity R: Package for Commu- of indicator species in management. The Journal
nity Ecology and Suitability Analysis, R Package of Wildlife Management, 61, 1240-1251.
Version 2.9-2. https://doi.org/10.2307/3802123
Krause, B. (1987). Bioacoustics, habitat ambiance in eco- Oosterhoorn, M., & Kappelle, M. (2000). Vegetation
logical balance. Whole Earth Review, 57, 14-18. structure and composition along an interior-ed-
Laurance, W. F., Stouffer, P., & Laurance, S. G. (2004). ge-exterior gradient in a Costa Rican montane cloud
Effects of road clearings on movement patterns forest. Forest Ecology and Management, 126(3), 291-
of understory rainforest birds in Central Amazo- 307.
nia. Conservation Biology, 18(4), 1099-1109. Pagès, J. (2002). Analyse factorielle multiple appliquée
https://doi.org/10.1111/j.1523-1739.2004.00268.x aux variables qualitatives et aux données mixtes. Re-
Laurance, W. F., Goosem, M., & Laurance, S. G. (2009). vue de statistique appliquée, 50(4), 5-37.
Impacts of roads and linear clearings on tropical fo- Patil, I. (2018). ggstatsplot: ‘ggplot2’ Based Plots with
rests. Trends in Ecology & Evolution, 24(12), 659-669. Statistical Details. CRAN, retrieved from
https://doi.org/10.1016/j.tree.2009.06.009 https://cran.r-project.org/web/packages/ggstats-
Laverde-R, O., Ryan, M. J., & Cadena, D. (2017). Evo- plot/index.html
lution of bird communication signals: transference Pérez, P. E., Hernández, A. A., & Gutiérrez, L. F. (2009).
between signals mediated by sensory drive. bioRxiv, Caracterización de la vegetación alrededor de los
142463. senderos del sector Quebrada González, Parque Na-
https://doi.org/10.1101/142463 cional Braulio Carrillo, Costa Rica. Uniciencia, 23(1-
Laverde-R, O., Ryan, M. J., & Cadena, D. (2018). Songs 2), 41-49.
in the understory and colors in the canopy: habi- Pielou, E. C. (1984). The Interpretation of Ecological Data:
tat structure leads to different avian communica- A Primer on Classification and Ordination. USA: John
tion strategies in a tropical montane forest. bioRxiv, Wiley y Sons.
393595 Pieretti, N., & Farina, A. (2013). Application of a re-
https://doi.org/10.1101/393595 cently introduced index for acoustic complexity to
Lê, S., Josse, J., & Husson, F. (2008). FactoMineR: An R an avian soundscape with traffic noise. The Journal
package for multivariate analysis. Journal of statisti- of the Acoustical Society of America, 134(1), 891-900.
cal software, 25(1), 1-18. https://doi.org/10.1121/1.4807812
https://doi.org/10.18637/jss.v025.i01 Pieretti, N., Farina, A., & Morri, D. (2011). A new
Levey, D. J. (1988). Tropical wet forest treefall gaps and methodology to infer the singing activity of an
distributions of understory birds and plants. Ecolo- avian community: The Acoustic Complexity Index
gy, 69, 1076–1089. (ACI). Ecological Indicators, 11(3), 868-873.
Mammides, C., Goodale, E., Dayananda, S. K., Kang, https://doi.org/10.1016/j.ecolind.2010.11.005
L., & Chen, J. (2017). Do acoustic indices correlate Pijanowski, B. C., Villanueva-Rivera, L. J., Dumyahn,
with bird diversity? Insights from two biodiverse S. L., Farina, A., Krause, B. L., Napoletano, B. M.,
regions in Yunnan Province, south China. Ecological Gage, S. H. & Pieretti, N. (2011). Soundscape ecolo-
Indicators, 82, 470-477. gy: the science of sound in the landscape. BioScien-
Marten, K., & Marler, P. (1977). Sound transmission ce, 61(3), 203-216.
and its significance for animal vocalization. Behavio- https://doi.org/10.1525/bio.2011.61.3.6
ral ecology and sociobiology, 2(3), 271-290. Pohlman, C. L., Turton, S. M., & Goosem, M. (2007).
Martin, C. A., & Proulx, R. (2016). Habitat geometry, Edge effects of linear canopy openings on tropi-
a step toward general bird community assembly cal rain forest understory microclimate. Biotropi-
rules in mature forests. Forest Ecology and Manage- ca, 39(1), 62-71.
ment, 361, 163-169. https://doi.org/10.1111/j.1744-7429.2006.00238.x
https://doi.org/10.1016/j.foreco.2015.11.019 Pohlman, C. L., Turton, S. M., & Goosem, M. (2009).
Mulwa, R. K., Böhning‐Gaese, K., & Schleuning, M. Temporal variation in microclimatic edge effects
(2012). High bird species diversity in structurally near powerlines, highways and streams in Austra-
heterogeneous farmland in western Kenya. Biotro- lian tropical rainforest. Agricultural and Forest Me-
pica, 44(6), 801-809. teorology, 149(1), 84-95.
Niemi, G.J., Hanowski, J.M., Lima, A.R., Nicholls, T., https://doi.org/10.1016/j.agrformet.2008.07.003
& Weiland, N. (1997). A critical analysis on the use
Biota Colombiana 22 (1) - 2021 | 71DOI: 10.21068/c2021.v22n01a04 Retamosa-Izaguirre et al.
Powell, G. V. (1985). Sociobiology and adaptive signifi- Sueur, J., Pavoine, S., Hamerlynck, O., & Duvail, S.
cance of interspecific foraging flocks in the Neotro- (2008). Rapid acoustic survey for biodiversity
pics. Ornithological Monographs, 713-732. appraisal. PloS one, 3(12).
Proulx, R., & Parrott, L. (2008). Measures of structu- https://doi.org/10.1371/journal.pone.0004065
ral complexity in digital images for monitoring the Sueur, J., Simonis, C., Brown, E., Depraetere, M., Des-
ecological signature of an old-growth forest ecosys- jonqueres, C., Fabianek, F., Gasc, A., LaZerte, S.,
tem. Ecological Indicators, 8(3), 270-284. Lees, J., Marchal, J., Pavoine, S., Stotz, A., Villanue-
https://doi.org/10.1016/j.ecolind.2007.02.005 va-Rivera, L., Ross, Z., Witthoft, C., & Zhivomirov,
Proulx, R., & Parrott, L. (2009). Structural complexi- H. (2016). Paquete para R: Seewave, Sound Analysis and
ty in digital images as an ecological indicator for Synthesis. Version 2.0.5.
monitoring forest dynamics across scale, space and https://rug.mnhn.fr/seewave
time. Ecological Indicators, 9(6), 1248-1256. Tecnológico de Costa Rica–TEC. (2014). Atlas de Costa
https://doi.org/10.1016/j.ecolind.2009.03.015 Rica. San José, Costa Rica.
R Core Team. 2019. R: A language and environment Temple, S. A., & Wiens, J. A. (1989). Bird populations
for statistical computing. Vienna, Austria: R Foun- and environmental changes: can birds be bio-indi-
dation for Statistical Computing. cators? American Birds, 43, 260-270.
https://www.R-project.org/ Tenez, E. D. (2016). Caracterización del paisaje sonoro aso-
Reijnen, R., Foppen, R., & Veenbaas, G. (1997). Disturban- ciado a las carreteras internas del parque nacional Santa
ce by traffic of breeding birds: evaluation of the effect Rosa, Costa Rica (M.Sc. Tesis). Heredia, Costa Rica:
and considerations in planning and managing road Universidad Nacional, Instituto Internacional en
corridors. Biodiversity & Conservation, 6(4), 567-581. Conservación y Manejo de Vida Silvestre.
Retamosa, I. M., Ramírez-Alán, O., & De la O, C. J. Towsey, M., Wimmer, J., Williamson, I., & Roe, P.
(2018). Acoustic indices applied to biodiversity mo- (2014). The use of acoustic indices to determine
nitoring in a Costa Rica dry tropical forest. Journal avian species richness in audio-recordings of the
of Ecoacoustics, 2, TNW2NP. environment. Ecological Informatics, 21, 110-119.
https://doi.org/10.22261/jea.tnw2np https://doi.org/10.1016/j.ecoinf.2013.11.007
Roca, I. T., Desrochers, L., Giacomazzo, M., Bertolo, A., Trombulak, S. C., & Frissell, C. A. (2000). Review of
Bolduc, P., Deschesnes, R., Martin, C. A., Rainville, ecological effects of roads on terrestrial and aqua-
V., Rheault, G. & Proulx, R. (2016). Shifting song tic communities. Conservation biology, 14(1), 18-30.
frequencies in response to anthropogenic noise: a https://doi.org/10.1046/j.1523-1739.2000.99084.x
meta-analysis on birds and anurans. Behavioral Eco- Venier, L. A., & Pearce, J. L. (2004). Birds as indicators
logy, 27(5), 1269-1274. of sustainable forest management. The Forestry Chro-
https://doi.org/10.1093/beheco/arw060 nicle, 80(1), 61-66.
Rosin, P. L. (2001). Unimodal thresholding. Pattern re- https://doi.org/10.5558/tfc80061-1
cognition, 34(11), 2083-2096. Villanueva-Rivera, L. J., & Pijanowski, B. C. (2016).
Schulze, C. H., Waltert, M., Kessler, P. J., Pitopang, Soundecology: soundscape ecology. R package ver-
R., Veddeler, D., Mühlenberg, M., Gradstein, R., sion 1.3. 2.
Leuschner, C., Steffan-Dewenter, I. & Tscharntke, http://ljvillanueva.github.io/soundecology/
T. (2004). Biodiversity indicator groups of tropical Villanueva-Rivera, L. J., Pijanowski, B. C., Doucette, J.,
land-use systems: comparing plants, birds, and in- & Pekin, B. (2011). A primer of acoustic analysis for
sects. Ecological applications, 14(5), 1321-1333. landscape ecologists. Landscape ecology, 26(9), 1233.
https://doi.org/10.1890/02-5409 https://doi.org/10.1007/s10980-011-9636-9
Shannon, C. & Weaver, W. (1964). The Mathematical Zamora, N. (2008). Unidades fitogeográficas para la cla-
Theory of Communication. Urbana, USA: University sificación de ecosistemas terrestres en Costa Rica.
of Illinois Press. 144 pp. Recursos Naturales y Ambiente, 54, 14-20.
72 | Biota Colombiana 22 (1) - 2021Retamosa-Izaguirre et al. Vegetation, bird and soundscape characterization
Mónica Isabel Retamosa-Izaguirre
Universidad Nacional de Costa Rica,
Heredia, Costa Rica
mretamos@una.cr
https://orcid.org/0000-0002-4010-2998
David Segura Sequeira
Universidad Nacional de Costa Rica,
Heredia, Costa Rica
davidsegura719@gmail.com
https://orcid.org/0000-0002-6088-638X
Jimmy Barrantes-Madrigal
Universidad Nacional de Costa Rica, Vegetation, bird and soundscape characterization:
Heredia, Costa Rica a case study in Braulio Carrillo National Park,
jimmybarrantesm@gmail.com Costa Rica
https://orcid.org/0000-0002-6088-638X
Citación del artículo: Retamosa-Izaguirre, M.I., Segu-
Manuel Spínola Parallada ra-Sequeira-D., Barrantes-Madrigal, J. Spínola-Paralla-
Universidad Nacional de Costa Rica, da, M. & Ramírez-Alán, O. (2021). Vegetation, bird and
Heredia, Costa Rica soundscape characterization: a case study in Braulio
mspinola10@gmail.com Carrillo National Park, Costa Rica. Biota Colombiana,
https://orcid.org/0000-0002-7839-1908
22(1), 57-73.
https://doi.org/10.21068/c2021.v22n01a04
Óscar Ramírez-Alán
Universidad Nacional de Costa Rica,
Heredia, Costa Rica Received: May 29, 2020
osoramirez@gmail.com Accepted: November 9, 2020
Biota Colombiana 22 (1) - 2021 | 73You can also read