Chromatin architecture transitions from zebrafish sperm through early embryogenesis
←
→
Page content transcription
If your browser does not render page correctly, please read the page content below

Downloaded from genome.cshlp.org on July 3, 2021 - Published by Cold Spring Harbor Laboratory Press

Research

Chromatin architecture transitions from zebrafish
sperm through early embryogenesis
Candice L. Wike,1 Yixuan Guo,1 Mengyao Tan,1 Ryohei Nakamura,2 Dana Klatt Shaw,3
Noelia Díaz,4 Aneasha F. Whittaker-Tademy,1 Neva C. Durand,5
Erez Lieberman Aiden,5,6,7,8 Juan M. Vaquerizas,4,9,10 David Grunwald,3
Hiroyuki Takeda,2 and Bradley R. Cairns1
1
 Howard Hughes Medical Institute, Department of Oncological Sciences and Huntsman Cancer Institute, University of Utah School of
Medicine, Salt Lake City, Utah 84112, USA; 2Department of Biological Sciences, Graduate School of Science, The University of Tokyo,
Tokyo 113-0033, Japan; 3Department of Human Genetics, University of Utah, Salt Lake City, Utah 84112, USA; 4Max Planck
Institute for Molecular Biomedicine, 48149 Muenster, Germany; 5The Center for Genome Architecture, Baylor College of Medicine,
Houston, Texas 77030, USA; 6Department of Molecular and Human Genetics, Baylor College of Medicine, Houston, Texas 77030,
USA; 7Department of Computer Science, Department of Computational and Applied Mathematics, Rice University, Houston, Texas
77005, USA; 8Center for Theoretical Biological Physics, Rice University, Houston, Texas 77030, USA; 9MRC London Institute of
Medical Sciences, London W12 0NN, United Kingdom; 10Institute of Clinical Sciences, Faculty of Medicine, Imperial College London,
London W12 0NN, United Kingdom

        Chromatin architecture mapping in 3D formats has increased our understanding of how regulatory sequences and gene
        expression are connected and regulated in a genome. The 3D chromatin genome shows extensive remodeling during em-
        bryonic development, and although the cleavage-stage embryos of most species lack structure before zygotic genome ac-
        tivation (pre-ZGA), zebrafish has been reported to have structure. Here, we aimed to determine the chromosomal
        architecture in paternal/sperm zebrafish gamete cells to discern whether it either resembles or informs early pre-ZGA
        zebrafish embryo chromatin architecture. First, we assessed the higher-order architecture through advanced low-cell in
        situ Hi-C. The structure of zebrafish sperm, packaged by histones, lacks topological associated domains and instead displays
        “hinge-like” domains of ∼150 kb that repeat every 1–2 Mbs, suggesting a condensed repeating structure resembling mitotic
        chromosomes. The pre-ZGA embryos lacked chromosomal structure, in contrast to prior work, and only developed struc-
        ture post-ZGA. During post-ZGA, we find chromatin architecture beginning to form at small contact domains of a median
        length of ∼90 kb. These small contact domains are established at enhancers, including super-enhancers, and chemical inhi-
        bition of Ep300a (p300) and Crebbpa (CBP) activity, lowering histone H3K27ac, but not transcription inhibition, dimin-
        ishes these contacts. Together, this study reveals hinge-like domains in histone-packaged zebrafish sperm chromatin and
        determines that the initial formation of high-order chromatin architecture in zebrafish embryos occurs after ZGA primarily
        at enhancers bearing high H3K27ac.
        [Supplemental material is available for this article.]

The folding of chromatin inside the nucleus helps regulate en-                      Lupiáñez et al. 2015; Valton and Dekker 2016; Rosa-Garrido
hancer–promoter interactions and the formation of chromatin                         et al. 2017; Davis et al. 2018).
compartments, which impacts gene regulation and development.                              A key issue within developmental biology involves how em-
Chromatin is organized at multiple scales, the largest of which in-                 bryos transition from a totipotent to a lineage-committed state,
volves megabase-scale active or inactive regions called A or B com-                 and higher-order chromatin structures are known to influence en-
partments, respectively (Lieberman-Aiden et al. 2009). It is further                hancer–promoter interaction potential for developmental genes.
organized into topological associating domains (TADs) that                          To better understand, we sought to determine how higher-order
provide a structural framework that enables proper enhancer–pro-                    chromatin structure is initially established in embryos, how they
moter loop engagement to minimize improper interactions                             change during early development and cell differentiation, and
(Lieberman-Aiden et al. 2009; Dixon et al. 2012; Nora et al.                        how they are regulated. Notably, chromatin structure and tran-
2012). The disruption of TAD boundaries can misregulate these                       scription influence each other, highlighting the need to under-
properties and lead to developmental disorders and promote can-                     stand the relationship between the onset of transcription in the
cer, demonstrating that TADs are required for proper transcription                  embryo (termed zygotic genome activation [ZGA]) and the estab-
during development (Gröschel et al. 2014; Northcott et al. 2014;                    lishment of the chromatin organization. These issues have been
                                                                                    explored in a number of vertebrate and invertebrate species, which
                                                                                    have generally revealed that chromatin lacks extensive higher-
Corresponding author: brad.cairns@hci.utah.edu
Article published online before print. Article, supplemental material, and publi-   © 2021 Wike et al. This article, published in Genome Research, is available un-
cation date are at https://www.genome.org/cgi/doi/10.1101/gr.269860.120.            der a Creative Commons License (Attribution 4.0 International), as described at
Freely available online through the Genome Research Open Access option.             http://creativecommons.org/licenses/by/4.0/.

31:1–14 Published by Cold Spring Harbor Laboratory Press; ISSN 1088-9051/21; www.genome.org                                       Genome Research               1
                                                                                                                                     www.genome.org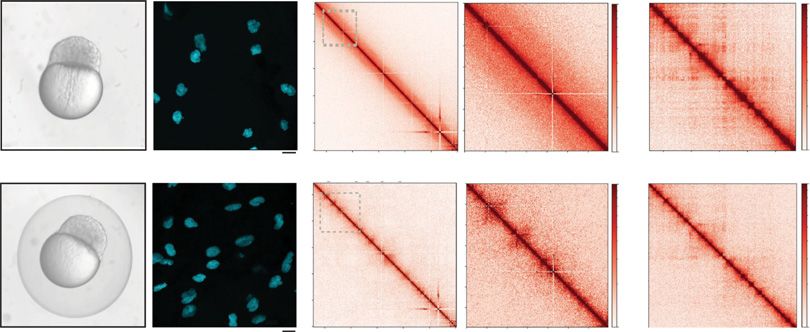
Downloaded from genome.cshlp.org on July 3, 2021 - Published by Cold Spring Harbor Laboratory Press

Wike et al.

order structure before ZGA, can form independently of transcrip-          ChIP-seq analysis of post-ZGA samples to identify the locations
tion, and largely forms after ZGA (Du et al. 2017; Hug et al.             in the genome where chromatin architecture initially forms.
2017; Ke et al. 2017; Chen et al. 2019). Conversely, Danio rerio
(zebrafish) has been reported to display both A/B compartments
and TAD structures in the early cleavage-stage embryo before
                                                                          Results
ZGA (pre-ZGA). Curiously, both A/B compartments and TADs                  High-resolution Hi-C chromatin conformation maps of zebrafish
are lost during ZGA (Kaaij et al. 2018). This apparent observation        sperm and early embryos
of pre-ZGA structure is not intuitive in light of the 10 rapid cell cy-
                                                                          To better understand the nucleation of chromatin architecture in
cles (∼15 min/cycle) and DNA replication cycles that accompany
                                                                          the developing embryo, our time course focused on time points
zebrafish pre-ZGA embryo development. These reported differenc-
                                                                          that flank and include ZGA. To these ends, we modified previously
es between pre-ZGA (structured and ∼15 min cell cycle) and early
                                                                          published low-cell input Hi-C methods to the early zebrafish em-
post-ZGA (not structured and ∼1 h cell cycle) phases in the zebra-
                                                                          bryo (Methods; Rao et al. 2014; Díaz et al. 2018) and determined
fish embryo prompted us to further examine whether the pre-ZGA
                                                                          the 3D chromatin organization of zebrafish mature sperm, as
structure resembles—and is possibly informed by—the structures
                                                                          well as embryos at 2.25 hpf (pre-ZGA), 4 hpf (just after ZGA initi-
present in the parental (sperm or oocyte) genomes.
                                                                          ation), 5.3 hpf (post-ZGA, gastrulation), and 24 hpf (Fig. 1A;
      Our work here also addresses zebrafish sperm chromatin ar-
                                                                          Supplemental Fig. S1A). To ensure clear interpretation, we generat-
chitecture. In mammalian species, the vast majority of the pater-
                                                                          ed Hi-C contact maps of higher resolution than prior work (Kaaij
nal genome is packaged in protamine (Carrell 2011; Ausió et al.
                                                                          et al. 2018; Supplemental Table S1).
2014). However, histones remain focally at many promoters and
                                                                                Visual inspection of normalized contact probability maps for
enhancers of housekeeping and developmental genes in both
                                                                          all samples at 25 kb resolution revealed considerable differences in
mice and humans (Hammoud et al. 2009; Brykczynska et al.
                                                                          structure within the zebrafish developmental stages examined
2010). In counter distinction to most other vertebrate species,
                                                                          (for Hi-C statistics, see Supplemental Table S1). First, we observed
zebrafish sperm genomes are packaged entirely by histones rather
                                                                          differences in contact probability over genomic distance for each
than protamine proteins (Wu et al. 2011; Zhang et al. 2016; Zhang
                                                                          embryo time point (Supplemental Fig. S1B), suggesting that the
et al. 2018), but like mammalian sperm, housekeeping and devel-
                                                                          overall chromatin architecture in the developing zebrafish em-
opmental promoters and enhancers in zebrafish sperm lack DNA
                                                                          bryo varies between time points. Consistent with prior work
methylation and contain H3K4me3, H2A.Z/FV, H3K27ac, and
                                                                          (Kaaij et al. 2018), genomes of 24 hpf embryos show clear 3D
(at developmental genes) H3K27me3 (Wu et al. 2011; Murphy
                                                                          structures of traditional triangular topological associated domains
et al. 2018; Zhang et al. 2018). Additionally, histone chromatin
                                                                          (TADs) (Fig. 1B). Sperm chromatin lacked TADs and instead dis-
marks and DNA methylation are reprogrammed during pre-ZGA
                                                                          played a unique structure, one that resembled “flare-like” struc-
zebrafish stages, but in an asymmetric manner; the maternal ge-
                                                                          tures, in the contact maps that was not observed in embryo
nome is largely reprogrammed to adopt the marking present in
                                                                          stages (Fig. 1B). Regarding the embryo, the contact maps in pre-
the sperm genome (Bernstein et al. 2006; Wu et al. 2011; Potok
                                                                          ZGA (2.25 hpf) lacked TAD-like structure domains, in marked
et al. 2013; Murphy et al. 2018; Zhang et al. 2018). Prior work in
                                                                          contrast with a prior report (Kaaij et al. 2018). For both post-
mice and the rhesus monkey strongly suggests the presence of
                                                                          ZGA samples (4 hpf and 5.3 hpf), only a limited number of re-
higher-order chromatin in mammalian sperm (Battulin et al.
                                                                          gions formed small contact domains, which were detectable by
2015; Jung et al. 2017; Wang et al. 2019), although structure is cu-
                                                                          the changes in chromatin interactions along the diagonal that
riously lacking in human sperm (Chen et al. 2019), suggesting var-
                                                                          are smaller than a TAD size (Fig. 1B), explored in detail below.
iation in mammals. Thus, an analysis of higher-order structure in
                                                                          Furthermore, the self-interacting A/B chromatin compartments
zebrafish sperm (which lacks protamine) would complement
                                                                          were largely absent in our pre-ZGA through post-ZGA samples, al-
those prior studies and provide an initial view of the higher-order
                                                                          though they were clearly detected in sperm and at 24 hpf (Fig.
structure of a genome entirely packaged in histones. Furthermore,
                                                                          1C). Examination of our data by HiCExplorer (Wolff et al.
if the higher-order structure in sperm resembled the pre-ZGA struc-
                                                                          2018), a program to analyze Hi-C data, revealed a lack of boun-
ture, this would raise the possibility that structure in gametes
                                                                          dary structures in sperm or pre-ZGA samples (Supplemental Fig.
might be inherited (in part) to influence structure in the embryos.
                                                                          S1C). We then generated metaplots of aggregate TAD insulation
Parental contribution might be diluted by subsequent rapid cell cy-
                                                                          signal, using boundaries established at 24 hpf, and this approach
cles of the developing zebrafish embryo to arrive at the lack of
                                                                          also showed a lack of negative insulation score in sperm and pre-
structure seen post-ZGA. This precedent, combined with the tech-
                                                                          ZGA samples (Supplemental Fig. S1D). Thus, our initial premise
nical challenges of conducting high-throughput chromosome
                                                                          that sperm architecture might resemble the reported structure in
confirmation capture (Hi-C) on oocytes versus sperm, prompted
                                                                          pre-ZGA embryos was not supported, prompting instead an ex-
our initial analysis of the sperm genome and comparison to the
                                                                          ploration of why the pre-ZGA samples lacked both A/B compart-
pre-ZGA structure.
                                                                          ments and TAD boundaries, where and when structure initially
      Our initial goals were to use Hi-C to provide a better under-
                                                                          forms in zebrafish, and the characterization of the unique struc-
standing of the connections between chromatin architecture and
                                                                          tures observed in sperm.
transcription initiation. We aimed to determine the 3D chromatin
conformation of histone-packaged zebrafish sperm and to test if
that architecture is transmitted to the next generation and either        Zebrafish pre-ZGA embryos lack a defined 3D architecture
resembles or guides the structure of pre-ZGA zebrafish embryo             As previewed above, we found the pre-ZGA (2.25 hpf) genome es-
chromatin. Notably, our characterization of the sperm genome re-          sentially void of boundaries and TAD-like chromatin interactions
veals an architectural feature distinct from TADs and distinct from       (Fig. 1B; Supplemental Fig. S1C). We took two measures to deter-
architecture in embryos. Within embryos, our results at pre-ZGA           mine whether the observed lack of structure in pre-ZGA samples
differed greatly from prior work, prompting a detailed Hi-C and           was biological or instead a technical artifact. First, to minimize

2    Genome Research
       www.genome.org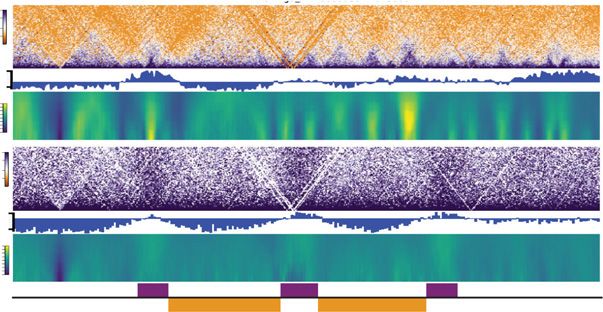
Downloaded from genome.cshlp.org on July 3, 2021 - Published by Cold Spring Harbor Laboratory Press

                                                                                         3D chromatin of zebrafish sperm and embryos

 A                                                                                                       Low-cell Hi-C method with pre-ZGA
                                                                                                         embryos is susceptible to somatic cell
                                                                                                         contamination

                                                                                                             We then sought to explain how structure
                                                                                                             might have been observed during the
   B                                                                                                         pre-ZGA stage in prior work (Kaaij et al.
                                                                                                             2018). A major challenge involves the
                                                                                                             need to isolate chromatin from embryos
                                                                                                             that are initially encased in a chorion.
                                                                                                             During oocyte maturation, the chorion
                                                                                                             is surrounded by (and in association
                                                                                                             with) large numbers of somatic granulosa
                                                                                                             and theca cells, which can remain on the
                                                                                                             surface of the chorion during early em-
                                                                                                             bryo stages and must be properly re-
                                                                                                             moved (Selman et al. 1993). We found a
                                                                                                             significant difference depending on
                                                                                                             whether the chorion was removed imme-
                                                                                                             diately before embryo fixation (late
   C                                                                                                         dechorionation) versus at the one-cell
                                                                                                             stage shortly after fertilization (early
                                                                                                             dechorionation). Although late dechor-
                                                                                                             ionated pre-ZGA embryos showed chro-
                                                                                                             matin contacts that strongly resemble
                                                                                                             prior work, early dechorionated pre-
                                                                                                             ZGA embryos lacked 3D conformation
                                                                                                             features (Fig. 2A–C). This suggests that
   D                                                                                                         contamination is likely responsible for
                                                                                                             the pre-ZGA structural features reported
                                                                                                             previously.
                                                                                                                  To determine the source of con-
                                                                                                             tamination, we examined whether the
                                                                                                             structured contact maps from late
                                                                                                             dechorionation better resembled maps
Figure 1. Chromatin architecture in the developing zebrafish sperm and embryos. (A) Schematic of the         from sperm chromatin or somatic cell
time points collected. Samples collected for low-cell in situ Hi-C experiments: sperm, 2.25 hpf (pre-ZGA,    chromatin. We simulated Hi-C contact
128-cell), 4 hpf, 5.3 hpf, and 24 hpf. The onset of transcription during zygotic genome activation (ZGA)
                                                                                                             maps by mixing pre-ZGA valid pairs
is ∼3 hpf in zebrafish. The transcription activity is portrayed by the green background. (B) Contact ma-
trices of each time point from Chromosome 18 (top) inlet is marked in dashed gray box; Chr 18: 20–30         with increasing percentage of valid pairs
Mb (bottom), 25 kb resolution in log scale. Flares detected in sperm time point are marked by black ar-      from 24 hpf or sperm data sets (Fig. 2D)
rows. (C) Correlation matrix of each time point from Chr 18. The first eigenvector (PCA1) for the normal-    and then generated metaplots of aggre-
ized observed/expected ratio is shown below the panel to determine A/B compartment status. (D)
                                                                                                             gate TAD insulation signal, using bound-
Contact matrices of each time point from the Drosophila S2 spike-in Chr 2L: 5–15 Mb, 25 kb resolution
in log scale.                                                                                                aries established at 24 hpf (Fig. 2D).
                                                                                                             Structure was detectable genome-wide
                                                                                                             with 30% mixing of 24 hpf valid pairs;
                                                                                                             because the 2.25 hpf embryo has only
the confounding effects of highly condensed mitotic chromatin,                    128 cells, this level/percentage of contamination might easily be
we took advantage of the cell cycle synchrony of pre-ZGA embryos                  reached. These analyses suggest that the structure detected in the
to enrich for embryo batches that were largely outside metaphase                  pre-ZGA embryo (Fig. 2B) with late dechorionation involves
by including only embryo batches with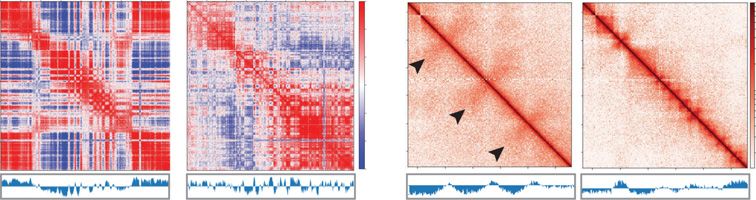
Downloaded from genome.cshlp.org on July 3, 2021 - Published by Cold Spring Harbor Laboratory Press

Wike et al.

    A                                     B                                 C                             structural boundaries emerging at 4 hpf,
                                                                                                          and that those established at 4 hpf are
                                                                                                          largely maintained at 5.3 and 24 hpf
                                                                                                          (Supplemental Fig. S2E,F). The clarity of
                                                                                                          TADs in 24 hpf embryos, which are
                                                                                                          diverse in cell types, shows that zebrafish
                                                                                                          share with other species a consistency in
                                                                                                          TAD organization between cell types
                                                                                                          (Dixon et al. 2012, 2015; Vietri Rudan
                                                                                                          et al. 2015; Hug et al. 2017).

                                                                                                          Chromatin architecture boundaries
                                                                                                          persist in the absence of transcription
    D                                                                                                        We next investigated the relationship of
                                                                                                             TAD boundaries to transcription. We first
                                                                                                             determined the association of RNA Poly-
                                                                                                             merase II (Pol II) during TAD boundary
                                                                                                             establishment by evaluating the insula-
                                                                                                             tion score across the top 1000 peaks of
                                                                                                             Pol II loci ChIP-seq at 4 hpf embryos.
                                                                                                             Pol II–bound loci at 4 hpf displayed neg-
                                                                                                             ative insulation scores, suggesting that
                                                                                                             Pol II–bound loci are associated with
                                                                                                             TAD boundaries forming/formed at 4
                                                                                                             hpf (Supplemental Fig. S3A). We next ad-
                                                                                                             dressed whether the loss of productive
                                                                                                             Pol II elongation at these boundaries im-
                                                                                                             pacts chromatin organization. To test, we
                                                                                                             treated zebrafish embryos with either ve-
                                                                                                             hicle (DMSO) or the Pol II inhibitor Fla-
                                                                                                             vopiridol (FLAV), starting at the one-cell
                                                                                                             stage and continuing through ZGA, and
                                                                                                             collected embryos at 4 hpf for examina-
                                                                                                             tion by in situ Hi-C (Supplemental Fig.
                                                                                                             S3A,B; Supplemental Table S1). Treat-
                                                                                                             ment with FLAV led to a loss of Pol II
                                                                                                             ser5 phosphorylation signal, by immu-
Figure 2. Impact of alternative chorion removal procedures on perceived chromatin architecture.              nofluorescence, suggesting effective Pol
(A) Brightfield images of embryos collected at pre-ZGA/128-cell: early dechorionated (at 128-cell stage;
top left), late dechorionated (just before fixation; bottom left). pre-ZGA/128-cell embryo fixed and the
                                                                                                             II inhibition and loss of transcription in
DNA was stained with DAPI (cyan) dechorionated at one-cell stage (top right) and dechorionated before        the 4 hpf embryo (Supplemental Fig.
fixation (bottom right) with 40× obj scale bar = 10 µM. (B) Contact matrices from pre-ZGA/128-cell, whole    S3C). However, the chromatin Hi-C con-
Chromosome 11 (early dechorionated, top left; late dechorionated, bottom left) inlet is marked in dashed     tact maps obtained after Pol II inhibition
gray box; partial Chr 11: 19–26 Mb (early dechorionated, top right; late dechorionated, bottom right),
                                                                                                             appeared largely unaffected (Supplemen-
25-kb resolution in log scale. (C) Contact matrices from the Drosophila S2 spike-in, Chr 2L: 5–15 Mb (early
dechorionated, top; late dechorionated, bottom), 25-kb resolution in log scale. (D) Contact matrices from    tal Fig. S3B). TAD boundary insulation
Chr 11: 19–26 Mb pre-ZGA/128-cell, 24 hpf, and sperm down-sampled to 100 M valid pairs (left of              present at Pol II–bound loci in the 4 hpf
dashed line). Simulated contact matrices (right of dashed line) are imaged of pre-ZGA/128-cell with in-      (untreated) and vehicle-treated (DMSO)
creasing percentages of 24 hpf (top) or sperm (bottom) valid pairs. Metaplots for the boundaries called at   embryos was only slightly reduced
24 hpf (25-kb resolution) are plotted below each matrix.
                                                                                                             upon treatment with FLAV. These results
                                                                                                             suggest that the lack of transcription
                                                                                                             elongation is not sufficient to markedly
interactions at similar locations, although stronger at 24 hpf than                disrupt chromatin architecture boundaries, a result supported by
at 5.3 hpf, a trend noted in previous work and confirmed through                   similar experiments (Hug et al. 2017; Ke et al. 2017; Kaaij et al.
our reanalysis of that prior data (Supplemental Fig. S2; Kaaij et al.              2018).
2018). Our analysis also validates prior observations that the 4, 5.3,
and 24 hpf staged embryos progressively form chromatin interac-
tions and TADs during development (Supplemental Fig. S2A).                         Chromatin boundaries correlate with predicted Ctcf sites, whereas
However, examination of our data and prior data revealed chromo-                   Rad21/cohesin-occupied regions have small contact domains
somal domains and boundary-like structures at 4 hpf that were not                  Although TAD structures are rare and weak at ZGA, we sought to
detected in prior work and a higher overlap between time points                    address instead whether smaller contact domains might be estab-
(Supplemental Fig. S2B–D). By measuring negative insulation                        lished in early zebrafish embryos, and by virtue of their small
scores across each time point, we observed a limited number of                     size, form in spite of replication/cell cycle time constraints. Prior

4       Genome Research
         www.genome.org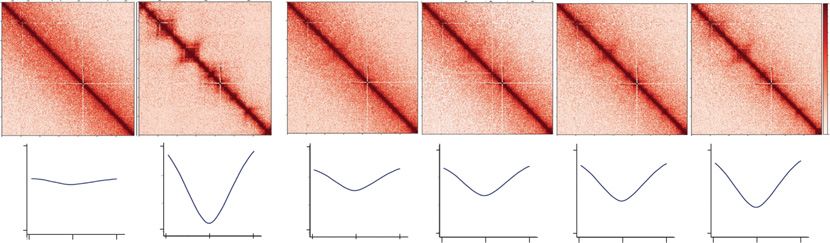
Downloaded from genome.cshlp.org on July 3, 2021 - Published by Cold Spring Harbor Laboratory Press

                                                                                   3D chromatin of zebrafish sperm and embryos

work in other systems suggested that early enhancer/promoter            where structural interactions initially form, and their insulation
loops might form independent of cohesin and Ctcf (CTCF ortho-           score strength scales with their levels of H3K27ac and H3K4me1.
log) co-occupied sites and can form faster than structural loops
(Zhang et al. 2019), prompting an examination of zebrafish Ctcf
binding sites, cohesin, and enhancers at 4 hpf. Here, anti-Rad21
                                                                        Small contact domains at ZGA correlate with pluripotency factors
antibodies are available, whereas commercial zebrafish anti-Ctcf        and transcription, but interactions do not require active
antibodies are not available, requiring instead our procuring po-       transcription
tential Ctcf binding sites by HOMER Motif finder across the             We next determined whether transcription factors or architectur-
Zv10 genome. We verified the presence of RNAs during ZGA en-            al structural proteins might bind at these enhancer regions to
coding structural proteins (Ctcf and cohesin complex) and cohesin       help establish enhancer domains and/or enhancer–promoter
loading and unloading factors (Nipbl and Wapl) using publicly           loops in the developing embryo, possibly to help prime these
available RNA-seq data (Supplemental Fig. S4A,B; White et al.           loci for future transcription. To test for factor binding, we per-
2017). At post-ZGA (4 hpf), the locations where both Rad21 (cohe-       formed the Assay for Transposase-Accessible Chromatin (ATAC-
sin; via ChIP-seq) and candidate Ctcf binding sites were coinci-        seq) in the 4 hpf embryo. The ATAC-seq signal had the strongest
dent, we also observe chromatin architecture boundaries (a              peak across potential SE and Group 3 enhancers (Fig. 3C;
decrease in insulation score, as depicted by blue signal in the heat-   Supplemental Fig. S5A). We then intersected the enhancer re-
map) across all developmental time points (Supplemental Fig.            gions with the ATAC-seq signal and used HOMER Motif
S4C). In contrast, at locations where Rad21 binds independent           Analysis (Heinz et al. 2010) to determine candidate transcription
of the presence of Ctcf binding sites, the opposite behavior was ob-    factors that bind at these putative enhancers at 4 hpf.
served—an increase in interactions (increase in insulation score, as    Additionally, we confirmed whether a candidate binding factor
depicted by red signal in the heatmap), especially at 5.3 hpf           is indeed expressed at the RNA level in the early embryo by
(Supplemental Fig. S4C). These observations suggest that small          cross-referencing with RNA-seq data sets (Chan et al. 2019).
contact domains (median size 90 kb) occur in the early embryo           This approach yielded sites for several important transcription
at locations where cohesin is present, but not where Ctcf is predict-   factors related to pluripotency, for example, Pou5f3-family
ed to be co-occupied with cohesin.                                      (POU5F1 [also known as OCT4] human ortholog), Sox-family,
                                                                        and Nanog-family members were more enriched in SE and
                                                                        Group3 relative to the other groups (Fig. 3E). Here, Ctcf motifs
                                                                        only appeared in Group 2 and Group 1 enhancer groups, further
Chromatin architecture is initially established at putative ZGA         supporting that sites of strong interaction lack Ctcf. Overall, mul-
enhancers                                                               tiple transcription factors and structural proteins—especially
We next explored possible chromatin interactions at enhancers           those associated with regulating pluripotency—appear to have
and their relationships to cohesin, Ctcf, and other DNA-binding         in silico enrichment for their motif across all enhancer groups.
proteins. First, we defined candidate enhancers at 4 hpf using                To determine the histone modifications or chromatin fea-
the standard ROSE algorithms (Lovén et al. 2013; Whyte et al.           tures that best correlate with interaction scores across 4 hpf en-
2013) and published ChIP-seq data sets for H3K27ac and                  hancers, we examined published 4 hpf embryo ChIP-seq profiles
H3K4me1 (Zhang et al. 2016). The top-ranking regions were de-           of histone H3K27ac (Zhang et al. 2018), H3K4me1 (Bogdanovic
fined as candidate super-enhancers (SE), and the remaining ranked       et al. 2012), H3K4me3 (Zhang et al. 2018), H3K27me3 (Zhang et
enhancers were stratified into three equal-sized cohorts for further    al. 2018), H3K36me3 (Zhang et al. 2018), and our ChIP-seq data
examination, labeled Groups 1–3 (Fig. 3A). Enhancers with high          of Pol II, and Rad21 (cohesin) centered at the enhancers (Fig. 3C;
levels of histone H3K27ac and H3K4me1 displayed positive insula-        Supplemental Fig. S5A). First, histone H3K27ac and H3K4me1
tion scores, at 4 and 5.3 hpf (SE and Group 3) suggesting that these    were expectedly coincident, and H3K4me3 and H3K27me3 were
putative enhancers are associated with chromatin interactions,          low or lacking at the strongest enhancers—those with highest
with higher insulation scores detected at 5.3 hpf (Fig. 3B). These      histone H3K4me1 and H3K27ac (SE and Group 3) (Fig. 3C;
small contact domains found at strong enhancers have a median           Supplemental Fig. S5A). Additionally, cohesin, Pol II, and
length of 90 kb. In contrast, Groups 1 and 2, which displayed rel-      H3K36me3 were detected across regions within SE and Group 3
atively low levels of histone H3K27ac and H3K4me3, lacked small         putative enhancers (Fig. 3C; Supplemental Fig. S5A). Although
contact domains (Fig. 3B).                                              these heatmaps appear to convey a direct overlap of Pol II and his-
     To determine whether enhancers are the primary location            tone H3K36me3 at enhancers, our limited resolution (>10-kb bins)
where structure is initially established, we examined all regions       cannot reveal enhancer/promoter looping. Next, to distinguish
of chromosomal interaction/structure (measured by positive insu-        from maternally deposited mRNAs from actively transcribed
lation score) and determined the proportion of those regions that       mRNAs (and enhancer-derived RNAs [eRNAs]) from the zygotic ge-
contain enhancers. First, we captured and stratified regions with       nome, we analyzed published zebrafish embryo Click-iT-seq
positive insulation signal at 5.3 hpf genome-wide and determined        (Chan et al. 2019), which revealed that in SE and Group 3 their
the number of enhancer types within each positive insulation re-        clear regional coincidence of Pol II and active transcription (Fig.
gion. Enhancers constituted the majority of regions above the           3C). Taken together, regions that combine high levels of histone
threshold positive insulation score 0.1, and the regions with the       H3K27ac and H3K4me1, together with open chromatin (at tran-
highest positive insulation scores consisted mainly of Group 3          scription factor binding sites) and active transcription, display in-
or SE enhancers (Fig. 3D). Only a small proportion of the enhanc-       creased chromatin interactions and define an early chromatin
ers that display structure during ZGA are retained at 24 hpf, sug-      architecture specific to the developing embryo.
gesting that only a portion of the enhancer repertoire used at                We have shown that loss of transcription at boundaries had
ZGA is similarly used at 24 hpf (Supplemental Fig. S5B). Taken to-      only minor effects on TAD-scale chromatin architecture. To test
gether, enhancers constitute the primary regions of the genome          whether these small contact domains at putative enhancers relies

                                                                                                                 Genome Research           5
                                                                                                                   www.genome.org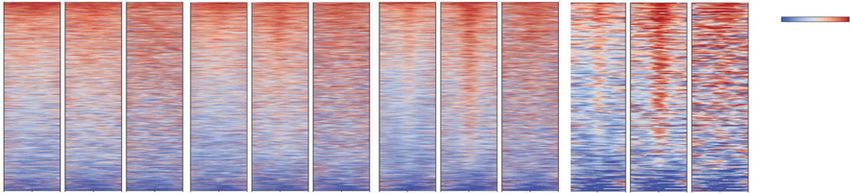
Downloaded from genome.cshlp.org on July 3, 2021 - Published by Cold Spring Harbor Laboratory Press

Wike et al.

                         A

                         B

                 C
                                                                           Rad21-cohesin                                    Click-iT-seq

                                                                                       E
                     D

Figure 3. Characterization of chromatin architecture established at enhancers and super-enhancers at 4 hpf. (A) Super-enhancer (SE) plot using the ROSE
algorithm, which ranks enhancers based on histone H3K27ac (Zhang et al. 2018) and H3K4me1 (Bogdanovic et al. 2012). ChIP-seq data at 4 hpf in zebra-
fish embryos. Data are separated into four groups: Group 1 (purple), Group 2 (red), Group 3 (blue), and SE group (green). N = total number in each par-
tition. (B) Heatmaps of insulation score at enhancers. Insulation maps at 4, 5.3, and 24 hpf ranked by insulation strength at 4 hpf, centered on enhancers
from each respective group in Figure 4A. Positive insulation (red) indicates increased contacts, and negative insulation (blue) indicates a lack of contacts. (C)
Comparisons of chromatin factor and attribute occupancy at enhancers. Metaplot of log2 fold enrichment of histone H3K27ac ChIP-seq (Zhang et al.
2018), RNA Pol II ChIP-seq, Rad21-cohesin ChIP-seq, ATAC-seq, and Click-iT-seq (Chan et al. 2019) signal over input are plotted, centered on enhancers
from each respective group in Figure 4A: super-enhancers (Super Enh, green), Group 3 (blue), Group 2 (red), and Group 1 (purple). (D) Proportional dis-
tribution of different enhancer regions; no enhancer (No Enh, yellow), super-enhancers (SE, green) Group 3 (Grp3, blue), Group 2 (Grp2, red), and Group 1
(Grp1, purple) detected with positive insulation score 0.1–0.2, 0.2–0.3, >0.3. The proportional distribution of each positive insulation score detected over
the entire genome is depicted on the right; 0–0.1 (63%), 0.1–0.2 (27%), 0.2–0.3 (8%), >0.3 (1%). The bracket highlights the positive insulation score used
in the bar graph on the left. (E) Groups from A overlap with ATAC-seq peak signal across enhancers regions were analyzed using HOMER Motif Analysis to
determine potential TF binding. Similarity to known binding motifs is indicated by Pearson R values in shaded red, and motif frequency is indicated by circle
size. T-box transcription protein family of motifs (TBX Fam), Kruppel-like factor protein family of motifs (KLF FAM), SRY-box transcription factor protein
family of motifs (SOX).

on Pol II activity, we analyzed our Hi-C contact maps of Pol II-in-                lowing Pol II inhibition, confirming that chromatin architecture,
hibited samples (the aforementioned FLAV treatment) for chroma-                    boundary, and the small contact domain establishment is also
tin insulation score, centered on enhancer regions (Fig. 4A). Again,               largely independent of Pol II transcription (Hug et al. 2017; Ke
we observed little to no impact on chromatin insulation score fol-                 et al. 2017).

6    Genome Research
        www.genome.org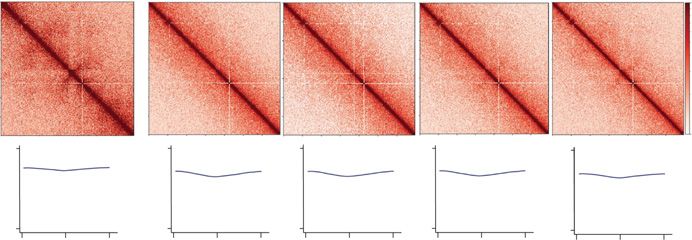
Downloaded from genome.cshlp.org on July 3, 2021 - Published by Cold Spring Harbor Laboratory Press

                                                                                                 3D chromatin of zebrafish sperm and embryos

                A                                           B                                                 with either vehicle (DMSO) or SGC-
                                                                                                              CBP30 (SGC), a bromodomain inhibitor
                                                                                                              of histone acetyltransferase Ep300a
                                                                                                              (EP300 human ortholog) and Crebbp
                                                                                                              (CREBBP [also known as CBP] human
                                                                                                              ortholog) starting at the one-cell stage
                                                                                                              and continuing through ZGA. The 4 hpf
                                                                                                              treated embryos were collected for analy-
                                                                                                              sis by in situ Hi-C (Fig. 4A; Supplemental
                                                                                                              Fig. S3B; Supplemental Table S1). We ver-
                                                                                                              ified inhibition of Crebbp/Ep300a activi-
                                                                                                              ty by the approximately twofold bulk
                                                                                                              reduction of histone H3K27ac by quanti-
                                                                                                              tating loss of H3K27ac on a western blot
                                                                                                              analysis (Supplemental Fig. S6A). We fur-
                                                                                                              ther verified a strong (four- to sixfold) fo-
                                                                                                              cal reduction of histone H3K27ac at
                                                                                                              several SE regions, as assessed by ChIP-
                                                                                  Click-iT-seq
                                                                                                              qPCR (Supplemental Fig. S6B), compared
                                                                                                              to the vehicle control. Upon treatment
   C                                                                                                          with SGC, we observed a loss of chroma-
                                                                                                              tin interactions (reduction of insulation
                                                                                                              score) across the putative SE and Group
                                                                                                              3 enhancers compared to the vehicle con-
                                                                                                              trol, whereas there was little impact on
                                                                                                              Group 1 and Group 2 insulation (Fig.
                                                                                                              4A). To examine the relationship be-
                                                                                                              tween enhancers and adjacent boundar-
                                                                                                              ies, we assessed the strength of the
                                                                                                              nearest boundaries for each enhancer at
                                                                                                              4 hpf upon SGC treatment; we observed
                                                                                                              little change in the negative insulation
                                                                                                              score compared to the vehicle control
                                                                                                              (Supplemental Fig. S6C). Additionally,
Figure 4. Inhibition of Crebbp/Ep300a causes loss of chromatin architecture around the established            by reanalyzing published Click-iT-seq
super-enhancers at 4 hpf. (A) Heatmaps of insulation score for drug-treated embryos. Treatments involve       data, upon SGC treatment the SE and
DMSO (vehicle), flavopiridol (FLAV), SGC-CP30 (SGC) for 4 h (which causes a developmental arrest for
FLAV and SGC). Respective enhancer groups are ranked as in Figure 3B. Positive insulation (red) indicates
                                                                                                              Group 3 regions displayed a loss of tran-
increased contacts, and negative insulation (blue) indicates a lack of contacts. (B) Click-iT-seq of 4 hpf    scription compared to control samples
untreated (UNT) and SGC-CP30 (SGC, purple) (Chan et al. 2019) heatmaps centered on enhancers of               (Fig. 4B). Together these data suggest
each respective enhancer group ranked as in Figure 4A. (C) Model depicting the features present at re-        that Crebbp/Ep300a activity and subse-
gions displaying structure/positive interaction. Features displayed include enhancers (red), elevated his-
                                                                                                              quent histone H3K27ac are necessary
tone H3K27ac (purple), active transcription (green circle), defined boundaries (cyan), and increased
chromatin interactions as detected by positive interaction scores in Hi-C contact maps at both 4 and          for proper early embryo chromatin inter-
5.3 hpf. Regions with increased interactions are typically coated with histone H3K27ac. These interac-        actions at putative strong enhancers;
tions and boundaries persist upon inhibition of RNA Pol II initiation at 4 hpf. In contrast, these contacts   however, diminishing H3K27ac does
between boundaries are lost upon inhibition of Crebbp/Ep300a (lowering histone H3K27ac [dashed])              not affect the establishment of nearby
leading to decreased transcription and loss of higher-order chromatin structure; however, boundaries re-
main stable.                                                                                                  boundaries (see Discussion, and Fig. 4C).

                                                                                                              Zebrafish sperm chromatin architecture
Crebbp/Ep300a activity helps establish chromatin interactions at                                              has a unique configuration
enhancers                                                                        Lastly, we explored the unique structures observed in the zebrafish
Because active Pol II transcription itself is not required for the for-          sperm Hi-C contact maps. We compared our sperm and 24 hpf
mation of chromatin architecture, we asked instead whether tran-                 contact maps, because prior work in mice and rhesus monkey re-
scription-independent histone post-translational modifications                   ported strong similarities between somatic cells and sperm cells
placed on enhancers might help establish chromatin architecture                  (Battulin et al. 2015; Jung et al. 2017; Wang et al. 2019). First, ge-
in the early embryo. Prior work in cell culture has shown that re-               nome A/B compartment calls (and their boundaries) between
gions with high histone H3K27ac are able to form small contact do-               sperm and 24 hpf were largely nonoverlapping (Fig. 5A). The
mains, which are established faster and often independent of                     sperm contacts display a peak distance of interaction >1 Mb
CTCF/cohesin co-occupying sites (Rao et al. 2017; Zhang et al.                   (Supplemental Fig. S7A), which in somatic cells has been interpret-
2019). Therefore, we examined whether histone H3K27ac was nec-                   ed as signifying chromosome condensation (Naumova et al. 2013;
essary for the establishment of chromatin architecture at putative               Hug et al. 2017; Gibcus et al. 2018). Furthermore, whereas the 24
enhancers in the 4 hpf embryo. Zebrafish embryos were treated                    hpf Hi-C data contact maps showed traditional TADs with

                                                                                                                             Genome Research             7
                                                                                                                                www.genome.org
Downloaded from genome.cshlp.org on July 3, 2021 - Published by Cold Spring Harbor Laboratory Press

Wike et al.

        A                                            B                                                              To further characterize flares, we de-
                                                                                                             termined whether particular chromatin
                                                                                                             features were correlated with flares—in-
                                                                                                             cluding histone modifications, cohesin
                                                                                                             complex, gene density, repeat regions,
                                                                                                             and evolutionary breakpoints. Regarding
                                                                                                             cohesin, the Rad21 subunit was not
                                                                                                             detectable by western analysis in sperm
                                                                                                             (but was clearly detected at 4 and 24
                                                                                                             hpf), but the Smc3 subunit was detect-
                                                                                                             able (Supplemental Fig. S7B), as expected
                                                                                                             owing to the variety of spermatogenesis-
                                                                                                             specific cohesin complexes (Hopkins
                                                                                                             et al. 2014; Biswas et al. 2016). However,
                                                                                                             we observed no focal enrichment of
                                                                                                             Smc3 occupancy on sperm chromosomes
                                                                                                             by ChIP-seq analysis (Supplemental Fig.
                                                                                                             S7C). Furthermore, we found no enrich-
                                                                                                             ment of repetitive elements at flares, nor
                                                                                                             an increase in GC percent distribution
       C                                                                                                     (Supplemental Fig. S8A,B). Evolutionary
                                                                                                             breakpoints have overlap with 24 hpf
                                                                                                             boundaries (Supplemental Fig. S8C;
                                                                                                             Yang et al. 2020) but not in sperm. Tran-
                                                                                                             scription start sites (TSS) are enriched in
                                                                                                             flares, but they are not significantly used
                                                                                                             for early embryo gene expression (ZGA
                                                                                                             TSS), suggesting that flares in sperm are
                                                                                                             not pre-marking early embryonic expres-
                                                                                                             sion (Supplemental Fig. S8D,E). Last, we
                                                                                                             analyzed available genome-wide chro-
                                                                                                             matin immunoprecipitation sequencing
Figure 5. Hi-C contact maps in zebrafish sperm display “hinge-like” domains. (A) Correlation matrix
from Chr 13 (top) and Chr 24 (bottom) for zebrafish sperm (left) and 24 hpf (right). First principal com-
                                                                                                             (ChIP-seq) data, derived from sperm and
ponent values to determine A/B compartment status (below). (B) Contact matrices from two regions Chr         24 hpf samples. Histone H3K27ac (Zhang
13: 33.4–39.4 Mb (top) and Chr 24: 15.6–21.6 Mb (bottom) for sperm (left) and 24 hpf (right), 25-kb          et al. 2018) was often enriched across flare
resolution in log scale. Flares detected in sperm are marked by black arrows and are not evident in 24       regions in sperm, whereas H3K27ac was
hpf embryos. (C) Contact maps for 24 hpf and sperm samples each presented for a 6-Mb region on
                                                                                                             not enriched at these regions at 24 hpf
Chr 24 at 25-kb resolution in log scale (top). First principal component values to determine A/B compart-
ment status (middle). Heatmap of insulation scores for different window sizes (bottom). The hinge region     (Zhang et al. 2018). In contrast, histone
is marked by a purple square, and distance is marked by an orange square.                                    H3K4me3 (Zhang et al. 2016) and
                                                                                                             H3K27me3 (Irimia et al. 2012) showed lit-
                                                                                                             tle enrichment at flares (Fig. 6D). In sum-
                                                                                                             mary, only H3K27ac and TSS locations
enhanced contact frequency, sperm lacked TAD structures (Fig.                      show positive correlation with flares.
5B). Instead, sperm displayed a unique feature that resembles a                          Taken together, our analysis of mature sperm suggests that
“flare”; a feature that is perpendicular to the diagonal in the con-               chromatin folding in sperm is neither random nor similar to
tact maps (Fig. 5B,C; for additional examples, see Supplemental                    somatic patterns; it may instead involve the partitioning of the ge-
Fig. S7B). The flare feature is consistent with a large region display-            nome into “hinge-like” domains. One model consistent with our
ing increased interactions primarily between locations equidistant                 data involves these “hinge-like” regions arranging in a manner
from a fixed pivot/hinge point. This raises the possibility of period-             similar to the mitotic flower spiral structure that has been pro-
ic self-associating “hinge-like” chromosome domains occurring                      posed for mitotic chromosomes (Naumova et al. 2013; Gibcus
throughout the sperm genome (Fig. 6E).                                             et al. 2018). In adapting this model to sperm chromatin, the
      To quantify the attributes of flares, we devised a computa-                  “hinge-like” regions might form arrays of consecutive loops/pet-
tional strategy using the insulation score (Methods) to extract                    als, where point “D” represents the center of the hinge, and seg-
them, yielding a total of 333 flares across the zebrafish sperm                    ments A–C and E–G represent the edges or “hinge” petals (Fig.
genome. These flares range in size, although in aggregate generate                 6E). In this model, the flare appears on the Hi-C contact map
a unimodal peak centered at ∼150 kb (Fig. 6A). After filtering out                 because locations equidistant from position D are more often in
genome scaffolding errors, the distance between flare domains                      physical proximity.
revealed a periodicity of approximately 1 Mb, indicating chromo-
some structure at the megabase scale (Fig. 6B). These flare do-
mains are unique to sperm because the insulation score formed
                                                                                   Discussion
across each flare location was not observed at 4, 5.3, or 24 hpf                   The process of ZGA involves the proper activation of many house-
(Fig. 6C).                                                                         keeping genes and the proper regulation (activation or silencing)

8    Genome Research
        www.genome.org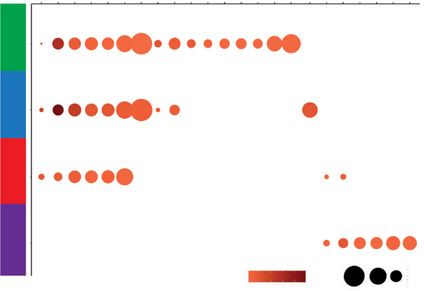
Downloaded from genome.cshlp.org on July 3, 2021 - Published by Cold Spring Harbor Laboratory Press
3D chromatin of zebrafish sperm and embryos
A C is characterized by rapid replication and
about 10 synchronous cell division cy-
cles that average ∼15 min. The major
wave of ZGA occurs at ∼3–4 hpf, as cell
cycles begin to lengthen and lose their
synchrony (Lee et al. 2013). Thus, the
process of ZGA co-occurs with rapid rep-
lication and cell division, processes
B which might impose physical and/or ki-
netic barriers to the establishment of par-
ticular chromatin architectural elements.
In this study, we explored the similarities
and major differences with prior studies
of higher-order chromatin architecture
in the zebrafish embryo, provided new
information on enhancer interactions,
D and revealed unique architectural fea-
tures in the zebrafish sperm that advance
our understanding of the logic and use of
chromosome architecture in zebrafish
gametes and embryos.
First, we do not observe higher-order
structure elements, such as A/B compart-
ments or TADs, in pre-ZGA and ZGA em-
bryos (Fig. 1B,C). Our work here, coupled
to collaborative work (Nakamura et al.
E
2021), suggests that the prior observation
of structure may have been caused by
contamination. We hypothesize that
the somatic cell contamination involves
maternal oocyte follicle cells that
surround the chorion during oocyte mat-
uration (although other sources of con-
tamination are not ruled out, such as
adult fin tissue). We speculate that the
use of a late dechorionation step leads to
these somatic cells being released from
the outer chorion surface and subsequent
Figure 6. Global characterization of “hinge-like” domains in sperm chromatin architecture. (A)
Histogram to depict the width distribution of the 333 hinges. (B) Histogram to depict the average dis- association with the embryo. The report-
tances between adjacent hinges. (C) Insulation scores at hinge-like domains in sperm, and insulation ed structure during pre-ZGA was dimin-
scores at the corresponding regions in embryos at 4, 5.3, and 24 hpf. Positive insulation (red) indicates ished by ZGA, which may be explained
increased contacts, and negative insulation (blue) indicates a lack of contacts. (D) Metaplot of log2 fold by dilution of maternally derived cells
enrichment of histone H3K27ac (Zhang et al. 2018), H3K27me3 (Irimia et al. 2012), and H3K4me3
(Zhang et al. 2016) ChIP-seq signal over input for sperm (green) and 24 hpf (blue) centered on the compared to embryo-derived cells during
hinge-like domains. (E) Two schematics depict two speculative models of zebrafish sperm chromatin subsequent rapid embryonic cell cycles.
and hinge architecture. In both models, the sperm DNA (which is nucleosome-packaged, not prot- We also ruled out an alternative hypoth-
amine-packaged) is arranged into arrays of consecutive loops/petals, possibly similar to the loops de- esis that the observed structure pre-ZGA
scribed for condensed mitotic chromosomes in somatic cells (Gibcus et al. 2018). Within each petal
DNA positions A–G represent the repeated “hinge” unit within each petal, with “D” representing the derived from contaminating sperm cells
hinge center, and the segments A–C and E–G representing the edges of the hinge “petals.” A key feature by demonstrating that sperm cells lack
of the contact map data is that locations equidistant from position D show increased interaction. Two the observed pre-ZGA structures (Figs.
models are presented to achieve this: (1) interactions are caused by contacts within each petal (left), or 1B, 2D).
(2) interactions are caused by contacts between two petals (right). In both models, we propose a con-
straint on topology, which might involve the loading of ring-like proteins (e.g., condensin or cohesin
Our work instead supports a model
complexes) at the hinge position D (left) which, together with the fixed hinge position D, create the through which the process of rapid repli-
hinge-like domain through loop extrusion. Ring-like proteins are represented by orange rings. Arrows cation and cell division in the early
on the left indicate potential locations where ring-like proteins might load, at hinge position D, to help zebrafish embryo may be incompatible
form stable hinges.
with the formation and utilization of
higher-order chromatin structure; there-
of many developmental genes. The initial transcription at ZGA fore, higher-order structural elements only emerge gradually, after
could (hypothetically) benefit from the utilization of chromatin ZGA. Additionally, the lack of structure before ZGA has been ob-
architectural elements such as A/B compartments, TADs, and en- served previously in Drosophila, another species with fast cycling
hancer–promoter loops, and these elements in the embryo could cells during early embryogenesis (Hug et al. 2017). In mammals,
(in principle) derive from states inherited from the parental gam- chromatin architecture in early embryos is limited to focal regions
etes. However, zebrafish ZGA occurs during cleavage stage, which and is not fully established genome-wide until after ZGA (Du et al.
Genome Research 9
www.genome.org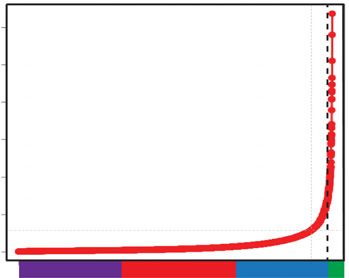
Downloaded from genome.cshlp.org on July 3, 2021 - Published by Cold Spring Harbor Laboratory Press

Wike et al.

2017; Hug et al. 2017). These results in embryos are consistent with     some are much more likely to be in contact with each other than
observations in cultured mammalian cells, which showed that the          with any other region between them, including the fixed point.
reestablishment of higher-order chromatin structures after mitosis       This fixed point is located at the center of the flare and might func-
occurs on the “hours” timescale (Abramo et al. 2019; Zhang et al.        tion physically as a hinge, with the flanking chromosomal regions
2019). However, a subset of boundaries, as well as the formation of      folded over one another. The fixed point D represents the center of
smaller domains (involving enhancers with high H3K27ac), form            the hinge, and segments A–C and E–G represent the edges or petals
relatively quickly after mitosis (Zhang et al. 2019). Following cohe-    (Fig. 6E). We hypothesize that these hinge-like domains are
sin loss, although TADs largely disappear, regions with high his-        formed to facilitate the compaction of the histone-bound DNA
tone H3K27ac such as super-enhancers, retain and even increase           into the sperm head.
their associations, which may involve both inter- and intra-en-                Additional topological constraints are needed to favor equi-
hancer interactions (Rao et al. 2017; Rosencrance et al. 2020).          distant interactions, and we propose two speculative models to
However, in normal cycling cells, these sub-TAD size interactions        achieve this: an “intra-loop model” favors interactions between re-
have been shown to have Med12/cohesin (lacking CTCF) (Phil-              gions equidistant from point D, although solely within the loop
lips-Cremins et al. 2013). These observations in cultured mamma-         (Fig. 6E, left), whereas an “inter-loop model” also favors interac-
lian cells may relate to our observations of initial small interacting   tions between regions equidistant from point D, but involves adja-
domains forming in the cycling zebrafish embryo at regions bear-         cent loops (Fig. 6E, right), possibly arranged on a central scaffold.
ing high H3K27ac and cohesin, most prominently at candidate              Furthermore, both models can accommodate a role for two-sided
zebrafish super-enhancers (Fig. 3B). We propose that higher-order,       loop extrusion using cohesin to constrain the structured loop
3D structure (beyond small contact domains) does not form in the         (Fudenberg et al. 2017; Banigan et al. 2020). Two-sided loop extru-
zebrafish embryo until after ZGA, likely owing to the restrictions       sion would create and stabilize the hinge-like domain with equi-
imposed by the fast cell cycle of the pre-ZGA embryo. Additionally,      distant interactions, which may be established or maintained
cohesin/Rad21 is absent from genes pre-ZGA and is redistributed          through the loading of cohesin from the hinge fixed point D
from heterochromatic regions to genes post-ZGA. Further support-         (Banigan et al. 2020). We note that the different topological con-
ing our observation of a lack of structure pre-ZGA (Meier et al.         straints needed to form hinge-like domains could (in principle)
2018). Following, ZGA, chromatin architecture begins at enhancer         be facilitated by any one of the five different cohesin complexes,
regions bearing high H3K27ac, largely independent of transcrip-          formed by the exchange of the individual subunits within the
tion, including candidate super-enhancers—possibly to facilitate         cohesin complex, during spermatogenesis (Hopkins et al. 2014;
the subsequent formation of enhancer–promoter loops during               Biswas et al. 2016). Zebrafish sperm chromatin architecture could
the upcoming stages of development (Fig. 3B). Finally, we note           also use mitotic-/meiotic-specific proteins, such as condensins
that prior observations of TAD structure in mammalian cleavage-          (Gibcus et al. 2018), to create the “hinge-like” regions. Any of these
stage embryos is not in conflict with our observations in zebrafish,     structural proteins could create a mitotic flower spiral structure
because mammalian embryos have much longer cell cycles during            similar to that proposed for the condensed mitotic chromosome
cleavage stage (12–24 h) than do zebrafish (∼15 min) (Ke et al.          (Naumova et al. 2013; Gibcus et al. 2018). Additionally, we specu-
2017; Collombet et al. 2020). This reflects the very different fates     late that the inability to detect flares in traditional Hi-C contact
of (and threats to) these two types of embryos: mammalian embry-         maps of mitotic cells may result from an averaging of signal be-
os slowly progress to implantation, whereas fish embryos must            tween two sister chromatids, and potentially that mitotic cells
rapidly progress to free-swimming fish to avoid predation.               may have a higher degree of condensation than does zebrafish
      We provide the first Hi-C analysis of sperm in a vertebrate that   sperm. Future work examining the possible roles of candidate fac-
packages its genome entirely in histone rather than primarily small      tors in flare formation in sperm will help clarify the structural basis
basic proteins such as protamine. Indeed, zebrafish lack a gene en-      for flares in sperm and test the “hinge model” of genome packag-
coding protamine or protamine-like proteins and instead use typ-         ing for the histone-packaged zebrafish sperm genome.
ical somatic histones along with a high level of H1-family linker
histone (as well as the H2A variants H2A.Z/FV and H2A.FX) as
the most prominent proteins for packaging the genome in a con-           Methods
densed manner (Wu et al. 2011; Murphy et al. 2018). Our work             Experimental models and subject details
suggests a lack of TAD structures (Figs. 1B, 5B,C; Supplemental
Fig. S1C,D), but the presence of apparent A/B compartments in            Zebrafish embryo culture
sperm (Figs. 1C, 5A). We emphasize that mature sperm have ceased
                                                                         Zebrafish Danio rerio strains were maintained under accordance
transcription, and therefore the traditional notion that A/B com-
                                                                         with approved institutional protocols at the University of Utah
partments define an active or inactive genome does not apply to
                                                                         (Westerfield 2000). All experiments using zebrafish were approved
the sperm compartments but instead reflects the underlying prin-
                                                                         by IACUC Protocol 17-01006 and 20-04011. Wild-type zebrafish
cipal component analysis (PCA) used to define them. The PCA
                                                                         were from the Tübingen (Tü) strain, and Wik strain.
method strictly segregates two types of genomic regions that alter-
                                                                         Experimental samples were either mature gametes (sperm) or early
nate along the length of chromosomes, which in sperm is largely
                                                                         zebrafish embryos ranged from 0 to 24 hpf. Live embryos were
defined as regions within or outside of a “flare.” Flares are the
                                                                         maintained at 28.5°C. All developmental staging was based on
sole visual feature that we observe in the contact maps from sperm
                                                                         hours after post-fertilization and visual confirmation of timing.
(Figs. 1B, 5B), which appear perpendicular to the diagonal in the
contact maps. Notably, we found enrichment of H3K27ac in flares,
however functional experiments will be required to test whether          Drosophila S2 cells
H3K27ac is necessary for flare formation. We suggest that these          Schneider S2 cells derived from D. melanogaster were cultured in
flares represent physical “hinge-like” domains. Flares/hinges occur      Gibco Schneider’s Drosophila medium (Thermo Fisher Scientific
when two regions equidistant from a “fixed point” on the chromo-         21720024) supplemented with 10% FBS (Omega Scientific

10    Genome Research
         www.genome.org
Downloaded from genome.cshlp.org on July 3, 2021 - Published by Cold Spring Harbor Laboratory Press
3D chromatin of zebrafish sperm and embryos
FB-11) and penicillin/streptomycin. Cells were grown at room Isolating Drosophila S2 cells
temperature and split as the dish became confluent. Aliquots of cells were thawed on ice and recounted to verify accu-
rate spike-in amount. No more than 5 million cells were lysed at
Method details one time using 500 µL Hi-C lysis buffer on ice. Once the S2 cells
were resuspended in lysis buffer, they were added to the zebrafish
Isolating zebrafish cells from embryo and sperm for Hi-C protocol cells undergoing lysis at the same time. See Supplemental Table S1
Early dechorionated pre-ZGA samples for all replicates where S2 cells were included.
Pre-ZGA samples were dechorionated with pronase (Sigma-
Low-cell in situ Hi-C after cell lysis
Aldrich, working concentration 10 mg/mL) at one-cell stage
shortly after mating. For full details, see Supplemental Methods. Following nuclei isolation, the standard operating practices of the
4DN in situ Hi-C protocol was followed (Rao et al. 2014) adjusting
buffers/enzymes based on the protocol for low-cell in situ Hi-C
Late dechorionated pre-ZGA, 4, 5.3, and 24 hpf samples
(Díaz et al. 2018). For details on the Hi-C protocol and library pro-
Embryos at pre-ZGA, 4, 5.3, and 24 hpf were dechorionated with duction, see Supplemental Methods.
pronase at the time of collection as described above. After the 4–
5 washes, the embryos were transferred carefully to a 1.5 mL ChIP-seq protocol
eppendorf tube with a transfer pipette to not disrupt the embryos.
The embryos were then deyolked because the yolk proteins inter- ChIP experiments were carried out as described previously (Goren
fere with digestion steps later in the Hi-C protocol. See et al. 2010), modified for cell isolation from the zebrafish sperm or
Supplemental Methods for more details. embryos. For full details, see Supplemental Methods.
ATAC-seq protocol
Collection and fixation of sperm samples
The original protocol (Buenrostro et al. 2015) was modified for
Sperm samples were collected with standard methods as previous-
zebrafish nuclei collection. For full details, see Supplemental
ly described (Kroeger et al. 2014) and fixed in 1% formaldehyde for
Methods.
10 min at room temperature and stopped with 0.2 M glycine.
Sperm cells were washed in 1× PBS and snap frozen with liquid ni-
trogen and stored at −80°C. Immunohistochemistry and DAPI staining early zebrafish embryos
Standard protocol for immunohistochemistry was followed
Fixing S2 cells for Hi-C protocol (Zhang et al. 2018). For full details, see Supplemental Methods.
For spike-in preparation, standard fixation methods were used. See
Imaging zebrafish embryos
Supplemental Methods for more details.
Confocal images were acquired on a Leica SP8 White Light laser
confocal. Image processing was completed using Nikon NIS-
Embryo inhibitor treatment
Elements multiplatform acquisition software with a 40 ×/1.10
Flavopiridol (Selleck Chemicals, final 1.5 µM) and SGC-CBP30 Water objective. Fiji (ImageJ, V 2.0.0-rc-69/1.52p) was used to col-
(Sigma-Aldrich, final 20 µg/µL) were prepared in DMSO. or DAPI channel to cyan, GFP color remained green. Confocal im-
Embryos were incubated at indicated concentrations in E3 embryo ages are max projections of Z stacks taken 0.5 μm apart for a total of
water (Westerfield 2000) for 4 h at 28.5°C. Controls were incubated the embryo ∼7–12 μm. See Supplemental Methods for the descrip-
in (1%) DMSO, in E3 (vehicle). tion for DAPI staining and cell cycle staging for the 2.25 hpf Hi-C
embryo samples.
Hi-C protocol
Quantifications and statistical analyses
Isolating zebrafish embryo nuclei
Aliquots of enough cells at each time point were pulled out of the Hi-C data processing
freezer; 2.25 hpf (10,000 to 100,000 cells), 4 hpf (500,000 cells), 5.3 Reads were aligned to a merged Zv10 (chromosomes were labeled
hpf (400 embryos, ∼1 million cells), and 24 hpf (40 embryos, ∼1 1–25) and dm6 (chromosomes were labeled 2L, 2R, 3L, 3R, 4D,
million cells). Cells were thawed on ice and recounted to verify ac- XD, YD) genome using BWA-MEM (V 0.7.15-r1140, http://bio-
curate spike-in amount. Zebrafish cells were washed one time with bwa.sourceforge.net/bwa.shtml) using the following options
Hi-C lysis buffer (10 mM Tris-Cl, pH 8.0, 10 mM NaCl, 0.2% -A 1 -B 4 -E 50 -L 0. HiCExplorer (V3.3, https://hicexplorer
IGEPAL CA-630) followed by a 15-min lysis incubation on ice. .readthedocs.io/en/latest/) hicBuildMatrix was used to create ma-
During the lysis step, the Drosophila S2 cells were added to each trix at 10, 25, and 50 kb resolutions, using the option –outBam
sample to equal 1/5 of the zebrafish cell count. (to extract valid Hi-C reads). For full details of Hi-C data processing,
see Supplemental Methods.
Isolating zebrafish sperm nuclei
An aliquot of cells was thawed on ice and recounted to verify accu- Flare/hinge calling
rate spike-in amount. Approximately 4 million cells were used per Flare/hinge regions in sperm Hi-C data were found by extracting
sample. Cells were washed one time with Hi-C lysis buffer followed the positive values from the last column of the bedGraph matrix
by a 15-min lysis incubation on ice. During the lysis step, the in the “tad_score.bm” file from hicFindTADs command
Drosophila S2 cells were added to each sample to equal one-fifth HiCExplorer (V3.3). Flares/hinges were merged if within 50 kb of
of the zebrafish cell count. each other, and the first round of filtering was done to remove
Genome Research 11
www.genome.orgYou can also read