Resolving temperature limitation on spring productivity in an evergreen conifer forest using a model-data fusion framework
←
→
Page content transcription
If your browser does not render page correctly, please read the page content below

Research article
Biogeosciences, 19, 541–558, 2022
https://doi.org/10.5194/bg-19-541-2022
© Author(s) 2022. This work is distributed under
the Creative Commons Attribution 4.0 License.

Resolving temperature limitation on spring productivity in an
evergreen conifer forest using a model–data fusion framework
Stephanie G. Stettz1 , Nicholas C. Parazoo2 , A. Anthony Bloom2 , Peter D. Blanken3 , David R. Bowling4 ,
Sean P. Burns3,5 , Cédric Bacour6 , Fabienne Maignan7 , Brett Raczka5 , Alexander J. Norton2 , Ian Baker8 ,
Mathew Williams9,10 , Mingjie Shi11 , Yongguang Zhang12 , and Bo Qiu12
1 Department   of Earth System Science, University of California Irvine, Irvine, California, USA
2 Jet Propulsion Laboratory, California Institute of Technology, Pasadena, California, USA
3 Department of Geography, University of Colorado Boulder, Boulder, Colorado, USA
4 School of Biological Sciences, University of Utah, Salt Lake City, Utah, USA
5 National Center for Atmospheric Research, Boulder, Colorado, USA
6 NOVELTIS, Labège, France
7 Laboratoire des Sciences du Climat et de l’Environnement, LSCE-IPSL, CEA-CNRS-UVSQ,

Université Paris-Saclay, Gif-sur-Yvette, France
8 Cooperative Institute for Research in the Atmosphere, Colorado State University, Fort Collins, Colorado, USA
9 School of GeoSciences, University of Edinburgh, Edinburgh, UK
10 National Centre for Earth Observation, Edinburgh, UK
11 Pacific Northwest National Laboratory, 902 Battelle Blvd, Richland, Washington, USA
12 International Institute for Earth System Sciences, Nanjing University, Nanjing, Jiangsu Province, China

Correspondence: Stephanie G. Stettz (sstettz@uci.edu)

Received: 12 June 2021 – Discussion started: 17 June 2021
Revised: 24 November 2021 – Accepted: 10 December 2021 – Published: 28 January 2022

Abstract. The flow of carbon through terrestrial ecosystems     ulate photosynthetic productivity. We found that GPP was
and the response to climate are critical but highly uncer-      gradually inhibited at temperatures below 6.0 ◦ C (±2.6 ◦ C)
tain processes in the global carbon cycle. However, with a      and completely inhibited below −7.1 ◦ C (±1.1 ◦ C). The ad-
rapidly expanding array of in situ and satellite data, there    dition of this scaling factor improved the model’s ability to
is an opportunity to improve our mechanistic understand-        replicate spring GPP at interannual and decadal timescales
ing of the carbon (C) cycle’s response to land use and cli-     (r = 0.88), relative to the nominal CARDAMOM configura-
mate change. Uncertainty in temperature limitation on pro-      tion (r = 0.47), and improved spring GPP model predictabil-
ductivity poses a significant challenge to predicting the re-   ity outside of the data assimilation training period (r = 0.88).
sponse of ecosystem carbon fluxes to a changing climate.        While cold-temperature limitation has an important influence
Here we diagnose and quantitatively resolve environmen-         on spring GPP, it does not have a significant impact on in-
tal limitations on the growing-season onset of gross primary    tegrated growing-season GPP, revealing that other environ-
production (GPP) using nearly 2 decades of meteorological       mental controls, such as precipitation, play a more important
and C flux data (2000–2018) at a subalpine evergreen forest     role in annual productivity. This study highlights growing-
in Colorado, USA. We implement the CARbon DAta-MOdel            season onset temperature as a key limiting factor for spring
fraMework (CARDAMOM) model–data fusion network to               growth in winter-dormant evergreen forests, which is critical
resolve the temperature sensitivity of spring GPP. To capture   in understanding future responses to climate change.
a GPP temperature limitation – a critical component of the
integrated sensitivity of GPP to temperature – we introduced
a cold-temperature scaling function in CARDAMOM to reg-

Published by Copernicus Publications on behalf of the European Geosciences Union.

542                                S. G. Stettz et al.: Temperature limitation on spring productivity in an evergreen forest

1   Introduction                                                  model parameters to statistically reduce mismatches between
                                                                  observations and model predictions (Raupach et al., 2005;
Northern Hemisphere evergreen forests contribute signifi-         Wang et al., 2009; Keenan et al., 2012). MDF methods can
cantly to terrestrial carbon (C) storage and exchange (Beer       be used to statistically represent the terrestrial C balance by
et al., 2010; Thurner et al., 2014). High-latitude and high-      generating optimized state and process variable parameteri-
elevation evergreen forests show increasing gross primary         zations, with uncertainties, which best match the signal and
productivity (GPP) with increasing temperature driven in          noise in observations (Bloom et al., 2020).
large part by earlier growing seasons (Myneni et al., 1997;          Models of varying complexity and assimilation capabil-
Randerson et al., 1999; Forkel et al., 2016; Winchell et al.,     ities have been used to study how C exchange varies with
2016; Lin et al., 2017). However, the response of gross and       temperature in subalpine evergreen ecosystems (e.g., Moore
net C fluxes to warming remains uncertain, especially in          et al., 2008; Scott-Denton et al., 2013; Knowles et al., 2018).
subalpine temperate forests, which can experience freezing        Moore et al. (2008) used a simplified ecosystem function
temperatures while still absorbing large amounts of sunlight;     model and assimilated C flux data from the Niwot Ridge
both these factors ultimately influence the timing and mag-       (US-NR1) subalpine evergreen forest AmeriFlux tower in
nitude of GPP (Bowling et al., 2018). In particular, warmer       Colorado to show the importance of accurate meteorolog-
springs can also lead to earlier snowmelt, which can re-          ical forcing for parameter optimization and the usefulness
duce spring C uptake through increased surface exposure           of assimilating C flux data for determining connections be-
to colder ablation-period air temperatures (Winchell et al.,      tween the C and water cycles. Scott-Denton et al. (2013) in-
2016) and can reduce summer C uptake via drought (Hu et           tegrated meteorological and flux data from 1999–2008 from
al., 2010). Many subalpine forests in western North Amer-         the same site with an ensemble of more sophisticated Earth
ica are also highly water limited, with warming and ear-          system models (ESMs) and showed higher rates of C uptake
lier snowmelt creating accumulated water deficits, increased      by the end of the 21st century, associated with warming and
drought stress and growing-season C uptake losses (Wolf et        lengthening growing seasons, and driven by greater increases
al., 2016; Sippel et al., 2017; Buermann et al., 2018; Goulden    in spring GPP relative to late-season respiration.
and Bales, 2019); these factors ultimately make subalpine            Interestingly, model and empirical studies of the C flux re-
forest ecosystems sensitive to the direct and indirect effects    sponse to climate at US-NR1 focus on the 2000–2011 pe-
of climate change and other disturbances, including the ef-       riod, which saw increasing summer drought coupled with
fects of droughts, fires and insect infestations (Keenan et       sustained declines in spring temperature and GPP. US-NR1
al., 2014; Frank et al., 2014; Knowles et al., 2015). The un-     has since experienced a gradual recovery of spring GPP with
certainty in the temperature sensitivity of springtime GPP,       increased spring warming throughout 2011–2018 (Fig. 1),
increasing vulnerability to disturbance and GPP modeling          which begs the following questions: what is the temperature
challenges (Anav et al., 2015) create urgency to improve our      sensitivity of spring GPP over multiple decades of spring
ability to observe and model these ecosystems to understand       cooling and warming at US-NR1, and how well can data-
how C exchange will be altered in a warming climate.              constrained models reproduce long-term variability? To an-
   Fortunately, availability of long-term ecosystem obser-        swer these questions, we combine a mechanistic ecosystem
vations is improving. The expansion of international flux         C model (Data Assimilation Linked Ecosystem Carbon, or
tower networks over the last 3 decades (e.g., AmeriFlux,          DALEC2; Williams et al., 2005; Bloom et al., 2016) with the
FLUXNET, ChinaFLUX, ICOS) has greatly improved C flux             CARbon DAta-MOdel fraMework (CARDAMOM; Bloom
sampling across global ecosystems at a 1 km scale (Baldoc-        and Williams, 2015; Bloom et al., 2020) driven by observed
chi, 2008; Baldocchi et al., 2018), and the number of space-      meteorological forcing and constrained against eddy covari-
borne sensors continues to grow, allowing global estimation       ance fluxes at US-NR1 to investigate the temperature sensi-
of gross primary production (GPP) and net ecosystem C ex-         tivity of this subalpine evergreen forest at seasonal and inter-
change (NEE) over the last decade (e.g., Stavros et al., 2017;    annual timescales. We introduce a new cold-temperature lim-
Sun et al., 2017; Schimel et al., 2019). While uncertainties      itation function, trained on observed temperature, for more
in estimating C fluxes from in situ and satellite data remain a   realistic simulation of spring GPP onset. The use of high-
challenge, the expanding observational record offers a great      quality and long-term (2000–2018) meteorology and parti-
opportunity to study the temperature sensitivity of subalpine     tioned GPP data at US-NR1 to drive and constrain the model
forests at multiple temporal scales.                              enables robust statistical analysis of interannual variabil-
   The range of modeling tools available to quantify and          ity (IAV) and assessment of “model predictability” through
study major C pools under ever-growing observational con-         training and validation against subsets of data. We also lever-
straints is also increasing. Process-based models, in gen-        age a recent model intercomparison study (Parazoo et al.,
eral terms, use explicit mathematical relationships to mech-      2020), driven by site level meteorological data at US-NR1, to
anistically describe biophysical processes (Korzukhin et al.,     provide a model benchmark assessment and extract any com-
2011; Huxman et al., 2003; Keenan et al., 2012). In contrast,     mon environmental controls on modeled GPP. Finally, we
model–data fusion (MDF) is a relatively new tool that alters      examine whether using a decade of flux-tower-derived GPP

Biogeosciences, 19, 541–558, 2022                                                     https://doi.org/10.5194/bg-19-541-2022
S. G. Stettz et al.: Temperature limitation on spring productivity in an evergreen forest                                     543

observations to train the model is sufficient to match and pre-   ical observations to constrain carbon fluxes, states and pro-
dict seasonal to annual patterns in GPP. Given the complexity     cess controls represented in the DALEC2 model of terrestrial
of carbon–water cycle interactions during the growing (sum-       C cycling (Williams et al., 2005; Bloom and Williams, 2015).
mer) season in this highly water limited ecosystem, as well as    Specifically, CARDAMOM uses a Bayesian model–data fu-
the relatively weak correlation between tower-derived spring      sion approach to optimize DALEC2 time-invariant param-
and summer GPP (r = −0.31; p = 0.20), we focus on spring          eters (such as leaf traits, allocation and turnover times) and
GPP–temperature interactions, with the aim to resolve just        the “initial” C and H2 O conditions (namely biomass, soil and
one piece of the larger, complex problem of understanding         water states at the start of the model simulation period).
changes in C uptake in a subalpine evergreen ecosystem.              The DALEC model (e.g., Williams et al., 2005; Row-
                                                                  land et al., 2014; Fox et al., 2009; Richardson et al., 2010;
                                                                  Famiglietti et al., 2021; Bloom and Williams, 2015) is a box
2     Materials and methods                                       model of C pools connected via fluxes that has been used
                                                                  to evaluate terrestrial carbon cycle dynamics across a range
2.1    Study site – Niwot Ridge, CO, USA                          of ecosystems and spatial scales. In all site, regional, and
                                                                  global applications, DALEC parameters are subject to very
Our study focuses on an AmeriFlux (https://ameriflux.lbl.
                                                                  broad, but physically realistic, prior distributions and are in-
gov/, last access: September 2020) core site in Niwot Ridge,
                                                                  dependently estimated and constrained by available obser-
Colorado, USA (US-NR1; 40◦ 10 5800 N, 105◦ 320 4700 W),
                                                                  vations at each grid point. Here we use DALEC version 2
where a tower-based eddy covariance system has been used
                                                                  (DALEC2; Yin et al., 2020; Quetin et al., 2020; Bloom et al.,
to continuously monitor the net ecosystem exchange (NEE)
                                                                  2020); gross and net carbon fluxes are determined as a func-
of carbon dioxide over a subalpine forest since November
                                                                  tion of 33 parameters, including 26 time-invariant parameters
1998. The 26 m tall tower is located in a high-elevation
                                                                  relating to allocation, turnover times, plant traits, respiration
(3050 m) subalpine site in the Rocky Mountains of Colorado
                                                                  climate sensitivities, water-use efficiency and GPP sensitiv-
(Monson et al., 2002). Located in an evergreen needleleaf
                                                                  ity to soil moisture, and 7 parameters describing the initial
(ENF) ecosystem, the dominant tree species include lodge-
                                                                  conditions of live biomass pools (live biomass C, dead or-
pole pine (Pinus contorta), subalpine fir (Abies lasiocarpa)
                                                                  ganic C and plant-available H2 O). Within DALEC2, GPP es-
and Engelmann spruce (Picea engelmannii) (Turnipseed et
                                                                  timates are generated in the aggregated canopy model (ACM;
al., 2002, 2004). Average annual precipitation is 800 mm,
                                                                  Williams et al., 1997); the ACM is derived from simple func-
with a majority of precipitation falling in the winter as snow
                                                                  tional relationships with environmental and plant structural
(Greenland, 1989; Knowles et al., 2015), which creates a per-
                                                                  and biochemical information (Williams et al., 1997) that are
sistent winter snowpack from November through early June
                                                                  produced from a sensitivity analysis of GPP estimates from a
(Bowling et al., 2018).
                                                                  more comprehensive SPA (soil–plant–atmosphere) land sur-
2.2    Observations                                               face model scheme (Williams et al., 1996, 2001). ACM GPP
                                                                  estimates are contingent on plant structural and biochemical
NEE measurements are screened for calm conditions using           variables (including LAI, foliar nitrogen and nitrogen-use ef-
the standard ustar filtering, gap-filled, and partitioned into    ficiency) and meteorological forcing (total daily irradiance,
GPP and ecosystem respiration based on the relationship be-       maximum and minimum daily air temperature, day length,
tween nighttime NEE (photosynthetically active radiation,         atmospheric CO2 concentration). In DALEC2, water limita-
PAR, < 50 µmol m−2 s−1 ) and air temperature (Reichstein et       tion on the ACM is prescribed as a linear response to the soil
al., 2005; Wutzler et al., 2018). Monthly averages of GPP         water deficit (Bloom et al., 2020). For more details on the
based on nighttime partitioning show similar seasonal struc-      model–data fusion methodology and CARDAMOM ensem-
tures to results found using an alternative daytime partition-    bles, we refer the reader to Appendix A. For a comprehen-
ing algorithm (Lasslop et al., 2009), so only nighttime par-      sive overview of the DALEC2 model, we refer the reader to
titioned GPP data are reported here. All GPP estimates are        Bloom et al. (2020) and references therein.
processed as half-hourly means and then averaged monthly.
Details on the flux measurements, data processing and qual-       2.4   Experiment design
ity control are provided in Burns et al. (2015).
                                                                  In order to develop model experiments that can reliably eval-
2.3    The CARDAMOM model–data fusion system                      uate temperature–GPP interactions, we first examine the ob-
                                                                  served environmental controls on tower-derived GPP. We fo-
The CARbon DAta-MOdel fraMework (CARDAMOM;                        cus on GPP during spring, defined here as the period from
e.g., Bloom et al., 2016; Yin et al., 2020; Exbrayat et al.,      March–May, which encompasses the climatological onset
2018; Smallman et al., 2017; Quetin et al., 2020; López-          of GPP and transition from dormant winter conditions to
Blanco et al., 2019; Famiglietti et al., 2021; Bloom et al.,      peak summer conditions (Fig. 1a). Mean spring GPP exhibits
2020; Yang et al., 2021a) uses carbon cycle and meteorolog-       large interannual variability (IAV) with both a small decreas-

https://doi.org/10.5194/bg-19-541-2022                                                      Biogeosciences, 19, 541–558, 2022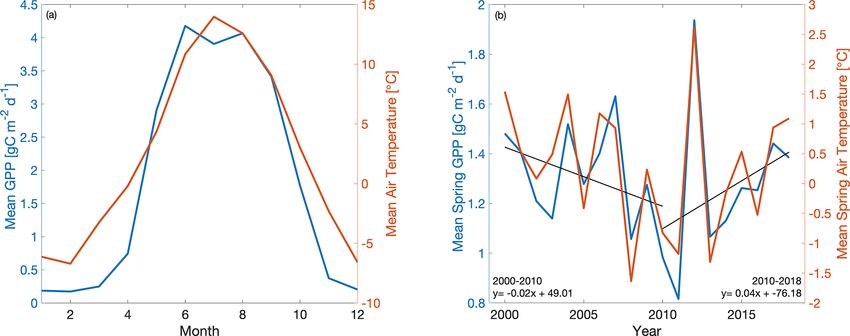
544                                S. G. Stettz et al.: Temperature limitation on spring productivity in an evergreen forest

Figure 1. Time series of (a) mean monthly GPP (blue) and air temperature (orange) and (b) mean spring (March–May) GPP and air
temperature at Niwot Ridge (US-NR1) from 2000–2018. GPP data are derived using a nighttime partitioning technique based on tower
observations of NEE and air temperature.

ing trend from 2000–2010 (−0.02 g C m−2 d−1 yr−1 ) and an
increasing trend from 2010–2018 (0.04 g C m−2 d−1 yr−1 )
(Fig. 1b). Comparison to tower-observed temperature data
(Figs. 1b and 2) shows that spring GPP is positively cor-
related to mean spring air temperature (Pearson’s linear
r = 0.89; p = 0.000004) and summer (June–September) air
temperature (r = 0.10; p = 0.70; Fig. S1a in the Supple-
ment). Mean winter (December–February) precipitation also
has a positive correlation with spring GPP (r = 0.07; p =
0.77; Fig. S1b), but it is much smaller than spring temper-
ature. At interannual timescales, mean annual GPP shows
a small increasing trend (0.0072 g C m−2 d−1 yr−1 ) over the
time period (Fig. S2) and the largest correlation with win-
ter (December–February) precipitation (Pearson’s linear r =
0.63; p = 0.003; Fig. S3d) and shortwave irradiance (r =
−0.30; p = 0.22; Fig. S3f). In contrast, spring temperature
shows little correlation with mean annual GPP (r = −0.02;         Figure 2. Scatterplot of mean spring (March–May) GPP with mean
p = 0.92; Fig. S3c). It appears that winter precipitation and     spring air temperature with the color bar showing the corresponding
total irradiance are the dominant drivers in annual produc-       year (2000–2018). r is Pearson’s correlation coefficient.
tivity, both of which are correlated, while spring temperature
shows a first-order effect in driving spring GPP.
   We also find that cold temperature is an important lim-        ability in GPP in evergreen forests (e.g., Pierrat et al., 2021;
itation on seasonal GPP at US-NR1. The seasonal cycle             Parazoo et al., 2018; Euskirchen et al., 2014; Arneth et al.,
of GPP shows peak productivity in early summer (around            2006). As temperature falls in winter-dormant plants, pro-
June), falling to near-zero values by early winter (Novem-        ductivity becomes negligible. Productivity is triggered again
ber) and continuing through late winter (February–March).         when spring air temperature becomes warm enough to thaw
Comparison of monthly GPP and minimum, maximum and                stems, trigger xylem flow and promote access to soil mois-
mean monthly air temperature shows an initiation of pho-          ture (e.g., Pierrat et al., 2021; Bowling et al., 2018; Ishida et
tosynthesis at monthly maximum air temperatures above             al., 2001). Due to this observed dependence of GPP on tem-
0 ◦ C (Fig. 3a) and monthly minimum air temperatures above        perature at US-NR1, we focus our analysis specifically on
−5 ◦ C (Fig. 3b). The strong dependence of monthly GPP on         spring GPP, where we hypothesize that cold temperature is
temperature is consistent with previous findings that temper-     the dominant control on spring GPP variability.
ature is an important driver of spring onset and seasonal vari-

Biogeosciences, 19, 541–558, 2022                                                      https://doi.org/10.5194/bg-19-541-2022
S. G. Stettz et al.: Temperature limitation on spring productivity in an evergreen forest                                    545

Figure 3. Scatterplot of mean monthly GPP vs. (a) mean maximum air temperature, (b) mean minimum air temperature and (c) mean air
temperature for 2000–2018. Dots are colored with the corresponding month.

   In the baseline version of CARDAMOM, seasonal GPP in            tions in photosynthetic pigments have been tied to seasonal
DALEC2 is limited primarily by incoming shortwave radia-           temperature at Niwot Ridge (Magney et al., 2019). Pierrat
tion. This light-focused limitation works well for deciduous       et al. (2021) identified an increase in plant water flow (mea-
forests where spring temperature and sunlight are correlated,      sured via changes in the diurnal stem radius) and a change in
as well as for high-latitude regions where sunlight is limited.    carotenoid : chlorophyll ratios as temperature increases. The
However, for reasons discussed above, this method fails in         activation of water flow in the evergreen trees, combined with
evergreen forests such as Niwot Ridge, whose green canopies        the pigment changes to absorb more sunlight, allows for the
are exposed to high sunlight and below-freezing temperature        recovery of photosynthesis in the spring.
in spring. As temperature increases, evergreen stems slowly           To represent the integrated impact of the cold-weather pro-
thaw, which enables the trees to access available soil mois-       cesses, here we implement a cold-temperature scaling fac-
ture and slowly reactivate their carbon and water exchange         tor (g) in DALEC2. This scaling factor is developed by
processes (Mayr et al., 2014; Bowling et al., 2018). Temper-       analyzing the relationship between monthly minimum and
ature also impacts the reactivation of photosynthetic activ-       maximum air temperature with tower-derived monthly GPP,
ity after winter dormancy (Öquist and Huner, 2003; Tanja et        where
al., 2003). For example, fluctuating temperature in the spring
has been shown to limit and sometimes reverse the activation       if Tmin (t) < T0 , g = 0,
of biochemical processes needed for photosynthesis recov-          if Tmin (t) > Tg , g = 1;
ery (Ensminger et al., 2004). Exposure to cold temperature,                      (Tmin (t) − T0 )
when combined with increased irradiance in the spring, can         else g(t) =                    ;                           (1)
                                                                                   (Tg − T0 )
also damage evergreen trees (Öquist and Huner, 2003; Yang
et al., 2020), therefore disrupting CO2 assimilation. Previ-       GPPcold (t) = GPP(t) · g(t).                               (2)
ous studies have captured these cold-temperature impacts at
                                                                   Tmin (t) is the observed minimum air temperature at Niwot
Niwot Ridge and other evergreen sites. For example, varia-
                                                                   Ridge at time t, GPP(t) is the nominal ACM-based DALEC2

https://doi.org/10.5194/bg-19-541-2022                                                         Biogeosciences, 19, 541–558, 2022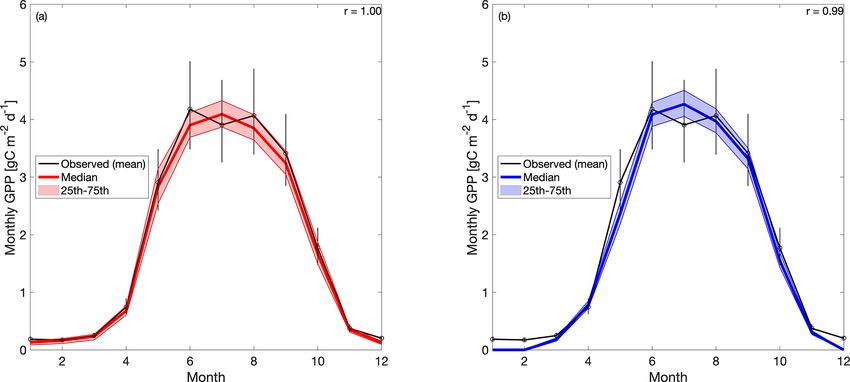
546                                S. G. Stettz et al.: Temperature limitation on spring productivity in an evergreen forest

Table 1. Summary of CARDAMOM modeling experiments to determine sensitivity of seasonal and interannual spring GPP variability to
cold-temperature limitation (CARD vs. CARDcold) and the ability to perform outside the training window (Half).

          Experiment name      MET      Time period        GPP        Time period considered   Uncertainties   Cold-temp.
                              drivers                  assimilation      in assimilation         in GPP        limitation
          CARD                  yes      2000–2018         yes              2000–2018              20 %           no
          CARD-Half             yes      2000–2018         yes              2000–2009              20 %           no
          CARDcold              yes      2000–2018         yes              2000–2018              20 %           yes
          CARDcold-Half         yes      2000–2018         yes              2000–2009              20 %           yes

GPP estimate (see Sect. 2.3) and GPPcold is the correspond-           to evaluate the sensitivity of modeled GPP at Niwot Ridge
ing cold-temperature GPP estimate. Equation (2) may rep-              to cold-temperature limitation and parameter optimization.
resent the integrated effect of all cold-weather biophysi-            Specifically, the objective of experiments CARD and
cal limitations, including processes such as the impact of            CARDcold is to determine whether the cold-temperature
cold weather on plant hydraulics, and changes to carotenoid-          scaling factor improves the representation of spring GPP
chlorophyll ratios. We also theorize that our temperature             variability across the 2000–2018 period; the objective of
scaling factor partially captures soil moisture disruptions due       experiments CARD-Half and CARDcold-Half is to cross
to changing soil temperature. The temperature thresholds in           validate the predictive skill of CARDcold by assessing
Eq. (1) may account for the connection between air tempera-           whether the addition of a cold-temperature scaling factor,
ture and soil temperature, with initial and full soil thawing         informed by a subset of GPP data, can improve prediction of
temperature potentially mirroring the photosynthesis shut-            a withheld subset of GPP data.
down and initiation air temperature. CARDAMOM does not
currently have explicit representations of soil moisture stress       2.5   Comparison to terrestrial biosphere model
due to soil freezing. Therefore, soil freezing stress and other             ensemble
biophysical processes impacted by cold temperature may be
approximated by this cold-temperature scaling factor added            A recent model intercomparison study provides an ideal
to CARDAMOM. The temperature thresholds for photosyn-                 benchmark for evaluating CARDAMOM simulations
thesis shutdown (referred to as T0 ) and initiation (referred to      (Sect. 2.4). Parazoo et al. (2020) conducted an experiment
as Tg ) are added as model parameters in DALEC2, bring-               in which an ensemble of state-of-the-art terrestrial biosphere
ing the total number of parameters to 35. These 35 DALEC              models (TBMs) were forced by the same observed meteorol-
parameters are simultaneously optimized in CARDAMOM.                  ogy at Niwot Ridge from 2000–2018 but with differences in
The CARDAMOM Bayesian-inference probability distribu-                 spin-up, land surface characteristics and parameter tuning.
tions (see Appendix A) for the T0 (−7.1 ± 1.1 ◦ C) and Tg             The TBMs are designed to simulate the exchanges of carbon,
(6.0 ± 2.6 ◦ C) parameters used to define the cold-temperature        water and energy between the biosphere and atmosphere,
limitation are plotted in Fig. S4. We refer to the cold-              from global to local scales depending on inputs from
temperature-constrained version of DALEC2 (within CAR-                meteorological forcing, soil texture and plant functional type
DAMOM) as DALEC2cold.                                                 (PFT). The experiment was designed primarily to evaluate
   The baseline (DALEC2) and cold-temperature                         simulations of solar-induced fluorescence (SIF) and GPP,
(DALEC2cold) versions of the model are run for the                    the latter of which we focus on here. We refer the reader
2000–2018 period using tower-observed, gap-filled, monthly            to Parazoo et al. (2020) for a more complete description
meteorological (MET) drivers (including minimum and                   of models, within-model experiments and between-model
maximum air temperature, shortwave radiation, vapor pres-             differences.
sure deficit, and precipitation). We conduct four experiments,           The most important model differences worth noting here
summarized in Table 1: experiments using DALEC2 and                   include the representation of stomatal conductance, canopy
DALEC2cold within CARDAMOM, where 19 years of GPP                     absorption of incoming radiation and limiting factors for
data is assimilated (referred to as CARD and CARDcold)                photosynthesis. We analyze a subset of the models, which
and a corresponding pair of experiments where only the first          were run for multiple years, including SiB3 and SiB4 (Sim-
decade of data (2000–2009) is assimilated (referred to as             ple Biosphere model versions 3 and 4, respectively), OR-
CARD-Half and CARDcold-Half) and the second decade of                 CHIDEE (Organizing Carbon and Hydrology In Dynamic
data (2010–2019) is withheld for validation, as a train–test          Ecosystems), BEPS (Boreal Ecosystems Productivity Sim-
scenario. All months of GPP data are assimilated into the             ulator), and CLM4.5 and CLM5.0 (Community Land Model
model; however our analysis focuses on the constraints on             versions 4.5 and 5.0, respectively). We also analyze within-
spring (March–May) GPP. These four experiments serve                  model experiments in SiB3 and ORCHIDEE to isolate ef-
                                                                      fects related to the prescription of the leaf area index

Biogeosciences, 19, 541–558, 2022                                                        https://doi.org/10.5194/bg-19-541-2022
S. G. Stettz et al.: Temperature limitation on spring productivity in an evergreen forest                                   547

(LAI; varying monthly in SiB3-exp1, fixed at 4.0 m2 m−2          decade of GPP data (Half experiments) has minimal impact
in SiB3-exp2), temperature and water stress (ORCHIDEE-           on model performance (1RMSE = 0.007 g C m−2 d−1 and
exp1 includes temperature stress; ORCHIDEE-exp2 ac-              1MBE = 0.06 g C m−2 d−1 for CARD-Half, and 1RMSE
counts for temperature and water stress) and data assimila-      = 0.02 g C m−2 d−1 and 1MBE = 0.02 g C m−2 d−1 for
tion (ORCHIDEE-exp3, in which a subset of model parame-          CARDcold-Half). We find less agreement between modeled
ters controlling photosynthesis and phenology are optimized      and tower-derived GPP IAV in summer for both CARD and
against global OCO-2 (Orbiting Carbon Observatory 2) SIF         CARDcold (CARD r = 0.32 and SD = 0.11 g C m−2 d−1 ;
data; Bacour et al., 2019). Most of the TBM model exper-         CARDcold r = 0.05 and SD = 0.10 g C m−2 d−1 ; Fig. S6).
iments were run with default parameters (BEPS, CLM50,            While there is little variation in RMSE between the half-
SiB3, SiB4, ORCHIDEE-exp1 and ORCHIDEE-exp2). The                and full-assimilation experiments, RMSE is larger for sum-
other experiments were optimized in the following ways: ei-      mer than spring GPP (average RMSE = 0.23 g C m−2 d−1
ther (a) parameters were hand-tuned based on the US-NR1          for spring model outputs; average RMSE = 0.35 g C m−2 d−1
data (CLM4.5) or (b) the parameters were optimized using         for summer model outputs). Model agreement is further re-
OCO-2 SIF data (ORCHIDEE-exp3). For more details on              duced when considering annual average GPP (Fig. S7, Ta-
the parameterization of the TBM-SIF experiments, we refer        ble S2). Although the cold-temperature limitation improves
the reader to Parazoo et al. (2020). The use of these models     IAV slightly, it is still small compared to observed variabil-
provides insight into the spread in model structures and the     ity (mean annual SD = 0.14 g C m−2 d−1 ). Correlations to
use of their default parameters. Finally, we note that not all   tower-derived GPP at the annual scale are small for both
model simulations span the entire observed record (2000–         CARD and CARDcold (r = 0.19 and r = 0.22, respectively;
2018). While our analysis focuses on the long-term record        Fig. S7a–b). Overall, the cold-temperature limitation sub-
from 2000–2018, we provide multiple comparisons to ensure        stantially improves agreement between the model and tower-
consistency of the time period: (1) IAV from 2001–2018 for       derived spring GPP, with slight reductions in performance for
SiB3, SiB4, ORCHIDEE and CLM4.5; (2) IAV from 2012–              summer and annual GPP.
2018 for SiB3, SiB4, ORCHIDEE, CLM4.5 and CLM5.0;                   The standard deviation in tower-derived mean spring GPP
and (3) seasonal variability from 2015–2018 for all models.      (March–May) is approximately 0.25 g C m−2 d−1 . The addi-
We refer to the ensemble of models and within-model exper-       tion of the cold-temperature limitation improves the model’s
iments collectively as TBM-MIP.                                  ability to match the IAV of mean spring GPP (Fig. 6a–b).
                                                                 An examination of all modeled scenarios for CARD and
                                                                 CARDcold (i.e., all 4000 DALEC2 simulations) shows that
3     Results and discussion                                     the cold-temperature limitation produces spring IAV values
                                                                 much closer to what is observed in the tower-derived GPP
3.1    Evaluation of CARDAMOM 2000–2018 GPP                      data. Only 0.3 % of CARD ensembles produce mean spring
                                                                 IAV values within 20 % of the tower-derived spring GPP
When the 19 years of tower-derived GPP data is assimi-           standard deviation (0.25 ± 0.05 g C m−2 d−1 ), whereas 69 %
lated into both versions of the model, the mean seasonal         of CARDcold ensembles have standard deviation values
cycle is accurately replicated (Fig. 4). Pearson’s r val-        within the same range. Interestingly, assimilating only the
ues for CARD (Fig. 4a) and CARDcold (Fig. 4b) are al-            first 10 years of GPP data (Half experiments, Fig. 6b) slightly
most equal (r is 1.0 and 0.99) with minimal increases            increases the number of ensemble members with standard
in root mean square error (RMSE) and mean bias error             deviations within the mentioned range for both CARD-Half
(MBE) for CARDcold (RMSE is 0.24 and 0.23 g C m−2 d−1            (2.4 %) and CARDcold-Half (70 %). It is promising to see
and MBE is 0.06 and 0.19 g C m−2 d−1 for CARD and                that despite not assimilating the 2010–2018 GPP data into
CARDcold, respectively). Assimilating only the first decade      the model, CARDcold-Half is still able to match the average
of GPP data (Half experiments) does not drastically al-          spring IAV of the full data record.
ter model performance (Fig. S5), with only slight changes           We also consider the IAV in spring GPP for just
in RMSE and MBE (1RMSE = 0.008 g C m−2 d−1 and                   the second half of the data record (2010–2018). IAV
1MBE = 0.03 g C m−2 d−1 for CARD-Half; 1RMSE =                   of tower-derived spring GPP increases slightly in 2010–
−0.003 g C m−2 d−1 and 1MBE = 0.02 g C m−2 d−1 for               2018 (0.32 g C m−2 d−1 ). Once again, the cold-temperature
CARDcold-Half).                                                  limitation enables CARDAMOM to match spring GPP
   The cold experiments exhibit an improved fit to the           IAV (Fig. 6c–d). Of CARD ensembles, 0.03 % produce
observed IAV in spring productivity (Fig. 5), relative to        mean spring IAV values within 20 % of the tower-derived
CARD (r = 0.47 and SD = 0.03 g C m−2 d−1 for CARD; r =           spring GPP standard deviation for the 2010–2018 period
0.88 and SD = 0.27 g C m−2 d−1 for CARDcold). CARD-              (0.32 ± 0.06 g C m−2 d−1 ), whereas 76 % of CARDcold en-
cold also has slightly reduced RMSE (−0.01 g C m−2 d−1 )         sembles have standard deviation values within the same
and larger MBE (0.13 g C m−2 d−1 ). Similarly to the sea-        range. For the Half experiments, 0.6 % of CARD and 75 %
sonal cycle analysis, the assimilation of only the first         of CARDcold ensembles have IAV values within 20 % of

https://doi.org/10.5194/bg-19-541-2022                                                    Biogeosciences, 19, 541–558, 2022
548 S. G. Stettz et al.: Temperature limitation on spring productivity in an evergreen forest
Figure 4. Tower-derived average monthly GPP (black line) and modeled GPP seasonal cycles at US-NR1 for 2000–2018, for (a) CARD
and (b) CARDcold experiments. The half-assimilation experiments (CARD-Half and CARDcold-Half) can be found in the Supplement
(Fig. S5). Model outputs include the median value of each experiment (bold colored line) with the 25th–75th percentiles of the ensembles
(shaded area). The median is plotted instead ofpthe mean to avoid impact of outlier ensemble members (N = 4000). Error bars are tower-
derived GPP multiplied and/or divided by exp( (log(2)2 · n)/n). n is number of years on average (n = 19). r is Pearson’s coefficient.
the standard deviation for 2010–2018. This improvement in The temperature-induced spring onset of GPP is driven by
matching IAV is also observed when considering mean an- two general processes: (1) initiation of bud burst and leaf ex-
nual GPP (Fig. S8), but it is much smaller than the improve- pansion leading to an increasing LAI and/or (2) initiation of
ments made for spring GPP. Overall, CARDcold produces photosynthetic activity (photosynthetic efficiency, i.e., GPP
a less biased distribution of IAV values (relative to both per unit of LAI) due to temperature-induced changes in plant
assimilated and withheld observations), whereas CARD is hydraulics (Ishida et al., 2001; Pierrat et al., 2021) or kinetics
more skewed towards smaller IAVs, which indicates that the of the photosynthetic machinery (e.g., Medlyn et al., 2002).
cold-temperature limitation enables a mechanistic and statis- In situ LAI measurements suggest that the LAI at Niwot
tical improvement in capturing the interannual variability in Ridge is relatively constant across the season, which is some-
spring GPP. what expected given the dominant tree species at the site.
Hence, the temperature-induced onset of GPP is likely due
3.2 Temperature controls on springtime GPP to the latter process, increased photosynthetic efficiency, as
supported by the measurements (Figs. 1–2), although small
The added value of the DALEC2 cold-temperature limita- changes in the LAI are still feasible given uncertainties in the
tion for modeling mean spring (March–May) GPP is logi- measurements. The inclusion of the cold-temperature limita-
cally due to large fluctuations in spring temperature at Niwot tion scaling factor in the model, a semi-empirical process,
Ridge. The cold-temperature limitation allows DALEC2– leads to a substantial improvement in the model representa-
CARDAMOM to match the IAV of tower-derived spring tion of GPP at the site. Further development may also look to
GPP closely. Furthermore, the cold-temperature limitation identify the relative roles of an increased LAI and increased
enables the model to match tower spring IAV in the sec- photosynthetic efficiency at Niwot Ridge and other evergreen
ond half of the time period (2010–2018) when only the first needleleaf sites as changes in GPP can lead to changes in car-
10 years of GPP data is assimilated (2000–2009). This indi- bon allocation to the LAI, among other plant carbon pools.
cates that the cold-temperature limitation is able to estimate Temperature is important in both the reactivation of pho-
spring GPP outside of its training window and could be use- tosynthetic activity in the spring and the wind down of pro-
ful at other sites where data availability is limited. Future ductivity in the fall (Flynn and Wolkovich, 2018; Stinziano
work will include evaluating the cold-temperature limitation and Way, 2017). Therefore, we anticipate that the cold-
at other sites to ensure that it is applicable beyond Niwot temperature scaling function may also improve our ability to
Ridge, for example using forecast skill metrics proposed by model fall productivity. However, other factors such as wa-
Famiglietti et al. (2021). ter availability and the photoperiod must also be considered
Biogeosciences, 19, 541–558, 2022 https://doi.org/10.5194/bg-19-541-2022S. G. Stettz et al.: Temperature limitation on spring productivity in an evergreen forest 549 Figure 5. Tower-derived (black line) mean spring (March–May) GPP with model interquartile range (shaded area) and median (bold colored line) spring GPP outputs for (a) CARD, (b) CARDcold, (c) CARD-Half and (d) CARDcold-Half experiments. p The grey regions indicate no data assimilation (i.e., testing window). Model experiments are the same as in Fig. 4. Uncertainty is exp( (log(2)2 · n)/n), where n is the number of months on average (n = 3). (Bauerle et al., 2012; Stinziano et al., 2015). Future studies GPP to temperature. Furthermore, the use of process-based at Niwot Ridge and other sites should investigate the role of models will be needed to disentangle the individual cold- these factors (temperature, water, photoperiod) in regulating weather biophysical processes currently represented in the fall GPP and how we can represent these processes in CAR- scaling factor (Eqs. 1–2). For now, this is a useful metric for DAMOM. the climate sensitivity of spring GPP, at least in the absence With the inclusion of the cold-temperature limitation on of long-term adaptations. Furthermore, over the 19-year ob- GPP and its application in CARDAMOM, we provide a data- servation period investigated here, the use of temporally con- constrained estimate of the climate sensitivity of the Niwot stant T0 and Tg yields significantly improved GPP estimates, Ridge forest to spring temperature. Posterior estimates indi- suggesting that much of the variability can be attributed to cate that GPP is gradually inhibited below 6.0 ◦ C ± 2.6 ◦ C climate-driven changes, not interannual variation in vegeta- (Tg ) and completely inhibited below −7.1 ◦ C ± 1.1 ◦ C (T0 ). tion parameters. As temperature continues to increase due The gradual limitation of GPP by temperature has been ob- to climate change (particularly in the early growing season), served on hourly and daily timescales in other cold-weather productivity at US-NR1 could increase as a result and there- ecosystems, such as Alaskan conifers (Parazoo et al., 2018) fore increase carbon uptake, with productivity peaking ear- and Canadian spruce (Pierrat et al., 2021). This has been con- lier in the year (e.g., Xu et al., 2016). However, these spring nected to the triggering of transpiration and water flow from gains in GPP have been shown to not offset the losses of car- xylem into leaves (Ishida et al., 2001). However, both biotic bon due to summer droughts (e.g., Buermann et al., 2013; (e.g., carotenoid : chlorophyll ratios) and abiotic (e.g., open- Knowles et al., 2018). It is also unclear how the long-term ness of canopy) factors together regulate GPP response to stress of increased temperature could affect forest productiv- meteorological forcings, and further process-oriented inves- ity directly. tigations are required to resolve the emergent response of https://doi.org/10.5194/bg-19-541-2022 Biogeosciences, 19, 541–558, 2022
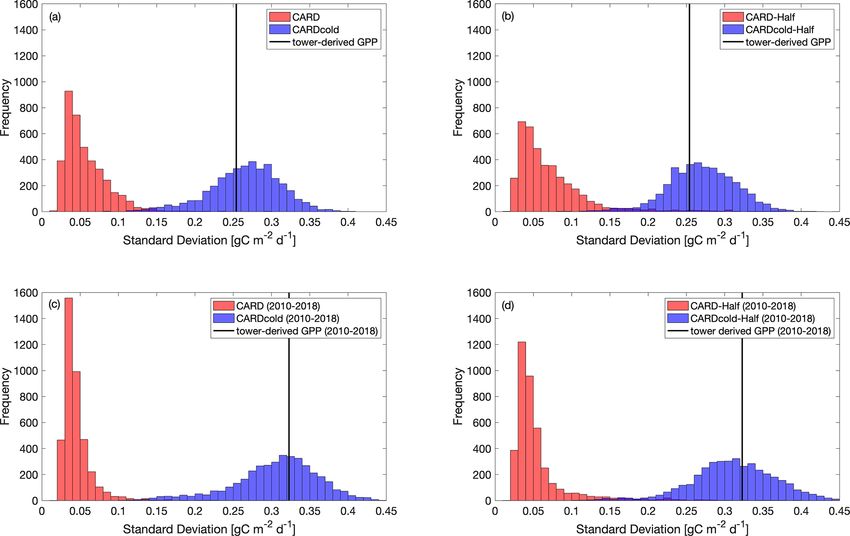
550                                  S. G. Stettz et al.: Temperature limitation on spring productivity in an evergreen forest

Figure 6. Histograms comparing standard deviation in mean spring GPP across all ensembles (N = 4000) for CARD (red bars) and CARD-
cold (blue bars) experiments with (a) full assimilation, (b) half assimilation, (c) full assimilation for the second decade (2010–2018) and
(d) half assimilation for the second decade (2010–2018). The black line indicates the standard deviation in tower-derived mean spring GPP
(SD = 0.25 g C m−2 d−1 for full period (a–b); SD = 0.32 g C m−2 d−1 for 2010–2018 (c–d)).

   This study focuses on the relationship between tempera-              nual average GPP appears to be more dependent on winter
ture and GPP and its usefulness for model predictions of                precipitation/snowpack (Pearson’s linear r = 0.63; Fig. S3a),
spring GPP, but an important component that cannot be                   future work will include improving model predictability of
ignored is the confounding effect of water availability on              late-season productivity and quantifying temperature–water
GPP. Future changes in winter precipitation are more un-                effects on carbon uptake. The definition of the seasons could
certain, therefore limiting our ability to analyze how pre-             also alter the connections drawn between seasonal tempera-
cipitation changes will alter future productivity. While pre-           ture, precipitation and productivity.
cipitation observations are analyzed to discern any major
connections between GPP and meteorological controls, an                 3.3   Model intercomparison and implications for GPP
analysis of how precipitation affects model predictability is                 models
not included in this study. The combined results, including
the cold-temperature limitation and train–test data assimila-           Here, we evaluate DALEC2–CARDAMOM against mean
tion experiments, suggest that other factors besides spring             spring GPP estimates from TBM-MIP models (Sect. 2.5 and
temperature, most notably winter and summer precipitation               Parazoo et al., 2020). It is important to remind the reader
(Fig. S3) and resulting soil water limitation, also have im-            that the CARDAMOM runs have a significant advantage
portant impacts on summer GPP. We therefore highlight the               over the TBM-MIP models in this analysis, as CARDAMOM
need to jointly resolve springtime temperature limitation in            is trained on US-NR1 GPP data. While TBM-MIP models
conjunction with water stress limitations in future efforts to          use tower-observed meteorological inputs, prescribe tower-
understand the integrated role of environmental forcings on             specific and time-invariant structural properties such as the
interannual GPP variability. Furthermore, this analysis does            LAI observed at US-NR1 (SiB3-exp2 and CLM4.5), and use
not consider how winter precipitation as snowfall versus rain-          data assimilation of global remote sensing data to constrain
fall affects productivity or how resulting changes to winter            globally representative plant functional types (ORCHIDEE-
snowpack could alter productivity in the long term. Since an-           exp3), they are not directly constrained by time-varying car-

Biogeosciences, 19, 541–558, 2022                                                            https://doi.org/10.5194/bg-19-541-2022
S. G. Stettz et al.: Temperature limitation on spring productivity in an evergreen forest                                    551

bon fluxes at the tower. As such, we emphasize that our          (RMSE = 0.22 g C m−2 d−1 ; MBE = 0.07 g C m−2 d−1 ), and
model comparison is not a strict assessment of performance       data assimilation experiments in ORCHIDEE-exp3 show re-
but rather an attempt to learn how model simulation of GPP       duced bias relative to free-running experiments. The cold-
at an evergreen needleleaf site can be improved.                 temperature limitation has little impact on the modeled mean
   There is a wide range in performance of TBM-MIPs              seasonal cycle or mean annual GPP estimates in CAR-
in representing the magnitude and IAV of tower-derived           DAMOM and appears to be most valuable for improving
spring GPP (Fig. 7a). Pearson’s r correlations range from        spring GPP variability.
0.25 to 0.82 (mean r = 0.6; Table 2) from 2001–2018, with           In summary, TBM-MIP experiments reveal several key
the same models showing slightly improved performance            factors that can improve or degrade estimates of spring
over the second decade (mean r = 0.73 from 2012–2018).           GPP at Niwot Ridge. For example, adapting model param-
ORCHIDEE-exp1 and CLM4.5 show consistently high per-             eters to needleleaf species based on hand-tuning to tower
formance over all three periods analyzed, with CLM5.0 ex-        data and formal data assimilation methods (CLM4.5 and
celling from 2012–2018 and BEPS from 2015–2018 (Ta-              ORCHIDEE-exp3, respectively) improves the overall magni-
ble S1). CLM4.5 also shows the smallest mean bias of the         tude of spring GPP. Likewise, prescribing the LAI a constant
TBM-MIP models (RMSE ∼ 0.35) and high agreement in               value of 4.0 m2 m−2 based on tower measurements (SiB3-
the magnitude of spring GPP variability (1σ standard devi-       exp2) improves year-to-year variability, while prescribing the
ation is 0.21 g C m−2 d−1 for CLM4.5 vs. 0.25 g C m−2 d−1        time-variable LAI based on MODIS data improves spring
observed). While acknowledging the advantage of data as-         GPP magnitude (SiB3-exp1). SiB4, which has prognostic
similation, it is promising to see that CARDAMOM (with           rather than prescribed phenology, represents a compromise in
the addition of the cold-temperature limitation) is able to      magnitude and variability when looking at the entire record
perform comparably to the TBM-MIP models. In particular,         (2001–2018) but is one of the top performers across all TBM-
CARDcold is well correlated in the direction (r = 0.88) and      MIP models over the most recent period (2012–2018).
magnitude (1σ ∼ 0.26) of interannual variability, as well as        We did not directly consider changes in canopy structural
the overall magnitude of spring GPP (low RMSE and MBE).          or biophysical characteristics in our CARDAMOM experi-
   The range of performances across within-model experi-         ments. In CARDAMOM, the LAI is a prognostic quantity (a
ments reveals important processes, as well as uncertainty in     function of foliar C and leaf carbon mass per area). In the
process representation, in driving the magnitude and variabil-   absence of LAI observational constraints, the CARDAMOM
ity in spring GPP. For example, the ORCHIDEE data assim-         LAI is indirectly informed by the constraints of time-varying
ilation experiment (exp3) shows consistently and substan-        GPP on DALEC2 parameters (see Sect. 2.3). Our results sug-
tially lower overall correlation (e.g., r = 0.59 from 2001–      gest that additional improvements are possible with careful
2018) than corresponding free-running experiments (exp1          consideration of in situ-measured vegetation parameters.
and exp2, r is 0.78–0.82) but has reduced RMSE and MBE              TBM-MIP experiments also offer insight into important
(RMSE is 0.63 g C m−2 d−1 vs. 1–1.14 g C m−2 d−1 ). Like-        environmental controls and process representation. Air tem-
wise in SiB3, prescribing an empirically based but fixed-        perature is an effective constraint of spring GPP onset
in-time LAI of 4.0 m2 m−2 (exp2) reduces mean bias but           (CLM4.5, ORCHIDEE-exp1, Fig. 7 and Table 2), but it can
degrades variability (r = 0.25) compared to a time-variable      be degraded when large-scale data assimilation does not ac-
LAI (exp1) prescribed from satellite data (r = 0.50).            count for local to regional vegetation characteristics in pa-
   There is also large variability in the modeled seasonal cy-   rameter optimization (e.g., ORCHIDEE-exp3, Table 2). Wa-
cle (Fig. 7b) and mean annual GPP (Fig. S9). For mean            ter availability appears to be a secondary but still important
annual GPP estimates, Pearson’s r values are reduced for         driver of spring GPP. While acknowledging the numerous
all models (Table S2). Once again, ORCHIDEE-exp2 and             differences between CLM4.5 and CLM5.0, we find it impor-
ORCHIDEE-exp3 stand out with some of the higher cor-             tant to note that plant hydraulic water stress (CLM5.0) shows
relations (r = 0.60 and r = 0.64) and p values below the         improved IAV performance (high correlation, Table 2) over
5 % significance level. Furthermore, ORCHIDEE-exp3 (tem-         simplified soil moisture stress functions (CLM4.5). This re-
perature stress with SIF data assimilation) has the lowest       sult further supports efforts to closely analyze seasonal GPP
RMSE and MBE of the model set. SiB3-exp2 (fixed LAI)             to locate different environmental controls for future model
has a standard deviation closest to that of “observations”       improvements.
(0.14 g C m−2 d−1 ) and the smallest RMSE and MBE of the            Our study of the controls of cold temperature on GPP has
TBM models.                                                      important implications for modeling seasonal productivity.
   Most TBM-MIP models capture the shape of the seasonal         First, future work must evaluate cold-temperature limitation
cycle at Niwot Ridge. For the 2015–2018 period, all mod-         at other sites across an array of ecosystem types. Addition-
els have Pearson’s r values larger than 0.91, with p values      ally, it is important to determine if the temperature thresholds
much smaller than a 5 % significance level (Table S3). With      of photosynthesis initiation and cessation are similar across
the help of data assimilation, CARDcold accurately cap-          locations or unique to ecosystem type and/or site. Previous
tures the seasonal cycle at Niwot Ridge with reduced error       studies have had mixed results, supporting the use of both

https://doi.org/10.5194/bg-19-541-2022                                                     Biogeosciences, 19, 541–558, 2022
552                                          S. G. Stettz et al.: Temperature limitation on spring productivity in an evergreen forest

Figure 7. Comparison of TBM-MIP models to CARD and CARDcold experiments for (a) mean spring GPP for 2000–2018 and (b) monthly
GPPpfrom 2015–2018. Note that fill values are ignored when calculating mean annual values for TBM-MIP experiments. Uncertainty is
exp( (log(2)2 · n)/n), where n is the number of years on average (n = 19).

Table 2. Pearson’s linear r, R 2 , p value, standard deviation, root mean square error (RMSE), and mean bias error (MBE) for TBM-MIP
and all CARDAMOM experiments for Niwot Ridge tower-derived mean spring (March–May) GPP. Open values reflect statistics for the
2001–2018 period, while values in parentheses represent the 2012–2018 period. All relevant statistics are calculated at a 5 % significance
level.

         Model                            r value                R2            p value               RMSE                MBE      Standard deviation
                                                                            (α = 0.05)        (g C m−2 d−1 )     (g C m−2 d−1 )       (g C m−2 d−1 )
         CARD-Half                   0.47 (0.55)       0.22 (0.30)         0.05 (0.20)             0.24 (0.26)   −0.005 (0.06)           0.03 (0.04)
         CARD                        0.45 (0.57)       0.20 (0.33)         0.06 (0.18)             0.24 (0.28)      0.05 (0.12)          0.03 (0.04)
         CARDcold-Half               0.88 (0.93)       0.77 (0.86)        0.00 (0.002)             0.21 (0.24)      0.17 (0.22)          0.26 (0.29)
         CARDcold                    0.87 (0.93)       0.76 (0.87)         0.00 (0.00)             0.23 (0.26)      0.20 (0.24)          0.26 (0.28)
         SiB3-exp1                   0.50 (0.81)       0.25 (0.66)         0.04 (0.03)             1.07 (1.23)      1.04 (1.21)          0.16 (0.13)
         SiB3-exp2                   0.25 (0.41)       0.06 (0.17)         0.32 (0.36)             0.97 (1.15)      0.92 (1.13)          0.26 (0.10)
         SiB4                        0.34 (0.91)       0.12 (0.83)         0.16 (0.00)             0.90 (1.04)      0.86 (1.02)          0.22 (0.09)
         ORCHIDEE-exp1               0.82 (0.82)       0.68 (0.67)         0.00 (0.02)             1.14 (1.24)   −1.08 (−1.16)           0.56 (0.67)
         ORCHIDEE-exp2               0.78 (0.79)       0.61 (0.63)         0.00 (0.03)             1.00 (1.20)   −0.95 (−1.12)           0.51 (0.64)
         ORCHIDEE-exp3               0.59 (0.55)       0.35 (0.31)         0.01 (0.20)             0.63 (0.81)   −0.57 (−0.76)           0.35 (0.36)
         BEPS∗                                X                 X                   X                       X                X                    X
         CLM4.5                      0.82 (0.85)       0.68 (0.73)         0.00 (0.01)             0.34 (0.35)   −0.31 (−0.31)           0.21 (0.18)
         CLM5.0                           (0.96)            (0.92)              (0.00)                  (1.09)         (−1.08)                (0.42)
       ∗ BEPs statistics are not included in this table as this model only has GPP estimates for 2015–2018.

Biogeosciences, 19, 541–558, 2022                                                                                https://doi.org/10.5194/bg-19-541-2022
S. G. Stettz et al.: Temperature limitation on spring productivity in an evergreen forest 553
customized temperature threshold parameters dependent on et al., 2020; Bloom et al., 2020). Joint assimilation of these
the site (Tanja et al., 2003; Chang et al., 2020) and a gen- datasets, coupled with observed meteorological forcing, has
eral parameter across multiple sites or biome type (Bergeron the potential to introduce more emergent constraints of vege-
et al., 2007). These differences could be due to variations tation change with respect to environmental change, thus im-
in other variables (e.g., soil temperature, irradiance) and/or proving overall estimates of productivity. Future work will
physiological differences in the vegetation species. Identify- assess the joint impact of SIF, ET (evapotranspiration), the
ing how photosynthesis temperature thresholds vary across LAI, and biomass data as effective constraints on light-use
space and ecosystem type would be beneficial in improving and water-use efficiency (Smith et al., 2020), which is ex-
model performance in simulating productivity. Our model pected to improve the ability of CARDAMOM to use light
intercomparison study also provides insights into how we with respect to increasing biomass subject to longer growing
may improve our ability to model seasonal GPP. For exam- seasons and heat and water stress.
ple, in Fig. 7b, we see that the ORCHIDEE model growing
season starts too early. In the photosynthesis module of OR-
CHIDEE, the temperature dependency of parameters are de- 4 Conclusions
scribed by Arrhenius or modified Arrhenius functions fol-
Despite mechanistic advances in ecosystem modeling, it is
lowing Medlyn et al. (2002) and Kattge and Knorr (2007). In
still a challenge to simulate temporal variations in GPP. In an
general, the functions are used to estimate the potential rates
attempt to dissect the environmental controls on GPP in an
of Rubisco activity and electron transport based on temper-
evergreen needleleaf ecosystem, we analyzed the impact of
ature, as these rates are needed to determine photosynthetic
temperature on spring (March–May) productivity by imple-
capacity (Medlyn et al., 2002). The lowest temperatures for
menting a cold-temperature GPP limitation within a model–
productivity mentioned in these studies are 5 and 11 ◦ C, re-
data fusion system (DALEC2–CARDAMOM). The cold-
spectively. Additionally, there is a test at the start of the pho-
weather GPP limitation allows for improved model estimates
tosynthesis subroutine that prevents the computation of pho-
of mean spring productivity at Niwot Ridge, specifically
tosynthesis if the mean temperature over the last 20 d falls be-
CARDAMOM’s ability to match the interannual variability
low −4 ◦ C. For our study, the only ORCHIDEE experiment
observed in tower-derived mean spring GPP. Furthermore,
that uses specific data related to the plant functional type of
CARDAMOM is able to match spring interannual variability
this site (OCO-2 SIF data for US-NR1) is ORCHIDEE-exp3.
between model and tower data outside of the training period.
This experiment improves the general behavior of the mod-
When compared to TBM-MIP models, controls that appear
eled GPP seasonal cycle but does not improve ORCHIDEE’s
to impact model performance include the inclusion of water
ability to capture the start of the growing season. So with the
stress (e.g., soil moisture) and vegetation parameters (e.g.,
future evaluation of cold-temperature limitation at other sites
prescription of the LAI). The fact that the cold-temperature
and further study of the potential temperature-influenced bias
limitation does not improve CARDAMOM’s annual GPP es-
in the model, ORCHIDEE (and other process-based models)
timates suggests that other controls (i.e., winter precipitation)
may need to improve its photosynthesis temperature depen-
drive GPP variability in other parts of the year, most likely
dency for cold plant functional types. Therefore, we recom-
summer (June–September). The cold-temperature limitation
mend implementing a cold-temperature GPP limitation in a
may prove useful in understanding future changes in spring
process-based model to confirm its ability to improve model
productivity due to changes in temperature in other ecosys-
performance. If we (1) identify how photosynthesis initiation
tems as well.
and shutdown vary with temperature and location and (2) ap-
ply a cold-temperature limitation successfully in a process-
based model, then we could expand our analyses to answer Appendix A: Model–data fusion methodology
bigger Earth science questions. For example, we could use
Earth system model temperature trends to determine how The DALEC2 model parameter values and state variable ini-
changing temperature will impact GPP in the future. tial conditions (henceforth x) are optimized using a Bayesian
While further experiments are needed, these results inference approach, where the posterior probability distribu-
demonstrate the value of (1) site level data assimilation for tion of x given observations O, p(x|O), can be expressed
local-scale prediction of GPP magnitude and variability, (2) as
global data assimilation for reducing magnitude biases, and
p (x|O) ∝ p (x) L (x|O) , (A1)
(3) process formulation for accounting for sensitivity to tem-
perature limitation and water stress. Overall, these results are where p(x) is the prior probability distribution of x and
encouraging for model–data fusion systems which have de- L(x|O) is the likelihood of the DALEC parameters and ini-
veloped the capacity to bring together temporally and spa- tial conditions given observations O. We define the likeli-
tially resolved functional and structural vegetation compo- hood function as
nents such as the LAI, SIF, soil organic matter, and above- P mi (x)−Oi 2 P ma 0 (x)−Oa 0 2
− 21 i σ − 12 a σ0
and belowground biomass (e.g., Bacour et al., 2019; Smith L (x | O) = e +e , (A2)
https://doi.org/10.5194/bg-19-541-2022 Biogeosciences, 19, 541–558, 2022You can also read