Satellite detection of severe convective storms by their retrieved vertical profiles of cloud particle effective radius and thermodynamic phase ...
←
→
Page content transcription
If your browser does not render page correctly, please read the page content below
JOURNAL OF GEOPHYSICAL RESEARCH, VOL. 113, D04208, doi:10.1029/2007JD008600, 2008
  Click
  Here
    for
 Full
Article

Satellite detection of severe convective storms by their retrieved
vertical profiles of cloud particle effective radius and
thermodynamic phase
Daniel Rosenfeld,1 William L. Woodley,2 Amit Lerner,1 Guy Kelman,1
and Daniel T. Lindsey3
Received 1 March 2007; revised 7 October 2007; accepted 16 November 2007; published 23 February 2008.

[1] A new conceptual model that facilitates the inference of the vigor of severe convective
storms, producing tornadoes and large hail, by using satellite-retrieved vertical
profiles of cloud top temperature (T)–particle effective radius (re) relations is presented
and tested. The driving force of these severe weather phenomena is the high updraft
speed, which can sustain the growth of large hailstones and provide the upward motion
that is necessary to evacuate the violently converging air of a tornado. Stronger
updrafts are revealed by the delayed growth of re to greater heights and lower T, because
there is less time for the cloud and raindrops to grow by coalescence. The strong
updrafts also delay the development of a mixed phase cloud and its eventual glaciation to
colder temperatures. Analysis of case studies making use of these and related criteria
show that they can be used to identify clouds that possess a significant risk of large hail
and tornadoes. Although the strength and direction of the wind shear are major
modulating factors, it appears that they are manifested in the updraft intensity and cloud
shapes and hence in the T-re profiles. It is observed that the severe storm T-re signature
is an extensive property of the clouds that develop ahead in space and time of the
actual hail or tornadic storm, suggesting that the probabilities of large hail and
tornadoes can be obtained at substantial lead times. Analysis of geostationary
satellite time series indicates lead times of up to 2 h.
Citation: Rosenfeld, D., W. L. Woodley, A. Lerner, G. Kelman, and D. T. Lindsey (2008), Satellite detection of severe convective
storms by their retrieved vertical profiles of cloud particle effective radius and thermodynamic phase, J. Geophys. Res., 113, D04208,
doi:10.1029/2007JD008600.

1. Introduction                                                           additional energy for sustaining the dynamics of tornadic
                                                                          supercell storms and squall lines that can recirculate large
  [2] This study presents a new conceptual model that                     hailstones and produce damaging winds. The respective
facilitates the detection of the vigor of convective storms               roles of convective potential available energy (CAPE) and
by remote sensing from satellites, based on the retrieved                 the 0 – 6 km vertical wind shear have been the main
vertical profiles of cloud-particle effective radius and ther-            predictors for severe convective storms [Rasmussen and
modynamic phase. Severe convective storms are defined                     Blanchard, 1998; Hamill and Church, 2000; Brooks et al.,
by the US National Weather Service as having wind gusts                   2003]. The existence of wind shear and low-level storm
>58 mph, hail >3/4 inch (1 inch = 2.54 cm) in diameter, or                relative helicity (rotation of the wind vector) were found to
producing tornadoes. A major driving force of all these                   be with strong (at least F2) tornadoes [Dupilka and Reuter,
severe weather phenomena is the high updraft speeds,                      2006a, 2006b]. However, even with small helicity, a steep
which can sustain the growth of large hailstones, provide                 low-level lapse rate and large CAPE can induce strong
the upward motion that is necessary for evacuating verti-                 tornadoes due to the large acceleration of the updrafts
cally the violently converging air of a tornado, or comple-               already at low levels [Davis, 2006]. This underlines the
mented strong downward motion, which results in                           importance of the updraft velocities in generating the severe
downbursts and intense gust fronts. Wind shear provides                   convective storms, and the challenges involved in their
    1
                                                                          forecasting based on sounding data alone.
      Institute of Earth Sciences, Hebrew University of Jerusalem,          [3] The conceptual model of a satellite-observed severe
Jerusalem, Israel.
    2
      Woodley Weather Consultants, Littleton, Colorado, USA.              storm microphysical signature, which is introduced in this
    3
      Regional and Mesoscale Meteorology Branch, National Environmental   paper, is based on the satellite-retrieved microphysical
Satellite, Data, and Information Service, NOAA, Fort Collins, Colorado,   signature of the updraft velocity on the developing convec-
USA.                                                                      tive elements that have the potential to become severe
                                                                          convective storms, or already constitute the feeders of such
Copyright 2008 by the American Geophysical Union.
0148-0227/08/2007JD008600$09.00                                           storms. The severe storm microphysical signature, as man-

                                                                   D04208                                                       1 of 22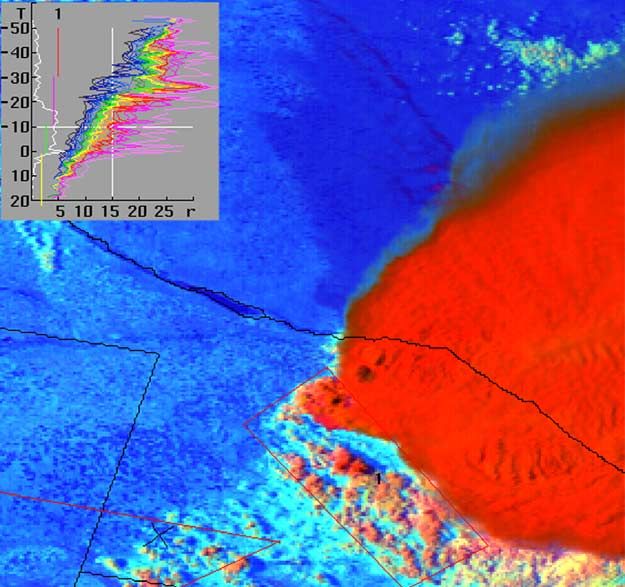
D04208                      ROSENFELD ET AL.: SATELLITE DETECTION OF SEVERE STORMS                                        D04208

ifested by the vertical profile of cloud-particle effective       of the current geostationary satellites are too coarse to
radius, is caused by the greater updrafts delaying to greater     provide direct measurements of the updraft velocities in
heights the conversion of cloud drops to hydrometeors and         severe convective clouds. The overshooting depth of cloud
the glaciation of the cloud. The greater wind shear tilts the     tops above the tropopause can serve as a good measure of
convective towers of the prestorm and feeder clouds and           the vigor of the storms, but unfortunately the brightness
often deflects the strongly diverging cloud tops from ob-         temperatures of overshooting cloud tops does not reflect
scuring the feeders. This allows the satellite a better view of   their heights because of the generally isothermal nature of
the microphysical response of the clouds to the strong            the penetrated lower stratosphere.
updrafts. This satellite severe storm signature appears to           [6] Overshooting severe convective storms often develop
primarily reflect the updraft speed of the growing clouds,        a V shape feature downwind of their tallest point, which
which is normally associated with the CAPE. However,              appears as a diverging plume above the anvil top [Heymsfield
wind shear is as important as CAPE for the occurrence of          et al., 1983; McCann, 1983]. The plume typically is highly
severe convective storms, in addition to helicity that is an      reflective at 3.7 mm, which means that it is composed of
important ingredient in intense tornadoes. It is suggested that   very small ice particles [Levizzani and Setvák, 1996; Setvák
the effectiveness of the satellite retrieved severe storm         et al., 2003]. A warm spot at the peak of the V is also a
signature and inferred updraft speed may not only depend          common feature, which is likely caused by the descending
on the magnitude of the CAPE, but also on the wind shear,         stratospheric air downwind of the overshooting cloud top.
and perhaps also on the helicity. This can occur when some        Therefore the V-shape feature is a dynamic manifestation
of the horizontal momentum is converted to vertical mo-           of overshooting tops into the lower stratosphere when
mentum in a highly sheared environment when strong                strong storm-relative winds occur there. The observation
inflows are diverted upward, as often happens in such             of a V-shape feature reveals the existence of the combina-
storms. While this study focuses on exploring a new concept       tion of intense updrafts and wind shear. Adler et al. [1983]
of satellite application, eventually a combined satellite with    showed that most of the storms that they examined in the
sounding algorithm is expected to provide the best skill.         US Midwest (75%) with the V-shape had severe weather,
  [4] Section 1.1 of this paper provides a short review of        but many severe storms (45%) did not have this feature.
the relation between the updraft velocity and the vertical        Adler et al. [1983] showed also that the rate of expansion of
evolution of mixed phase precipitation and the glaciation of      storm anvils was statistically related positively to the
convective clouds. Section 2.1 introduces the conceptual          occurrences of hail and tornadoes. All this suggests that
model for the methodology for the satellite retrieval of a        satellite inferred updraft velocities and wind shear are good
severe storm microphysical signature and supports it on the       indicators for severe storms. While wind shear is generally
basis of previous observations and theoretical considera-         easily inferred from synoptic weather analyses and predic-
tions. Section 2.2 reviews the satellite methodology to           tions, the challenge is the inference of the updraft intensities
retrieve the vertical evolution of cloud properties and           from the satellite data. The manifestation of updraft veloc-
precipitation forming processes. Sections 2.3 and 2.4 apply       ities in the cloud microstructure and thermodynamic phase,
this methodology qualitatively to microphysically continen-       which can be detected by satellites, is the subject of the next
tal and maritime convective clouds. Section 2.5 considers         section.
the role of the vertical wind shear. A quantitative application
is tested in section 3 on a data set of satellite measurements    1.2. Anvil Tops With Small Particles at 40°C
and severe storm reports. The results and their significance      Reflecting Homogeneously Glaciating Clouds
are discussed in section 4.                                         [7] Small ice particles in anvils or cirrus clouds typically
                                                                  form as a result of either vapor deposition on ice nuclei, or
1.1. Direct Observations of Cloud Top Dynamics for                by homogeneous ice nucleation of cloud drops which
Inferences of Updraft Velocities and Storm Severity               occurs at temperatures colder than 38°C. In deep convec-
  [5] Updraft speeds are the most direct measure of the           tive clouds heterogeneous ice nucleation typically glaciates
vigor of a convective storm. The updraft speeds of growing        the cloud water before reaching the 38°C threshold.
convective clouds can be seen in the rise rate of the cloud       Clouds that glaciate mostly by heterogeneous nucleation
tops, or measured from satellites as the cooling rate of the      (e.g., by ice multiplication, ice-water collisions, ice nuclei
tops of these clouds. A typical peak value of updrafts of         and vapor deposition) are defined here as glaciating hetero-
severe storms exceeds 30 ms1 [e.g., Davies-Jones, 1974].         geneously. Clouds in which most of their water freezes by
Such strong updrafts are too fast to be detected by a             homogeneous nucleation are defined here as undergoing
sequence of geostationary satellite images, because even          homogeneous glaciation. Only a small fraction of the cloud
during a 5 min rapid scan an air parcel moving at 30 ms1         drops freezes by interaction with ice nuclei, because the
covers 9 km if continued throughout that time (superrapid         concentrations of ice nuclei are almost always smaller by
scans of up to one per 30– 60 s can be done, but only for a       more than four orders of magnitude than the drop concen-
small area and not on a routine operational basis). However,      trations (ice nuclei of 0.01 cm3 whereas drop concen-
such strong updrafts occur mainly at the supercooled levels,      trations are typically >100 cm3) before depletion by
where the added height of 9 km will bring the cloud top to        evaporation, precipitation or glaciation. Therefore most
the tropopause in less than 5 min. In addition, the cloud         drops in a heterogeneously glaciating cloud accrete on
segments in which such strong updrafts occur are typically        preexisting ice particles, or evaporate for later deposition
smaller than the resolution of thermal channels of present-       on the existing cloud ice particles. This mechanism produ-
day geostationary satellites (5 to 8 km at midlatitudes). This    ces a glaciated cloud with ice particles that are much fewer
demonstrates that both the spatial and temporal resolutions       and larger than the drops that produced them. In fact,

                                                             2 of 22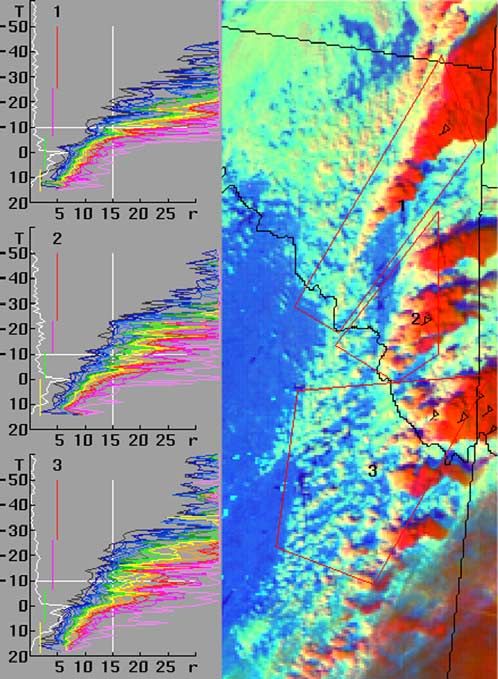
D04208                      ROSENFELD ET AL.: SATELLITE DETECTION OF SEVERE STORMS                                      D04208

                                                                   other processes, can the cloud be defined as undergoing
                                                                   homogeneous glaciation. The first in situ aircraft observa-
                                                                   tions of such clouds were made recently, where cloud
                                                                   filaments with LWC reaching half [Rosenfeld and Woodley,
                                                                   2000] to full [Rosenfeld et al., 2006b] adiabatic values were
                                                                   measured in west Texas and in the lee of the Andes in
                                                                   Argentina, respectively. This required updraft velocities
                                                                   exceeding 40 ms1 in the case of the clouds in Argentina,
                                                                   which produced large hail. The aircraft measurements of the
                                                                   cloud particle size in these two studies revealed similar
                                                                   cloud particle sizes just below and above the level where
                                                                   homogeneous glaciation occurred. This means that the
                                                                   homogeneously glaciating filaments in these clouds were
                                                                   feeding the anvils with frozen cloud drops, which are
                                                                   distinctly smaller than the ice particles that rise into the
                                                                   anvils within a heterogeneously glaciating cloud.
Figure 1. A T-re analysis of the cloud top microstructure            [10] In summary, there are three types of anvil composi-
of a Cb (cumulonimbus) that has an anvil partially formed          tions, caused by three glaciation mechanisms of the con-
by homogeneous freezing. The image is based on a NOAA-             vective elements: (1) Large ice particles formed by
AVHRR overpass on 8 June 1998, 2212 UTC, over New                  heterogeneous glaciation; (2) homogeneous glaciation
Mexico. The domain is 220  150 AVHRR 1-km pixels.                 of LWC that was generated at low levels in the cloud, and
The image is an RGB composite where the visible channel            (3) homogeneous glaciation of newly nucleated cloud drops
modulates the red, 3.7 mm reflectance modulates the green,         near or above the 38°C isotherm level This third mech-
and 10.8 mm brightness temperature modulates the blue              anism occurs mostly in cirrocumulus or in high wave
[after Rosenfeld and Lensky, 1998]. Brighter 3.7 mm                clouds, as shown by Rosenfeld and Woodley [2003,
reflectance (greener) means smaller cloud top particles.           Figure 7a]. The manifestations of the first two mechanisms
The inset shows the T-re lines for the clouds in the marked        in the composition of anvils are evident in the satellite
rectangle. The different colored lines represent different T-re    analysis of cloud top temperature (T) versus cloud top
percentiles every 5% from 5% (leftmost line) to 100%               particle effective radius (re) shown in Figure 1. In this
(rightmost line), where the bright green is the median. The        red-green-blue composite brighter visible reflectance is
white line on the left side of the inset is the relative           redder, smaller cloud top particles look greener, and warmer
frequency of the cloudy pixels. The vertical lines show the        thermal brightness temperature is bluer. This analysis meth-
vertical extent of the microphysical zones: yellow for the         odology [Rosenfeld and Lensky, 1998] is reviewed in
diffusional growth, green for the coalescence zone (does not       section 2.2 of this paper. The large ice particles formed by
occur in this case), and pink for the mixed phase and red for      heterogeneous glaciation appear red in Figure 1 and occur at
the glaciated zone. The glaciated cloud elements that do not       cloud tops warmer than the homogeneous glaciation tem-
exceed the 38°C isotherm appear red and have very large           perature of 38°C. The yellow cloud tops in Figure 1 are
re that is typical of ice particles that form by heterogeneous     colder than 38°C and are composed of small ice particles
freezing in a mixed phase cloud, whereas the colder parts of       that probably formed by homogeneous glaciation. The
the anvil are colored orange and are composed of small             homogeneously glaciated cloud water appeared to have
particles, which must have formed by homogeneous                   ascended with the strongest updrafts in these clouds and
freezing of the cloud drops in the relatively intense updraft      hence formed the tops of the coldest clouds.
that was necessary to form the anvil portions above the              [11] The homogeneous freezing of LWC generated at low
38°C isotherm.                                                    levels in convective clouds is of particular interest here,
                                                                   because it is indicative of updrafts that are sufficiently
heterogeneous glaciation of convective clouds is a major           strong such that heterogeneous ice nucleation would not
precipitation-forming mechanism.                                   have time to deplete much of the cloud water before
  [ 8 ] Heterogeneously glaciating clouds with intense             reaching the homogeneous glaciation level. As such, the
updrafts (>15 ms1) may produce large supersaturations             satellite signature in the form of enhanced 3.7-mm reflec-
that, in the case of a renewed supply of CCN from the              tance can be used as an indicator of the occurrence of
ambient air aloft, can nucleate new cloud drops not far            strong updrafts, which in turn are conducive to the occur-
below the 38°C isotherm, which then freeze homoge-                rence of severe convective storms. This realization motivat-
neously at that level [Fridlind et al., 2004; Heymsfield et al.,   ed Lindsey et al. [2006] to look for anvils with high
2005]. In such cases the cloud liquid water content (LWC)          Geostationary Operational Environmental Satellite (GOES)
is very small, not exceeding about 0.2 g m3. This mech-           3.9-mm reflectance as indicators of intense updrafts. They
anism of homogeneous ice nucleation occurs, of course,             showed that cloud tops with 3.9-mm reflectance >5%
also at temperatures below 38°C, and is a major process           occurred for t < 100 s, where t is the parameterized cloud
responsible for the formation of small ice particles in high-      drop residence time in the updraft between cloud base and
level strong updrafts of deep convective clouds, which are         the 38°C isotherm level. Lindsey et al. [2006] calculated
typical of the tropics [Jensen and Ackerman, 2006].                t according to equation (1):
  [9] Only when much of the condensed cloud water
reaches the 38°C isotherm before being consumed by                                     t ¼ DLCL=38 =wmax                   ð1Þ

                                                              3 of 22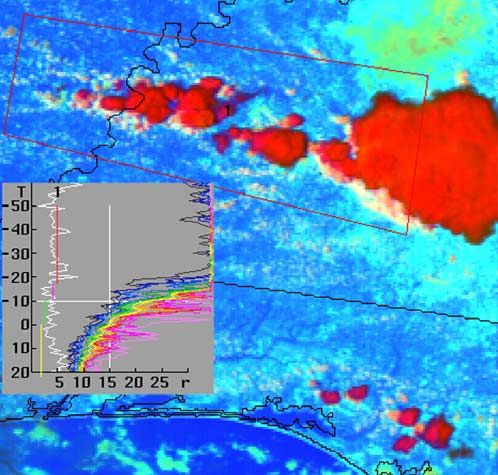
D04208                      ROSENFELD ET AL.: SATELLITE DETECTION OF SEVERE STORMS                                         D04208

where                                                              the dominant cause for droplet growth. This is so because
                                       0:5                         (1) the amount of condensed cloud water in the rising parcel
                     wmax ¼ ð2 CAPEÞ                        ð2Þ    depends only on the height above cloud base, regardless of
and DLCL/38 is the distance (m) between the LCL and the           the rate of ascent of the parcel, and (2) most cloud drops
38°C isotherm level. The requirement for t < 100 s for            were formed near cloud base and their concentrations with
homogeneous glaciation can be contrasted with the in situ          height do not depend on the strength of the updraft as long
aircraft observations of glaciation time of about 7 min at         as drop coalescence is negligible.
temperatures of 32°C to 35°C [Rosenfeld and Woodley,               [16] The time for onset of significant coalescence and
2000]. This reflects the fact that actual updraft velocities are   warm rain depends on the cloud drop size. That time is
much smaller than wmax.                                            shorter for larger initial drop sizes [Beard and Ochs, 1993].
  [12] The concept of ‘‘residence time’’ fails for clouds that     This time dependency means also that a greater updraft
have warm bases, because even with CAPE that is condu-             would lead to the onset of precipitation at a greater height in
cive to severe storms heterogeneous freezing is reached            the cloud. This is manifested as a higher first precipitation
most of the times. This is manifested by the fact that clouds      radar echo height. At supercooled temperatures the small
with residence times less than 100 s and hence with 3.9-mm         raindrops freeze rapidly and continue growing by riming as
reflectivities greater than 5%, were almost exclusively west       graupel and hail. The growth rate of ice hydrometeors
of about 100°W, where cloud base heights become much               exceeds significantly that of an equivalent mass of raindrops
cooler and higher [Lindsey et al., 2006].                          [Pinsky et al., 1998]. Conversely, in the absence of rain-
  [13] Aerosols play a major role in the determination of the      drops, the small cloud drops in strong updrafts can remain
vertical profiles of cloud microstructure and glaciation.          liquid up to the homogeneous glaciation level [Rosenfeld
Khain et al. [2001] simulated with an explicit microphysical       and Woodley, 2000]. Filaments of nearly adiabatic liquid
processes model the detailed microstructure of a cloud that        water content were measured up to the homogeneous
Rosenfeld and Woodley [2000] documented, including the             freezing temperature of 38°C by aircraft penetrations into
homogeneous glaciation of the cloud drops that had nucle-          feeders of severe hailstorms with updrafts exceeding 40
ated near cloud base at a temperature of about 9°C. When           ms1 [Rosenfeld et al., 2006b]. Only very few small ice
changing in the simulation from high to low concentrations         hydrometeors were observed in these cloud filaments. These
of CCN, the cloud drop number concentration was reduced            feeders of severe hailstorms produced 20 dBZ first echoes at
from 1000 to 250 cm3. Coalescence quickly increased the           heights of 8 – 9 km.
cloud drop size with height and produced hydrometeors that           [17] An extreme manifestation of strong updrafts with
froze readily and scavenged almost all the cloud water at          delayed formation of precipitation and homogeneous
23°C, well below the homogeneous glaciation level. This           glaciation is the echo free vault in tornadic and hail
is consistent with the findings of Stith et al. [2004], who        storms [Browning and Donaldson, 1963; Browning, 1964;
examined the microphysical structure of pristine tropical          Donaldson, 1970], where the extreme updrafts push the
convective clouds in the Amazon and at Kwajalein, Mar-             height for the onset of precipitation echoes to above 10 km.
shall Islands. They found that the updrafts glaciated rapidly,     However, the clouds that are the subject of main interest
most water being removed between 5 and 17°C, and                 here are not those that contain the potential echo free vault,
suggested that a substantial portion of the cloud droplets         because the vertical microstructure of such clouds is very
were frozen at relatively warm temperatures.                       rarely exposed to the satellite view. It is shown in this study
  [14] In summary, the occurrence of anvils composed of            that the feeder clouds to the main storm and adjacent
homogeneously glaciated cloud drops is not a unique                cumulus clouds possess the severe storm satellite retrieved
indicator of intense updrafts, because it depends equally          microphysical signature. The parallel to the echo free vault
strongly on the depth between cloud base and the 38°C             in these clouds is a very high precipitation first echo height,
isotherm level. The microphysical evolution of cloud drops         as documented by Rosenfeld et al. [2006b].
and hydrometeors as a function of height above cloud base            [18] Although the role of updraft speed in the vertical
reflects much better the combined roles of aerosols and            growth of cloud drops and onset of precipitation is high-
updrafts, with some potential of separating their effects. If      lighted, the dominant role of CCN concentrations at cloud
so, retrieved vertical microphysical profiles can provide          base, as has been shown by Andreae et al. [2004], should be
information about the updraft intensities. This will be used       kept in mind. Model simulations of rising parcels under
in the next section as the basis for the conceptual model of       different CCN and updraft profiles were conducted for this
severe storm microphysical signatures.                             paper to illustrate the respective roles of those two factors in
                                                                   determining the relations between cloud composition, pre-
                                                                   cipitation processes and the updraft velocities. Although this
2. A Conceptual Model of Severe Storm                              parcel model [Pinsky and Khain, 2002] has 2000 size bins
Microphysical Signatures                                           and has accurate representations of nucleation and coales-
2.1. Vertical Evolution of Cloud Microstructure as an              cence processes, being a parcel prevents it from producing
Indicator of Updraft Velocities and CCN Concentrations             realistic widths of drop size distributions because of various
  [15] The vertical evolution of satellite-retrieved, cloud        cloud base updrafts and supersaturation histories of cloud
top – particle, effective radius is used here as an indicator      microparcels. Therefore the calculations presented here can
of the vigor of the cloud. In that respect it is important to      be viewed only in a relative qualitative sense.
note that convective cloud top drop sizes do not depend on           [19] A set of three updraft profiles (see Figure 2) and four
the vertical growth rate of the cloud (except for cloud base       CCN spectra were simulated in the parcel model. Cloud
updraft), as long as vapor diffusion and condensation is           base updraft was set to 2 ms1 for all runs. The maximum

                                                              4 of 22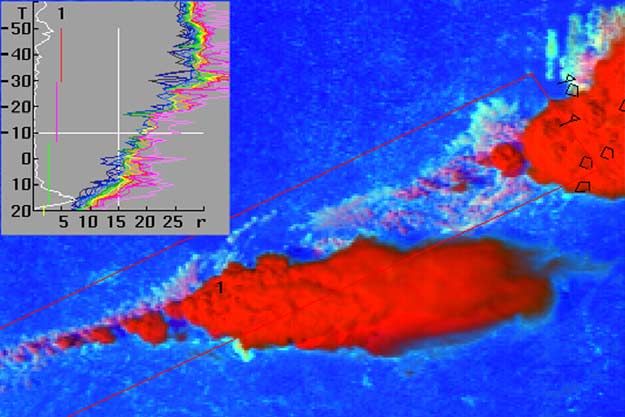
D04208                     ROSENFELD ET AL.: SATELLITE DETECTION OF SEVERE STORMS                                     D04208

Figure 2. Updraft profiles for the simulations presented in
Figures 4 and 5. The updrafts are denoted as U1 to U3 from
the weakest to the strongest.

simulated drop concentrations just above cloud base were
60, 173, 460 and 1219 cm3 for the four respective CCN
spectra, denoted as CCN1 to CCN4 in Figures 3 – 5. No
giant CCN were incorporated, because their addition results
in a similar response to the reduction of the number
concentrations of the submicron CCN, at least when using        Figure 4. Simulated cloud drop effective radius as a
the same parcel model [see Rosenfeld et al., 2002, Figure 4].   function of height for various combinations of updraft
The dependence of activated cloud drop concentration on         profiles and cloud base drop concentrations. The updrafts
cloud base updraft speed was simulated with the same            are shown in Figure 2, and the CCN create 60, 173, 460 and
parcel model (see Figure 3). According to that, cloud base      1219 drops cm3 at cloud base, for CCN1 to CCN4,
updraft plays only a secondary role to the CCN in deter-        respectively. The cloud base temperature is 20°C. Note the
mining the cloud drop number concentrations near cloud          exclusive role of the CCN up to the height of the onset of
base.                                                           coalescence, which is where, for a given CCN, the lines for
  [20] Figure 4 shows that the updraft does not affect the      the different updrafts separate.
cloud drop size below the height of the onset of coales-
cence, which is the point where the lines of the various
updrafts for a given CCN diverge. The height of coales-
cence onset depends mainly on height and very little on         dominated by the size of the cloud drops, which in turn
updraft speed. This is so because the coalescence rate is       depends only on cloud depth in the diffusional growth zone.
                                                                  [21] The updraft speed does affect the height of the
                                                                onset of significant precipitation (HR), which is defined in
                                                                Figure 5 as rainwater content/cloud water content = 0.1.
                                                                This is justified by the remarkably consistent relations
                                                                between CCN concentrations and vertical evolution of drop
                                                                size distribution up to the height of the onset of warm rain
                                                                (HR), as documented by Andreae et al. [2004] and Freud et
                                                                al. [2005]. The sensitivity of HR to a change of updraft from
                                                                U1 to U3 can be quantified as HR rising by 1000 m for
                                                                CCN1, and by 3000 m for CCN4. The sensitivity of HR
                                                                to change of CCN from CCN1 to CCN4 can be quantified
                                                                as HR rising by 2000 m for U1, and by 4000 m for U3.
                                                                Although the model does not simulate ice processes,
                                                                these values are still valid qualitatively for vigorous super-
                                                                cooled convective clouds [see, e.g., Rosenfeld et al., 2006b,
                                                                Figures 7 and 8], because the main precipitation embryos in
                                                                such clouds come from the coalescence process, except for
                                                                clouds with unusually large concentrations of ice nuclei
                                                                and/or giant CCN.
Figure 3. Simulated dependence of cloud drop number               [22] This analysis shows that the vigor of the clouds can
concentrations on cloud base updraft for the CCN spectra        be revealed mainly by delaying the precipitation processes
used in the simulations of Figures 4 and 5.                     to greater heights, and that the sensitivity becomes greater

                                                           5 of 22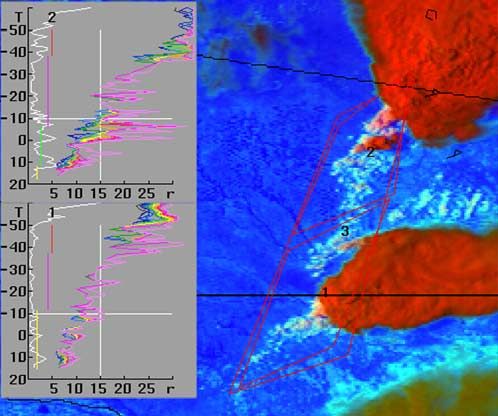
D04208                     ROSENFELD ET AL.: SATELLITE DETECTION OF SEVERE STORMS                                      D04208

                                                                 cloud-droplet growth with depth above cloud base. Such
                                                                 rapid growth can occur there only by drop coalescence.
                                                                   [27] 3. The rainout zone is a zone where re remains stable
                                                                 between 20 and 25 mm, probably determined by the
                                                                 maximum drop size that can be sustained by rising air near
                                                                 cloud top, where the larger drops are precipitated to lower
                                                                 elevations and may eventually fall as rain from the cloud
                                                                 base. This zone is so named, because droplet growth by
                                                                 coalescence is balanced by precipitation of the largest drops
                                                                 from cloud top. Therefore the clouds seem to be raining out
                                                                 much of their water while growing. The radius of the drops
                                                                 that actually rain out from cloud tops is much larger than the
                                                                 indicated re of 20– 25 mm, being at the upper end of the
                                                                 drop size distribution there.
                                                                   [28] 4. The mixed phase zone is a zone of large indicated
                                                                 droplet growth rate, occurring at T < 0°C, due to coales-
                                                                 cence as well as to mixed phase precipitation formation
                                                                 processes. Therefore the mixed phase and the coalescence
                                                                 zones are ambiguous at 0 < T < 38°C. The conditions for
                                                                 determining the mixed phase zone within this range are
                                                                 specified by Rosenfeld and Lensky [1998].
                                                                   [29] 5. The glaciated zone is a nearly stable zone of re
                                                                 having a value greater than that of the rainout zone or the
                                                                 mixed phase zone at T < 0°C.
                                                                   [30] All these microphysical zones are defined only for
                                                                 convective cloud elements. Multilayer clouds start with
                                                                 small re at the base of each cloud layer. This can be used
Figure 5. Same as Figure 4 but for the ratio of rainwater        to distinguish stratified from convective clouds by their
content/cloud water content.                                     microstructure. Typically, a convective cloud has a larger re
                                                                 than a layer cloud at the same height, because the convec-
                                                                 tive cloud is deeper and contains more water in the form of
for clouds forming in environments with greater concen-          larger drops.
trations of small CCN.                                           2.3. T-re Relations of Severe Convective Storms in
2.2. Satellite Inference of Vertical Microphysical               Clouds With Small Drops
Profiles of Convective Clouds                                      [31] A microphysically continental cloud is defined as
  [23] The vertical evolution of cloud top particle size can     such when CCN concentrations are sufficiently large to
be retrieved readily from satellites, using the methodology      induce a drop concentration that is sufficient to suppress
of Rosenfeld and Lensky [1998] to relate the retrieved
effective radius (re) to the temperature (T) of the tops of
convective clouds. An effective radius >14 mm indicates
precipitating clouds [Rosenfeld and Gutman, 1994]. The
maximum detectable indicated re is 35 mm, because of
saturation of the signal. The T-re relations are obtained from
ensembles of clouds having tops covering a large range of
T. This methodology assumes that the T-r e relations
obtained from a snap shot of clouds at various stages of
their development equals the T-re evolution of the top of an
individual cloud as it grows vertically. This assumption was
validated by actually tracking such individual cloud ele-
ments with a rapid scanning geostationary satellite and
comparing with the ensemble cloud properties [Lensky
and Rosenfeld, 2006].
  [24] On the basis of the shapes of the T-re relations (see
Figure 6), Rosenfeld and Lensky [1998] defined the follow-
ing five microphysical zones in convective clouds:
  [25] 1. The diffusional droplet growth zone is character-      Figure 6. Classification scheme of convective clouds into
ized by very slow growth of cloud droplets with depth            microphysical zones, according to the shape of the T-re
above cloud base, indicated by shallow slope of dre/dT.          relations [after Rosenfeld and Woodley, 2003]. The micro-
  [26] 2. The droplet coalescence growth zone is character-      physical zones can change considerably between micro-
ized by large increase of the droplet growth rate dre/dT at      physically continental and maritime clouds, as illustrated by
T warmer than freezing temperatures, indicating rapid            Rosenfeld and Woodley [2003, Figure 6].

                                                            6 of 22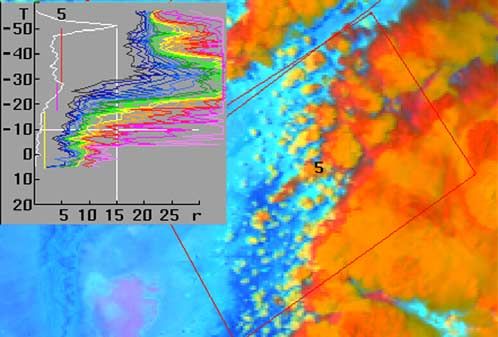
D04208                     ROSENFELD ET AL.: SATELLITE DETECTION OF SEVERE STORMS                                      D04208

         Figure 7. A conceptual model of the way T-re relations of convective clouds are affected by enhanced
         updrafts to extreme values. The vertical green line represents the precipitation threshold of re = 14 mm
         [Rosenfeld and Gutman, 1994]. The horizontal line at T = 38°C represents the homogeneous freezing
         isotherm. (a) Microphysically maritime clouds with low and warm bases and small concentrations of
         CCN and (b) clouds with high CCN concentrations or high and cold bases. In reality most cases occur
         between these two end types.

drop coalescence and warm rain in the lowest several (2 to 3)
km of the cloud. According to Figure 5 this translates to drop
concentrations greater than about 400 cm3 near cloud base.
  [32] Even with small CCN concentrations, a sufficiently
low cloud base temperature can always be found such that
the diffusional zone of cloud drops in the T-re line will
extend through the homogeneous glaciation temperature
isotherm, even for moderate updraft velocities. This is
the case for many of the high plains storms over the western
USA, as already noted by Lindsey et al. [2006]. This
situation is represented schematically by line F of
Figure 7b. Figure 7 illustrates the T-re relations under
various CCN and updraft scenarios according to the con-
ceptual model.
  [33] Alternatively, a cloud with an extremely large num-
ber of small droplets, such as in a pyro-Cb (see example
given by Rosenfeld et al. [2006a, Figure 11]), can occur
entirely in the diffusional growth zone up to the homoge-
neous glaciation level even if it does not have very strong
updrafts. In any case, a deep (>3 km) zone of diffusional
growth is indicative of microphysically continental clouds,
where smaller re means greater heights and lower temper-
atures that are necessary for the transition from diffusional
to the mixed phase zone, which is a manifestation of the         Figure 8a. Same as Figure 1 but for a nonsevere
onset of precipitation. This is demonstrated by the model        convective storm. The image is based on the NOAA-
simulations shown in Figures 4 and 5 here. Observations of       AVHRR overpass on 28 July 1998, 2024 UTC, over a
such T-re relations in cold and high-base clouds over New        domain of 232  222 AVHRR 1-km pixels. The cloud
Mexico are shown in Figure 1.                                    system is just to the north of the Florida Panhandle. Note the
  [34] Figure 7b illustrates the fact that a highly microphys-   rapid increase of re toward an early glaciation at 17°C.
ically continental cloud with a warm base (e.g., >10°C) has      This is case 9855 (see Appendix A), with Tbase = 20°C,
a deep zone of diffusional cloud droplet growth even for         Rbase = 8 mm, T14 = 5°C, TL = 18°C, dTL = 38°C,
weak updrafts (line A and Figure 8a). The onset of precip-       Tg = 20°C, and Rg = 33.5 mm (see parameter definitions
itation is manifested as the transition to the mixed phase       in Figure 9).

                                                            7 of 22
D04208 ROSENFELD ET AL.: SATELLITE DETECTION OF SEVERE STORMS D04208
[35] Further invigoration of the clouds would shift up-
ward the onset of mixed phase and glaciated zones. How-
ever, glaciation occurs fully and unconditionally at the
homogeneous glaciation temperature of 38°C. Any liquid
cloud drops that reach to this level freeze homogeneously to
same-size ice particles. If most cloud water was not rimed
on ice hydrometeors, it would have a radiative impact on the
retrieved effective radius and greatly decrease the re of the
glaciated cloud, as shown in line C of Figure 7b. Yet
additional invigoration of the updraft would further shift
upward and blur the onset of the precipitation, and reduce
the re of the glaciated cloud above the 38°C isotherm,
until the ultimate case of the most extreme updraft, where
the T-re profile becomes nearly linear all the way up to the
homogeneous freezing level. This situation is illustrated by
line E in Figures 7a and 7b and in Figures 8c– 8e.
2.4. T-re Relations of Severe Convective Storms in
Clouds With Large Drops
[36] Line A in Figure 7a is similar to the scheme shown in
Figure 6, where a microphysically maritime cloud with
weak updrafts develops warm rain quickly and a rainout
zone, followed by a shallow mixed phase zone. When
strengthening the updraft (line B), the time that is needed
for the cloud drops in the faster rising cloud parcel to
coalesce into warm rain is increased. Consequently, the
rainout zone is reached at a greater height, but the onset of
the mixed phase zone is anchored to the slightly super-
cooled temperature of about 5°C. This decreases the depth
of the rainout zone. The greater updrafts push the glaciation
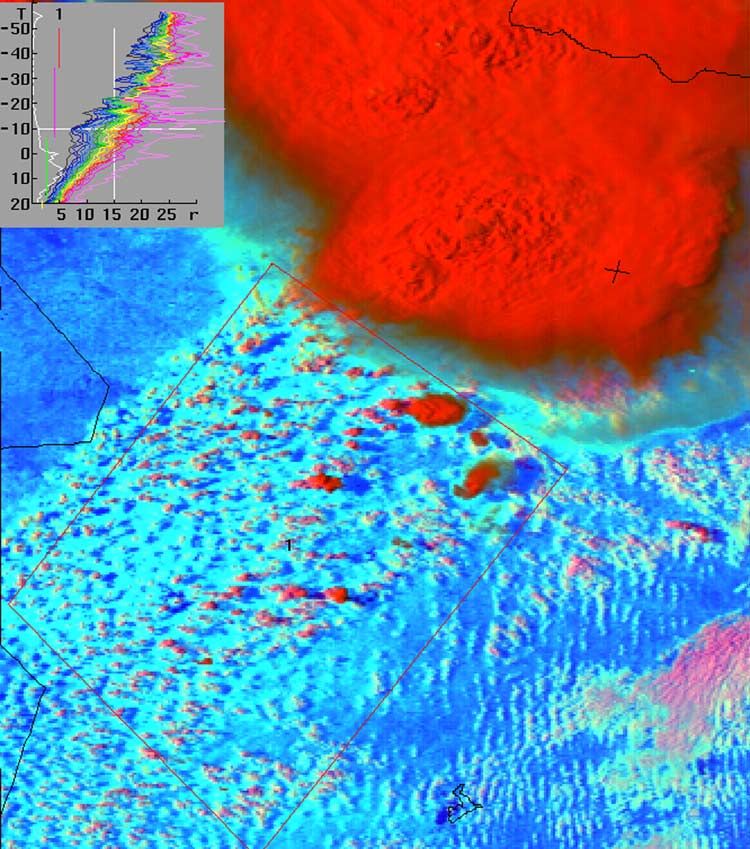
Figure 8b. Same as Figure 1 but for three hail storms. The
image is based on the NOAA-AVHRR overpass on 5 March
1999, 2132 UTC, at a domain of 220 300 AVHRR 1-km
pixels. The cloud system is near the eastern border of
Oklahoma. The locations of reported hail (0.75 – 1.75 inch)
are marked by small triangles. Note the deep supercooled
layer with glaciation temperature of about 25 for the
median re (denoted by the bottom of the vertical red line)
and less than 30°C for the smallest re. This is case 9901
(see Appendix A), with Tbase = 8°C, Rbase = 5 mm, T14 =
12°C, TL = 26°C, dTL = 34°C, Tg = 27°C, and Rg =
32.4 mm (see parameter definitions in Figure 9).
zone, which occurs at progressively greater heights and
colder temperatures for clouds with stronger updrafts (line B
and Figure 8b). The glaciation temperature also shifts to
greater heights and colder temperatures with increasing
updrafts. From the satellite point of view the cloud is
determined to be glaciated when the indicated re reaches
saturation. This occurs when the large ice crystals and
Figure 8c. Same as Figure 1 but for tornadic storms. The
hydrometeors dominate the radiative signature of the cloud.
image is based on the NOAA-AVHRR overpass on 29 June
Some supercooled water can still exist in such a cloud, but
1993, 2203 UTC, over a domain of 251 210 AVHRR 1-km
most of the condensates are already in the form of large ice
pixels. The cloud occurred in north central Nebraska. The
particles that nucleated heterogeneously and grew by riming
locations of reported hail and tornadoes within the hour of the
and fast deposition of water vapor that is in near equilibrium
image are marked by small triangles and rectangles,
with liquid water. Such was the case documented by
respectively. The north storm produced a F2 tornado at
Fridlind et al. [2004] in convective clouds that ingested
2149 UTC. Note the re remaining very small up to the
midtropospheric CCN in Florida, where satellite-retrieved
homogeneous freezing temperature of 39°C. The scarcity
T-re relations indicated a glaciation temperature of 29°C
of points in the interval of 14°C to 38°C disqualified this
(not shown).
case to be included in the analyses.
8 of 22D04208 ROSENFELD ET AL.: SATELLITE DETECTION OF SEVERE STORMS D04208
Figure 8d. Same as Figure 1 but for a tornadic storm with 4.5 inch hail. The image is based on the
NOAA-AVHRR overpass on 29 June 2000, 2221 UTC, over a domain of 282 264 AVHRR 1-km
pixels. The cloud occurred in southwestern Nebraska. The locations of a reported F1 tornado at 2328 UTC
is marked by a rectangle. Note that the tornado occurred in a region that had little cloud development
68 min before the tornadic event. This demonstrates that there is predictive value in the cloud field before
any of the clouds reach severe stature. A hail swath on the ground can be seen as the dark purple line
emerging off the north flank of the storm, oriented NW-SE. Two hail gushes are evident on the swath near
the edge of the storm. The precipitation swath appears as darker blue because of the cooler wet ground.
Note the linear profile of the T-re lines, and the glaciation occurs at the small re = 25 mm, in spite of the
very warm cloud base temperature near 20°C. This is case 0046 (see Appendix A), with Tbase = 8°C,
Rbase = 5.5 mm, T14 = 21°C, TL = 31°C, dTL = 39°C, Tg = 32°C, and Rg = 20.6 mm (see
parameter definitions in Figure 9).
level to colder temperatures. Additional invigoration of the clouds and feeders is correlated with the vigor of the main
updraft (line C) eliminates the rainout zone altogether and updraft. This has implications for forecasting, because the
further decreases the glaciation temperature, thus creating a potential for severe storms can be revealed already by the
linear T-re line up to the glaciation temperature. Even small isolated clouds that grow in an environment that is
greater updrafts decrease the rate of increase of re with prone to severe convective storms when the clouds are
decreasing T, so that the glaciation temperature is reached at organized.
even lower temperatures. It takes an extreme updraft to [38] On the basis of the physical considerations above it
drive the glaciation temperature to the homogeneous glaci- can be generalized that a greater updraft is manifested as a
ation level, as shown in lines D and observed in Figure 8f. combination of the following trends in observable T-re
[37] Most cases in reality occur between the two end features: (1) Glaciation temperature is reached at a lower
types that are illustrated schematically in Figure 7. Exam- temperature, (2) a linear T-re line occurs for a greater
ples of T-re lines for benign, hailing and tornadic convective temperature interval, and (3) the re of the cloud at its
storms are provided in Figure 8. It is remarkable that the T- glaciation temperature is smaller. These criteria can be used
re relations occur not only in the feeders of the main clouds, to identify clouds with sufficiently strong updrafts to
but also in the smaller convective towers in the area from possess a significant risk of large hail and tornadoes. The
which the main storms appear to propagate (see Figures 8e feasibility of this application is examined in the next
and 8f). This does not imply that the smaller convective section.
towers and the upshear feeders have updraft speeds similar
to the main storms, because these core updrafts at the 2.5. Roles of Vertical Growth Rate and Wind Shear
mature stage of the storms are typically obscured from the in Measuring T-re Relations
satellite view. However, it does suggest that the satellite [39] Severe convective storms often have updrafts ex-
inferred updraft-related microstructure of those smaller ceeding 30 ms1. At this rate the air rises 9 km within 5 min.
9 of 22D04208 ROSENFELD ET AL.: SATELLITE DETECTION OF SEVERE STORMS D04208
Figure 8e. Same as Figure 1 but for a tornadic storm with 2.5 inch hail. The image is based on the
NOAA-AVHRR overpass on 30 April 2000, 2214 UTC, over a domain of 333 377 AVHRR 1-km
pixels. The cloud occurred just to the SE of the Texas panhandle. The location of a reported F3 tornado at
2240 UTC is marked by a rectangle. Note the very linear profile of the T-re lines, and the glaciation occurs
at the small re = 25 mm, in spite of the very warm cloud base temperature of near 20°C, as in Figure 8d. It is
particularly noteworthy that this T-re is based on clouds that occurred ahead of the main storm into an area
through which the storm propagated. The same is indicated in Figure 8d but to a somewhat lesser extent.
This is case 0018 (see Appendix A), with Tbase = 18°C, Rbase = 4.4 mm, T14 = 15°C, TL = 37°C,
dTL = 55°C, Tg = 38°C, and Rg = 23.9 mm (see parameter definitions in Figure 9).
The tops form anvils that diverge quickly, and without are tilted and provide the satellite an opportunity to view
strong wind shear the anvil obscures the new feeders to from above their sloping tops and the vertical evolution of
the convective storm, leaving a relatively small chance for their T-re relations (see example in Figures 8b and 8d). In
the satellite snap shot to capture the exposed tops of the some cases the strong divergence aloft produces an anvil
vigorously growing convective towers. Therefore, in a that obscures the upshear slope of the feeders from the
highly unstable environment with little wind shear the T-re satellite view. Yet unorganized convective clouds that often
relations are based on the newly growing storms and on the pop up in the highly unstable air mass into which the storm
cumulus field away from the mature anviled storms. An is propagating manage to grow to a considerable height
example of moderate intensity little-sheared convection is through the highly sheared environment and provide the
shown in Figure 8a. satellite view necessary to derive their T-re relations. Inter-
[40] When strong wind shear is added, only strong and estingly and importantly, the T-re relations of these prestorm
well organized updrafts can grow into tall convective clouds already possess the severe storm microphysical
elements that are not sheared apart. The convective towers signature, as evident in Figure 8e. Without the strong
10 of 22D04208 ROSENFELD ET AL.: SATELLITE DETECTION OF SEVERE STORMS D04208
Figure 8f. Same as Figure 1 but for a tornadic storm with 1.75 inch hail. The image is based on the
NOAA-AVHRR overpass on 20 July 1998, 2012 UTC, over a domain of 262 178 AVHRR 1-km
pixels. The cloud occurred in NW Wisconsin. The locations of reported F0 tornadoes are marked by
rectangles. Note the large re at the lower levels, indicating microphysically maritime microstructure,
followed by a very deep mixed phase zone. Very strong updrafts should exist for maintaining such a deep
mixed phase zone in a microphysically maritime cloud, as illustrated in line C of Figure 7a. This is case
9847 (see Appendix A), with Tbase = 16°C, Rbase = 8 mm, T14 = 8°C, TL = 31°C, dTL = 47°C, Tg =
32°C, and Rg = 27.8 mm (see parameter definitions in Figure 9).
instability these deep convective elements would not be able 250 km away from the area of reported severe storms. The
to form in strong wind shear. Furthermore, often some of the relatively early overpass time of the AVHRR with respect to
horizontal momentum diverts to vertical in a sheared the diurnal cycle of severe convective storms allowed only a
convective environment. Weisman and Klemp [1984], mod- relatively small data set from the years 1991 – 2001, the
eling convective storms in different conditions of vertical period in which the NOAA polar orbiting satellites drifted
wind shear with directional variations, showed that updraft to the mid and late afternoon hours. Unfortunately this
velocity is dependent on updraft buoyancy and vertical important time slot has been neglected since that time. In
wind shear. In strong shear conditions, the updraft of all, the data set includes 28 cases with tornadoes and hail, 6
long-lived simulated supercell storms interacted with the with tornadoes and no hail, 24 with hail only and 38 with
vertical wind shear, and this interaction resulted in a thunderstorms but no severe weather. The case total was 96.
contribution of up to 60% of the updraft strength. Further- The total data set is given in Appendix A.
more, Brooks and Wilhelmson [1990] showed, from numer- [42] The AVHRR imagery for these cases was processed
ical modeling experiments, an increased peak updraft speed to produce the T-re relations, using the methodology of
with increasing helicity. Therefore, to the extent that wind Rosenfeld and Lensky [1998]. The T-re functions were
shear and helicity enhance the updrafts, the severe storm parameterized using a computerized algorithm into the
microphysical signature inherently takes this into account. following parameters, as illustrated in Figure 9:
Tbase temperature of cloud base, which is approximated
3. Potential Use of the T-re Relations for the by the warmest point of the T-re relation;
Nowcasting of Severe Weather Rbase the re at cloud base;
3.1. Parameterization of the T-re Relations T14 temperature where re crosses the precipitation
[41] The next step was the quantitative examination of threshold of 14 um;
additional cases, taken from AVHRR overpasses that oc- TL temperature where the linearity of the T-re relation
curred 0 –75 min before the time of tornadoes and/or large ends upward;
hail in their viewing area anywhere between the US east DTL temperature interval of the linear part of the T-re
coast and the foothills of the Rocky Mountains. The reports relation: Tbase TL;
of the severe storms were obtained from the National Tg onset temperature of the glaciated zone;
Climate Data Center (http://www4.ncdc.noaa.gov/cgi-win/ Rg re at Tg.
wwcgi.dll?wwEventStorms). For serving as control cases,
visibly well defined nonsevere storms (i.e., without reported [43] These parameters provide the satellite inferences of
tornado or large hail) were selected at random from the cloud base temperature, the effective radius at cloud base,
AVHRR viewing areas. The control cases were selected the temperature at which the effective radius reached the
from the viewing area of the same AVHRR overpasses that precipitation threshold of 14 microns, the temperature at the
included the severe convective storms at distances of at least
11 of 22D04208 ROSENFELD ET AL.: SATELLITE DETECTION OF SEVERE STORMS D04208
addition, smaller effective radius at cloud base indicates
higher probability for a tornadic event.
3.2. Statistical Evaluation Using AVHRR
[46] The primary goal of this section is to establish
whether the probability of a tornado or hail event might
be quantified using the parameterized values of satellite
retrieved T-re relations of a given field of convective clouds.
Doing this involved the use of binary logistic regression,
[Madalla, 1983], which is a methodology that provides the
probability of the occurrence of one out of two possible
events.
[47] If the probability of the occurrence of a tornado event
is P, the probability for a nontornado is 1 P. Given
predictors X1, X2,. . . Xi, the probability P of the tornado is
calculated using binary logistic regression with the predic-
tors as continuous, independent, input variables using
equation (3):
Figure 9. Illustration of the meaning of the parameters
describing the T-re relations. Tbase, temperature of cloud P
ln ¼ a þ bx ð3Þ
base, which is approximated by the warmest point of the T- 1P
re relation; Rbase, the re at cloud base; T14, temperature
where re crosses the precipitation threshold of 14 um; TL, [48] Note that the basic model is similar in form to linear
temperature where linearity of the T-re relation ends upward; regression model (note the right side of the equation), where
dTL, temperature interval of the linear part of the T-re a is the model constant and b is a coefficient of the
relation, Tbase TL; Tg, onset temperature of the glaciated parameter x of the model. When doing binary logistic
zone; Rg, re at Tg. regression using multiple parameters or predictors, equation
(3) takes the form of equation (4):
top of the linear droplet growth line and the temperature at
X
which glaciation was complete. The T-re part of the cloud P n
which is dominated by diffusional growth appears linear, ln ¼ a þ bi xi ¼ a þ b1 x1 þ b2 x2 :::: þ bn xn ð4Þ
1P i
because the nonlinear part near cloud base is truncated
because of the inability of the satellite to measure the
Equation (4) means the following:
composition of very shallow parts of the clouds. The T-re
continues to be linear to greater heights and lower temper- !
atures for more vigorous clouds, as shown schematically in P X
n
¼ exp a þ b i xi
Figure 7. 1P i
[44] These parameters were retrieved for various percen- ¼ expða þ b1 x1 þ b2 x2 :::: þ bn xn Þ ð5Þ
tiles of the re for a given T. The re at a given T increases with
the maturation of the cloud or with slower updrafts, espe-
cially above the height for the onset of precipitation, as !
1P 1 X
n
evident in Figure 4. Therefore characterization of the ¼ 1 ¼ exp a þ b i xi
growing stages of the most vigorous clouds requires using P P i
the small end of the distribution of re for any given T. ¼ expða b1 x1 b2 x2 :::: bn xn Þ ð6Þ
Figure 10 shows the sensitivity of the parameterized T-re
properties of the selected percentile for the calculation, for
the percentiles, of 5, 10, 15,. . . 50. In order to avoid !
1 X
n
spurious values, the 15th percentile and not the lowest ¼ 1 þ exp a þ bi xi
was selected for the subsequent analyses. The 15th percen- P i
tile was used because it represents the young and most ¼ 1 þ expða b1 x1 b2 x2 :::: bn xn Þ; ð7Þ
vigorously growing convective elements, whereas larger
percentiles represent more mature cloud elements. The and finally
master table for the parameters at the 15th percentile for
the convective areas and for the severe storm reports of each 1
case is provided in Appendix A. P¼ !
Xn
[45] The mean results by parameter and storm type are 1 þ exp a þ bi xi
given in Table 1. According to Table 1, the likelihood of a i
tornado is greater for a colder top of the linear zone and for 1
a colder glaciation temperature. In extreme cases such as ¼ ð8Þ
1 þ expða b1 x1 b2 x2 :::: bn xn Þ
that shown in Figure 8e there is little difference between Tg
and TL because of what must have been violent updrafts. In
12 of 22D04208 ROSENFELD ET AL.: SATELLITE DETECTION OF SEVERE STORMS D04208
Figure 10. Mean and standard error of the parameterized T-re properties for the re percentiles of 5, 10,
15,. . . 50 for a given T, for tornadic, hail only and nonsevere storms. (a) Note the obvious increase of re at
the base with higher percentile, and the decrease of Rbase for more severe storms. Note the decrease in
(b) TL, (c) Tg, and (d) Rg for the younger and more vigorous cloud elements as represented by the
smaller percentiles and for the more severe storms.
[49] The first step is calculation of P/(1 P) according to Table 2 gives the modeled variable (e.g., none versus
(5). The logistic regression was done in a stepwise fashion, tornado) and the rows give the regression constants, their
so that the procedure was allowed to select the parameters standard error and statistical significance (footnote b indi-
that had the best predictive skill. Upon applying the catesD04208 ROSENFELD ET AL.: SATELLITE DETECTION OF SEVERE STORMS D04208
Table 1. Mean and Standard Deviations of the T-re Parameters as Defined in Figure 9, for the Various Categories of the Data Seta
Tornado F 1 Tornado Plus Hail Tornado Only Hail Only None
N 13 28 6 24 38
Hail size, inches 2.5 ± 1.2 2.1 ± 1.0 1.6 ± 0.9
Tbase, °C 13.2 ± 5.0 13.6 ± 4.7 13.3 ± 7.8 11.6 ± 5.3 15.7 ± 5.7
Rbase, mm 5.2 ± 1.2 5.4 ± 2.3 7.2 ± 2.3 6.9 ± 1.6 7.8 ± 1.5
T14, °C 17.6 ± 10.8 14.5 ± 10.0 8.8 ± 13.6 12.6 ± 7.2 4.4 ± 6.7
TL, °C 31.0 ± 5.1 31.2 ± 6.4 27.3 ± 7.5 23.8 ± 8.4 19.8 ± 9.6
dTL, °C 44.2 ± 6.5 44.8 ± 7.9 40.7 ± 10.5 35.5 ± 10.2 35.6 ± 10.7
Tg, °C 33.5 ± 3.9 33.9 ± 4.8 29.5 ± 4.9 28.8 ± 7.8 25.7 ± 6.5
Rg, mm 27.7 ± 6.4 27.5 ± 6.0 30.8 ± 5.4 31.9 ± 3.3 32.8 ± 2.5
a
The tornado column F 1 is for the cases of tornadoes with a F scale of at least 1, with or without hail. The rest of the columns contain independent data
that in all constitute the full data set of 28 + 6 + 24 + 38 = 96 cases. Each cell in the table contains the mean ± the standard deviation.
Table 2 we can use either (1) Rbase, Tbase and Tg, where dTL) and glaciating at lower temperatures that often ap-
a = 1.922, b 1 = 0.633, b2 = 0.143 and b3 = 0.156, proach the homogeneous freezing isotherm of 38°C
or (2) Rbase, T14 and TL, where a = 1.217, b 1 = 0.441, (lower Tg). The freezing occurs at smaller re (lower Rg).
b 2 = 0.08 and b 3 = 0.144. For example, upon application All this is consistent with the conceptual model that is
of item 1, if one lets X1 = 4 mm, X2 = 20°C and X3 = illustrated in Figure 7.
36°C, then P = 1/{1 +exp[1.217 + 0.441 * 4 + 0.08 * (5) +
0.144 * (10)]} = 0.98. Thus, given the input X values 3.3. Statistical Evaluation Using GOES
the probability of the tornadic event versus None is highly [53] The applicability of the method depends on the
probable. possibility of using it with geostationary satellite measure-
[51] This analysis can serve only as an illustration in ments. The feasibility of using comparably low resolution
which the same sample used to derive the relationships was Geostationary Operational Environmental Satellite (GOES)
used to test the relationships. An independent data set must for early detection of severe convective storms was tested,
be used to obtain a valid test of the value of the method- and the results are presented in this section. In using the
ology in nowcasting severe weather events. Unfortunately, GOES data it was necessary to trade the fine (1-km) spatial
the small data sample that could be obtained does not allow resolution obtainable from the polar orbiters once per day
having an independent data set for this study. This should for the degraded 4-km spatial resolution that is available in
be, therefore, a subject of a subsequent study. GOES multispectral images every 15 to 30 min. The lower
[52] According to Figure 11, it can be stated for this accuracy of the GOES data did not seem to have a
sample data set that a tornadic storm can be distinguished systematic error when compared to AVHRR. The main
from a nonsevere storm (NvsT) by having smaller Rbase effect was losing the smaller subpixel cloud elements,
with lower T14 and Tg. This means that microphysical which were primarily the lower and smaller clouds. There-
continentality along with slow vertical development of fore cloud base temperature could not be relied on quanti-
precipitation in the clouds appear to be essential to the tatively as in the AVHRR, so that the scenes were divided
formation of tornadoes. Also nontornadic hail storms can be into two indicated cloud base temperature classes at 15°C.
distinguished from nonsevere storms (NvsH in Figure 11) The effectiveness of the detection of linearity of the profiles
by their microphysically continental nature, as manifested and glaciation temperature was compromised to a lesser
by smaller Rbase and cooler cloud bases. However, the extent, because the cloud elements were already larger than
tornadoes differ mostly from hail-only storms (HvsT in the pixel size when reaching the heights of the highly
Figure 11) by having smaller re aloft (lower T14), extending supercooled temperatures. No quantitative assessment of
the linear part of the T-re relations to greater heights (greater the effect of the resolution was done in this preliminary
Table 2. Parameters of the Logistic Regression for Determining the Probability of Various Categories of Convective Storms Reaching
Severe Statusa
T-re Variable
b (Significance)
Model Variable a (Significance) Rbase Tbase T14 TL Tg Rg dTL
None versus tornado 1.922 (NS) 0.633b 0.143c 0.156b
None versus tornado 1.217 (NS) 0.441c 0.080c 0.144b
None versus hail 10.376d 0.979b 0.261d
None versus yes 5.648b 0.648d 0.174d 0.082b
None versus yes 4.910c 0.611d 0.169b 0.082c
Hail versus tornado 5.727 (NS) 0.097c 0.146c 0.273b
Hail versus tornado 3.443 (NS) 0.038 (NS) 0.194c 0.089c
a
The table contains the a and b coefficients ± the standard errors of the T-re parameters in the logistic regression as expressed in equation (4). Included
are only the variables that were selected by the stepwise regression as statistically significant. NS means not significant.
b
Statistical significance < 0.01.
c
Statistical significance < 0.05.
d
Statistical significance < 0.001.
14 of 22You can also read