Simulation of the effects of low-volatility organic compounds on aerosol number concentrations in Europe
←
→
Page content transcription
If your browser does not render page correctly, please read the page content below

Research article
Atmos. Chem. Phys., 22, 1689–1706, 2022
https://doi.org/10.5194/acp-22-1689-2022
© Author(s) 2022. This work is distributed under
the Creative Commons Attribution 4.0 License.

               Simulation of the effects of low-volatility organic
                       compounds on aerosol number
                          concentrations in Europe
                                           David Patoulias1,2 and Spyros N. Pandis1,2
                            1 Department of Chemical Engineering, University of Patras, Patras, Greece
              2 Institute   of Chemical Engineering Sciences, Foundation for Research and Technology – Hellas
                                               (FORTH/ICE-HT), Patras, Greece
                                 Correspondence: Spyros Pandis (spyros@chemeng.upatras.gr)

                                   Received: 4 August 2021 – Discussion started: 9 August 2021
                      Revised: 24 November 2021 – Accepted: 8 December 2021 – Published: 3 February 2022

      Abstract. PMCAMx-UF, a three-dimensional chemical transport model focusing on the simulation of the ul-
      trafine particle size distribution and composition has been extended with the addition of reactions of chemical
      aging of semivolatile anthropogenic organic vapors, the emissions and chemical aging of intermediate-volatility
      organic compounds (IVOCs), and the production of extremely low-volatility organic compounds (ELVOCs) by
      monoterpenes. The model is applied in Europe to quantify the effect of these processes on particle number
      concentrations. The model predictions are evaluated against both ground measurements collected during the
      PEGASOS 2012 summer campaign across many stations in Europe and airborne observations by a zeppelin
      measuring above Po Valley, Italy. PMCAMx-UF reproduces the ground level daily average concentrations of
      particles with a diameter larger than 100 nm (N100 ) with normalized mean error (NME) of 45 % and normalized
      mean bias (NMB) close to 10 %. For the same simulation, PMCAMx-UF tends to overestimate the concentration
      of particles with a diameter larger than 10 nm (N10 ) with a daily NMB of 23 % and a daily NME of 63 %. The
      model was able to reproduce more than 75 % of the N10 and N100 airborne observations (zeppelin) within a
      factor of 2.
         According to the PMCAMx-UF predictions, the ELVOC production by monoterpenes leads to surprisingly
      small changes of the average number concentrations over Europe. The total number concentration decreased due
      to the ELVOC formation by 0.2 %, N10 decreased by 1.1 %, N50 (particles with a diameter larger than 50 nm)
      increased by 3 %, and N100 increased by 4 % due to this new secondary organic aerosol (SOA) source. This
      small change is due to the nonlinearity of the system, with increases predicted in some areas and decreases in
      others, but also the cancelation of the effects of the various processes like accelerated growth and accelerated
      coagulation. Locally, the effects can be significant. For example, an increase in N100 by 20 %–50 % is predicted
      over Scandinavia and significant increases (10 %–20 %) are predicted over some parts of central Europe. The
      ELVOCs contributed on average around 0.5 µg m−3 and accounted for 10 %–15 % of the PM2.5 OA. The addition
      of IVOC emissions and their aging reactions led to a surprising reduction of the total number of particles (Ntot )
      and N10 by 10 %–15 % and 5 %–10 %, respectively, and to an increase in the concentration of N100 by 5 %–10 %.
      These were due to the accelerated coagulation and reduced nucleation rates.

Published by Copernicus Publications on behalf of the European Geosciences Union.
1690                                     D. Patoulias and S. N. Pandis: Effects of low-volatility organics on particle number

1   Introduction                                                 as products undergo further oxidation (Kroll et al., 2006; Ng
                                                                 et al., 2006).
                                                                    Secondary extremely low-volatility organic compounds
Two major processes are responsible for the introduction of      (ELVOCs) have been detected in both the ambient atmo-
new particles in the atmosphere: direct emission from numer-     sphere and laboratory studies (Donahue et al., 2011). These
ous sources and nucleation from low-volatility vapors. New       compounds promote new particle growth and CCN pro-
particles formed by nucleation can either grow by conden-        duction in the atmosphere (Jokinen et al., 2015; Kirkby et
sation of vapors (e.g., sulfuric acid, ammonia, nitric acid,     al., 2016). ELVOCs can be produced rapidly in the gas phase
and organics) to larger sizes, becoming cloud condensa-          during monoterpene oxidation (Ehn et al., 2014) and can en-
tion nuclei (CCN) and thereby increasing the cloud droplet       hance atmospheric new particle formation and growth (Joki-
number concentration (CDNC), or can coagulate with pre-          nen et al., 2015). Due to their exceptionally low volatil-
existing larger particles and be lost (Adams and Seinfeld,       ity, ELVOCs condense essentially irreversibly onto growing
2002). Globally, according to large-scale model simulations,     particles at a rate controlled by the Fuchs-adjusted particle
atmospheric new particle formation (NPF) and subsequent          surface area (Shrivastava et al., 2017). The production of
particle growth represent the most significant sources of at-    ELVOCs can increase the effective biogenic SOA yields, be-
mospheric aerosol particles, at least in terms of their total    coming an additional source of SOA, especially significant
number concentration (Kulmala et al., 2004; Makkonen et          at low OA levels. At the same time, the addition of this extra
al., 2009; Merikanto et al., 2009; Pierce and Adams, 2009;       material results in a change in the volatility distribution of
Wang and Penner, 2009; Yu and Luo, 2009). An increase in         the predicted SOA.
the number concentration of particles that may act as CCN           Fanourgakis et al. (2019) evaluated 16 global chemistry
results in higher CDNC and brighter clouds with longer life-     transport models during a 4-year period and compared their
times.                                                           prediction to the near-surface observed number concentra-
   Globally, organic particulate matter makes up more than       tion of aerosol particles across Europe and Japan. All models
50 % of the sub-micrometer mass concentration of ambient         tended to underestimate the number concentrations of parti-
aerosols in locations throughout the world (Kanakidou et         cles with a diameter larger than 50 nm (N50 ). The normal-
al., 2005; Seinfeld and Pandis, 2006; Zhang et al., 2007).       ized mean bias (NMB) was −51 %, and normalized mean
Nearly 70 % of this material is thought to be secondary or-      error (NME) was 55 % for all stations. Sengupta et al. (2021)
ganic aerosol (SOA) formed from the oxidation of volatile        used the GLOMAP (Global Model of Aerosol Processes;
organic compounds (VOCs) (Hallquist et al., 2009; Schulze        Spracklen et al., 2005) modal aerosol microphysics model
et al., 2017). Many of the relevant precursor VOCs are bio-      (Mann et al., 2010) simulating the production of six surrogate
genic in origin, such as monoterpenes (C10 H16 ) and isoprene    SOA species from the oxidation of anthropogenic VOCs,
(C5 H8 ).                                                        monoterpenes, and isoprene. It was assumed that ELVOCs
   Several recent field studies have shown that SOA in pol-      derive only from biogenic sources and can nucleate to form
luted areas cannot be explained by the simulation of only        new particles (Gordon et al., 2016). Different values of the
the first generation of reactions of “traditional” SOA precur-   ELVOC yield were used, and the model predictions were
sors: biogenic compounds (monoterpenes, sesquiterpenes,          compared to observations of OA mass concentration as well
and isoprene) and anthropogenic compounds (aromatics,            as to the N3 (particles with a diameter larger than 3 nm)
olefins, and large alkanes) (de Gouw et al., 2005; Volkamer et   and N50 number concentrations. Concentrations of N3 and
al., 2006; Kleinman et al., 2008; Docherty et al., 2008; Mat-    N50 were consistently underestimated, while the best model
sui et al., 2009; Dzepina et al., 2009). At the same time, it    performance (based on the Taylor model skill score) was
has become clear that organic vapors are responsible for most    achieved when the ELVOC yield from precursor VOCs was
of the new particle growth in environments with low sulfur       around 13 %. These studies suggest that the role of organics
dioxide levels (Olenius et al., 2018; Yli-Juuti et al., 2020).   and especially ELVOCs in particle formation and growth is
   Traditional treatment of SOA formation considers only         still not well understood.
VOCs as the precursors and only semivolatile products               In this study we extend the three-dimensional regional
(Odum et al., 1996). Robinson et al. (2007) suggested that       chemical transport model (CTM), PMCAMx-UF (Jung et
intermediate-volatility organic compounds (IVOCs) either         al., 2010), with detailed aerosol microphysics (Gaydos et
emitted directly or resulting from the evaporation of par-       al., 2007; Karydis et al., 2007) that has been used and eval-
ticles may be an important and previously neglected pool         uated for simulations over the US and Europe (Fountoukis
of precursors for SOA formation. In addition, later gener-       et al., 2012). The number concentrations of particles with a
ations of reactions of the products of VOCs, IVOCs, and          diameter larger than 10 nm (N10 ) and 100 nm (N100 ) were
semivolatile organic compounds (SVOCs) can lead to prod-         used for the analysis of the model predictions of Fountoukis
ucts of even lower volatility and formation of SOA (Donahue      et al. (2012), whereas Gordon et al. (2016) relied on N3 and
et al., 2006). These chemical reactions can lead to contin-      N50 . N3 and N10 are connected to some extent, but usually
ued SOA production after complete precursor consumption          there are more reliable measurements available at more sites

Atmos. Chem. Phys., 22, 1689–1706, 2022                                           https://doi.org/10.5194/acp-22-1689-2022
D. Patoulias and S. N. Pandis: Effects of low-volatility organics on particle number                                        1691

for N10 . The same applies for the N50 and N100 pair, but N100    scribed in detail in Patoulias et al. (2018). PMCAMx-UF is
is often closer to the CCN sizes at moderate cloud supersat-      based on the framework of PMCAMx (Gaydos et al., 2007;
urations. N10 and N100 were chosen as the metrics in this         Karydis et al., 2007), describing the processes of horizontal
study for continuity, given that they have been used in previ-    and vertical advection, emissions, horizontal and vertical dis-
ous PMCAMx-UF evaluations.                                        persion, wet and dry deposition, aqueous and aerosol phase
   Originally PMCAMx-UF assumed that growth of new                chemistry, and aerosol dynamics and thermodynamics.
particles was exclusively due to sulfuric acid and ammo-             For the simulation of aerosol microphysics, PMCAMx-UF
nia condensation while the semivolatile secondary organics        uses the updated version of DMANx, which simulates the
condensed only in the accumulation mode, thus contribut-          processes of coagulation, condensation/evaporation, and nu-
ing to the condensation and coagulation sinks. This initial       cleation (Patoulias et al., 2015) with the two-moment aerosol
model version was found to reproduce more than 70 % of            sectional (TOMAS) algorithm (Adams and Seinfeld, 2002;
the hourly number concentrations of N10 within a factor           Jung et al., 2006). A key feature of TOMAS is its ability to
of 2 (Fountoukis et al., 2012). However, the concentration        independently track two moments of the aerosol size distri-
of N100 as a proxy for the number of particles that can           bution for each size bin: the aerosol number and mass con-
act as CCN was systematically underpredicted. The growth          centration.
rates were also underpredicted, with smaller errors at sites         The aerosol size distribution is discretized into 41 sections
where the sulfate-to-organics mass ratio was high. These          covering the diameter range from approximately 0.8 nm to
problems were caused mainly by insufficient organic vapor         10 µm. The lowest boundary is at 3.75 × 10⁻²⁵ kg of dry
condensation (Fountoukis et al., 2012) on ultrafine parti-        aerosol mass per particle. Each successive boundary has
cles. Patoulias et al. (2018) developed an extended version       twice the mass of the previous one. The particle components
of PMCAMx-UF in which the SOA components were mod-                modeled include sulfate, ammonium, nitrate, sodium, chlo-
eled as semivolatile first-generation products of the oxida-      ride, crustal material, water, elemental carbon, primary or-
tion of VOCs. The model predictions were compared against         ganic aerosol (POA), and eight surrogate SOA components.
size distribution measurements from 16 stations in Europe            In this work, the nucleation rate is calculated using a
during a photochemically active period. Including SOA con-        scaled ternary parameterization based on the original expres-
densation on ultrafine particles in PMCAMx-UF improved            sions of Napari et al. (2002) with a scaling factor of 10−6
its ability to reproduce the N10 and N100 concentration at        following the suggestions of Fountoukis et al. (2012). The
ground level. The inclusion of SOA decreased the daily nor-       binary parameterization of Vehkamäki et al. (2002) is em-
malized mean bias (NMB) of N10 from 85 % to 75 % and the          ployed if the NH3 concentration is below a threshold value
daily NMB of N100 from 40 % to 20 %. However, the results         of 0.01 ppt.
suggested that there is a need for additional improvements.          Coagulation of particles in the atmosphere is an impor-
   The primary goal of this study is to examine the effect of     tant sink of aerosol number but is also a mechanism by
IVOCs and ELVOCs on particle number concentrations in             which freshly nucleated particles grow to larger sizes. Fol-
Europe. PMCAMx-UF is extended to simulate the multiple            lowing Adams and Seinfeld (2002), TOMAS assumes that
generations of IVOC gas-phase oxidation and the production        the aerosol particles coagulate via Brownian diffusion and
of ELVOCs by monoterpenes. This extended version is used          that the effects of gravitational settling and turbulence on co-
for the base case simulations in this study. The model predic-    agulation are negligible. The calculation of the coagulation
tions are compared with measurements from 26 sites during         coefficients is based on the wet diameters of the particles.
the intensive field campaign that took place in Europe, as part   These wet diameters are calculated following the approach of
of the Pan-European-Gas-AeroSol-climate interaction Study         Gaydos et al. (2005). For small particles (< 100 nm), we use
(PEGASOS) project, from 5 June–8 July 2012. The airborne          the expression of Dahneke et al. (1983) to correct for non-
data obtained by a zeppelin measuring above Po Valley dur-        continuum effects. The coagulation algorithm uses an adap-
ing the same campaign are also used. An analysis of the zep-      tive time step. The time step is limited so that the aerosol
pelin measurement can be found in Lampilahti et al. (2021a).      number or mass concentration in any size category does not
Additional simulations are performed neglecting certain pro-      increase by more than an order of magnitude or decrease by
cesses (e.g., production of ELVOCs) to quantify their role in     more than 25 % in each step.
the model predictions.                                               The extended SAPRC (Statewide Air Pollution Research
                                                                  Center) chemical mechanism (Carter, 2000; Environ, 2003),
                                                                  which includes 219 reactions of 64 gases and 18 free radicals,
2   Model description                                             is used for the gas phase chemistry mechanism in PMCAMx-
                                                                  UF. The SAPRC version used for this work includes five
PMCAMx-UF is a three-dimensional chemical transport               lumped alkanes (ALK1–5), two lumped olefins (OLE1 and
model (CTM) that simulates the aerosol number size distri-        OLE2), two lumped aromatics (ARO1 and ARO2), iso-
bution in addition to the mass and composition size distri-       prene (ISOP), a lumped monoterpene (TERP), and a lumped
bution (Jung et al., 2010; Fountoukis et al., 2012) and is de-    sesquiterpene species (SESQ).

https://doi.org/10.5194/acp-22-1689-2022                                          Atmos. Chem. Phys., 22, 1689–1706, 2022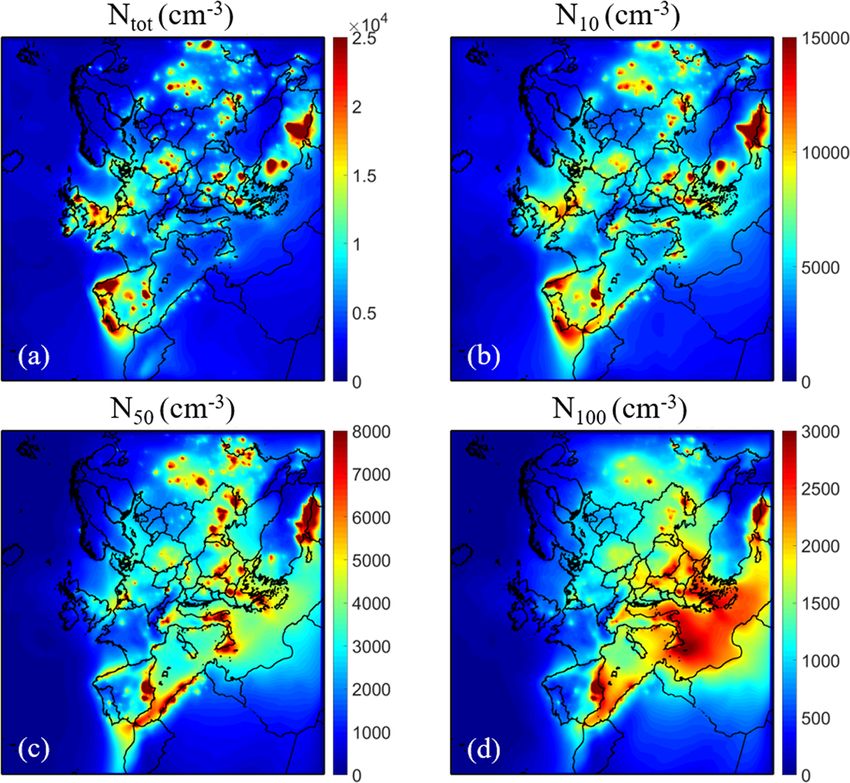
1692                                      D. Patoulias and S. N. Pandis: Effects of low-volatility organics on particle number

   Condensation of gas-phase species to existing aerosol par-         Chemical reactions that change the volatility of the organ-
ticles is an important source of aerosol mass and a means          ics in the gas phase will change the OA mass by influencing
by which small particles grow to CCN sizes. Sulfuric acid          their partitioning. In PMCAMx-UF all secondary species are
is assumed to be in pseudo-steady state in PMCAMx-UF.              treated as chemically reactive. Further gas-phase oxidation of
This pseudo-steady-state approximation (PSSA) for sulfu-           OA vapors (chemical aging) is modeled using a second-order
ric acid proposed by Pierce and Adams (2009) increases the         reaction with hydroxyl radicals and a rate constant equal to
computational speed with a small loss in accuracy. Jung et         1×10⁻¹¹ cm3 molec.−1 s−1 (Atkinson and Arey, 2003). Each
al. (2010) evaluated the performance of PSSA for sulfuric          reaction is assumed to reduce the volatility of the vapor ma-
acid in DMAN against a fourth-order Runge–Kutta algo-              terial by 1 order of magnitude (i.e., shifting material from
rithm and showed that PSSA was accurate and computation-           a C ∗ of 100 to 10 µg m−3 ), with a small increase in mass
ally efficient. Condensation of ammonia is simulated follow-       (7.5 %) to account for the added oxygen (Lane et al., 2008;
ing the approach described by Jung et al. (2006). Ammonia          Shrivastava et al., 2008). IVOCs were not included in the
condensation on the ultrafine particles ends when sulfate is       original emission inventory and therefore have been added to
fully neutralized to ammonium sulfate.                             the emissions. The IVOC emission rate is estimated based on
   Nitric and hydrochloric acids partition to particles (as ni-    the non-volatile POA emissions included in the inventory and
trate and chloride, respectively) in the accumulation mode         is assumed to be 1.5 times the non-volatile POA emissions.
range in PMCAMx-UF, assuming that the system is always             IVOCs are distributed in the 103 , 104 , 105 , and 106 µg m−3
in equilibrium. The amounts of nitric acid and hydrochlo-          saturation concentration bins, and their emission rates are as-
ric acid transferred at each time step between the gas and         sumed to be equal to 0.3, 0.4, 0.5, and 0.8 times the original
aerosol phases are determined by applying the aerosol ther-        non-volatile POA emission rate, for the 103 –106 bins, respec-
modynamic model ISORROPIA (Nenes et al., 1998). This               tively (Robinson et al., 2007).
amount is then distributed over the aerosol size sections by          ELVOCs were assumed to be produced by the oxidation
using weighting factors based on their effective surface area      of monoterpenes with a molar yield of 5 %. For compari-
(Pandis et al., 1993).                                             son, ELVOC yields for the α-pinene ozonolysis in Jokinen
   PMCAMx-UF assumes that organics and inorganics are in           et al. (2015) were 3.4 ± 1.7 %, 7 ± 4 % in Ehn et al. (2014),
different phases in the same particles. Therefore, the conden-     and 4.5 ± 3.8 % in Rissanen et al. (2014). An average molec-
sation of one affects the size distribution of the particles and   ular weight of 200 g mol−1 for ELVOCs was assumed in this
therefore the condensation rate of the other. The inorganic        work.
aerosol thermodynamics including the sulfate–bisulfate split          The partitioning of OA between the gas and particulate
and the water uptake by all inorganic aerosol components are       phases is simulated dynamically in PMCAMx-UF without
simulated by ISORROPIA. The water content of the organic           assuming equilibrium (Patoulias et al., 2015). The driving
aerosol is neglected in this version of PMCAMx-UF, and the         force for condensation of a vapor to an aerosol particle is the
aerosol water is dominated by the inorganic aerosol compo-         difference between its ambient vapor partial pressure and the
nents. Additional information can be found in previous pub-        equilibrium vapor pressure over the particles, with the latter
lications describing the evolution of PMCAMx-UF (Jung et           including the Kelvin effect, which is due to the curvature of
al., 2010; Fountoukis et al., 2012; Patoulias et al., 2018).       the particles. The Kelvin effect is larger for the smaller par-
                                                                   ticles and acts as a barrier for the condensation of organic
                                                                   vapors on these particles. In this simulation a surface ten-
2.1    Secondary organic aerosol formation                         sion of σ = 0.025 N m−1 is assumed for all SOA components
                                                                   (Pierce et al., 2011; Patoulias et al., 2015).
Gas-phase oxidation of VOCs produces semivolatile and                 Three different chemical schemes are used in this work
low-volatility products that can then condense to the parti-       (Table 1). The first scheme (case 1 or base case) in-
cle phase. The volatility-basis set (VBS) framework used in        cludes (i) the aging of SOA components from anthro-
PMCAMx-UF (Donahue et al., 2006) describes the volatility          pogenic sources, using a rate constant k (298 K) = 10 ×
distribution of the OA compounds. SOA is formed from an-           10−12 cm3 molec.−1 s−1 (anthropogenic SOA aging), (ii) the
thropogenic (aSOA) and biogenic (bSOA) precursors. Each            aging of IVOCs using a rate constant k (298 K) = 40 ×
of these types is simulated with five volatility bins with satu-   10−12 cm3 molec.−1 s−1 , and (iii) production of ELVOCs
ration concentrations of 10−5 , 1, 10, 100, and 1000 µg m−3 .      with saturation concentration of 10−5 µg m−3 from the oxi-
The 10−5 µg m−3 bin was added in this work to describe             dation of monoterpenes with a yield of 5 %. The aSOA aging
the ELVOCs. We assumed an average molecular weight of              rate constant is based on OH oxidation of the products of aro-
200 g mol−1 for SOA and an effective enthalpy of vaporiza-         matic VOC oxidation (Atkinson, 2000, 2003). No biogenic
tion of 30 kJ mol−1 (Pathak et al., 2007; Stanier et al., 2007).   SOA aging was simulated in this case, an assumption based
The SOA yields used in this version of PMCAMx-UF for the           on laboratory studies (Presto et al., 2006; Ng et al., 2006) and
semivolatile components are the NOx -dependent stoichio-           the results of Lane et al. (2008). In the second simulation
metric yields of Murphy and Pandis (2009).                         (case 2), the ELVOC yield was set to zero, thus neglecting

Atmos. Chem. Phys., 22, 1689–1706, 2022                                             https://doi.org/10.5194/acp-22-1689-2022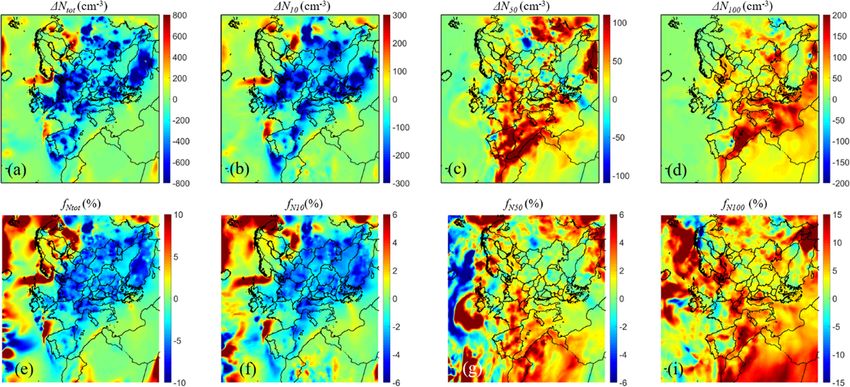
D. Patoulias and S. N. Pandis: Effects of low-volatility organics on particle number                                        1693

Table 1. Summary of parameters used in each simulation.

                            Case            Source of ELVOCs                        Emission of IVOCs
                            1 (base case)   Monoterpene oxidation 5 % molar yield   Yes
                            2               None                                    Yes
                            3               Monoterpene oxidation 5 % molar yield   No

their formation. The rest of the parameters were the same as        al., 2011; Garcia-Diez et al., 2012), demonstrating good per-
in the base case. Finally, in the third simulation the emissions    formance.
of IVOCs and the chemical aging reactions of all VOCs were             The particle emissions were based on the pan-European
neglected while the production of the ELVOCs was simulated          anthropogenic particle number emission inventory (Denier
similarly to the base case.                                         van der Gon et al., 2009; Kulmala et al., 2011) and the
                                                                    carbonaceous aerosol inventory (Kulmala et al., 2011) de-
                                                                    veloped during the EUCAARI (European Integrated project
                                                                    on Aerosol, Cloud, Climate, and Air Quality Interactions)
2.2   Model application and measurements                            project. The resulting number/mass inventories include both
                                                                    number emissions and consistent size-resolved composition
The PMCAMx-UF modeling domain in this application
                                                                    for particles over the size range of approximately 10 nm to
covers a 5400 km × 5832 km region in Europe, with a
                                                                    10 µm. Hourly gridded anthropogenic and biogenic emis-
36 km × 36 km grid resolution and 14 vertical layers extend-
                                                                    sions included both gases and primary particulate matter.
ing up to approximately 7.2 km. The modeling period cov-
                                                                    The natural emissions include both particulate matter and
ers 34 d, from 5 June to 8 July 2012, corresponding to the
                                                                    gases and combine three different datasets: emissions from
PEGASOS 2012 intensive period. PMCAMx-UF was set to
                                                                    ecosystems based on the Model of Emissions of Gases and
perform simulations on a rotated polar stereographic map
                                                                    Aerosols from Nature (MEGAN; Guenther et al., 2006), ma-
projection. The first 2 d of each simulation were excluded
                                                                    rine emissions based on the model of O’Dowd et al. (2008)
from the analysis to minimize the effect of the initial con-
                                                                    as sea surface covers a considerable area of the domain, and
ditions on the results. For the boundary conditions, constant
                                                                    wildfire emissions (Sofiev et al., 2008a, b). MEGAN uses as
and relatively low values have been used (Table S1 in the
                                                                    inputs the plant functional type, the leaf area index, vari-
Supplement) so that the predicted particle number concen-
                                                                    ous chemical species emission factors, and weather data pro-
trations over central Europe are determined for all practical
                                                                    vided by the WRF. Wind speed fields from WRF and chloro-
purposes by the emissions and corresponding processes sim-
                                                                    phyll a concentrations were used as inputs of the marine
ulated by the model. The boundary conditions are identical
                                                                    aerosol model. VOCs were speciated based on the approach
to those used in Patoulias et al. (2018). The effect of these
                                                                    proposed by Visschedijk et al. (2007). Anthropogenic gas
boundary conditions on the predicted number concentrations
                                                                    emissions included land emissions from the GEMS (global
is discussed in Patoulias et al. (2018).
                                                                    and regional Earth-system monitoring using satellite and in
   Meteorological inputs to PMCAMx-UF include horizontal
                                                                    situ data) dataset (Visschedijk et al., 2007). The interna-
wind components, vertical diffusivity, temperature, pressure,
                                                                    tional shipping, industrial, domestic, agricultural, and traf-
water vapor, clouds, and rainfall. The Weather Research and
                                                                    fic aerosol emission sources were included in the anthro-
Forecasting (WRF) model (Skamarock et al., 2005) was used
                                                                    pogenic inventory (Denier van der Gon et al., 2009; Kulmala
to generate the above inputs. WRF was driven by geographi-
                                                                    et al., 2011).
cal and dynamic meteorological data generated by the Global
                                                                       The model results were compared against measurements at
Forecast System (GFSv15) of the National Oceanic and At-
                                                                    26 ground sites, which are available at the European Super-
mospheric Administration/National Centers for Environmen-
                                                                    sites for the Atmospheric Aerosol Research (EUSAAR) and
tal Prediction. Each layer of PMCAMx-UF was aligned with
                                                                    EBAS databases (https://ebas.nilu.no, last access: 11 January
the layers used in WRF. The WRF simulation was periodi-
                                                                    2022) and the Aerosols, Clouds and Trace gases Research
cally re-initialized every 3 d with observed conditions to en-
                                                                    Infrastructure (ACTRIS) (https://actris.nilu.no, last access:
sure accuracy in the corresponding fields used as inputs in
                                                                    11 January 2022). Particle size distribution measurements
PMCAMx-UF. The measurements were pre-processed by the
                                                                    at all sites were made using either a differential mobility
WPS (WRF Preprocessing System) package, which provides
                                                                    particle sizer (DMPS) or a scanning mobility particle sizer
each atmospheric and static field with fidelity appropriate to
                                                                    (SMPS). Information about all stations can be found in Ta-
the chosen grid resolution of the model. The performance of
                                                                    ble S2.
WRF for Europe against observed meteorological variables
                                                                       An intensive field campaign took place in Europe, as part
has been the topic of several studies (Jimenez-Guerrero et
                                                                    of the Pan-European-Gas-AeroSol-climate interaction Study
al., 2008; de Meij et al., 2009; Im et al., 2010; Argueso et

https://doi.org/10.5194/acp-22-1689-2022                                            Atmos. Chem. Phys., 22, 1689–1706, 2022
1694                                      D. Patoulias and S. N. Pandis: Effects of low-volatility organics on particle number

(PEGASOS) project, from 5 June–8 July 2012. Measure-
ments of aerosol mass concentration PM1 (particulate matter
particles with a diameter of less than 1 µm) from the PEGA-
SOS project are also available for the same period for Patras
(Greece), Finokalia (Greece), San Pietro Capofiume (Italy),
and Bologna (Italy) (Table S3a) and filter PM2.5 (particulate
matter particles with a diameter of less than 2.5 µm) mea-
surements from six additional stations in Europe (Table S3b).
The organic aerosol mass concentration was estimated from
the organic carbon measurements assuming an organic mass-
to-carbon ratio equal to 1.8 (Kostenidou et al., 2015).
   The measurement of organic carbon and therefore the esti-
mated OA using filters is characterized by two main artifacts:
a positive one involving adsorption of organic vapors on the
quartz filters used for the sampling and a negative one re-
lated to the evaporation of some of the semivolatile material
(Turpin et al., 2000; Mikuška et al., 2012). There is a rich
literature on the magnitude of these artifacts and on ways
to minimize them or correct for them (involving denuders
                                                                  Figure 1. Average ground level number concentrations (in cm−3 )
for removal of organic vapors and after-filters). In this work,   for the base case simulation from 5 June–8 July 2012 for (a) all par-
we use the reported measurements for the model evaluation,        ticles (Ntot ) and particles above (b) 10 nm (N10 ), (c) 50 nm (N50 ),
keeping in mind their uncertainty.                                and (d) 100 nm (N100 ). Different scales are used.
   The airborne measurements by the PEGASOS zeppelin
were acquired during the simulation period over the Po Val-
ley. The Po Valley region is situated between the Alps in         ranean, mainly in areas near southern Spain, southern Italy,
the north and the Apennines in the south-southwest. The           and the Balkans. Ntot and N10 are high in areas of frequent
mountains surround the valley on three sides, and high lev-       nucleation events and areas with high particle number emis-
els of pollutants are often observed in the region due to the     sions, whereas the N50 and N100 levels are affected signifi-
industrial, agricultural, and other anthropogenic emissions.      cantly by secondary particulate matter production. The high
In addition, emissions from ship traffic on the Adriatic Sea      photochemical activity over the eastern Mediterranean leads
(Hamed et al., 2007) and long-range transport from central-       to the corresponding high levels of N50 and N100 during this
eastern Europe also contribute pollutants to the region (So-      period.
gacheva et al., 2007). A SMPS was used to measure the num-
ber size distribution of particles in the size range of 10 to
430 nm. Details of the relevant PEGASOS zeppelin measure-         3.2     Evaluation of PMCAMx-UF predictions
ments can be found in Lampilahti et al. (2021a).                  3.2.1    Comparison of PMCAMx-UF predictions to ground
                                                                           aerosol number observations
3     Results
                                                                  The prediction skill metrics of PMCAMx-UF, for the daily
3.1    Base case
                                                                  average ground measurements from the 26 stations, are sum-
                                                                  marized in Tables 2 and 3 for both the base case and the case
The average predicted ground level average number con-            in which the ELVOCs are neglected.
centrations for the total number of particles (Ntot ) and for        For the base case simulation, the model has a tendency
particles with diameters above 10 nm (N10 ), 50 nm (N50 ),        to overestimate the N10 levels. The normalized mean bias
and 100 nm (N100 ) from 5 June–8 July 2012 are shown in           (NMB) for the daily average concentrations is 23 %, and the
Fig. 1. The N50 and N100 concentrations are often used            normalized mean error (NME) is 63 %. The N10 was overpre-
as proxies for CCN number concentrations (Fountoukis et           dicted at 18 sites and underpredicted at 7, and there was prac-
al., 2012). On a domain average basis, for the ground level       tically zero bias (less than 0.1 %) at the last station. The NMB
the model predicted 4780 cm−3 for Ntot , 3630 cm−3 for N10 ,      at eight sites (Prague-Suchdol, Ispra, Melpitz, Patras, K-
1990 cm−3 for N50 , and 820 cm−3 for N100 during the simu-        Puszta, Hohenpeissenberg, Hyytiälä, and San Pietro Capofi-
lated period. The highest Ntot average concentrations (more       ume) was less than ± 15 %, and for another eight stations
than 15 000 cm−3 ) were predicted over Bulgaria, southern         it was between ± 15 % and ± 40 % (Annaberg-Buchholz,
Romania, Turkey, Poland, the Netherlands, Portugal, north-        Cabauw, Dresden Nord and Winckelmannstrasse, Finokalia,
ern Spain, the eastern UK, and Russia. On the other hand,         Giordan Lighthouse, Kosetice, Montseny, and Varrio). The
the highest N50 and N100 are predicted over the Mediter-          highest discrepancies with the measurements of N10 were

Atmos. Chem. Phys., 22, 1689–1706, 2022                                              https://doi.org/10.5194/acp-22-1689-2022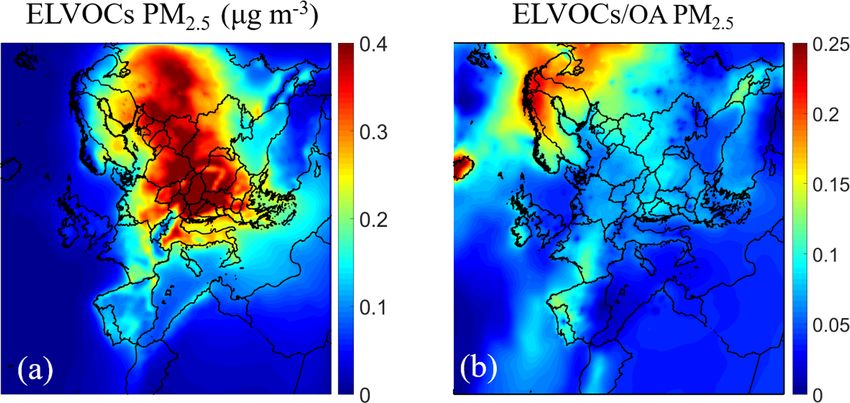
D. Patoulias and S. N. Pandis: Effects of low-volatility organics on particle number                                          1695

Table 2. Prediction skill metrics of PMCAMx-UF against daily ground measurements of particle number concentration above 10 nm (N10 )
from 5 June–8 July 2012.

    Station    Mean observed (cm−3 )      Mean predicted (cm−3 )                NMB (%)                        NME (%)
                                       Base case   Without ELVOCs   Base case    Without ELVOCs    Base case    Without ELVOCs
    N10
    ANB                        8057      6617           6585             −18                −18          39                 39
    ASP                        2130      5233           5202             146                144         144                144
    BRK                        1878      3144           3053              67                 63          86                 86
    CBW                       13 101     9913           9817             −24                −25          31                 31
    DSN                       10 591     6508           6504             −39                −39          41                 41
    DSW                        7706      6111           6091             −21                −21          40                 40
    FNK                        3962      5466           5466              38                 38          40                 40
    GDN                        5712      6652           6731              16                 18          32                 32
    HOH                        3438      3070           2906             −11                −15          38                 38
    HYY                        2207      2536           2265              15                  3          31                 31
    ISP                        6232      6449           6203               3                  0          43                 43
    KPU                        5269      5855           5937              11                 13          43                 43
    KST                        3596      4881           4834              36                 34          46                 46
    MLP                        5583      6034           6003               8                  8          42                 42
    MNT                        6455      8364           8273              30                 28          45                 45
    PRG                        7272      7281           7273               0                  0          44                 44
    USM                       15 171     8335           8413             −45                −45          52                 52
    VAV                        3250      8291           8283             155                155         155                155
    VRR                        1107      1491           1190              35                  7          69                 57
    VSM                        2903      7281           7011             151                141         151                141
    WLD                        4956      7903           7783              59                 57          66                 64
    ZUG                        1237      2405           2287              94                 85         111                103
    NEO                        2864      5085           5039              78                 76          79                 78
    PAT                        4705      5151           5148               9                  9          45                 44
    SPC                        8301      7198           7180             −13                −14          35                 35
    THE                        3894      8577           8530             120                119         120                119
    All                        4820      5957           5889               23                22          63                 63

found in Aspvreten, Birkness II, Usti n.L.-mesto, Vavi-             Capofiume in Italy and Finokalia and Patras in Greece) that
hill, Vielsalm, Zugspitze-Schneefernerhaus, Waldhof, Costa          were part of the PEGASOS campaign.
Navarino, and Thessaloniki with a NMB higher than ± 40 %.              In Italy and Greece, the model reproduces the obser-
   The model performed better for N100 . There was lit-             vations of the PM1 concentrations of the major inorganic
tle bias in the corresponding predictions on average                aerosol components (sulfate, ammonium, nitrate) reasonably
(the NMB was −10 %), and the NME was 45 %. The                      well (Table 4). The model tends to underpredict the organic
NMB for 10 sites (Cabauw, Giordan Lighthouse, Hyytiälä,             aerosol concentrations in Patras and Bologna, while it over-
Kosetice, Melpitz, Patras, Prague-Suchdol, Vielsalm, Wald-          predicts the OA in Finokalia and San Pietro Capofiume (Ta-
hof, and Zugspitze) was less than ± 15 %, and for an-               ble 5). The OA NMB is −2 % and the NME is 38 %, with
other 12 (Annaberg-Buchholz, Birkenes II, Dresden Nord              the Finokalia site presenting the higher NMB value (50 %)
and Winckelmannstrasse, Finokalia, Hohenpeissenberg, Is-            and San Pietro Capofiume and Bologna the lower (± 20 %)
pra, K-Puszta, Montseny, Costa Navarino, San Pietro Capofi-         (Table 5).
ume, Usti n.L-mesto., and Vavihill) it was between ± 15 %              For the rest of Europe, PM2.5 filter measurements have
and ± 40 % (Table 3). The absolute NMB for N100 exceeded            been used, available in the European Supersites for Atmo-
40 % only in Aspvreten, Varrio, and Thessaloniki.                   spheric Aerosol Research (EUSAAR) and EBAS databases
                                                                    (http://ebas.nilu.no/, last access: 11 January 2022) for sta-
                                                                    tions that had available data for more than 15 d during the
3.2.2     Evaluation of aerosol composition predictions             simulated period (six additional stations in Europe: Payerne,
                                                                    Melpitz, Montseny, Ispra, Diabla Gora, and Iskrba; Table 6).
The PMCAMx-UF predictions can be evaluated during that              For the calculation of OA mass concentration, we assumed
period using available PM1 measurements from aerosol                OA : OC = 1.8 (Kostenidou et al., 2015). For these sites, the
mass spectrometers at four stations (Bologna and San Pietro

https://doi.org/10.5194/acp-22-1689-2022                                             Atmos. Chem. Phys., 22, 1689–1706, 2022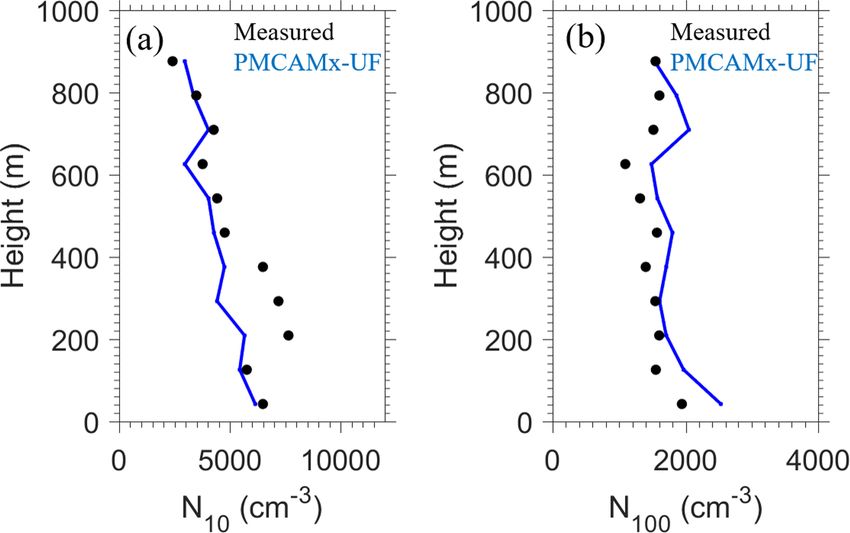
1696                                       D. Patoulias and S. N. Pandis: Effects of low-volatility organics on particle number

Table 3. Prediction skill metrics of PMCAMx-UF against daily ground measurements of particle number concentration above 100 nm (N100 )
from 5 June–8 July 2012.

   Station   Mean observed (cm−3 )       Mean predicted (cm−3 )                        NMB (%)                              NME (%)
                                      Base case     Without ELVOCs       Base case      Without ELVOCs          Base case    Without ELVOCs
   N100
   ANB                        1518         939                  934          −38                       −38           47               47
   ASP                         552         789                  694           43                        26           61               51
   BRK                         607         419                  397          −31                       −35           65               62
   CBW                        1627        1550                 1441           −5                       −11           18               16
   DSN                        1976        1178                 1052          −40                       −47           44               49
   DSW                        1426        1156                 1050          −19                       −26           35               37
   FNK                        1760        2383                 2330           35                        32           39               36
   GDN                        2492        2797                 2826           12                        13           34               33
   HOH                        1011         697                  656          −31                       −35           37               40
   HYY                         677         579                  445          −14                       −34           26               38
   ISP                        1775        1334                 1283          −25                       −28           37               38
   KPU                        1543        1898                 1861           23                        21           29               28
   KST                        1123        1138                 1061            1                        −6           26               21
   MLP                        1214        1111                  977           −9                       −20           30               33
   MNT                        1492        1871                 1799           25                        21           49               50
   PRG                        1177        1256                 1167            7                        −1           26               25
   USM                        1657        1091                  985          −34                       −41           40               44
   VAV                         766         942                  899           23                        17           48               48
   VRR                         324         166                   90          −49                       −72           63               77
   VSM                         704         747                  643            6                        −9           34               34
   WLD                        1116        1063                  955           −5                       −14           20               23
   ZUG                         555         555                  546            0                        −2           44               44
   NEO                        1489        2041                 1971           37                        32           45               42
   PAT                        1747        1765                 1766            1                         1           21               23
   SPC                        1702        2051                 1978           21                        16           36               36
   THE                        1387        2420                 2384           74                        72           78               76
   All                        1198        1326                 1258               10                     5           45               45

Table 4. Predicted (PMCAMx-UF) and observed (AMS) average PM1 concentrations of sulfate, ammonium, and nitrate in different locations
for base case simulation.

                           Station            Sulfate               Ammonium                        Nitrate
                                     Predicted     Observed    Predicted    Observed       Predicted     Observed
                                     (µg m−3 )     (µg m−3 )   (µg m−3 )    (µg m−3 )      (µg m−3 )     (µg m−3 )
                           FIN         4.44             3.50      1.82           1.06        1.00             0.07
                           PAT         2.83             3.35      1.34           0.95        0.84             0.10
                           BOL         2.11             2.79      1.08           1.00        0.90             0.60
                           SPC         2.31             1.81      1.16           0.88        0.99             1.20
                           All         2.99             2.82      1.37           0.97        0.94             0.52

model has a tendency towards overestimating the PM2.5 OA                 3.2.3     Comparison of PMCAMx-UF predictions to
concentration for four out of six stations, presenting an aver-                    zeppelin measurements
age NMB of 20 % and NME of 62 % (Table 6).
                                                                         One of the challenges of the PMCAMx-UF evaluation us-
                                                                         ing airborne measurements is that the model predictions are
                                                                         available every 15 min while the corresponding measure-
                                                                         ments by the zeppelin were taken every 3 min at different
                                                                         heights. For comparison purposes, the model output was in-
                                                                         terpolated to the times of the zeppelin measurement periods.

Atmos. Chem. Phys., 22, 1689–1706, 2022                                                      https://doi.org/10.5194/acp-22-1689-2022
D. Patoulias and S. N. Pandis: Effects of low-volatility organics on particle number 1697
Table 5. Prediction skill metrics of PMCAMx-UF base case simulation against daily PM1 OA measurements.
Station Mean predicted Mean observed NMB NME Factor of 2
(µg m−3 ) (µg m−3 ) (%) (%) (%)
FIN 3.19 2.12 50 51 83
PAT 2.75 3.80 −28 28 95
BOL 4.62 5.68 −19 33 74
SPC 4.74 3.98 19 44 77
All 3.87 3.79 2 38 82
Table 6. Prediction skill metrics of PMCAMx-UF against daily PM2.5 OA measurements.
Name Station Country Mean observed Mean predicted NMB NME Factor of 2
(µg m−3 ) (µg m−3 ) (%) (%) (%)
CH02 Payerne Switzerland 2.54 2.98 17 73 72
DE44 Melpitz Germany 2.52 4.42 76 88 66
ES1778 Montseny Spain 4.52 6.28 39 89 59
IT04 Ispra Italy 5.13 4.41 −14 46 71
PL05 Diabla Gora Poland 3.64 4.22 16 43 84
SI08 Iskrba Slovenia 5.98 5.07 −15 33 80
All 4.06 4.56 20 62 72
PMCAMx-UF reproduced more than 75 % of the 2000 3 min
N10 and N100 measurements by the zeppelin within a factor
of 2 (Fig. S1 in the Supplement). The vertical profiles shown
in Fig. 2 are averages of different flights that collected data
in different days and different altitudes each time. The num-
ber of samples at different altitudes changed for each flight,
creating additional variability in the measured profiles.
To facilitate the comparison between measurements and
predictions the corresponding average profiles (matched in
space and time) were calculated using 80 m altitude bins for
all the PEGASOS flights. On average PMCAMx-UF repro-
duced the N10 measurements over Po Valley at lower than
160 m and above 400 m but underestimated the higher N10
Figure 2. Comparison of predicted PMCAMx-UF (blue line) vs.
levels measured in the residual layer at heights between 160–
observed (black dots) vertical profiles of averaged particle number
400 m during several of the flights that started several hours concentrations for (a) N10 and (b) N100 of 25 flights over the Po
before sunrise (Fig. 2a). The average measured N10 at all Valley during the PEGASOS campaign.
heights was 6000 cm−3 , while the predicted concentration
was equal to 4700 cm−3 . PMCAMx-UF reproduced the N100
concentration at all heights (Fig. 2b). The model also repro- Overall, the model performance aloft was quite similar to
duced 80 % of the 3 min N100 zeppelin measurements within that at the ground level. For example, for the nine zeppelin
a factor of 2. The measured average N100 at all heights was flights the OA normalized mean bias was −4 %, and the nor-
1500 cm−3 , and the average predicted by PMCAMx-UF was malized mean error was equal to 40 % (Table S4). The mea-
1800 cm−3 . The ability of the revised model to reproduce the sured and predicted OA mean values are 4.6 and 4.4 µg m−3 ,
high-time resolution (3 min) zeppelin measurements at mul- respectively.
tiple altitudes and locations reasonably well is encouraging.
The predictions of PMCAMx-UF for the aerosol mass con-
centration were compared to the zeppelin PM1 composition 3.3 Effect of ELVOC production on particle number and
measurements obtained by an AMS (each 3 min, nine flights, OA concentrations
∼ 1300 data points). The average vertical profiles of organ-
ics, sulfate, ammonium, and nitrate are shown in Fig. S2. An additional simulation was performed neglecting the pro-
duction of ELVOCs from terpenes (case 2). The addition of
https://doi.org/10.5194/acp-22-1689-2022 Atmos. Chem. Phys., 22, 1689–1706, 20221698 D. Patoulias and S. N. Pandis: Effects of low-volatility organics on particle number
Figure 3. Average ground level (a) PM2.5 ELVOCs mass concen-
tration (in µg m−3 ) and (b) the ratio of the PM2.5 mass of ELVOCs
to OA during the simulation. Different scales are used.
ELVOCs increased the PM2.5 OA mass by approximately as
much as 0.5 µg m−3 in central-eastern Europe and Russia, ac-
counting for approximately 10 %–15 % of the OA (Fig. 3).
In these areas a combination of high terpene emissions and
high photochemical reaction rates existed during the simu-
lated period. The highest relative predicted increase in OA
was 15 %–25 % in northern Europe. In central Europe the Figure 4. Average ground level fractional increase (fNx ) of number
ELVOC formation increased average OA by approximately concentration due to the condensation of ELVOCs for (a) all parti-
10 %. cles (fNtot ), (b) particles above 10 nm (fN10 ), (c) particles above
The average fractional increase in Nx , due to the produc- 50 nm (fN50 ), and (d) particles above 100 nm (fN100 ). Different
tion of ELVOCs, is calculated as scales are used.
Nx (with ELVOCs) − Nx (without ELVOCs)
fNx = , (1)
Nx (without ELVOCs)
where x is 10, 50, 100 nm, or zero (total number). Rather sur-
prisingly, the average fractional change for all number con-
centrations (Ntot , N10 , N50 , and N100 ) is small, ranging be-
tween 1 % and −4 % (Fig. 4) (Ntot : −8 cm−3 or −0.14 %;
N10 : 40 cm−3 or −1.14 %; N50 : 60 cm−3 or 3 %; N100 :
35 cm−3 or 4 %). One reason for the small average change
is that both increases and decreases are predicted for differ-
ent areas in Europe. These mixed results are due to the fact
that the ELVOC condensation accelerates the growth of new
and preexisting particles to larger sizes, but at the same time
accelerates their losses due to the increase in the coagulation
sink and decreases the nucleation rate due to the increase in
the condensation sink.
The formation of ELVOCs resulted in a predicted decrease
in Ntot by 20 % (300–600 cm−3 ) in parts of the Nordic coun-
tries and by 5 % in central Europe (Fig. 4). The decreases are
predicted for most of Europe, with the exception of a few ar-
eas in which increases are predicted (northern Iberian Penin- Figure 5. Average ground level increase in number concentration
sula, parts of France, areas in the Balkans with high sulfur (in cm−3 ) due to the condensation of ELVOCs for (a) all particles
dioxide levels, etc.) (Fig. 5). The predicted N10 increased by (1Ntot ), particles above (b) 10 nm (1N10 ), (c) 50 nm (1N50 ), and
5 %–15 % (150–400 cm−3 ) over Finland, northwestern Rus- (d) 100 nm (1N100 ). Different scales are used.
sia, France, Ireland, and northern Portugal. At the same time
there were small decreases of a few percent over several ar-
eas in Europe, especially in the south and in the east as well 40 % over Scandinavia and northwestern Russia and 10 %
over the Baltic Sea. N50 increased over almost all of Europe for central Europe. Finally, the ELVOCs caused an increase
by 50 to 300 cm−3 . This N50 increase corresponds to 20 %– in N100 of 20 %–50 % over Scandinavia and 10 %–20 % over
Atmos. Chem. Phys., 22, 1689–1706, 2022 https://doi.org/10.5194/acp-22-1689-2022D. Patoulias and S. N. Pandis: Effects of low-volatility organics on particle number 1699
central Europe. The absolute corresponding N100 changes in
these areas are 100–200 cm−3 .
The corresponding changes of the number concentrations
for particles with diameters between 1 and 10 nm (N1–10 ), 10
and 50 nm (N10–50 ), and 50 and 100 nm (N50–100 ) are sum-
marized in Fig. S3. These figures illustrate the complex ef-
fect of the ELVOCs on different parts of the aerosol number
distribution. Decreases in the concentrations of the 1–10 nm
particles (decreasing nucleation rate due to increased con-
densation sink, increasing coagulation with larger particles),
increases in the concentrations of the particles with a diame-
Figure 6. Ground level average (a) increase in PM2.5 mass concen-
ter larger than 100 nm (due to accelerated growth of the sub- tration of organics aerosol (in µg m−3 ) and (b) fractional increase
100 nm particles to larger sizes), and both increases and de- in PM2.5 mass concentration of organics aerosol (%) due to the ad-
creases in the 10–50 nm size range depend on the magnitude dition of IVOCs emissions of semivolatile organic aging, predicted
of the different competing processes in each area. The ef- from 5 June–8 July. Different scales are used.
fect of the ELVOCs in this PMCAMx simulation is clearly a
lot more complex than a uniform increase in particle number
concentrations. (in absolute terms) by 1 %; it increased by 5 % for N100
The spatial variability of the fractional change in the num- due to the addition of the ELVOCs in the simulation (Ta-
ber concentration of N1–10 (reflecting nucleation rates), sul- bles 2 and 3). The addition of the ELVOCs mainly affects the
furic acid concentration, condensational sink (CS), and co- PMCAMx-UF predictions in northern Europe and especially
agulation sink due to the ELVOCs is depicted in Fig. S4. Finland, where the predictions of N100 significantly improve.
In areas such as the Scandinavian Peninsula the production In Hyytiälä the NMB decreases from −34 % to −14 %, and
of ELVOCs is predicted to lead to a 20 %–30 % average in- in Varrio it drops from −72 % to −49 % (Table 3). The corre-
crease in the coagulation and condensational sinks and a cor- sponding normalized mean errors changed by 1 %–2 %. The
responding decrease in sulfuric acid levels and N1–10 . Simi- small changes in the performance metrics are consistent with
lar changes are predicted for several other areas (e.g., central the small overall changes caused by the ELVOC addition.
Europe) but are less pronounced. The small change in the OA mass concentration due to the
The results at the Hyytiälä station in Finland were exam- addition of the ELVOCs has a modest impact on the perfor-
ined in more detail because the predicted number concentra- mance of PMCAMx-UF for OA (Tables S5 and S6). For ex-
tions in Finland are quite sensitive, according to PMCAMx- ample, the PM1 OA bias improves from −6 % to 2 % while
UF, to the addition of the ELVOCs. The predicted N3 , N10 , the PM2.5 OA bias increases from 15 % to 20 %. The changes
N50 , and N100 concentrations for the base case are in rea- in normalized error are 1 % or less.
sonable agreement with the field measurements in this area
(Fig. S5), with a tendency of the model to overpredict the 3.4 Effect of IVOCs on particle number concentrations
N3 levels during a few nucleation events. For all concentra-
tions the simulation with the ELVOCs (base case) reproduces The emissions of IVOCs (C ∗ ≥ 10−3 µg m−3 ) were set to
the measurements better than the simulation in which they zero in a sensitivity test (case 3) to quantify their effect on
are neglected. The condensation sink for Hyytiälä increases the predicted particle number concentration and size distri-
by a few percent due to the additional mass of the ELVOCs bution. The SOA formed by the IVOCs (SOA-iv) exceeds
(Fig. S5). The average measured and predicted number size 1 µg m3 in southern Europe, over the Mediterranean Sea, but
distributions in Hyytiälä are shown in Fig. S6. The addition also in large areas over central and eastern Europe (Fig. 6).
of the ELVOCs leads to increased levels in the part of the The high SOA-iv levels over the Mediterranean are due to
size distribution above 50 nm. A decrease in the concentra- the oxidation of IVOCs emitted from large wildfires that
tion of particles with a diameter below 7 nm is predicted due occurred during the simulation period. The corresponding
to the addition of the ELVOCs because of both increased co- SOA-iv is 10 %–25 % of the total OA over continental Eu-
agulation losses and lower nucleation rates. The difference rope and even higher (about 60 %) over parts of the marine
in the predictions of the two simulations (with and without atmosphere. The average fractional increase in Nx due to
ELVOCs) in Hyytiälä is modest. The discrepancy between emission and aging of IVOCs is calculated as
model predictions and measurements is due to both weak- Nx (with IVOCs) − Nx (without IVOCs)
nesses of the measurements (particles smaller than 3 nm were fN x = , (2)
Nx (without IVOCs)
not measured) and a tendency of the model to overpredict nu-
cleation event intensity in this area. where x is 10, 50, 100 nm, or zero (total number).
The ELVOC addition played a minor role in the overall According to PMCAMx-UF the addition of the emissions
performance of PMCAMx-UF. The NMB for N10 decreased of IVOCs and their aging reactions lead to a reduction of Ntot
https://doi.org/10.5194/acp-22-1689-2022 Atmos. Chem. Phys., 22, 1689–1706, 20221700 D. Patoulias and S. N. Pandis: Effects of low-volatility organics on particle number
Figure 7. Ground level increase in number concentration (in cm−3 ) (a–d) and fractional increase (fNx ) in number concentration (e–i) due
to the addition of IVOC emissions and aging reactions, predicted from 5 June–8 July 2012 for (a, e) all particles (Ntot ) and particles above
(b, f) 10 nm (N10 ), (c, g) 50 nm (N50 ), and (d, i) 100 nm (N100 ). Different scales are used.
by 5 %–10 % and N10 by 5 % (Fig. 7) for continental Europe. performance for OA in Europe. This added SOA removed
On the other hand, this addition of IVOCs leads to an increase the underprediction of OA against the AMS measurements
in N50 by 5 % and N100 by 5 %–10 % mainly in central Eu- in Italy and Greece; the NMB changed from −18 % when
rope and the Mediterranean Sea (Fig. 7). The corresponding IVOCs were neglected to 2 % when IVOCs were included
changes of the number concentrations for the various size (Table S8). The NME decreased a little (from 38 % to 35 %)
ranges N1–10 , N10–50 , and N50–100 are summarized in Fig. 8. with the IVOC addition. The performance against the OA
The predicted N1–10 decreases approximately 15 %–20 % for measurements in the other European sites became a little
most of Europe except for the Scandinavian peninsula due to worse when IVOCs were included in the model (Table S9).
the IVOCs. N10–50 decreases 10 %–15 % mainly in southern The small underprediction (NMB = −8 %) in OA became
Europe, and N50–100 changes less than ± 5 % or ± 100 cm−3 a larger overprediction (NMB = 20 %), and the NME in-
in the simulated domain. creased from 50 % to 62 %. These results are characteristic
The atmospheric oxidation of the emitted IVOCs produces of the uncertainties in primary OA emissions but also SOA
semivolatile organic compounds, which condense preferen- production from the various VOCs and IVOCs emitted by
tially on particles in the accumulation mode and not so much anthropogenic and biogenic sources.
on the smallest particles due to the Kelvin effect. This re-
sults in an increase in both the condensation and coagulation
sinks, which then lead to a decrease in the nucleation rate 4 Conclusions
and to an increase of the coagulation loss rate of the smaller
particles. A new version of PMCAMx-UF was developed with the abil-
The effect of the addition of the IVOCs on the performance ity to simulate the formation and dynamic condensation of
of PMCAMx-UF is modest and mixed. The NMB for N10 ELVOCs during the oxidation of the monoterpenes and the
increased by 4 % (from 23 % to 27 %) and decreased by 5 % emissions and multi-generational chemistry of IVOCs. The
for N100 (from 10 % to 5 %) (Table S7). The corresponding model was applied to the PEGASOS summer intensive pe-
NME for both N10 and N100 changed slightly (approximately riod campaign during the summer of 2012. The available
1 %). The modest overall changes in the number distribution measurements included both ground stations across Europe
of the ultrafine particles caused by the addition of IVOCs and airborne measurements from a zeppelin over the Po Val-
and the corresponding aging reactions are consistent with the ley.
small changes in the PMCAMx-UF performance metrics. The number concentration predictions of PMCAMx-UF
The addition of the IVOCs and the resulting SOA-iv from are compared against ground measurements from 26 stations
their oxidation also had mixed results in the PMCAMx-UF in Europe. The model tends to overestimate daily average
N10 with a normalized bias of 23 % and an average error of
Atmos. Chem. Phys., 22, 1689–1706, 2022 https://doi.org/10.5194/acp-22-1689-2022D. Patoulias and S. N. Pandis: Effects of low-volatility organics on particle number 1701 Figure 8. Ground level average increase in number concentration (in cm−3 ) (a–c) and fractional increase (fNx ) in number concentration (d– f) due to the addition of IVOC emissions predicted from 5 June–8 July 2012 for (a, d) particles between 0.8 and 10 nm (N1–10 ), (b, e) particles between 10 and 50 nm (N10–50 ), and (c, f) particles between 50 and 100 nm (N50–100 ). Different scales are used. 63 %. PMCAMx-UF performed well for N100 with a low bias in different parts of Europe. Even if ELVOCs accelerate the (10 %) and an error of 45 %. The performance of the model in growth of the newly formed particles to larger sizes, in this the lowest 1 km of the atmosphere above Po Valley for both way increasing their lifetime, at the same time they increase N10 and N100 was even better than its average performance the aerosol mass and surface area as they mostly condense in over Europe. The model’s predicted PM1 and PM2.5 concen- the accumulation mode. Therefore, they increase the conden- trations and composition had a NMB of 20 % and errors less sation sink, decreasing the sulfuric acid supersaturation and than 60 % depending on the PM component. These results the corresponding nucleation rate. They also increase the co- suggest that PMCAMx-UF does a reasonable job reproduc- agulation sink and thus accelerate the removal of all nanopar- ing the aerosol mass and number concentrations over Europe ticles. during the simulated period. Locally the effects of the ELVOC production could be The ELVOCs produced by the monoterpene oxidation higher. For example, it is estimated that the ELVOC produc- contributed, according to the PMCAMx-UF predictions, on tions leads to a decrease in the total particle concentration average around 0.5 µg m−3 and accounted for 10 %–15 % of Ntot by 20 % in parts of the Nordic countries and by 5 % the PM2.5 OA. The highest relative predicted increase in OA in central Europe. At the same time, the predicted N10 in- was 15 %–25 % in northern Europe, while the ELVOC for- creased by 5 %–15 % (150–400 cm−3 ) over Finland, north- mation increased average OA by approximately 10 % in cen- western Russia, France, Ireland, and northern Portugal due tral Europe. to these secondary organic compounds. The predicted N50 The ELVOC production by monoterpenes led to surpris- increased almost everywhere in continental Europe by 50– ingly small changes of the average number concentrations 300 cm−3 . This is a 10 % increase in N50 over central Europe over Europe. The total number concentration decreased by and a 20 %–40 % increase over Scandinavia and northwest- 0.2 %, the N10 decreased by 1.1 %, and N50 increased by ern Russia. 3 % and N100 by 4 % due to this new SOA source. One of The addition of IVOC emissions and their aging reactions the reasons for these small average increases is the nonlin- led to a surprising reduction of the total number of particles earity of the system, leading to both increases and decreases (Ntot ) and N10 by 10 %–15 % and 5 %–10 %, respectively, https://doi.org/10.5194/acp-22-1689-2022 Atmos. Chem. Phys., 22, 1689–1706, 2022
You can also read