Supplement of Measured and modelled air quality trends in Italy over the period 2003-2010
←
→
Page content transcription
If your browser does not render page correctly, please read the page content below
Supplement of Atmos. Chem. Phys., 21, 10825–10849, 2021
https://doi.org/10.5194/acp-21-10825-2021-supplement
© Author(s) 2021. CC BY 4.0 License.

Supplement of
Measured and modelled air quality trends in Italy over
the period 2003–2010
Ilaria D’Elia et al.

Correspondence to: Ilaria D’Elia (ilaria.delia@enea.it)

The copyright of individual parts of the supplement might differ from the article licence.
SUPPLEMENTARY MATERIAL

Supplementary S1

Figure S1 – Map of the Italian administrative Regions.
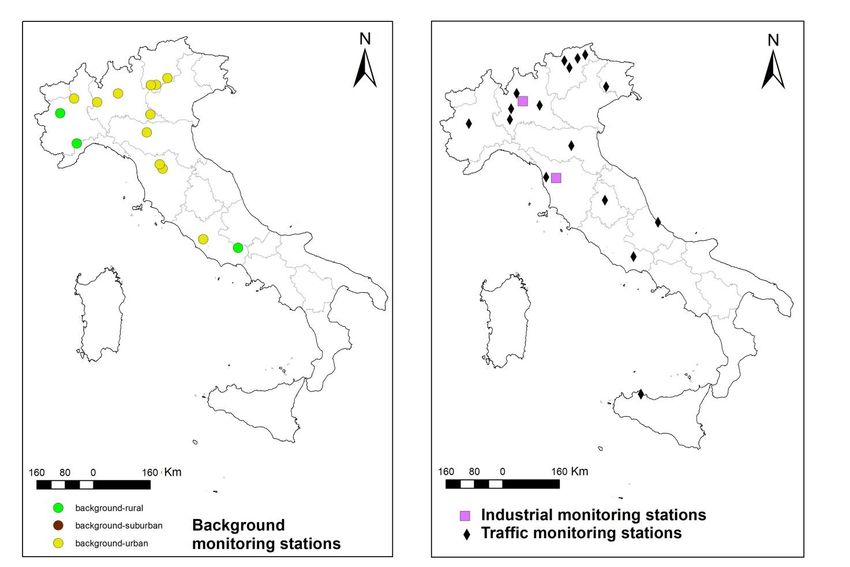
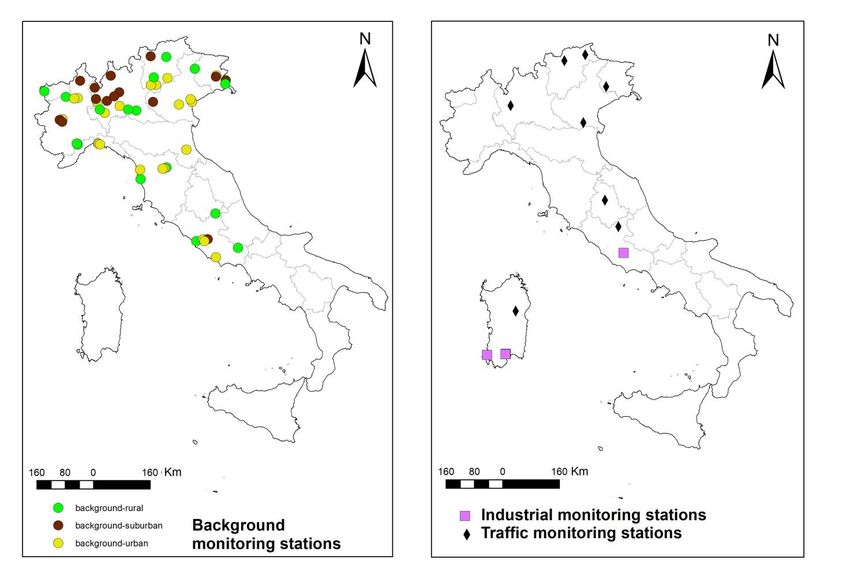
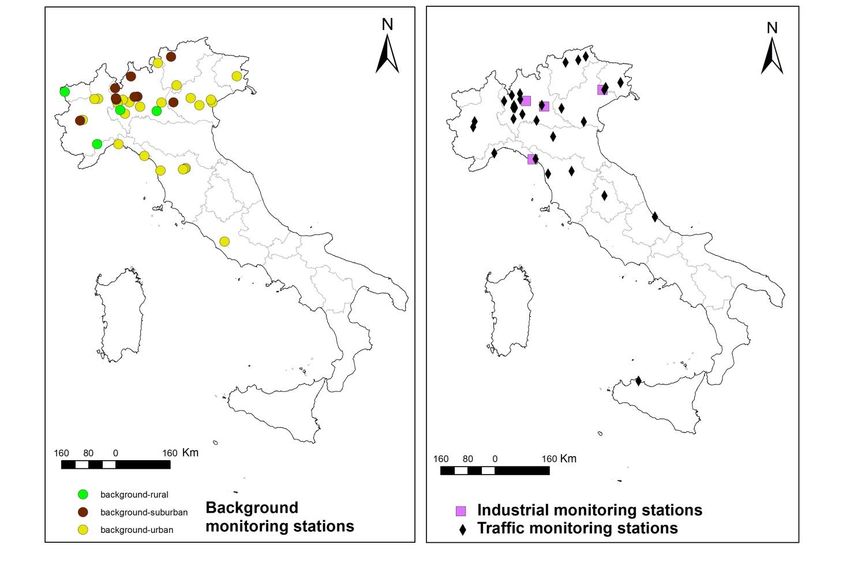
Figure S2 – Map of the Italian sites monitoring NO2 concentrations considered for the study.

Figure S3 – Map of the Italian sites monitoring PM10 concentrations considered for the study.
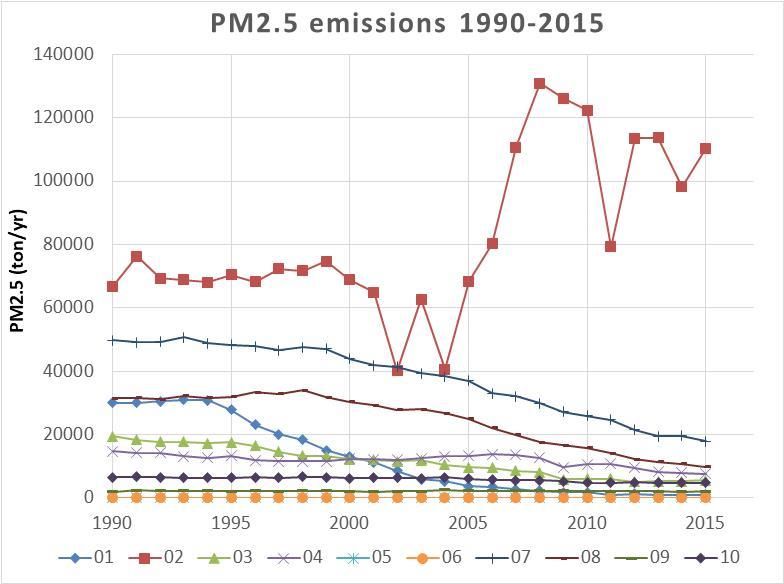
Figure S4 – Map of the Italian sites monitoring O3 concentrations considered for the study.
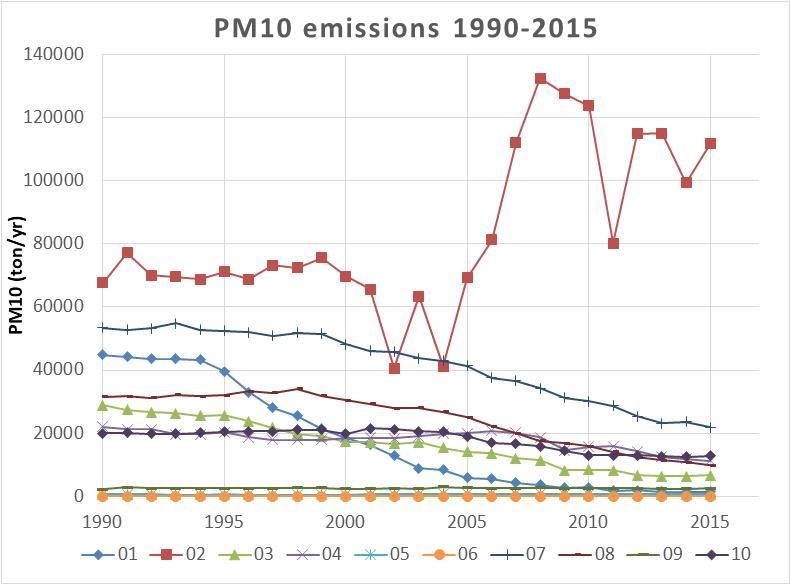
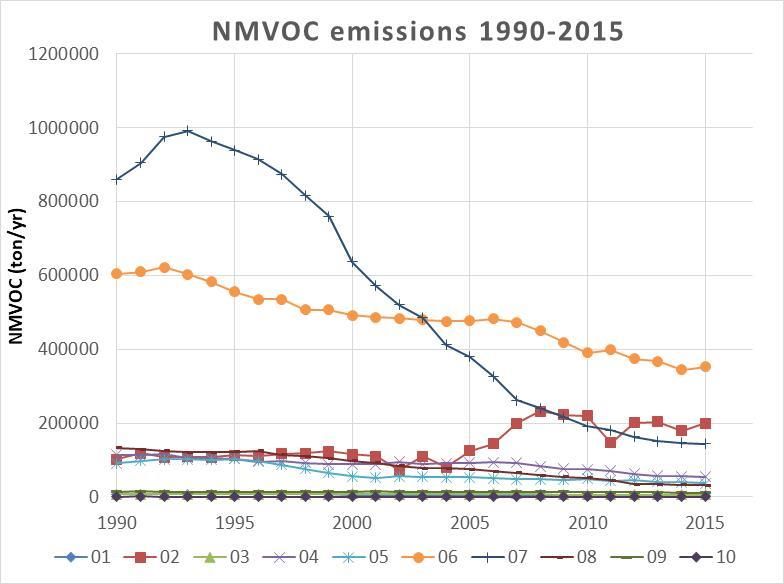
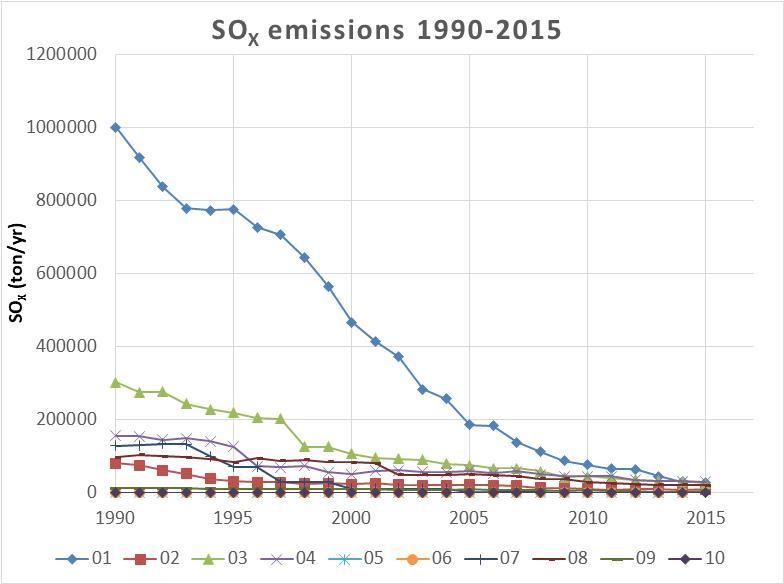
Supplementary S2 – Emissions Time Series

 Table S1 – SNAP Classification
 SNAP - macrosector
 SNAP code Description
 01 Combustion in energy and transformation industries
 02 Non-industrial combustion plants
 03 Combustion in manufacturing industry
 04 Production processes
 05 Extraction and distribution of fossil fuels and geothermal energy
 06 Solvent use and other product use
 07 Road transport
 08 Other mobile sources and machinery
 09 Waste treatment and disposal
 10 Agriculture
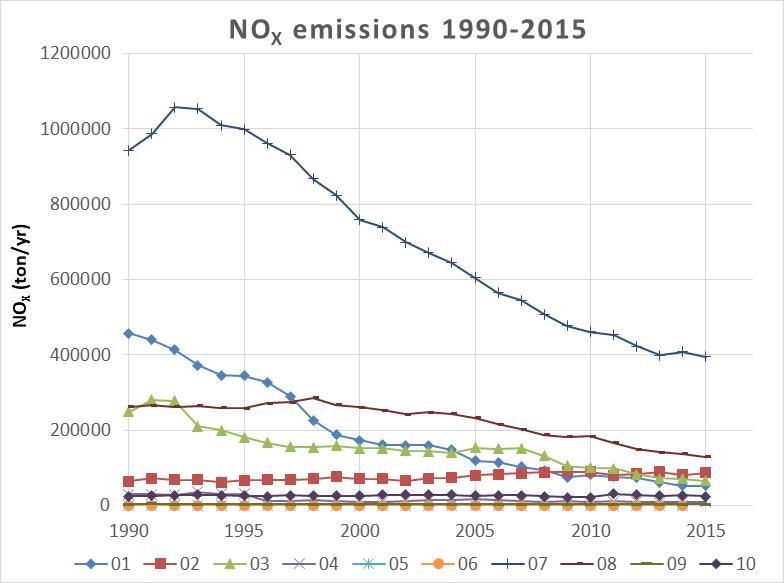
Figure S5 – Emission time series for SOX (on the left) and NOX (on the right) by SNAP sector for the period 1990-2015
elaborated for the national official submission 2017 used for the simulations of the MINNI model.

Figure S6 – Emission time series for PM2.5 (on the left) and PM10 (on the right) by SNAP sector for the period 1990-2015
elaborated for the national official submission 2017 used for the simulations of the MINNI model.

Figure S7 – Emission time series for NMVOC (on the left) and NH3 (on the right) by SNAP sector for the period 1990-2015
elaborated for the national official submission 2017 used for the simulations of the MINNI model.
Supplementary S3 – Meteorological anomalies (2003-2010)

S3.1 Temperature

Figure S8 – Annual Temperature (850-hPa) anomalies elaborated from the NCEP/NCAR Reanalysis. Image provided by the
NOAA/ESRL Physical Sciences Laboratory, Boulder Colorado from their Web site at http://psl.noaa.gov/.
S3.2 500-hPa geopotential height

Figure S9 – Annual 500-hPa geopotential height anomalies elaborated from the NCEP/NCAR Reanalysis. Image provided by
the NOAA/ESRL Physical Sciences Laboratory, Boulder Colorado from their Web site at http://psl.noaa.gov/.
S3.3 Precipitation rate

Figure S10 – Annual Precipitation rate anomalies elaborated from the NCEP/NCAR Reanalysis. Image provided by the
NOAA/ESRL Physical Sciences Laboratory, Boulder Colorado from their Web site at http://psl.noaa.gov/.
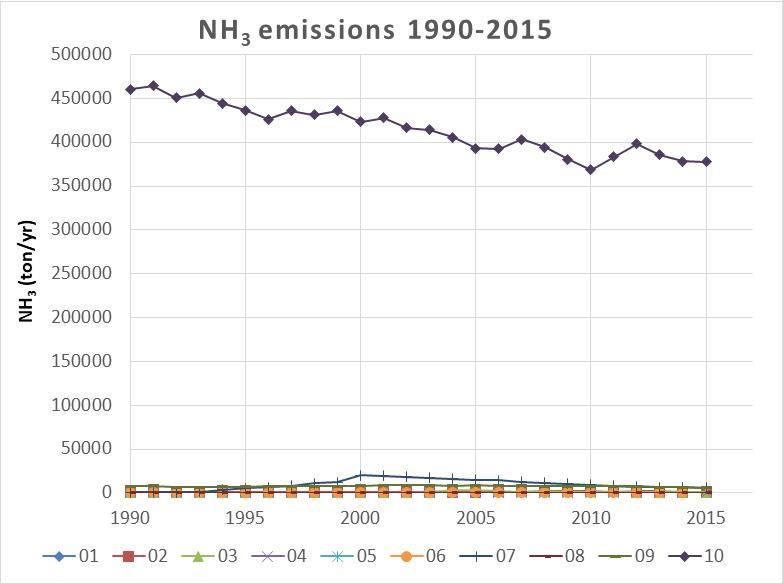
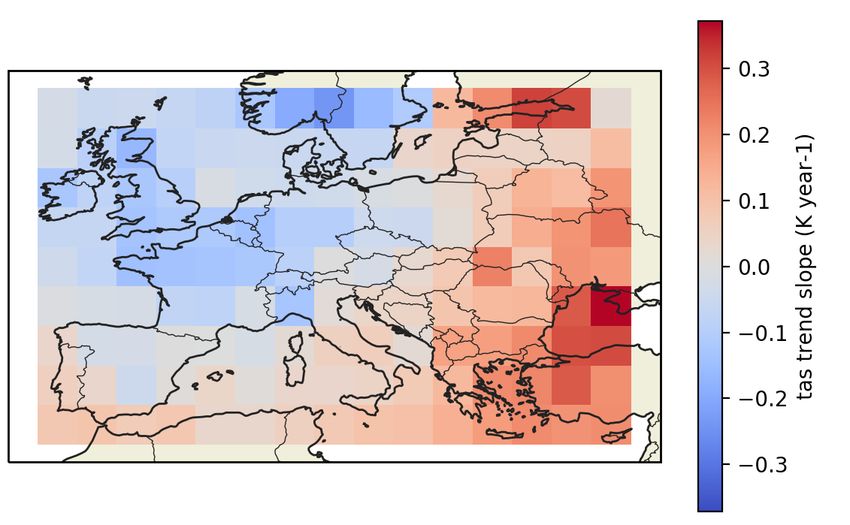
Figure S11 – Near surface temperature trend (K yr-1) for the period 2003-2010 computed from Copernicus Climate Data
Service.
Supplementary S4 – Model simulation validation S4.1 Definition of model evaluation statistics The performance statistical indexes used to compare modelled and observed values are calculated according to the following definitions MB (Mean bias) 1 MB = ∑ − =1 RMSE (Root mean squared error) 1/2 ∑ =1( − )2 = ( ) corr (correlation coefficient) 1 − − = ∑( )( ) ( − 1) =1 where the letters O and M stand for observations and model results, respectively, the subscript i indicates the time step, the overbars indicate the time average over n time intervals, while the symbol indicates the standard deviation. S4.2 Comparison of model performances with Colette et al. (2011) Table S2 – Model performances at all valid Italian monitoring stations computed over 8 years (2003-2010), as discussed in this paper. Model performances at European suburban stations computed over 10 years (1998–2007) for the six chemistry-transport models, involved in Colette et al. (2011). Daily NO2 Daily PM10 Daily O3 MDA8 O3 RMSE MB corr RMSE MB corr RMSE MB corr RMSE MB corr BKG, rural 10.8 -4.8 0.578 21.1 -12.8 0.453 23.2 2.2 0.757 24.4 -1.9 0.817 This Paper BKG. suburban 15.8 -4.2 0.689 21.7 9.3 0.814 25.0 5.1 0.847 BKG. urban 17.3 -9.1 0.662 21.6 -8.8 0.567 23.4 12.3 0.822 25.1 9.7 0.853 IND 18.7 -7.9 0.606 17.3 -3.9 0.630 25.7 18.6 0.683 25.0 14.8 0.712 TRA 28.6 -22.4 0.591 22.5 -12.2 0.585 25.6 17.8 0.761 25.1 13.4 0.801 BOLCHEM 12.6 −1.46 0.658 13.9 −4.48 0.370 17.6 −4.31 0.782 Colette et al. CHIMERE 16.6 −13.4 0.633 15.5 −11.3 0.576 23.5 18.5 0.797 (2011) EMEP 17.4 −14.1 0.574 17.9 −14.4 0.542 21.0 13.3 0.740 EURAD 16.0 −6.46 0.644 15.1 −3.75 0.524 25.2 15.0 0.659 OSLOCTM2 18.0 −14.7 0.544 23.5 17.1 0.750 MOZART 21.3 −18.1 0.350 22.0 4.76 0.627
Supplementary S5 – Trend results
S5.1 NO2

The following table shows the results for NO2 slopes for all the stations with a significant trend (p
IT1544A LIGURIA industrial urban 0.96 (0.55 - 1.54) -1.24 (-1.42 - -1.06) 2.77 (1.50 - 4.86) -4.72 (-5.21 - -4.20)
S5.2 PM10

 The following table shows the results for PM10 slopes for all the stations with a significant trend (p
S5.3 O3

 The following table shows the results for O3-MDA8 (Apr/Sep) slopes for all the stations with a significant trend
 (p
You can also read