The Ultraviolet Detection of Corona Discharge in Power Transmission Lines
←
→
Page content transcription
If your browser does not render page correctly, please read the page content below
Energy and Power Engineering, 2013, 5, 1298-1302
doi:10.4236/epe.2013.54B246 Published Online July 2013 (http://www.scirp.org/journal/epe)

   The Ultraviolet Detection of Corona Discharge in Power
                     Transmission Lines
           Lan Chen1, Lin Lin2, Mimi Tian2, Xingming Bian1, Liming Wang1, Zhicheng Guan1
                                1
                                  Graduate School at Shenzhen, Tsinghua University, Shenzhen, China
                2
                 Jibei Electric Power Maintence Company, Jibei Electric Power Company, Limited, Beijing, China
                                              Email: chenlan09@mails.tsinghua.edu.cn

                                                     Received April, 2013

ABSTRACT
Corona discharge is a common phenomenon in power transmission lines external insulation, and it may cause serious
defect if without effective detection. The ultraviolet (UV) imagery technology has been widely used to detect the corona
discharge in industry in recent years, but some influence factors’ functions are not definite. In this paper, the fracture
aluminum strands which is common in power transmission lines were used as the electrode model while a SuperB ul-
traviolet imager were utilized to detect, the photon count rate was detected with different detect distance, electric field,
aluminum strands length and UV gain were applied. Then the multivariate regression analysis (MRA) was taken to cal-
culate the function between the photon count and the factors.

Keywords: Corona Discharge; Transmission Lines; Defect Detection; UV Imager; Multivariate Regression Analysis

1. Introduction                                                   but the corona discharge must be serious, so it is not
                                                                  promptly for detection of little heat at the early corona
With the development of Extra High Voltage (EHV) and
                                                                  stage [10, 11]. So the infrared thermograph technology is
Ultra High Voltage (UHV), the electromagnetic envi-
                                                                  not widely used in the outdoor corona detection in trans-
ronment problem caused by corona discharge of conduc-
                                                                  mission lines.
tor was paid attention increased [1-3]. The corona dis-
                                                                     The ultraviolent imaging technology is able to catch
charge could generate the negative phenomenon such as
                                                                  the specific wavelengths photon of UV signal, and then
radio interference, audible noise, ozone-forming, elec-
                                                                  combine with the visible light to decide the corona dis-
trochemical reaction [4-6]. The detection of the defect of
                                                                  charge point. And the strength of discharge is judge by
the corona discharge has been added to the daily inspect
                                                                  the photon counting rate.
in transmission lines in recently years [7].
   The corona discharge in the transmission lines often              The UV imager was researched and developed to de-
occurred at the high voltage terminal of amour clamp,             tect the discharge phenomenon by occident at the earliest.
split clamp, conductor surface and the end of fractured           It can find the discharge point with small temperature
aluminum strands caused by lightning stroke or conduc-            rise at the early discharge stage, is currently one of main
tor galloping. And the influence of fractured aluminum            methods of discharge detection in the world [12]. From
strands is extra clear, it not only generate corona dis-          1980s, the EPRI attempted to utilize the UV imager to
charge by distort the electric field at the end of the            test the discharge in the transmission lines [13-15], and
strands, but also make a bad influence on the mechanical          have got good achievements. In china it is also have con-
behavior of the conductor, the defect would make serious          vinced performance in actual use.
harm to transmission security if without fix timely [8].             The ref [16, 17] take the research of corona discharge
So it is important to find and fix fractured aluminum             performance of insulator at different applied voltage, the
strands at the early stage in transmission lines patrol.          UV imager was used to measure the discharge. In ref
   The traditional ovular estimate and infrared thermo-           [18], several influence factor of UV imager was studied,
graphy technology don’t have well effect on the fractured         such as photon counting rate, detect distance, discharge
aluminum strands detection. For the ovular estimate,              capacity. Refs [19, 20] have discussed the principle of
people may have different vision disparity and the corona         UV imager, and then the UV imager of SuperB was used
discharge could be find nearly only in intensity at night         to detect the corona of electrical equipment in the trans-
[9]. While the infrared thermograph technology is able to         mis- sion lines. In ref [21], the UV imager was used to
detect the defect with consecutive electrothermal effect,         decide the corona inception voltage of the conductor un-

Copyright © 2013 SciRes.                                                                                               EPE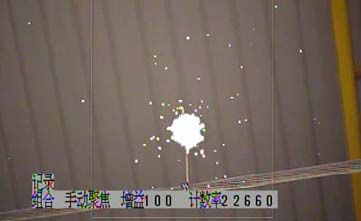
L. CHEN ET AL. 1299
der dry or rainy conditions. And the different strand length, detection distance, ap-
In this paper, the UV imager type of SuperB, which plied voltage, UV gain level were show in Table 1. The
designed by Ofil company, was used to detect the corona electric field of the conductor surface (not the top of
discharge at the top of fractured aluminum strands. And strand) was calculated by ANSOFT for applied voltage
the electric field, length of the strand, detection distance as 10.7 kV/cm, 13.6 kV/cm, 16.4 kV/cm, 19.3 kV/cm,
and gain level were researched. Then the MRA was tak- and respectively.
en to calculate the function between the photon count and
the factors.
2. Introduce of Experiment
2.1. Test System
The experiment was carried out in a shielding hall with a
size of 66 m × 30 m × 18 m, and the test model was
4×LGJ300/40, bundle space was 45 cm, height was 6.8
m, the model picture was showed in Figure 1. And the
temperature was 8.4℃~10.8℃,relative humidity was
35%~43%.
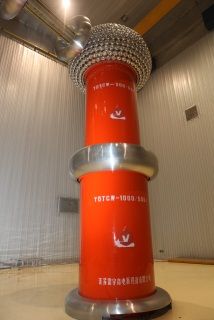
The UV imager with type of DayCor SuperB was Figure 3. 1000kV transformer.
showed in Figure 2. And the 50 Hz source with maxi-
mum of 1000 kV and 1000 kVA was showed in Figure
3.
And the measurement system schematic diagram was
showed in Figure 4.
2.2. Fractured Aluminum Strands Information
The fractured aluminum strands (see Figure 5), was set
at one of the LGJ300/40 conductor, with different length Figure 4. Measurement system schematic diagram.
(see Figure 6).
Figure 5. The top of the fractured aluminum strands.
Figure 1. Picture of test model.
Figure 6. Schematic diagram of fractured aluminum
strands.
Table 1. Information of the factor.
Influence factor content
Length of strand (cm) 2 4 6 8 10
Applied voltage (kV) 150 190 230 270
Detection distance (m) 7 9 11 13
UV gain 60 80 100 120
Figure 2. UV imager of SuperB.
Copyright © 2013 SciRes. EPE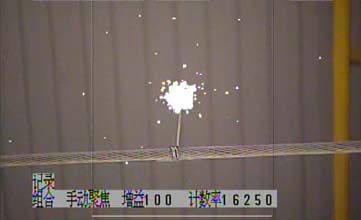
1300 L. CHEN ET AL.
3. Results and Analysis 3.2. Influence of Detection Distance
With the different influence factor applied on the strands, With the different detection distance of 7 m, 9 m, 11 m,
the corona phenomenon was detected by the UV imager. 13 m, the results were partly showed in Figure 9.
Limited by the paper length, one of them was showed in
Figure 7. 3.3. Influence of UV Gain
We noticed in Figure 7 that the photon counting rate
With the different UV gain was set in the experiment, the
would increase with the rise of the applied voltage, such
results were partly showed in Figure 10. However, the
as applied voltage was 150 kV ( with conductor surface
UV gain character is most related to the signal processing
electric field is 10.7 kV/cm) while the photon counting
module of the UV imager designer, so it may different
was 7620, with the voltage increased to 270 kV ( with
from other UV imager.
field 19.3 kV/cm) the photon counting rise at 22660.
3.4. Influence of Length of the Strand
3.1. Influence of Voltage (Electric Field)
With the different length of strand applied on the con-
With the applied voltage of 150kV, 190kV, 230kV,
ductor, the results were partly showed in Figure 11.
270kV, the electric field was 10.7kV/cm, 13.6kV/cm,
16.4kV/cm, 19.3kV/cm, respectively, one part of result
4. Multivariate Regression Analysis
of experiment was show in Figure 8.
MRA was developed from one dimension regression
analysis and used to investigate the connection between
dependent variable and several independent variables.
MRA is considered as an effective mathematical method
to solve practical engineering problem.
30000
2cm
4cm
6cm
(a)10.7 kV/cm (b)13.6 kV/cm 25000
Photon counting rate
8cm
10cm
20000
15000
10000 UV gain 100
Electric field 19.3kV/cm
(c)16.4 kV/cm (d) 19.3 kV/cm
7 8 9 10 11 12 13
Figure 7. Corona discharge at the top of fractured strand Detection distance(m)
with different voltage applied (length of strand is 10cm, Figure 9. Influence of detection distance.
detection distance is 9 m, UV gain is 100).
2cm
45000 30000 Distance 9m
2cm 4cm
40000 4cm 6cm Electric field 16.4kV/cm
6cm 25000 8cm
Photon counting rate
8cm 10cm
Photon counting rate
35000
10cm
20000
30000
25000 15000
20000 10000
15000 UV gain 120 5000
Distance 9m
10000
0
11 12 13 14 15 16 17 18 19 60 70 80 90 100 110 120
Electric field of conductor surface(kV/cm) UV gain
Figure 8. Influence of electric field. Figure 10. Influence of UV gain.
Copyright © 2013 SciRes. EPE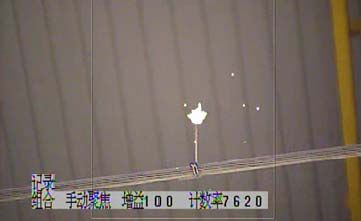
L. CHEN ET AL. 1301
The multiple regression prediction equation about the 5. Conclusions
photon counting rate was:
In this work, the fractured aluminum strands was taken
P 0 1 E 2 2 / L 3 K 4 s (1) for the test model to research the corona discharge detec-
tion of UV imager. The influence detect distance, electric
In the equation, electric field was set as E, kV/cm; de-
field, strands length and UV gain were investigated while
tection distance was set as L, m; UV gain was set as K;
the MRA was utilized to summarize the regression equa-
length of strand was set as s, cm.
tion about the photon counting rate. These conclusions
And the significance test was taken, including R, F and
have good contribute to expand UV imaging technology
T test , showed in Equation (2) ,(3) and (4).
in practical transmission lines patrol of corona discharge.
n n
R ( yˆi y )2 ( yi y )2 (2)
i 1 i 1 REFERENCES
n
[1] Z. Y. Liu, “Ultra High Voltage Power Grid,” Beijing:
( yˆi y )2 m China Economy Press, 2005, pp. 136-139.
i 1
F ~ F (m, n m 1) (3)
n [2] P. S. Maruvada, “Corona Performance of High-voltage
( yˆi yi )2 (n m 1) Transmission Lines,” New York, USA: Research Studies
i 1
Press Ltd, 2000.
(b j j ) c jj [3] Y. B. Shu and W. Z. Zhang, “Research of Key Technolo-
Tj ~ t (n m 1) (4) gies for UHV Transmission,” Proceedings of the CSEE,
n
Vol. 27, No. 31, 2007, pp. 1-6.
( yˆi yi )2 (n m 1)
i 1 [4] L. Xing, Y. P. Liu, Q. Sun, S. H. You and R. Q. Li,
“Measurement Technology of the Corona Loss for 750
The results of MRA and significance test were display kV Transmission Line,” Advances of Power System &
in Table 2. Hydroelectric Engineering, Vol. 27, No. 6, 2011, pp.
The result of significance test is well, so the regression 17-20.
equation about photon counting rate is: [5] P. A. Calva and F. C. Espino, “Effect of the Humidity in
P 57980 49.29 E 2 101230 / L the Ionic Mobility in Reduced Air-density,” IEEE Annual
(5) Report Conference on Electrical Insulation and Dielectric
347.7 K 754.4 s Phenomena, Atlanta, America, Vol. 2, 1998, pp. 508-511.
[6] N. Taku, O. Takao, M. Hiroji, M. Hideki, S. Shozo and A.
10.7kV/cm Akihiro, “Charge-voltage Curves of Surge Corona on
13.6kV/cm UV gain 100 Transmission Lines: Two Measurement Methods,” IEEE
20000 16.4kV/cm Distance 9m Transactions on Power Delivery, Vol. 18, No. 1, 2003, pp.
19.3kV/cm 307-314.
Photon counting rate
16000 [7] Z. C. Guan and G. L. Wang, “The Projects and Related
Key Techniques of Ultra High Voltage Transmission in
China,” China Southern Power Grid Technology Re-
12000 search, Vol. 1, No. 6, 2005, pp. 12-18.
[8] H. Z. Zhang, “Typical Defects Analysis and Illustrated
Books in 500 kV Transmission lines,” Beijing: China
8000
Electric Power Press, 2009.
[9] Y. C. Cheng, C. R. Li, X. J. Shen, M. Chen and R. H.
4000 Chen,” Comparison Along Some Methods on Online De-
tecting of Composite Insulator,” High Voltage Engineer-
2 4 6 8 10 ing, Vol. 30, No. 6, 2004, pp. 35-37.
Length of strand(cm)
doi:10.3969/j.issn.1003-6520.2004.06.014
Figure 11. Influence of strand length. [10] Y. Cai and X. Hu, “State of the Art and Future Trend of
Detectors for Infrared Imaging Seekers,” Infrared and
Table 2. Mra about photon counting rate and significance test. Laser Engineering, Vol. 35, No. 1, 2006, pp.7-11.
doi:10.3969/j.issn.1007-2276.2006.01.002
R F T
[11] F. Chen and Y. R. Zhou, “Study on Infrared Image Li-
R F β0 β1 β2 β3 β4 brary and Remote Diagnosis Aid Systems,” East China
Electric Power, Vol. 36, No. 12, 2008, pp. 55-58.
Value 0.934 1080 -57980 49.29 101230 347.7 754.4
doi:10.3969/j.issn.1001-9529.2008.12.016
α ---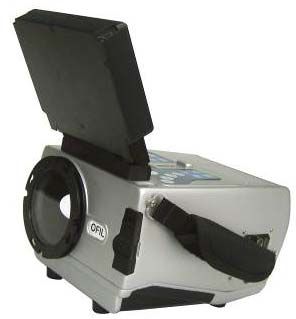
1302                                                  L. CHEN ET AL.

       HV Equipment,” ISH 2005, 2005.                                 1579-1585.
[13] W. L. Vosloo, G. R. Stolper and P. Baker. “Daylight Co-     [18] W.T. Hu and S. H. Wang, “Brief Discussion on Influence
     rona Discharge Observation and Recording System,”                Factors in Detecting Corona Discharge by UV Detector,”
     Proceedings of 10th International Symposium on HV En-            North China Electric Power, No. 1, 2009.
     gineering, Montreal, Quebec, Canada, Vol. 6,1997, pp.           doi:10.3969/j.issn.1003-9171.2009.01.002
     161-164.
                                                                 [19] I. A. D. Giriantari, “Monitoring the Insulator Condition
[14] P. Lindner, “Inspection for Corona and Arcing with the           by On-Line Voltage Distribution Measurement”, 2008
     Daycor Camera,” Proceeding of World Insulator Con-               International Conference on Condition Monitoring and
     gress and Exhibition, Hong Kong, China, 2005.                    Diagnosis, Beijing, China, April 21-24, 2008, pp. 392-
[15] M. Lindner, S. Elstein, P. Lindner, J. M. Topaz and A. J.        394.
     Phillips, “Daylight Corona Discharge Imager,” Proceed-      [20] O. P. Ivanov, V. E. Stepanov, S. V. Smirnov and A. G.
     ings of 11th International Symposium on High Voltage             Volkovich, “Development of Method for Detection of
     Engineering, London, UK, 1999, pp. 349-352.                      Alpha Contamination with Using UV-camera “DayCor”
[16] X. Lin and Y. B. Zhang, “Application of Ultraviolet Im-          by OFIL,” Nuclear Science Symposium and Medical Im-
     aging Technology to the Discharge of High-voltage Co-            aging Conference (NSS/MIC), IEEE, 2011, pp.
     rona,” Journal of North China Institute of Water Conser-         2192-2194.
     vancy and Hydroelectric Power, Vol. 32, No. 2, 2011, pp.    [21] L. Chen, X. M. Bian, F. L. Chen, X. B. Meng, L. M
     80-82. doi:10.3969/j.issn.1002-5634.2011.05.023                  Wang and Z. C. Guan, “Method to Judge Corona Incep-
[17] Y. Kim and K. Shong, “The Characteristics of UV                  tion Voltage of AC Transmission Lines Using Corona
     Strength According to Corona Discharge from Polymer              Cage,” High Voltage Engineering, Vol. 37, No. 1, 2011,
     Insulators Using a UV Sensor and Optic Lens,” IEEE               pp. 85-90.
     Transactions on Power Delivery, Vol. 26, No. 3, 2011, pp.

Copyright © 2013 SciRes.                                                                                                 EPE
You can also read