Quickstart for Web and Tablet App
←
→
Page content transcription
If your browser does not render page correctly, please read the page content below
Quickstart for Web and Tablet App
What is GeoGebra?
Dynamic Mathematic Software in one easy-to-use package
For learning and teaching at all levels of education
Joins interactive 2D and 3D geometry, algebra, tables, graphing,
calculus and statistics
Open source software, freely available from www.geogebra.org
Quick Facts
GeoGebra facilitates the creation of mathematical constructions and
models by students. It allows interactive explorations by dragging objects
and changing parameters.
GeoGebra is also an authoring tool for teachers to create interactive
worksheets. Find free classroom materials and share your own on
www.geogbratube.org.
Getting Started
After starting the Web or Tablet App of GeoGebra you will first see the
Perspectives Start Screen.
Select the GeoGebra Perspective that best fits the mathematical topic you
want to work with (e.g. Geometry, Algebra, Statistics). Please note that you
can switch between Perspectives at any time using the Perspectives menu.
GeoGebra Quickstart, Version 5.0 – www.geogebra.org 1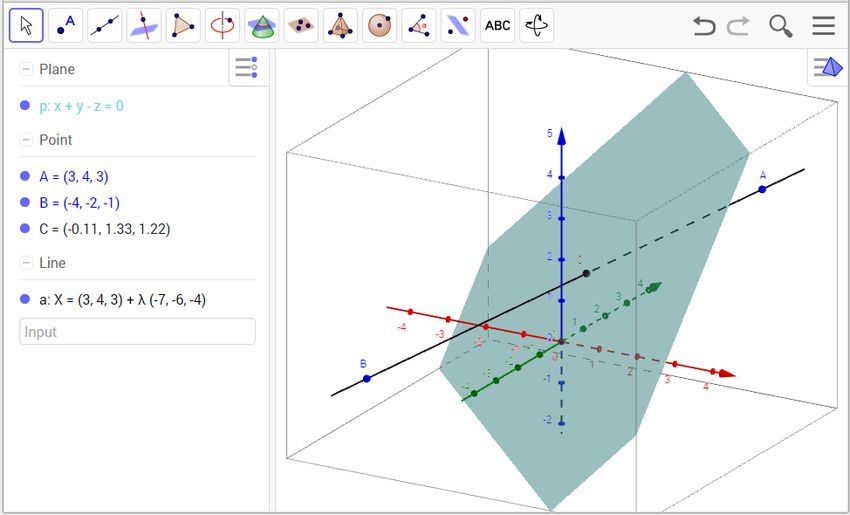
Toolbar   Undo / Redo

                                                                    Menu
      Input Field                                                          Style Bar
                                                                              Button

      Algebra View    Graphics View

The image above shows the default screen of the Algebra Perspective of
GeoGebra's Web or Tablet App. It displays the Algebra View and the Graphics
View in the GeoGebra window.

The Toolbar consists of a series of toolboxes containing a collection of related
tools. Using these tools you can create constructions in the Graphics View with
your mouse / your finger. At the same time the corresponding coordinates and
equations are displayed in the Algebra View. Please note that each View has
its own toolbar and therefore, gives access to a different set of tools.

The Input Field in the Algebra View is used to directly enter coordinates,
equations, commands or functions. After pressing the Enter key, the algebraic
representation of these objects is shown in the Algebra View while their
graphical representation is displayed in the Graphics View.

In addition, GeoGebra offers a 3D Graphics View, a CAS View to use
GeoGebra's Computer Algebra System for symbolic computations, a
Spreadsheet View to work with data and statistical concepts, as well as a
Probability Calculator to calculate and graph probability distributions.

All Views or GeoGebra are linked dynamically, meaning that if you modify an
object in one of the Views, its representations in the other Views automatically
adapt to these changes if possible.

Please note that this document provides information about both the Web and
Tablet App of GeoGebra. Depending on your input device (mouse or finger)
you will need to either click or tap on the screen while working through the
following examples. In order to keep the instructions simple, we are only using
the term 'tap' which is equivalent to 'click'.

Click on the   YouTube icon next to an example heading in order to open
and watch the corresponding Quickstart video tutorial.

GeoGebra Quickstart, Version 5.0 – www.geogebra.org                                    2
Example 1: Circumcircle of a Triangle
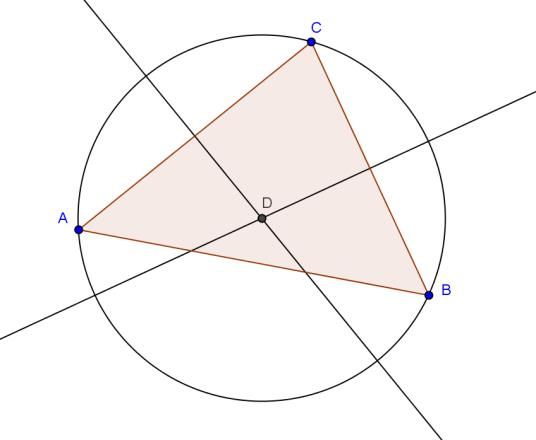
Task: Construct a triangle A, B, C and its circumcircle using GeoGebra.
Preparations
Open the GeoGebra Web or Tablet App and select the Geometry
Perspective from the Perspectives Start Screen.
Familiarize yourself with the tools provided in the Graphics View Toolbar.
Hint: You can open a toolbox by tapping on one of the default tools.
Construction Steps
Choose the tool Polygon from the Toolbar. Now counter-
clockwisely tap three times on the Graphics View to create the
1
vertices A, B, and C. Close the triangle by tapping on point A
again.
Select the tool Perpendicular Bisector and construct two line
2
bisectors by consecutively tapping on two sides of the triangle.
Hint: If a tool is not displayed in the Toolbar by default, you may
want to look for it in the toolboxes.
Using the tool Intersect you can successively tap on the line
3
bisectors to create the center of your triangle’s circumcircle.
Hint: By default, the intersection point is named D.
Select the tool Circle with Center through Point. Tap first on the
4 center point D, then on any vertex of the triangle to create the
circumcircle.
Using the Move tool you can now use your finger to drag the
5 triangle vertices - your construction will change dynamically while
you move them.
Hint: In order to move the whole construction within the Graphics
View, select the tool Move Graphics View and simply drag it
around.
GeoGebra Quickstart, Version 5.0 – www.geogebra.org 3Hints
Try the Undo / Redo buttons on the right side of the Toolbar.
Use the Show / Hide Object tool from the Graphics View Toolbar in order to
hide an object. Using this tool, select all objects you would like to hide. Then,
switch to another tool in order to apply your changes.
You can change the appearance of objects (e.g. change color or line style,
show / hide labels) easily using the Style Bar. Select the object you want to
enhance and tap the Style Bar Button in the upper right corner of the
Graphics View in order to open the Style Bar.
You can also show / hide axes and a grid using the Style Bar. Tap on the
white background of the Graphics View to make sure that no object is
selected. Then, tap the Style Bar Button in the upper right corner of the
Graphics View in order to open the Style Bar.
Example 2: Parameters of a Linear Equation
Task: Use sliders to dynamically change the parameters of a linear equation.
Preparations
Open the GeoGebra Web or Tablet App and select the Algebra
Perspective from the Perspectives Start Screen.
OR
Tap on the Menu button on the top right corner of the GeoGebra
window and select New from the File menu. Then select the
Algebra Perspective from the Perspectives Start Screen.
GeoGebra Quickstart, Version 5.0 – www.geogebra.org 4Construction Steps
Enter y = 0.8 * x + 3.2 into the Input Field in the Algebra View
1
and hit the Enter key.
Exploration: Which parameters can be changed when you modify
2
the line in the Graphics View by using your finger to drag the line?
In the Graphics View, use the Delete tool in order to delete the
3 line.
Hint: You need to open a toolbox in order to select this tool.
Use the Slider tool in order to create two sliders a and b using the
4
default settings of sliders.
Hint: After tapping on the Graphics View, a window appears
allowing you to specify the parameters of your slider. Tap Apply in
order to close the window and create a slider.
5 Enter y = a * x + b in the Algebra View and hit the Enter key.
Select tool Intersect from the Graphics View Toolbar in order to
6
create the intersection point A between the line and the y-axis.
Use the Point on Object tool in order to create a point B at the
7
origin.
Use the Segment tool in order to create a segment between
8
points A and B.
9 Use the Slope tool in order to create a slope (triangle) of the line.
Hint
You might want to enhance the appearance of your construction using the
Style Bar (e.g. increase the line thickness of the segment to make it visible on
top of the y-axis, show the slope's value instead of its name). Select the object
you want to enhance and then tap on the Style Bar Button in the upper right
corner of the Graphics View in order to open the Style Bar.
GeoGebra Quickstart, Version 5.0 – www.geogebra.org 5Example 3: Intersection of Polynomial Functions
Task: Explore how a parabola can be intersected with a linear function by
determining the roots of their difference function.
Preparations
Open the GeoGebra Web or Tablet App and select the CAS
Perspective from the Perspectives Start Screen.
OR
Tap on the Menu button on the top right corner of the GeoGebra
window and select New from the File menu. Then select the
CAS Perspective from the Perspectives Start Screen.
Construction Steps
In the CAS View, create a quadratic polynomial by entering
1 f(x):= x^2 – 3/2 * x + 2 into the first row and hitting the Enter
key.
Select the Slider tool from the Graphics View Toolbar and create
2
two sliders a and b using the default settings of sliders.
Hint: After tapping on the Graphics View, a window appears
allowing you to specify the parameters of your slider. Tap Apply in
order to close the window and create a slider.
In the CAS View, create a linear function by entering
3
g(x):= a * x + b into the next row and hitting the Enter key.
In the Graphics View, use the Move tool in order to change the
4
value of slider a to 0.5 and the value of slider b to 2.
In the CAS View, enter h(x):= f(x) – g(x) in order to determine
5
the difference between those functions.
Enter h(x), then select the tool Factor from the CAS View Toolbar in
6
order to factorize the polynomial.
Hint: You can now use these factors to determine the roots of h(x).
GeoGebra Quickstart, Version 5.0 – www.geogebra.org 67 Enter Solve[h(x)] in order to confirm the roots.
Hint: GeoGebra creates a list of points which can be displayed in
the Graphics View by tapping on the Show / Hide Object icon
below the corresponding row number of the CAS View.
Enter Intersect[f(x), g(x)] in order to create the intersection
8
points of functions f(x) and g(x).
Hint: You might want to display the intersection points in the
Graphics View as well.
Exploration: Try to find out what the intersection points of f(x) and
g(x) have in common with the roots of the difference function h(x).
9
Change the parameters of the linear function to find out for which
values of a and b there are two, one, or no intersection point(s).
Hint: Use the Move tool in order to change the values of the sliders
and create new functions to explore.
Hints
The CAS View allows you to work with fractions, equations and formulas (that
may include variables that have not already been defined).
Input and automatic completion
= Enter y = 2 x + 1 in order to define an equation.
Enter f(x):= 2x + 1 in order to assign the name f to the
:=
function.
If you enter opening parentheses or brackets, GeoGebra will
() []
automatically insert the corresponding closing counterpart.
While entering a command in the CAS View, GeoGebra tries to
automatically complete your command in order to help you with
the syntax.
Hint: Select the command you want from the appearing list and
hit Enter in order to accept the suggestion.
The CAS Toolbar offers three different tools to evaluate your input with:
'Evaluate' calculates and simplifies the input in a symbolic way.
'Numeric' calculates the input numerically and yields the result in
decimal notation.
'Keep Input' keeps and checks the input. This is very useful if you
don’t want your input to be simplified automatically, for example
when introducing the manipulation of expressions.
You can also manipulate only part of an expression by selecting it and then
tapping on a tool like Factor.
GeoGebra Quickstart, Version 5.0 – www.geogebra.org 7Example 4: Scatter Plot and Best Fit Line
Task: Create a Scatter Plot and conduct a Two Variable Regression Analysis for
a given data set. Explore how outliers affect the best fit line.
Preparations
Open the GeoGebra Web or Tablet App and select the Spreadsheet
Perspective from the Perspectives Start Screen.
OR
Tap on the Menu button on the top right corner of the GeoGebra
window and select New from the File menu. Then select the
Spreadsheet Perspective from the Perspectives Start Screen.
Construction Steps
In the Spreadsheet View, enter the following data values into the
1 cells of column A:
A1: 1 A2: 5 A3: 2 A4: 8 A5: -2
Hint: Always evaluate your input by tapping the Enter key.
Enter the following numbers into the spreadsheet cells of column
2 B:
B1: -1 B2: 2 B3: 3 B4: 4 B5: 1
Create a Scatter Plot from this data:
Highlight all cells of columns A and B that contain data. Then,
3 select the tool Create List of Points from the Spreadsheet View
Toolbar and tap Create in order to create points from your data
set.
Note: The values in column A determine the x-coordinates and
the values in column B specify the y-coordinates of the plotted
points.
Hint: You might want to use tool Move Graphics View if not all five
points are visible in the Graphics View.
GeoGebra Quickstart, Version 5.0 – www.geogebra.org 8Select the Best Fit Line tool from the Graphics View Toolbar.
4 Create the line that best fits your data points by using a selection
rectangle that contains all data points plotted.
Hint: Create a selection rectangle by tapping in the upper left
corner of the Graphics View and steadily sliding your finger to the
lower right corner of the Graphics View. Make sure that all data
points lie within the selection rectangle.
Exploration: Using this construction you can easily demonstrate
5 how outliers affect the best fit line of a data set. Select the Move
tool and drag one of the points in order to create an outlier.
Hint: You can also change the initial data directly in the
Spreadsheet View.
Hint
You may change the style (e.g. color, thickness) of the line and points. Select
the object you want to enhance and then tap the Style Bar Button in the
upper right corner of the Graphics View in order to open the Style
Bar.
Example 5: Intersection of a Plane and a Line
Task: Find out how you can intersect a plane and a line in the 3D Graphics
View of GeoGebra.
GeoGebra Quickstart, Version 5.0 – www.geogebra.org 9Preparations
Open the GeoGebra Web or Tablet App and select the
3D Graphics Perspective from the Perspectives Start Screen.
OR
Tap on the Menu button on the top right corner of the GeoGebra
window and select New from the File menu. Then select the
3D Graphics Perspective from the Perspectives Start Screen.
Construction Steps
Enter p: x + y = z into the Input Field in the Algebra View and tap
1
the Enter key in order to define a plane p.
Create two points A and B by entering A = (3, 4, 3) and
2 B = (-4, -2, -1) in the Algebra View and tapping the Enter key
after each input.
Select the Line tool from the 3D Graphics Toolbar and tap on the
3
points A and B respectively to create the line a through both points.
Select the Intersect tool. Then, tap on the plane and the line in
4
order to create the intersection point C.
Exploration: Use the Move tool in order to change the position of
5 the points A and B. What happens to the intersection point if the
line is parallel to the plane, or if both points lie within the plane?
Hint: By clicking on a point you may switch between moving the
point parallel to the x-y-plane or parallel to the z-axis.
Hints
You might want to use the tool Rotate 3D Graphics View to get different
views on your construction.
You might want to enhance the appearance of your construction by using the
Style Bar. Select the object you want to enhance and then tap the Style Bar
Button in the upper right corner of the Graphics View in order to open the
Style Bar.
You can also hide the x-y-plane or the coordinate axes using the Style
Bar. Tap on the white background of the Graphics View to make sure that no
object is selected before you open the Style Bar.
Further Information
You can find further information, materials, and help on our web pages at
www.geogebra.org.
GeoGebra Quickstart, Version 5.0 – www.geogebra.org 10You can also read