The development of coupled NWP forecasting at the Met Office - Tim Graham Dan Copsey, Chris Harris, Tim Johns, Rick Rawlins, Ann Shelley, Livia ...
←
→
Page content transcription
If your browser does not render page correctly, please read the page content below
The development of coupled
NWP forecasting at the Met
Office
Tim Graham
Dan Copsey, Chris Harris, Tim Johns,
Rick Rawlins, Ann Shelley, Livia Thorpe,
Michael Vellinga.

www.metoffice.gov.uk                       © Crown Copyright 2020, Met Office
Structure of presentation

     Comparing coupled NWP vs atmosphere-only NWP

     Operational implementation

     Future changes after operational implementation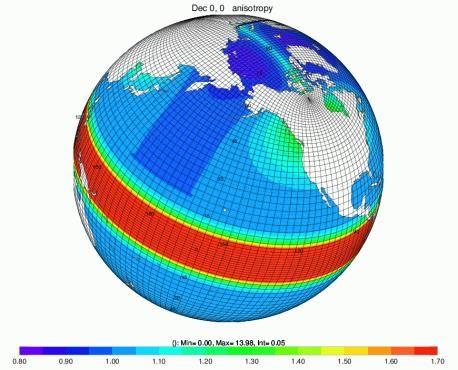
UM atmosphere using               JULES land surface
                                    GA6.1 physics                     using GL8.0 physics
                                                          Internal
Introduction                                              communication

• Original motivation was
  a WGNE meeting to run
  Transpose CMIP
  experiments                                                    OASIS3-MCT
                                                                 coupler (every hour)
• The Met Office plans to
  move to coupled NWP
  for its operational
  weather forecasts in late
  2021.
• Results presented here                                  Internal
  is for PS41 coupled                                     communication
  NWP which consists of       NEMO ocean
  components shown on                                                  CICE sea ice using
  right                       using NEMO3.6 and GO6                    CICE5.1.2 and GSI8
                              physics                                  physics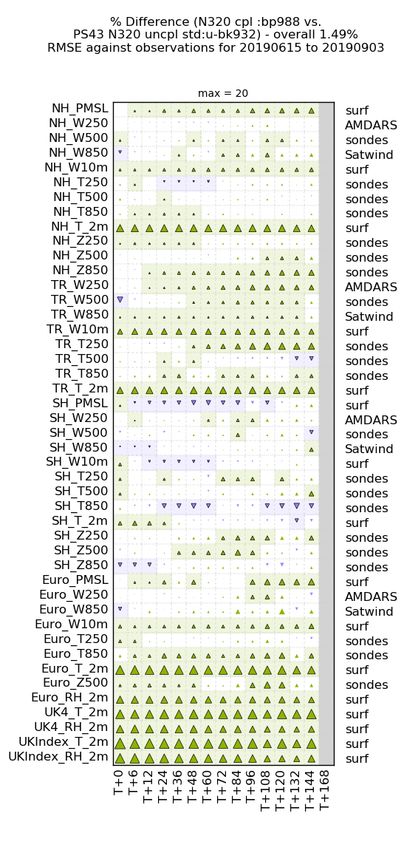
Models to compare
                                     Operational atmosphere only         Coupled NWP model
                                     NWP model (UNCPLD)                  (CPLDNWP)
Physics options                      PS41                                PS41

Atmospheric horizontal resolution    N1280 = 10km grid spacing in mid    N1280 = 10km grid spacing in mid
                                     latitudes                           latitudes
Atmospheric vertical levels          70 levels                           70 levels

Sea surface temperatures and sea     Provided by OSTIA SST and sea       Provided by NEMO/CICE
ice                                  ice analysis and kept constant
Atmospheric model’s land sea         Derived from IGBP including large   Derived from NEMO mask
mask                                 lakes as sea points
Ocean/sea-ice horizonal resolution                                       ORCA025 = 25km grid spacing

Ocean vertical levels                                                    75

Coupling interval                                                        Every hour
Initialisation of the forecasts
                                                                  Coupled model
                                                                     forecast

                                                          Atmosphere model
                       Atmosphere model   Atmosphere DA    initialisation and
                          background                            forecast

                        Ocean model        Ocean DA          Ocean model
                        background                         initialisation and
                                                                forecast

www.metoffice.gov.uk                                                        © Crown Copyright 2020, Met Office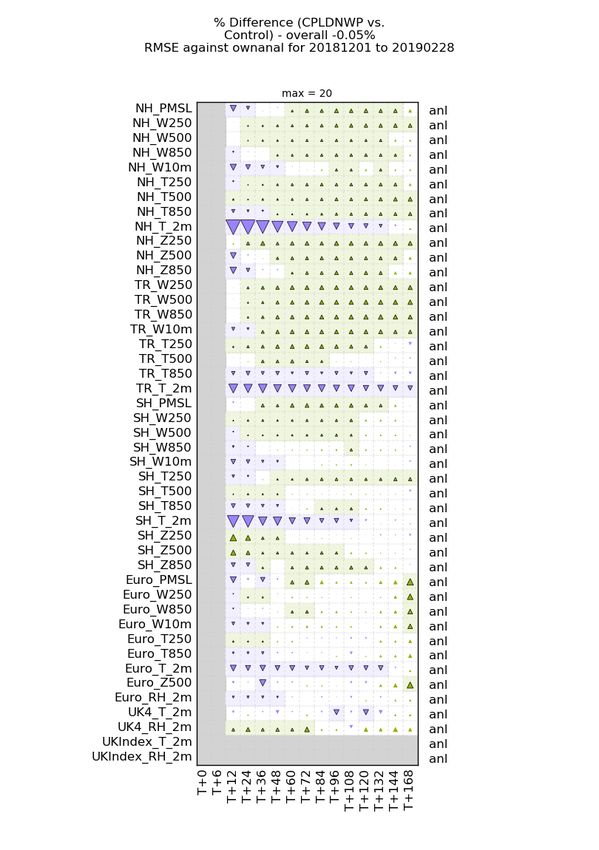
Northern Hemisphere
  Verification statistics
Based on RMSE statistics against UM analysis.
Green up arrow = CPLDNWP improved over UNCPLD

                                                                             Tropics
Blue down arrow = CPLDNWP degraded over UNCPLD

                                                                             Southern Hemisphere
Almost all fields improved apart from 2m temperatures
(T_2m). CPLDNWP penalised as not using OSTIA SSTs
and OSTIA lakes (which both UM analysis and UNCPLD
use).

                                                                              Europe
1st Dec 2018 – 28th Feb 2019. 00Z forecasts.

                                                                       UK
         Vellinga et al. 2020 – published in Weather and Forecasting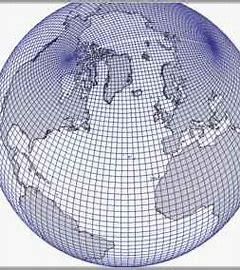
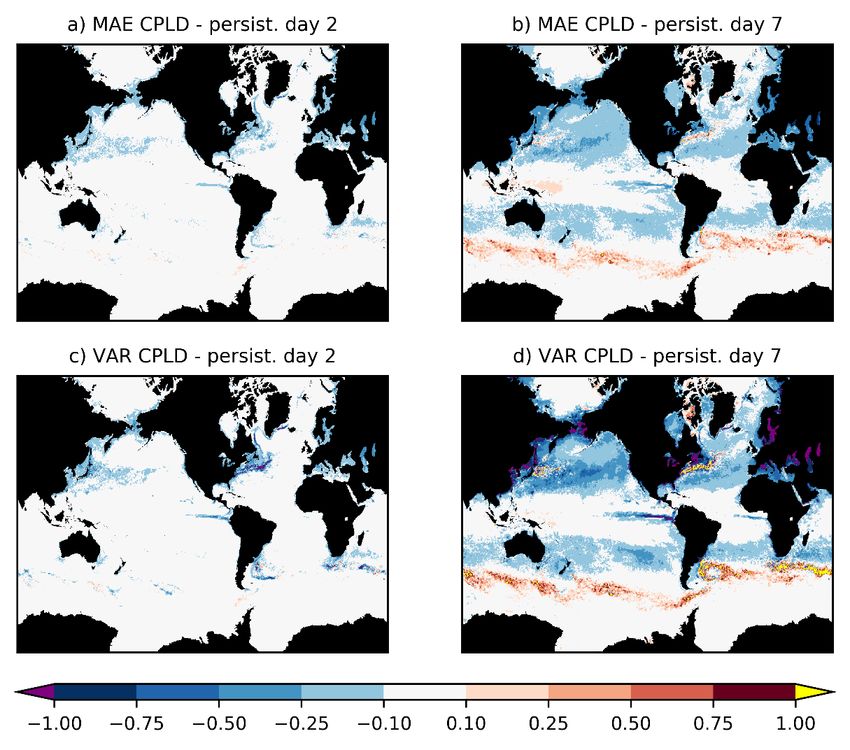
SST forecast performance vs persistence
                     Verification against FOAM analysis
                     MAE = mean absolute error
                     VAR = variance of difference
                     between forecast and observations

                         SST forecast improved in North
                         Pacific, North Atlantic and
                         southern sub-tropics

                        SST forecast degraded in
                        Southern Ocean

                     26th Sept 2018 – 25th Sept 2019. 00Z forecasts.
                   Vellinga et al. 2020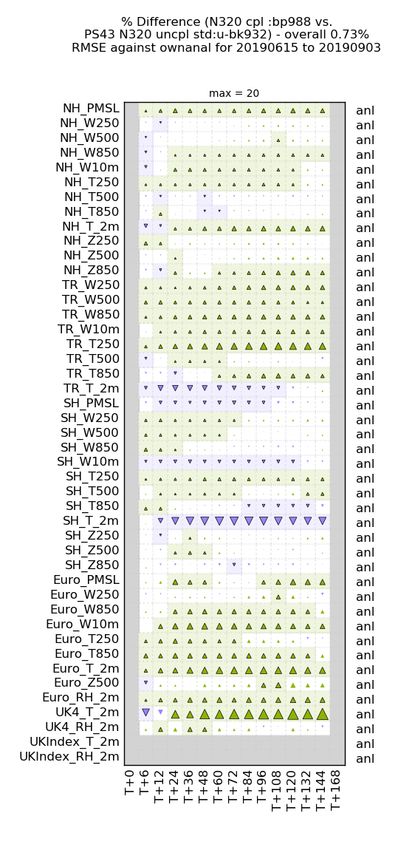
500 hPa geopotential height (Z500) and 250 hPa
zonal wind (U250)
                                  Plots are for T+168 (day 7)
                                Verification against UM analysis
                                VAR = variance of difference
                                between forecast and
                                observations

                                Largest improvements to the
                                atmosphere are near the
                                equator

                                26th Sept 2018 – 25th Sept 2019. 0Z fcst.

                                        Vellinga et al. 2020
Tropical cyclone tracks
                 Track error superior counts
                 averaged over all tropical cyclones:
                 CS = CPLDNWP is Superior
                 US = UNCPLD is Superior
                 SIM = Both systems Similar

                  Coupled model gives lower
                  track errors most often

                     11th July 2017 – 1st Nov 2019. 0Z forecasts.
                                 Vellinga et al. 2020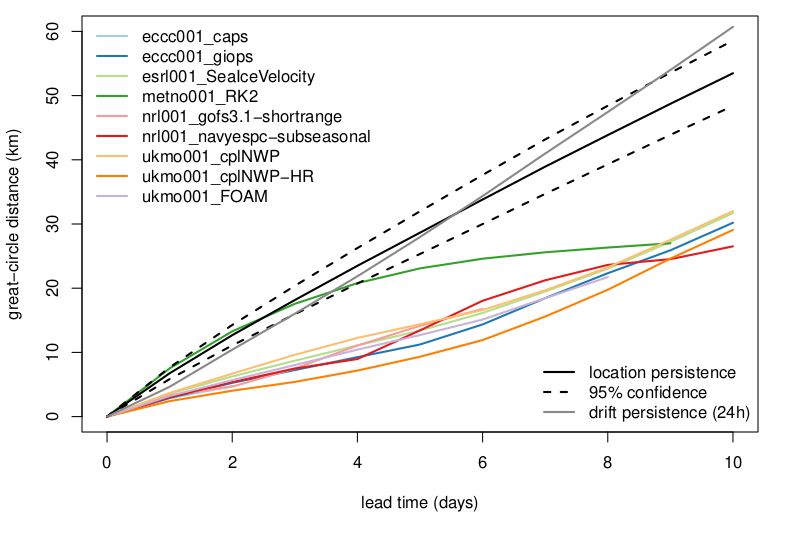
Tropical Storm Intensity
• Storms are grouped by
  intensity in percentiles.
• Little difference when
  considering strongest 95% of
  storms.
• Much bigger impact when
  considering the strongest
  50%.
Sea Ice Drift Forecast Experiment for MOSAiC

                                     10-day forecast
                                     error (km) for
                                     predictions for
                                     the trajectory of
                                     IABP buoy
                                     #300234063991
                                     680 on 5th June
Example consensus forecast           2019 compared
(solid line, coloured triangles
                                     with simple
and uncertainty ellipses) of 7-
day MOSAiC drift. Actual ship        location and drift
position overlain (dotted line,      persistence
coloured squares).                   forecasts

Ed Blockley
Operational implementation
Weakly coupled data assimilation

• Background for data
  assimilation taken                         Atmosphere DA
                             Coupled model                    Coupled model
  from coupled model          background                     initialisation and
                                              Ocean DA
                                                                  forecast
• Data assimilation run
  separately for ocean
  and atmosphere

  www.metoffice.gov.uk                                       © Crown Copyright 2020, Met Office
Operational Implementation • Plan to make coupled NWP with weakly coupled DA operational from late 2021 • Resolution will be N1280L70 (~10km) ORCA025L75 for the deterministic model and N640 (~20km) ORCA025L75 for the ensemble • Ensemble will use ocean analysis from the deterministic model + SST perturbations but development of an ocean ensemble DA system is underway for future implementation.
Scorecard for N320
summer trial
• Model now compared against
  own analysis

• 2m temperature bias much
  improved.

• Overall improvement
Future changes after operational implementation
Initial operational                                         Future coupled NWP
        coupled NWP
                                                                                  OASIS3-MCT                OASIS3-MCT

                        OASIS3-MCT
                                             ORCA025
Subroutine level
                                                                                               OASIS3-MCT
                                                                                                                          ORCA12
                   UM                NEMO                                           LFRic                   NEMO
                                            Subroutine level
                                                               Subroutine level                                          Subroutine level

                           XIO
                            S
                                                                                                 XIO                            SI3
                                                                                                  S
Summary
• Using a coupled NWP model gives better verification scores than an
atmosphere only model (except 2m temperatures).
• Remaining 2m temperature issues can be fixed by verifying vs a weakly
coupled DA analysis and by using OSTIA lake SSTs.
• SST forecasts are improved over persistence, (except in Southern Ocean).
• 500 hPa heights, 250 hPa winds and tropical cyclones are all (on average)
improved.
• We are aiming for the operational coupled NWP model to be GC4 in
autumn 2021.
• The Met Office coupled NWP is moving to a new sea ice model (SI3 –
GC5), a higher resolution ocean (ORCA12) and then a cubesphere grid
atmosphere (LFRic – GC6), with© Crown copyright Met
possible
Office wave model.You can also read