Multisystem involvement, defective lysosomes and impaired autophagy in a novel rat model of nephropathic cystinosis - Oxford Academic
←
→
Page content transcription
If your browser does not render page correctly, please read the page content below
Human Molecular Genetics, 2022, Vol. 00, 00, 1–17
                                                                                                                  https://doi.org/10.1093/hmg/ddac033
                                                                                                        Advance access publication date 8 February 2022
                                                                                                                                         Original Article

Multisystem involvement, defective lysosomes and
impaired autophagy in a novel rat model of
nephropathic cystinosis

                                                                                                                                                               Downloaded from https://academic.oup.com/hmg/advance-article/doi/10.1093/hmg/ddac033/6524058 by guest on 04 June 2022
Patrick Krohn1 , Laura Rita Rega2 , Marianne Harvent1 , Beatrice Paola Festa1 , Anna Taranta2 , Alessandro Luciani1 , Joseph Dewulf3 , 4 ,
Alessio Cremonesi5 , Francesca Diomedi Camassei6 , James V.M. Hanson7 , Christina Gerth-Kahlert7 , Francesco Emma2 , 8 ,
                         1 ,†,
Marine Berquez                   * and Olivier Devuyst1 , 9 ,†, *
1 Institute of Physiology, University of Zurich, Zurich 8057, Switzerland
2 Renal  Diseases Research Unit, Genetics and Rare Diseases Research Area, Bambino Gesù Children’s Hospital, IRCCS, Rome 00165, Italy
3 Department of Laboratory Medicine, Cliniques universitaires Saint Luc, UCLouvain, Brussels 1200, Belgium
4 Department of Biochemistry, de Duve Institute, UCLouvain, Brussels 1200, Belgium
5 Division of Clinical Chemistry and Biochemistry, University Children’s Hospital Zurich, Zurich 8032, Switzerland
6 Department of Laboratories–Pathology Unit, Bambino Gesù Children’s Hospital, Rome 00165, Italy
7 Department of Ophthalmology, University Hospital Zurich and University of Zurich, Zurich 8091, Switzerland
8 Department of Pediatric Subspecialties, Division of Nephrology, Children’s Hospital Bambino Gesù, IRCCS, Rome 00165, Italy
9 Institut de Recherche Expérimentale et Clinique, UCLouvain, Brussels, Belgium

*To whom correspondence should be addressed at: University of Zurich, Mechanisms of Inherited Kidney Disorders Group, Winterthurerstrasse 190, Zurich 8057,
Switzerland. Tel: +41 (0)44 635 51 07; Email: marine.berquez@uzh.ch (Marine Berquez); Tel: +41 (0)44 635 50 82; Fax: +41 (0)44 635 68 14; Email:
olivier.devuyst@uzh.ch (Olivier Devuyst)
† Marine   Berquez and Olivier Devuyst co-directed the study.

Abstract
Recessive mutations in the CTNS gene encoding the lysosomal transporter cystinosin cause cystinosis, a lysosomal storage disease
leading to kidney failure and multisystem manifestations. A Ctns knockout mouse model recapitulates features of cystinosis, but the
delayed onset of kidney manifestations, phenotype variability and strain effects limit its use for mechanistic and drug development
studies. To provide a better model for cystinosis, we generated a Ctns knockout rat model using CRISPR/Cas9 technology. The Ctns−/−
rats display progressive cystine accumulation and crystal formation in multiple tissues including kidney, liver and thyroid. They
show an early onset and progressive loss of urinary solutes, indicating generalized proximal tubule dysfunction, with development
of typical swan-neck lesions, tubulointerstitial fibrosis and kidney failure, and decreased survival. The Ctns−/− rats also present
crystals in the cornea, and bone and liver defects, as observed in patients. Mechanistically, the loss of cystinosin induces a phenotype
switch associating abnormal proliferation and dedifferentiation, loss of apical receptors and transporters, and defective lysosomal
activity and autophagy in the cells. Primary cultures of proximal tubule cells derived from the Ctns−/− rat kidneys confirmed the key
changes caused by cystine overload, including reduced endocytic uptake, increased proliferation and defective lysosomal dynamics
and autophagy. The novel Ctns−/− rat model and derived proximal tubule cell system provide invaluable tools to investigate the
pathogenesis of cystinosis and to accelerate drug discovery.

Introduction                                                                      The leading cause of inherited RFS in children is
The proximal tubule (PT) segment of the kidney reab-                            nephropathic cystinosis (MIM #219800), a lysosomal
sorbs and processes large quantities of essential nutri-                        storage disease (LSD) caused by recessive, inactivating
ents and solutes, playing a crucial role in maintaining                         mutations in the CTNS gene coding for the proton-
homeostasis. These transport processes are sustained by                         driven transporter cystinosin that exports cystine out
an active endolysosomal system operating at the apical                          of lysosomes (2). The loss of cystinosin results in the
pole of the cells. Congenital or acquired disorders affect-                     accumulation of cystine within lysosomes in all organs,
ing the endolysosomes lead to PT dysfunction, charac-                           but particularly affecting the PT segment of the kidney.
terized by the inappropriate loss of low molecular weight                       Infants with cystinosis show manifestations of PT dys-
(LMW) proteins and solutes in the urine. This condition,                        function and RFS within the first year of life, complicated
referred to as renal Fanconi syndrome (RFS), may lead to                        by growth retardation, metabolic bone disease and
severe electrolyte imbalance, growth and bone defects,                          progressing to CKD and kidney failure by the age of
and the development of chronic kidney disease (CKD) (1).                        10 years if untreated. Other complications resulting from

Received: November 23, 2021. Revised: January 21, 2022. Accepted: February 2, 2022
© The Author(s) 2022. Published by Oxford University Press.
This is an Open Access article distributed under the terms of the Creative Commons Attribution License (https://creativecommons.org/licenses/by/4.0/), which
permits unrestricted reuse, distribution, and reproduction in any medium, provided the original work is properly cited.
2   |   Human Molecular Genetics, 2022, Vol. 00, No. 00

cystine crystals and lysosomal disease include reduced          Here, we present a novel Ctns knockout rat model for
vision and recurrent corneal erosions, hypothyroidism,       nephropathic cystinosis obtained by using CRISPR/Cas9
hypogonadism, diabetes, myopathy, liver disease and          (clustered regularly interspaced short palindromic
degeneration of the central nervous system (3,4). The        repeats/CRISPR associated protein 9) technology. The
oral administration of cysteamine, which depletes            Ctns knockout rats recapitulate essential clinical and
cystine out from the lysosomes, delays the progression       molecular features of cystinosis, including the role of
of kidney failure and improves the overall prognosis.        defective endolysosomal dynamics and autophagy. These
However, cysteamine is poorly tolerated and does not         features were verified in a primary cell culture system
treat or prevent PT dysfunction (3,5–7). Thus, there is an   derived from the rat kidney. This rat model represents a
urgent need to identify novel treatment modalities for       powerful new tool to substantiate and to accelerate drug

                                                                                                                          Downloaded from https://academic.oup.com/hmg/advance-article/doi/10.1093/hmg/ddac033/6524058 by guest on 04 June 2022
cystinosis.                                                  discovery in cystinosis.
   Animal models are crucial to understand mecha-
nisms of disease and to develop new therapies. The
most used model for cystinosis is the Ctns knockout          Results
(Ctns−/− ) mouse developed by Cherqui et al. (8), which      CRISPR/Cas9-induced deletion of Ctns and
recapitulates cystine overload, PT dysfunction and ocular    cystine accumulation in Ctns−/− rats
alterations (9,10). Studies based on Ctns−/− mice have       A rat model for cystinosis was generated by targeted
identified the role of impaired endolysosomal trafficking    disruption of the Ctns gene using CRISPR/Cas9. Injection
and proteolysis, defective lysosomal clearance and           of the two guide RNAs in oocytes of Sprague–Dawley rats
apical dedifferentiation in disease progression (9,11–       caused a premature stop codon in exon 3 of Ctns (Fig. 1A).
13). However, the Ctns−/− mice present a less severe         The deletion of Ctns/cystinosin was confirmed at DNA
phenotype compared with cystinotic patients, with a          (Fig. 1B) and mRNA (Fig. 1C) levels. Screening for off-
late onset and high variability in the extent of tubular     target sequences using CAS-OFFinder showed no editing
dysfunction, no kidney failure and no change in lifespan     in other genes (31). All rats were born at Mendelian ratio
(7,10,14). Moreover, the kidney phenotype depends on         and were viable. The direct consequence of cystinosin
the genetic background, with C57BL/6 Ctns−/− mice            deletion was reflected by elevated cystine content in
showing cystine accumulation associated with kidney          multiple tissues including spleen, kidney, heart, liver,
lesions, while FVB/N Ctns−/− mice do not develop kidney      muscle, brain and eyes (Fig. 1D). These data validate the
disease (10,15). An effect of sex on cystine content         specific deletion of the Ctns gene by CRISPR/Cas9 and
(higher levels in female versus male kidneys) has also       confirm the resulting, systemic accumulation of cystine
been observed, while no evidence for such an effect          in this novel rat model.
has been detected in humans (16). Discrepancies in
diverse forms of autophagy between human- and mouse-         Ctns−/− rats show growth retardation and
derived samples have also been reported (11,17,18). More     proximal tubule dysfunction
generally, mouse models have failed in many cases            We first characterized the kidney phenotype of the Ctns
to be predictive due to evolutionary differences with        rats over time. Ctns−/− animals displayed a progressive
humans (19).                                                 cystine accumulation in the kidneys from 3 weeks of
   As a model organism, the rat offers a high level          age, compared with Ctns+/+ rats (Fig. 2A). Growth retarda-
of genomic and physiologic similarities with humans          tion was observed starting from 20 weeks in both males
(20,21). Many inbred rat strains have been used in           and females (Fig. 2B). Metabolic cage analyses revealed
comparative physiology, cardiovascular, neurophysiology      polyuria at 28 weeks in Ctns−/− rats, paralleled by an
and behavioral studies, as well as for toxicology testing    increase in water consumption (Fig. 2C; Table 1). Blood
(22). One of these strains, the Long-Evans Agouti            and urine electrolyte levels were measured at different
(LEA/Tohm) rat, used as a model of type 2 diabetes, was      time points (Table 1; Fig. 2; Supplementary Material, Fig.
recently shown to carry a 13-bp deletion in the Ctns gene,   S1 and Table S1).
causing accumulation of cystine in various tissues and          Manifestations of PT dysfunction appeared early in
the appearance of glycosuria and kidney tubular lesions      Ctns−/− rats with glycosuria starting at 6 weeks of
before the onset of diabetes (23). The advantages of rats    age (Fig. 2D), followed by urinary loss of albumin and
over mouse models include larger body size, allowing         LMW proteins Clara cell secretory protein 16 (CC16),
more detailed phenotyping and extensive sampling,            transferrin (TF) and vitamin D–binding protein (VDBP),
and metabolic and detoxification pathways that are           starting at 12 weeks (Fig. 2E–G, Table 1). The LMW
closer to humans (20,24–26). Since the first generation      proteinuria increased over time (Table 1). Other tubular
of knockout rats using embryo microinjection of zinc-        manifestations included an excessive loss of calcium and
finger nucleases (27) or homologous recombination in         phosphate appearing at 28 and 40 weeks, respectively
ES cells (28,29), genetically engineered rat models have     (Fig. 2H and I), in line with the hypocalcemia, hypophos-
provided competitive advantages for modeling human           phatemia and the loss of VDBP observed in Ctns−/− rats
genetic diseases (30).                                       (Fig. 2G; Supplementary Material, Fig. S1A–D; Table S1).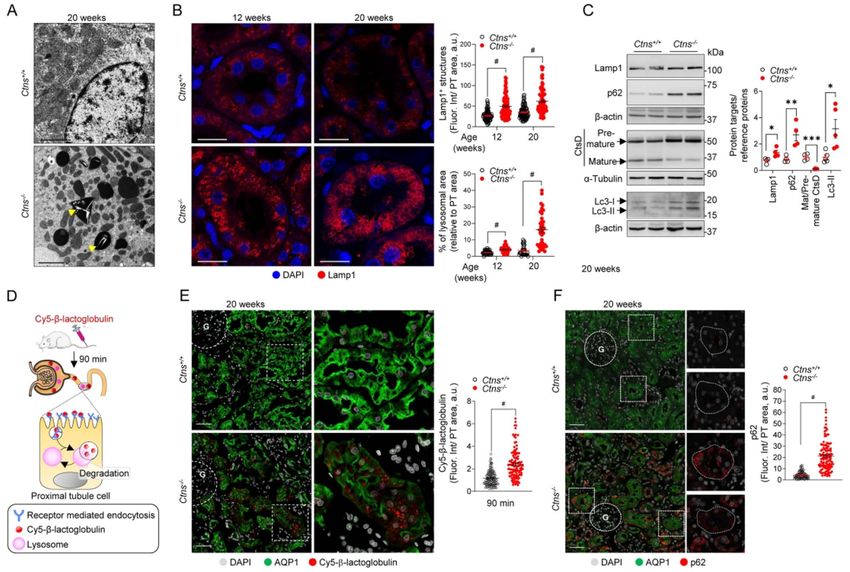
Human Molecular Genetics, 2022, Vol. 00, No. 00        |   3

                                                                                                                                                              Downloaded from https://academic.oup.com/hmg/advance-article/doi/10.1093/hmg/ddac033/6524058 by guest on 04 June 2022

Figure 1. Generation and validation of the Ctns knockout rat model. (A) CRISPR/Cas9 induced a 12 bp deletion (blue), which was repaired by an 8 bp
insertion (green), generating a frameshift of the open reading frame and resulting in a premature stop codon (TGA, red) in exon 3 of the Ctns gene. (B)
Ctns genomic DNA analyzed by PCR and agarose gel electrophoresis isolated from kidney biopsies. (C) Ctns and Gapdh expression in kidney biopsies were
analyzed by RT-qPCR (n = 5 rats per condition). (D) Cystine levels measured by HPLC in different tissues of 40-week-old Ctns rats (n = 5 Ctns+/+ and n = 6
Ctns−/− rats per condition). Plotted data represent mean ± SEM. Each dot represents one rat. Two-tailed unpaired Student’s t-test, ∗ P < 0.05, ∗∗ P < 0.01,
∗∗∗ P < 0.001 and #P < 0.0001 relative to Ctns+/+ rats. BDR: below detection range.

A selective aminoaciduria, including glutamine, methio-                         syndrome in Ctns−/− rats faithfully reflect the situation
nine and hydroxyproline was detected at 20 weeks in                             observed in patients with nephropathic cystinosis.
Ctns−/− rats (Supplementary Material, Fig. S1E), evolving
into a massive, generalized aminoaciduria at 28 weeks                           Ctns−/− rats develop tubular damage, kidney
(Fig. 2J). No sex differences in PT dysfunction were                            fibrosis and swan-neck lesions
observed in Ctns−/− animals. The growth retardation,                            We performed histological analyses to better char-
early PT dysfunction and development of renal Fanconi                           acterize kidney disease progression in Ctns−/− rats.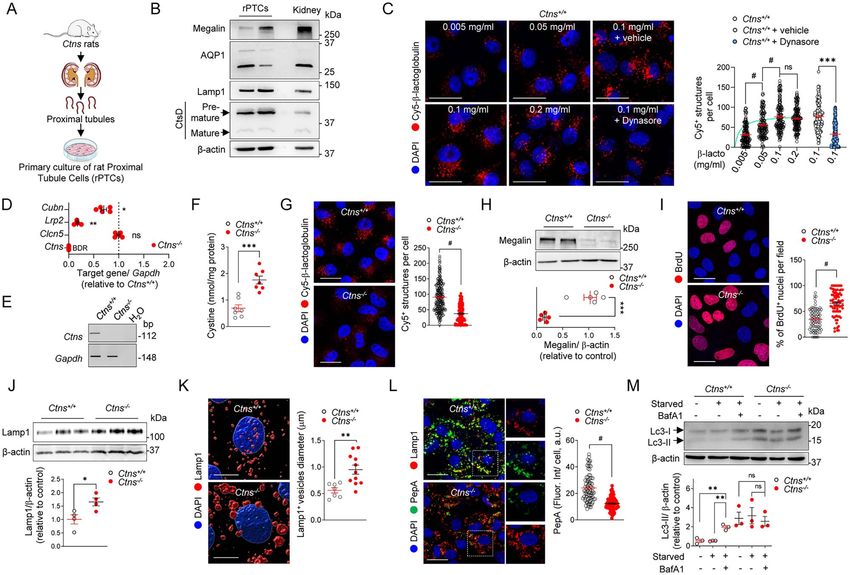
4   |   Human Molecular Genetics, 2022, Vol. 00, No. 00

                                                                                                                                                                     Downloaded from https://academic.oup.com/hmg/advance-article/doi/10.1093/hmg/ddac033/6524058 by guest on 04 June 2022
Figure 2. Deletion of Ctns leads to cystine accumulation in kidneys, growth retardation and renal Fanconi syndrome in rats. (A) Cystine levels measured
by HPLC in kidney cortex from Ctns+/+ and Ctns−/− rats at 3, 6, 12, 20 and 40 weeks of age (n = 5 rats at 3, n = 4 rats at 6 and n = 6 rats at 12, 20 and 40 weeks
per group). (B) Measurement of body weight over time in male and female rats (n = 10 rats per group). (C) Overnight urine excretion (milliliters of urine
per 16 h normalized to body weight; n = 10 rats per group). (D) Urinary excretion of glucose (n = 10 rats per group). (E) Coomassie blue–stained SDS-PAGE
analysis of urine at 6, 12, 20, 28 and 40 weeks of age and densitometry quantification of albumin (n = 8 rats per group). A total of 15 μg of BSA was loaded
as a positive control (Mw ∼ 66.5 kDa). (F) Urinary excretion of the low-molecular-weight protein CC16 (n = 8 rats per condition). (G) Representative western
blotting and densitometry quantification of transferrin (TF) and vitamin D–binding protein (VDBP) in urine derived from 20-week-old Ctns rats (n = 8 rats
per group). Measurement of urinary (H) phosphate and (I) calcium (n = 10 rats per group). (J) Relative concentration of amino acids in urine derived from
28-week-old Ctns rats (n = 5 rats per group). Ala, alanine; Arg, arginine; Asn, asparagine; Asp, aspartate; Cys, cysteine; Gln, glutamine; Glu, glutamate; Gly,
glycine; His, histidine; Hyp, hydroxyproline; Ile, isoleucine; Leu, leucine; Lys, lysine; Met, methionine; Orn, ornithine; Phe, phenylalanine; Pro, proline; Ser,
serine; Thr, threonine; Trp, tryptophan; Tyr, tyrosine; Val, valine. All the urine parameters were normalized to urinary creatinine concentration. Plotted
data represent mean ± SEM. Each dot represents one rat. Two-tailed unpaired Student’s t-test, ∗ P < 0.05, ∗∗ P < 0.01, ∗∗∗ P < 0.001 and #P < 0.0001 relative
to Ctns+/+ or Ctns−/− rats. ns: not significant.

Interstitial inf lammatory cell infiltrates were first                             deformities observed in cystinosis patients and asso-
observed at 12 weeks, increasing over time (Fig. 3A).                              ciated with apoptosis, monitored by cleaved caspase3
As inf lammation is the initial response to kidney                                 (Casp3) staining (Fig. 3D) and expression (Supplementary
injury, promoting fibrosis (32), we detected a strong                              Material, Fig. S2D and E) in Ctns−/− compared with
increase of expression of the profibrotic factor galectin-                         Ctns+/+ kidneys. Of note, we did not detect apoptosis
3 (33) also from 12 weeks of age (Supplementary                                    in glomerular cells at the investigated time points
Material, Fig. S2A). Picro-Sirius red staining revealed                            (Supplementary Material, Fig. S2E). Additional structural
progressive kidney fibrosis in Ctns−/− rats from 20 weeks                          damages observed in Ctns−/− rats included dilated renal
of age onwards, starting in the cortical regions and                               corpuscles with enlarged Bowman’s space, sclerotic
progressively extending to the outer and inner parts                               glomeruli and protein casts in PT lumen (Supplementary
of the medulla (Fig. 3B; Supplementary Material, Fig.                              Material, Fig. S2B). The presence of damaged glomeruli
S2B). These changes were associated with the strong                                was illustrated by the loss of immunoglobulin G (IgG) in
upregulation of genes involved in inf lammation (e.g.                              the urine of 40-week-old rats (Supplementary Material,
Cdc3g, Ccl19, Lgals3, Tlr4) and fibrosis (e.g. Col6a1, Col1a1,                     Fig. S2F). In line with the tubular damage, the Ctns−/− rats
Fn1, Col3a1, Vim) in Ctns−/− kidneys (Fig. 3C).                                    showed increased urinary levels of lipocalin-2 (LCN2) and
   Tubular lesions started at 20 weeks in Ctns−/− rats,                            kidney injury molecule-1 (Kim-1), starting at 3 months of
with a f lattening of the PT cells starting at the glomeru-                        age and increasing over time (Supplementary Material,
lotubular junction, characteristic for the ‘swan-neck’                             Fig. S2C). These changes were paralleled by increased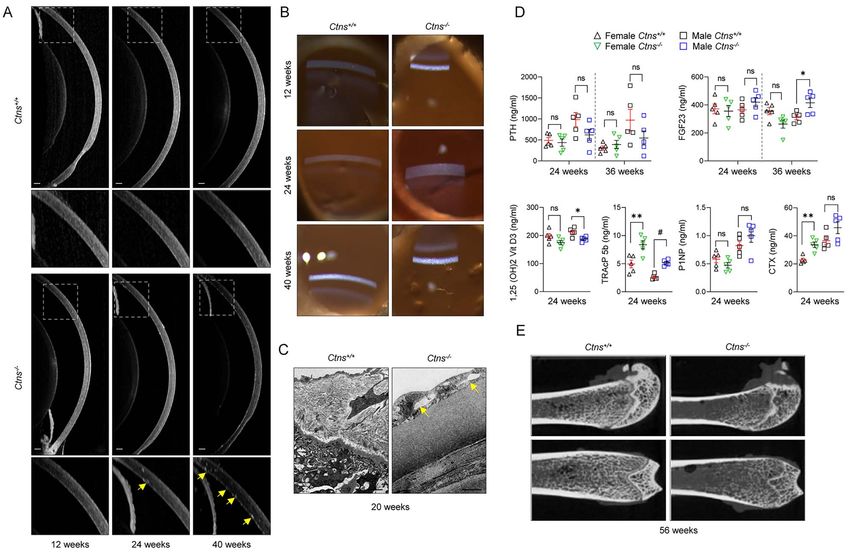
Human Molecular Genetics, 2022, Vol. 00, No. 00 | 5
mRNA levels of both Havcr1 (corresponding to Kim-1)
BW, Body weight U, Urine; BUN, Blood Urea Nitrogen. All the measurements were performed on Ctns+/+ and Ctns−/− male and female rats matched per age. Two-tailed unpaired Student’s t-test was applied between
∗∗∗
∗∗∗
∗∗
∗∗
∗∗
79.6 ± 6.49#
∗
286 ± 7.22#
82.1 ± 6.36
12.4 ± 1.74
1286 ± 334
1.28 ± 0.18
27.4 ± 6.24
16.1 ± 1.12
0.50 ± 0.05
∗
and Lcn2, and additional tubular damage markers
758 ± 165
40 weeks female
Ctns−/−
including cystatin C (Cst3), clusterin (Clu) and cysteine-
rich protein (Ccn1) in the Ctns−/− kidneys (Fig. 3E). The
progression of structural damages was associated with
363 ± 11.67
40.0 ± 2.39
2.88 ± 0.43
0.29 ± 0.02
0.50 ± 0.07
69.2 ± 9.80
16.9 ± 1.12
0.37 ± 0.01
270 ± 24.1
11.6 ± 3.7
kidney failure, as evidenced by an increase of blood urea
Ctns+/+
nitrogen (BUN) and creatinine (Fig. 3F and G), correlating
with a decreased survival in Ctns−/− rats (Fig. 3H).
∗∗∗
∗∗∗
∗∗
∗∗∗
∗∗
∗∗
∗∗
∗∗∗
88.1 ± 15.6
8.39 ± 1.62
63.1 ± 9.45
0.82 ± 0.13
27.6 ± 3.72
19.8 ± 2.20
0.55 ± 0.03
762 ± 237∗
517 ± 62.4
648 ± 101
Loss of cystinosin causes defective
Downloaded from https://academic.oup.com/hmg/advance-article/doi/10.1093/hmg/ddac033/6524058 by guest on 04 June 2022
40 weeks male
Ctns−/−
receptor-mediated and fluid-phase endocytosis
To investigate the mechanism underlying LMW pro-
31.1 ± 2.16
1.48 ± 0.22
3.82 ± 1.57
0.35 ± 0.03
0.18 ± 0.04
67.7 ± 10.4
17.7 ± 1.67
0.32 ± 0.02
teinuria in Ctns rats, we monitored receptor-mediated
645 ± 19.0
113 ± 17.6
Ctns+/+
and fluid-phase endocytosis using the in vivo uptake
of Cy5-labeled LMW protein β-lactoglobulin and Alexa
647-dextran in the kidney, respectively (Fig. 4A). Twenty
∗∗
6.28 ± 0.84∗
263 ± 5.02#
minutes after injection, a substantial accumulation
∗
43.3 ± 2.89
1.50 ± 0.34
0.72 ± 0.06
33.3 ± 4.21
16.7 ± 0.75
0.40 ± 0.04
13.5 ± 1.1#
465 ± 42.3
20 weeks female
Ctns−/−
of Cy5-positive vesicles was detected in the brush
border/subapical region of PT cells from Ctns+/+ rats,
contrasting with a major reduction of uptake in PTs from
291.3 ± 48.9
Ctns−/− rats (Fig. 4B). Fluid-phase endocytosis was also
42.4 ± 6.48
3.51 ± 0.50
0.42 ± 0.05
0.49 ± 0.09
58.6 ± 10.8
16.5 ± 0.94
0.30 ± 0.04
298 ± 4.67
0.83 ± 0.1
altered in Ctns−/− rats, as indicated by the reduced signal
Ctns+/+
for Alexa 647-dextran (Fig. 4C). The defective uptake of
LMW proteins was associated with a strongly decreased
∗∗∗
∗∗∗
16.73 ± 0.77
expression of the endocytic receptor megalin (encoded
434 ± 25.8#
∗∗
30.8 ± 1.72
1.49 ± 0.20
64.4 ± 10.3
2.28 ± 0.28
0.06 ± 0.03
0.31 ± 0.06
119 ± 13.5
80.8 ± 5.2
by Lrp2) in PTs of Ctns−/− kidneys, both at the protein and
20 weeks male
Ctns−/−
mRNA levels (Fig. 4D–F). Of note, the mRNA levels of the
co-receptor cubilin (Cubn), the phosphate cotransporter
genotypes at the indicated time points. ∗ P < 0.05, ∗ ∗ P < 0.01, ∗ ∗ ∗ P < 0.001 and # P < 0.0001 relative to Ctns+/+ rats.
37.2 ± 4.26
1.96 ± 0.49
0.67 ± 0.13
0.24 ± 0.05
16.5 ± 0.67
0.27 ± 0.02
IIa (NaPi-IIa, Slc34a1) and the sodium–glucose cotrans-
547 ± 8.41
115 ± 25.0
1.3 ± 0.28
32.6 ± 9.4
Ctns+/+
porter 2 (SGLT2, Slc5a2) were also decreased, in line
with the LMW proteinuria, phosphaturia and glycosuria
observed in Ctns−/− animals (Fig. 4F). In parallel, Ctns−/−
∗
27.7 ± 1.16
2.25 ± 0.33
0.55 ± 0.07
0.78 ± 0.03
75.4 ± 8.26
13.2 ± 0.93
0.34 ± 0.02
249 ± 7.17
122 ± 18.7
rats displayed a major increase in the level of genes
3,3 ± 0,39
Ctns−/−
12 weeks female
regulating cell cycle and driving proliferation (e.g. Cdk1,
Ccna2, Ccnb2) compared with Ctns+/+ animals (Fig. 4F).
These results were supported by a nuclear enrichment
14.49 ± 1.00
31.7 ± 2.97
2.71 ± 0.33
0.32 ± 0.03
0.71 ± 0.12
75.3 ± 10.0
0.33 ± 0.02
260 ± 3.10
151 ± 12.1
of PCNA (Fig. 4G; Supplementary Material, Fig. S3A) and
1.69 ± 0.6
Ctns+/+
Ki-67 (Supplementary Material, Fig. S3B) in PT cells of
Table 1. Body weight, urine and blood parameters in Ctns rats
Ctns−/− rats. The growth alterations in Ctns−/− rats were
substantiated by an increased kidney weight to body
∗
39.4 ± 2.71
1.91 ± 0.17
0.94 ± 0.11
0.16 ± 0.05
93.7 ± 9.52
12.8 ± 0.95
0.23 ± 0.04
447 ± 7.06
6.54 ± 1.8
38.9 ± 7.8
weight ratio starting at 20 weeks of age (Supplementary
Ctns−/−
12 weeks male
Material, Fig. S3C). These data indicate that cystinosin
deletion in rats induced a phenotype switch associating
abnormal proliferation and dedifferentiation, leading to
43.4 ± 6.68
2.11 ± 0.61
0.49 ± 0.08
0.23 ± 0.10
98.8 ± 20.2
13.2 ± 0.45
0.24 ± 0.01
449 ± 12.3
2.2 ± 0.62
43.5 ± 8.9
defective endocytosis and urinary loss of solutes.
Ctns+/+
Defective lysosomal homeostasis disrupts
U Phosphorus (g g−1 creatinine) n = 5
Enzymatic creatinine (mg dl−1 ) n = 5
autophagy in Ctns−/− kidneys
U Calcium (mg g−1 creatinine) n = 5
U Glucose (g g−1 creatinine) n = 5
Diuresis (ml kg−1 BW/16 h) n = 5
U CC16 (μg g−1 creatinine) n = 4
With cystinosin being a lysosomal membrane trans-
Water intake (ml/16 h) n = 10
porter, we next examined lysosomal dynamics in Ctns−/−
U Creatinine (mg dl−1 ) n = 5
rats. Electron microscopy (EM) revealed accumulation
Body weight (g) n = 10
of large and amorphous vacuoles in the kidneys of
BUN (mg dl−1 ) n = 5
Ctns−/− rats at 12 and 20 weeks of age, with formation of
thin needle-shaped crystals within enlarged and dense
vesicles in PT cells (Fig. 5A; Supplementary Material, Fig.
S4A). Crystal formation was also detected in liver and
thyroid samples (Supplementary Material, Fig. S4B).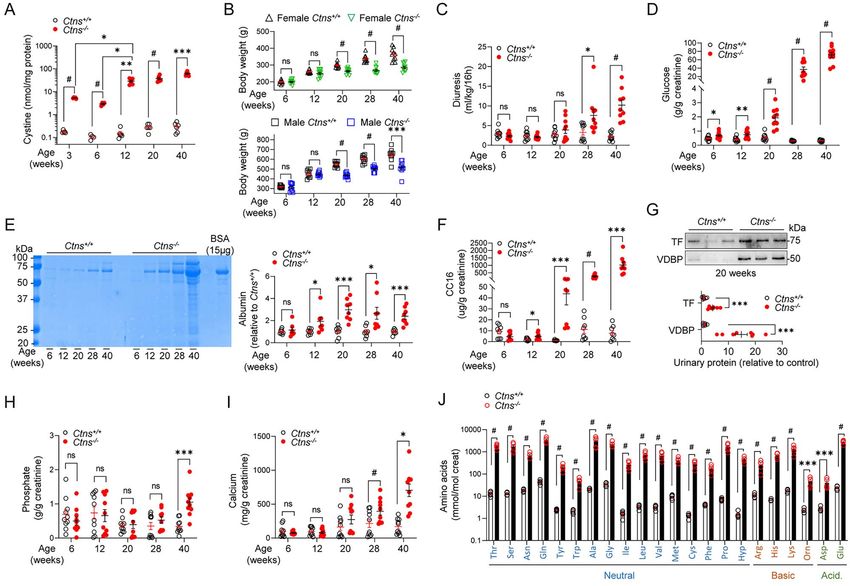
6   |   Human Molecular Genetics, 2022, Vol. 00, No. 00

                                                                                                                                                                     Downloaded from https://academic.oup.com/hmg/advance-article/doi/10.1093/hmg/ddac033/6524058 by guest on 04 June 2022
Figure 3. Inf lammation, fibrosis and apoptosis in Ctns−/− rat kidneys. (A) Representative confocal micrographs and quantification of the number of
CD3+ cells (red, top) in kidneys of 12-, 20- and 40-week-old Ctns rats (n = 67–95 areas pooled from three rats per group). (B) Representative micrographs
of Picro-Sirius Red staining and quantification of fibrotic tissue in the cortex relative to tissue surface (bottom, n = 5 Ctns+/+ and n = 8 Ctns−/− rats per
group). The black dotted line delineates the cortex from the medulla. Insets: high magnification of the corresponding section. (C) RT-qPCR analysis of
inf lammatory markers Cd3g, Ccl19, Lgals3, Tlr4 and fibrotic markers Col6a1, Col1a1, Fn1, Col3a1, Vim in kidneys of 20-week-old rats. Gene target expression
normalized to Gapdh and relative to Ctns+/+ rats (black dotted line; n = 12 Ctns+/+ rats and n = 15 Ctns−/− per group). (D) Representative picture of swan-
neck lesion (dotted line) and confocal micrographs of cleaved Caspase 3 (Casp 3, red). (E) RT-qPCR analysis of Lcn2, Havcr1, Cts3, Clu and Ccn1 expression
in Ctns rat kidneys. Gene target expression normalized to Gapdh and relative to Ctns+/+ rats (black dotted line; n = 6 rats per group). (F and G) Biochemical
analysis of (F) blood urea nitrogen (BUN) levels and (G) the enzymatic creatinine levels measured from Ctns rat plasma samples at different ages (n = 10
rats per group). (H) Percentage survival of male and female Ctns rats over time (at day 0: n = 17 male Ctns+/+ , n = 19 male Ctns−/− , n = 19 female Ctns+/+
and n = 20 female Ctns−/− rats; at week 96: n = 7 male Ctns+/+ , n = 0 male Ctns−/− , n = 8 female Ctns+/+ and n = 0 female Ctns−/− rats). Proximal tubules
labeled by AQP1 (green) and nuclei counterstained with DAPI (gray) in (A and D). Scale bars: 20 μm in (A), 500 μm in (B) and 50 μm in (D). Plotted data
represent mean ± SEM. Two-tailed unpaired Student’s t-test, ∗ P < 0.05, ∗∗ P < 0.01, ∗∗∗ P < 0.001 and # P < 0.0001 relative to Ctns+/+ rats. ns: not significant,
G: glomerulus.

   The accumulation of enlarged lysosomal vesicles                                 receptor Sqstm1/p62 along with higher protein levels
was substantiated by the number of Lamp1-positive                                  of lipidated, autophagosome-associated form Lc3-II and
vesicles, with increasing size over time, in the PT cells                          Sqstm1/p62 confirmed marked alterations in autophagy
of Ctns−/− kidneys (Fig. 5B). As changes in lysosomal                              process in the Ctns−/− compared with the Ctns+/+ kidneys
dynamics could affect their proteolytic capacity, we                               (Fig. 5C and F). Collectively these data indicate that the
analyzed whether Ctns deletion impairs the lysosomal                               deletion of Ctns in rats leads to crystal formation in
cargo processing. Western blot analysis revealed a                                 multiple tissues due to cystine overload. These changes
defective proteolytic generation of the 32 kDa mature                              are associated with impaired lysosomal degradative
form of the lysosomal enzyme cathepsin D (CtsD)                                    capacity and accumulation of autophagic cargoes.
(Fig. 5C), paralleled by a dramatic reduction in lysosomal
processing as indicated by the persistent signal of Cy5-β-                         Defective endolysosomal function in primary
lactoglobulin in PT cells 90 minutes after injection in                            proximal tubule cells from Ctns−/− kidneys
Ctns−/− rats, compared with the complete processing                                The primary cultured PT cells obtained from mouse kid-
observed in Ctns+/+ PT cells (Fig. 5D and E). As lyso-                             neys (mPTCs) have been shown to keep their differen-
somal function is crucial for maintaining autophagy,                               tiation and polarized transport processes, representing
we analyzed autophagy markers in Ctns rat kidneys.                                 a reliable cell system to investigate endolysosomal dis-
Larger numbers of aggregates positive for the autophagy                            orders in particular (9,34–37). To further investigate the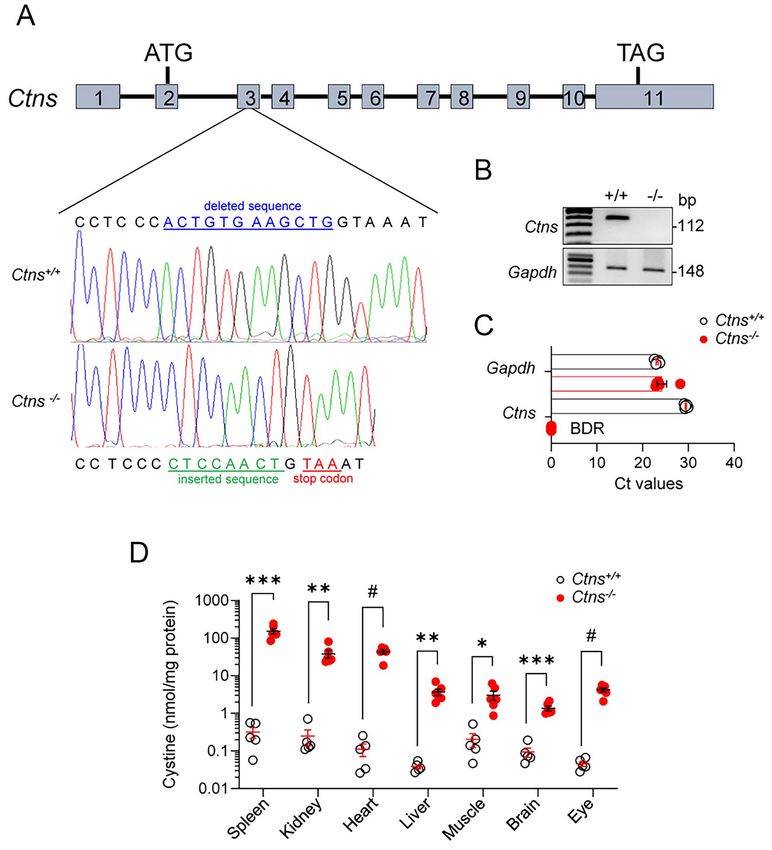
Human Molecular Genetics, 2022, Vol. 00, No. 00 | 7
Downloaded from https://academic.oup.com/hmg/advance-article/doi/10.1093/hmg/ddac033/6524058 by guest on 04 June 2022
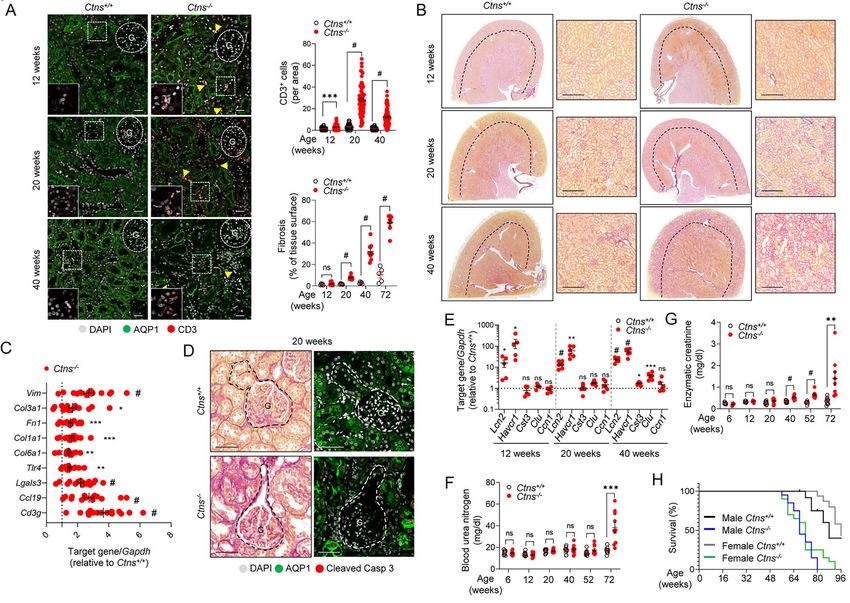
Figure 4. Defective receptor-mediated endocytosis and cell proliferation in Ctns−/− rats. (A) Workf low of the strategy used to investigate (1) receptor-
mediated endocytosis (β-lactoglobulin) and (2) f luid-phase endocytosis (dextran). After 20 min from tail vein injection with either Cy5-β-lactoglobulin
(0.4 mg kg−1 ) or Alexa 647-dextran (0.2 mg kg−1 ), kidneys were fixed, processed and analyzed by confocal microscopy. (B and C) Representative confocal
micrographs and quantification of the mean f luorescence intensity of (B) Cy5-β-lactoglobulin (n = 229 Ctns+/+ and n = 304 Ctns−/− tubules, pooled from
two rats per group) or (C) Alexa 647-dextran (n = 93 Ctns+/+ and n = 79 Ctns−/− tubules, pooled from two rats per group) in AQP1+ (green) proximal tubules
of Ctns rat kidneys. Insets: high magnification of Alexa 647 dextran+ or Cy5-labeled β-lactoglobulin+ structures in AQP1+ PTs. (D) Immunoblotting
and quantification of megalin protein levels in whole-kidney lysates from Ctns rats (n = 6 rats per group). β-Actin was used as a loading control. (E)
Representative confocal micrographs and quantifications of the mean f luorescence intensity of megalin (red) in AQP1+ (green) proximal tubules of Ctns
rat kidneys (n = 249 Ctns+/+ and n = 280 Ctns−/− tubules, pooled from four rats per group). Insets: high magnification of megalin+ structures in AQP1+
PTs. (F) RT-qPCR analysis of Cdk10, Ccna2, Ccnb2, Clcn5, Lrp2, Cubn, Slc5a2 and Slc34a1. Gene target expression normalized to Gapdh and relative to Ctns+/+
rats (black dotted line; n = 9 rats per group). (G) Representative confocal micrographs and quantification of the percentage of PCNA+ (red) nuclei in
AQP1+ (green) proximal tubules of Ctns rat kidneys (n = 150 tubules, pooled from 3 rats per group). Nuclei counterstained with DAPI (gray) in (B, C, E
and G). Scale bars: 40 μm in (B, C, E and G). Fluorescence intensity was normalized on tubule area in (B, C and E). Plotted data represent mean ± SEM.
Two-tailed unpaired Student’s t-test, ∗ P < 0.05, ∗∗ P < 0.01, ∗∗∗ P < 0.001 and #P < 0.0001 relative to Ctns+/+ rats. G: glomerulus.
mechanism of cystinosis in vitro, we established primary (Fig. 6D and E) and increased cystine content (Fig. 6F).
cultures of proximal tubule cells (rPTCs) derived from The accumulation of cystine in Ctns−/− rPTCs induced a
micro-dissected proximal tubules of Ctns rat kidneys phenotype switch similar to that observed in vivo, with
(Fig. 6A; Supplementary Material, Fig. S5A and B). The apical dedifferentiation leading to defective receptor-
rPTCs display high levels of PT (e.g. megalin and AQP1), mediated endocytosis (Fig. 6G and H), abnormal prolif-
endolysosome (e.g. Rab 5, Rab 7 Rab 11, Lamp1 and eration (Fig. 6I) and dramatic alterations in lysosomal
CtsD) and autophagy (e.g. Lc3 and p62) markers, with- homeostasis with increased Lamp1 and enlarged lyso-
out expressing markers of other kidney segments (e.g. somes (Fig. 6J and K). These changes led to impaired
Aqp2: collecting duct, Umod: thick ascending limb, Npsh2: lysosomal proteolytic activity, illustrated by the reduced
glomerulus) (Fig. 6B; Supplementary Material, Fig. S5C number of PepstatinA-positive lysosomes, a bona fide
and D). The rPTCs exhibit a high and saturable endocytic biosensor (11) that binds to the active site of CtsD in
capacity, which is reduced by Dynasore (40 μm for 1 h), acidic lysosomes (Fig. 6L).
an inhibitor of dynamin involved in membrane fusion We next verified whether the defective lysosomal
during endocytosis (Fig. 6C), and are polarized, as shown homeostasis had an impact on autophagy in Ctns−/− cells.
by the apical and basolateral expression of megalin and Autophagy was assessed by quantifying the conversion
Na+ , K+ -ATPase, respectively (Supplementary Material, of the non-lipidated form of Lc3-I to the lipidated,
Fig. S5E). autophagosome-associated form Lc3-II in rPTCs cultured
As a cystinosis disease model, the rPTCs from Ctns−/− in nutrient-rich media (hereafter referred to as ‘fed’) or
kidneys showed absence of Ctns mRNA expression in nutrient-deprived conditions (hereafter referred to as8 | Human Molecular Genetics, 2022, Vol. 00, No. 00
Downloaded from https://academic.oup.com/hmg/advance-article/doi/10.1093/hmg/ddac033/6524058 by guest on 04 June 2022
Figure 5. Cystine crystals and enlarged lysosomes in proximal tubules of cystinotic rats. (A) Representative electron micrographs of proximal tubules
derived from 20-week-old Ctns rat kidneys. Arrowheads indicate the presence of needle-shaped crystals in dense bodies in Ctns−/− samples. (B)
Representative confocal micrographs of Lamp1+ structures (red) in proximal tubules of 12- and 20-week-old Ctns rats. Quantification of the mean
f luorescent intensity of Lamp1 (top, each dot represents the mean f luorescent intensity per tubule, n = 90 tubules per condition pooled from three rats
per group) and total lysosomal area (bottom, each dot represents the average size of Lamp1+ vesicles in one tubule, n = 56 Ctns+/+ n = 60 Ctns−/− tubules
at 12 weeks, and n = 31 Ctns+/+ n = 38 Ctns−/− tubules at 20 weeks, pooled from three rats per group). Fluorescence intensity and lysosomal area were
normalized on tubule area. (C) Western blotting and densitometry analyses of lysosomal and autophagy protein levels in whole-kidney lysates from
Ctns rats (n = 4 rats per group). (D) Workf low of the strategy used to investigate lysosomal degradative capacity. After 90 min from tail vein injection of
Cy5-β-lactoglobulin (0.4 mg kg−1 ), the labeled protein is internalized and degraded by endolysosomes. The kidneys were then processed and analyzed by
confocal microscopy. (E and F) Representative confocal micrographs and quantifications of the mean f luorescence intensity of (E) Cy5-β-lactoglobulin
(red; n = 110 Ctns+/+ and n = 118 Ctns−/− tubules, pooled from two rats per group) or (F) p62 (red; n = 90 Ctns+/+ and n = 116 Ctns−/− tubules, pooled from
two rats per group) in AQP1+ (green) proximal tubules of Ctns rat kidneys. Fluorescence intensity was normalized on tubule area. Nuclei counterstained
with DAPI (gray or blue) in (B, E and F). Each dot represents f luorescence intensity in one tubule in (B, E and F) or one rat (C). β-actin or α-tubulin was
used as loading control. Scale bars: 2 μm in (A), 20 μm in (B), 50 μm in (E) and 40 μm in (F). Plotted data represent mean ± SEM. Two-tailed unpaired
Student’s t-test, ∗ P < 0.05, ∗∗ P < 0.01, ∗∗∗ P < 0.001 and #P < 0.0001 relative to Ctns+/+ rats. ns: not significant. G: glomerulus.
‘starved’). Compared with wild-type Ctns+/+ cells, Ctns−/− was investigated in the cornea, as cystine overload
cells showed higher levels of Lc3-II, which did not further was detected in the eyes of Ctns−/− rats (Fig. 1D). At
increase under starved conditions. Treatment with 12 weeks of age, Ctns+/+ and Ctns−/− animals were
Bafilomycin A1 (BafA1) blocks lysosome acidification indistinguishable from each other (Fig. 7A). At 24 weeks,
and thus increases accumulation of autophagic cargo in white, hyper-reflective and needle-shaped deposits were
Ctns+/+ cells. However, no further increase of the already detectable in the eyes of Ctns−/− rats by optical coherence
elevated levels of Lc3-II in nutrient-deprived Ctns−/− cells tomography (OCT). In 40-week-old animals, crystals
was detected (Fig. 6M). These results demonstrate that became larger and more abundant. Slit-lamp imaging
the deletion of cystinosin alters lysosomal dynamics and revealed a broad distribution of crystals in the corneas
autophagy in rPT cells. These data establish rPTCs as a of both eyes of the examined animals (Fig. 7A and B), and
well-differentiated primary cell culture system matching EM confirmed the deposition of crystals in the corneal
key features of nephropathic cystinosis. endothelium of Ctns−/− rats (Fig. 7C). Slit-lamp imaging
also revealed the presence of corneal dellen in both
Ocular manifestations, bone and liver defects in Ctns+/+ and Ctns−/− rats (Fig. 7B).
the Ctns−/− rat model High levels of cystine (Fig. 1D) and cystine crystals
We finally examined whether Ctns−/− rats presented (Supplementary Material, Fig. S4B) were detected in the
extra-renal manifestations, as frequently observed in liver of Ctns−/− rats at 20 weeks. Analysis of hepatotoxic-
patients with cystinosis. Potential crystal formation ity markers including aspartate-aminotransferase (AST),Human Molecular Genetics, 2022, Vol. 00, No. 00 | 9
Downloaded from https://academic.oup.com/hmg/advance-article/doi/10.1093/hmg/ddac033/6524058 by guest on 04 June 2022
Figure 6. Proximal tubule cells derived from Ctns−/− rat kidneys recapitulate key features of cystinosis. (A) Workf low of the strategy used to develop
primary proximal tubule cells derived from Ctns rat kidneys (rPTCs). (B) Immunoblotting of proximal tubule and lysosomal markers in rPTCs. (C)
Ctns+/+ rPTCs were loaded with Cy5-β-lactoglobulin (red; at the indicated concentration) for 20 min at 37◦ C or loaded with Cy5-β-lactoglobulin (red,
100 μg ml−1 ) in the presence or absence of Dynasore (40 μm) for 20 min at 37◦ C and analyzed by confocal microscopy. Quantification of the number of
Cy5-β-lactoglobulin+ structures (n = 163–193 cells pooled from two biologically independent experiments). Each dot represents the number of Cy5-β-
lactoglobulin+ structures in one cell. (D) mRNA levels of Ctns, Clcn5, Lrp2 and Cubn in rPTC analyzed by RT-qPCR. Gene target expression normalized to
Gapdh and relative to Ctns+/+ rPTC (black dotted line; n = 5 biologically independent experiments). (E) Ctns genomic DNA analyses by PCR and agarose
gel electrophoresis isolated from rPTCs. (F) Intracellular cystine levels were measured by HPLC (n = 7 biologically independent experiments per group).
(G) Ctns+/+ and Ctns−/− rPTCs were loaded with Cy5-β-lactoglobulin (red, 100 μg ml−1 ) for 20 min at 37◦ C and analyzed by confocal microscopy.
Quantification of the number of Cy5-β-lactoglobulin+ structures (n = 208 Ctns+/+ and n = 228 Ctns−/− cells pooled from three biologically independent
experiments). Each dot represents the number of Cy5-β-lactoglobulin+ structures in one cell. (H) Immunoblotting and quantification of megalin protein
levels in rPTC lysates (n = 5 independent experiments). (I) Cells were loaded with bromodeoxyuridine (BrdU; 1.5 μg ml−1 for 16 h at 37◦ C), analyzed by
confocal microscopy and quantified as percentage of BrdU+ cells per field (n = 77 Ctns+/+ and n = 79 Ctns−/− fields containing ∼30 cells, pooled from two
independent experiments). (J) Immunoblotting and quantification of Lamp1 protein levels in rPTC lysates (n = 4 independent experiments per group). (K)
High-magnification representative 3D surface renderings of Ctns rPTCs labeled with anti-Lamp1 (red) antibody and quantification of lysosomal vesicle
diameter (μm). Each dot represents the average size of Lamp1+ vesicles in one cell (n = 6 Ctns+/+ and n = 11 Ctns−/− fields). (L) Cells were loaded with
Bodipy-FL-PepA (1 μm, green) for 1 h at 37◦ C, fixed, immunostained with anti-Lamp1 antibody (red) and analyzed by confocal microscopy. Quantification
of PepA f luorescent signal as mean f luorescence intensity per cell (n = 84 Ctns+/+ and n = 88 Ctns−/− cells pooled from two independent experiments). (M)
Cells were cultured under normal and growth factors/nutrient-depleted conditions (Starved) in the presence or absence of 250 nm Bafilomycin (BafA1)
for 4 h. Immunoblotting and quantification of Lc3 protein levels in rPTC lysates (n = 3 independent experiments). One-way ANOVA followed by Dunnet’s
post hoc test, ∗∗ P < 0.01 relative to rPTCs treated with BafA1. β-Actin was used as loading control in (B, H, J and M). Nuclei counterstained with DAPI
(blue) in (C, G, I, K and L). Scale bars: 20 μm in (C, G, I and L) and 7 μm in (K). Plotted data represent mean ± SEM. Two-tailed unpaired Student’s t-test.
∗ P < 0.05, ∗∗ P < 0.01, ∗∗∗ P < 0.001, and #P < 0.0001 relative to Ctns+/+ rPTCs. ns: not significant.
alanine-aminotransferase (ALT), alkaline phosphatase were significantly decreased in Ctns−/− rats, likely
(ALP) and gamma-glutamyl transferase (GGT) revealed a reflecting PT dysfunction (Fig. 7D and Supplementary
significant increase of both ALT and GGT in the plasma Material, Table S3). At 36 weeks, increased FGF23 levels
of 20 weeks in Ctns−/− rats (Supplementary Material, were observed in male Ctns−/− rats, in line with defective
Fig. S6 and Table S2), supporting the development of liver phosphate homeostasis. The levels of tartrate-resistant
damage. acid phosphatase (TRAcP 5b, an osteoclast marker) and
Cystinosin deficiency was also ref lected on the bone C-terminal telopeptide of type I collagen (CTX I, a bone
physiology of Ctns−/− rats. The levels of parathyroid hor- resorption marker) were increased in Ctns−/− rats (Fig. 7D
mone (PTH) and fibroblast growth factor 23 (FGF23) were and Supplementary Material, Table S3), indicating
similar between Ctns+/+ and Ctns−/− rats at 24 weeks, the development of osteoporosis. No differences were
while 1,25-dihydroxyvitamin D (1,25(OH)2 Vit D3) levels observed in the level of the bone formation marker10 | Human Molecular Genetics, 2022, Vol. 00, No. 00
Downloaded from https://academic.oup.com/hmg/advance-article/doi/10.1093/hmg/ddac033/6524058 by guest on 04 June 2022
Figure 7. Ctns deletion causes corneal crystal formation and bone defects Ctns−/− rats. (A) Anterior eye OCT imaging of Ctns rat eyes at 12, 24 and
40 weeks of age. Insets: high magnification of indicated areas (yellow arrows: crystals). (B) Slit-lamp photography of Ctns rat eyes at 12, 24 and 40 weeks
of age. (C) Representative electron micrographs of 20-week-old Ctns rat eyes (yellow arrows: crystals). (D) Parathyroid hormone (PTH), fibroblast growth
factor 23 (FGF23), 1-a hydroxylation of vitamin D3 (1,25(OH)2 Vit D3), tartrate-resistant acid phosphatase (TRAcP 5b), C-terminal telopeptide of type I
collagen (CTX I) and N-terminal propeptide of type I procollagen (P1NP) levels in plasma from 24- and 36-week-old Ctns rats. (E) Representative microCT
images of femurs derived from Ctns rats at 56 weeks of age. Plotted data represent mean ± SEM. Scale bars: 200 μm in (A), 2 μm in (C). Two-tailed unpaired
Student’s t-test. ∗ P < 0.05, and ∗∗ P < 0.01, relative to Ctns+/+ rPTCs. ns: not significant.
N-terminal propeptide of type I procollagen (P1NP). cystine is causing a switch of the phenotype of proximal
Micro-computed tomography (Micro-CT) performed on tubule cells, with increased proliferation and loss of
56-week-old animals showed a significant decrease in apical receptors and transporters, driving the urinary loss
bone volume/total volume, cortical bone area, trabecular of LMW proteins and solutes. The cystine storage triggers
number and an increase in trabecular separation in severe alterations in lysosomal homeostasis, with
Ctns−/− rats (Fig. 7E; Supplementary Material, Table S4). defective proteolysis and accumulation of autophagic
Together, these modifications suggest the development cargos in the cells.
of eye and liver defects, and inadequate bone mineraliza- The Ctns−/− rat model recapitulates the early kidney
tion and rickets in Ctns−/− rats, similar to patients with tubular and structural defects, leading to generalized PT
cystinosis. dysfunction and kidney failure, similar to patients with
nephropathic cystinosis (3). These key features are not
observed in the LEA/Tohm rat carrying a spontaneous
Discussion 13 bp-deletion in the Ctns gene with moderate accumu-
Animal models are crucial to gain mechanistic insights lation of cystine in some tissues (23). These rats show
and to accelerate drug development in rare genetic disor- isolated glycosuria (hence named Ctnsugl ), with no other
ders. Triggered by the shortcomings of the mouse model manifestation of PT dysfunction, no kidney failure, no
of cystinosis, we describe the first Ctns-deficient rat growth defect and no other complications observed in
generated by CRISPR/Cas9. The Ctns−/− rat model shows cystinosis (23). The discrepancy between both models is
a major accumulation of cystine in all tissues, causing presumably due to the use of CRISPR/Cas9, permitting
typical kidney damage and multisystem complications specific and efficient disruption of Ctns in our model,
encountered in patients with cystinosis. The Ctns−/− rats compared with the spontaneous mutation in the Ctnsugl
show a progressive, generalized dysfunction of the prox- line. The distinct backgrounds of the rats—pure Sprague–
imal tubule, complicated by kidney failure and a shorter Dawley versus LEA/Tohm backcrossed to the inbred F344
life expectancy. Mechanistically, the accumulation of strain—may also play a role, as suggested by the strongHuman Molecular Genetics, 2022, Vol. 00, No. 00 | 11
effect of the mouse background documented for the Ctns order to validate this approach and substantiate disease
mouse model (10). mechanisms, we established a primary culture system
The PT dysfunction observed in the Ctns−/− rat of PT cells derived from Ctns rat kidneys. These rPTCs
associates defective receptor-mediated endocytosis, as show a polarized expression of essential markers such
observed in other endolysosomal disorders (1), and as megalin and cubilin and a high receptor-mediated
impaired f luid-phase endocytosis. These modifications endocytic capacity. The rPTCs derived from Ctns−/−
reflect the abnormal expression and/or recycling of kidneys showed critical aspects of the disease, including
the multi-ligand receptor megalin and the severity of accumulation of cystine, impaired endocytosis, loss of
epithelial dysfunction in PT cells of the Ctns−/− rat. differentiation and increased proliferation, and impaired
It should be noted that a compromised f luid-phase lysosomal homeostasis leading to altered autophagy
Downloaded from https://academic.oup.com/hmg/advance-article/doi/10.1093/hmg/ddac033/6524058 by guest on 04 June 2022
endocytosis has been observed in a mouse model for degradation. The use of the fluorescent biosensor PepA,
Dent disease 1 exhibiting strong PT dysfunction (36), which binds to the active site of CtsD in acidic lysosomes,
in a fish model for Dent disease 2 (38) and in a lrp2 revealed a significantly decreased fluorescent signal in
(megalin)-deficient zebrafish model (39,40). These data Ctns−/− rPTCs compared with Ctns+/+ cells, substantiat-
demonstrate the severity of PT dysfunction in Ctns−/− ing the impaired lysosomal degradative capacity due to
rats, starting at 6 weeks of age, in contrast to the Ctns−/− defective maturation of cathepsins (46). These findings
mice showing a later onset and only mild/incomplete are in line with previous observations obtained in mPTCs
Fanconi syndrome. Further comparative studies will (9,39), validating the rPTCs as a cellular disease model for
need to decipher the molecular mechanisms and cellular cystinosis.
pathways involved in these inter-species differences in Due to continuous exposure to cystine storage,
PT dysfunction. patients with cystinosis develop systemic manifestations
The fundamental trigger of cystinosis is the accumu- later in life. By the age of 10 years, half of the patients
lation of cystine causing a lysosomal storage disease develop extra-renal manifestations including reduced
(41). Cystine crystals were observed in Ctns−/− rats at vision, liver dysfunction and impaired growth and
12 weeks, earlier than the reported 24 weeks in Ctns−/− rickets (47,48). The appearance of crystals in the corneas
mice (14). The difference could be linked to cysteine of Ctns−/− rats, increasing with age, correlates with
levels between rats and mice, as crystals appear when the corneal manifestations observed in patients that
the concentration of cystine exceeds 5 mm (42). In cause photophobia and vision deterioration. The Ctns−/−
fact, Ctns−/− rats exhibited a higher cystine concen- rats also showed an accumulation of cystine in the
tration in kidney (∼40 nmol mg−1 protein, 20 weeks) liver, leading to the formation of crystals and elevated
compared with Ctns−/− mice (∼15 nmol mg−1 protein, markers of liver dysfunction. They also presented
24 weeks) (11). alterations of the cortical and trabecular structures
Profound alterations in lysosomal dynamics, including in long bones. These alterations may reflect the loss
accumulation of enlarged Lamp1-positive vesicles and of phosphate and calcium due to PT dysfunction and
large and amorphous vacuoles filled with crystals, were reduced activation of vitamin D, reflecting the situation
observed in the PT cells of Ctns−/− kidneys. These changes observed in patients (49). A contribution of reduced bone
are ref lected by alterations in the lysosomal cargo pro- remodeling activity, which may be due to a defect in
cessing and proteolytic activity, and accumulation of osteoblasts and osteoclasts, may also contribute to the
autophagic cargo. Accumulation of p62 and Lc3-II, two phenotype (50).
autophagy markers that are normally degraded in lyso- The availability of a faithful rat model, with inherent
somes, suggests an impairment of the autophagy flux, advantages for genetic conservation, pharmacology and
in line with previous studies on kidneys and primary PT toxicology, and relevance for metabolism and kidney
cells derived from Ctns−/− mice (11,12). The conjunction pathophysiology (51), is an important step for transla-
of lysosomal dysfunction, defective autophagy and loss tional research in cystinosis. The Ctns−/− rats develop a
of differentiation contrasting with increased markers of set of kidney and extra-renal manifestations that reca-
proliferation in the Ctns−/− rats substantiates the concept pitulate the human disease in terms of timing, severity,
of the lysosome being at the crossroad of regulating and histopathological changes. These changes reflect the
cellular proliferation and differentiation (11,43). At the lysosome disease at the cellular level, with defective
cellular level, the association of abnormal proliferation autophagy and homeostatic processes that could offer
and dedifferentiation is causing defects in the apical therapeutic targets (8,9,11). Studies taking advantage of
transport systems that operate in PT cells, explaining the the rat model, combined with other model organisms,
renal Fanconi syndrome (11). will further decipher these mechanistic links and accel-
The limitations of immortalized cell culture systems erate the translation of novel therapeutic strategies for
to investigate highly differentiated epithelial cells have cystinosis patients.
been emphasized (11,34,44). Primary culture systems of In summary, this novel Ctns−/− rat model of cystinosis
PT cells derived from mouse kidneys (mPTC) have been recapitulates essential clinical and molecular features of
crucial to decipher mechanisms underlying endolyso- cystinosis, including the role of defective endolysosomal
somal disorders affecting the kidney (11,34,37,45). In dynamics and autophagy. This rat model and the derived12 | Human Molecular Genetics, 2022, Vol. 00, No. 00
cell culture system represent powerful tools to accelerate Kidney function parameters
translational research in cystinosis. Rats were placed for 16 h in metabolic cages with ad libi-
tum access to food and drinking water. The body weight,
water intake and urinary volume were measured, and
Materials and Methods urine was collected over ice. Urine and blood parameters
Generation and maintenance of the Ctns rat were measured by using a UniCel DxC 800 Pro Synchron
model (Beckman Coulter, Fullerton, CA, USA). The concentra-
The CRISPR/Cas9 system was used to delete the Ctns gene tion of the LMW Clara cell protein (CC16) in urine was
in Sprague–Dawley rats (PolyGene AG, Zurich, Switzer- measured in duplicate by enzyme-linked immunosor-
bent assay (ELISA; abx155347, ABEXA, Cambridge, UK).
Downloaded from https://academic.oup.com/hmg/advance-article/doi/10.1093/hmg/ddac033/6524058 by guest on 04 June 2022
land). Two single-guide RNAs (sgRNAs) targeting exon 3 of
Ctns were selected: CRISPR1a: ACCAACGTCAGCATTAC- Albuminuria was measured via Coomassie Blue stain-
CCT(TGG), CRISPR1b:CCATTTACCAGCTTCACAGT(GGG). ing by using ProtoBlue Safe (EC-722, National Diagnos-
Before injection, the sgRNA sequences were blasted tics, Atlanta, GA, USA) according to the manufacturer’s
against the rat genome for off-targets. A total of 146 instructions.
rat embryos were injected with the combination of
CRISPRs 1a/b. From these embryos, 90 survived and
Cystine measurement
could be transferred into foster rats. A total of 34
pups were born from these injections, which were Tissue samples from rats or primary cultured cells were
analyzed for changes in the Ctns locus. PCR was used homogenized and lysed with N-ethylmaleimide (NEM)
to amplify the Ctns region surrounding the CRISPR- solution containing 5.2 mmol l−1 N-ethylmaleimide in
target site using the following primer combination: 10 mmol l−1 potassium phosphate buffer adjusted to
CTNS_R: 5 -ACACCCGAAGTACATGCAGA-3 , CTNS_L:5 - pH 7.4. The lysates were collected and precipitated with
ACAGAGATGGG AAGAGCACA-3 . The resulting PCR sulfosalicylic acid (12% w/v) and centrifuged at 10 000
product was digested by T7 endonuclease. Five animals r.p.m. for 10 min at 4◦ C. The resulting supernatant
showed a positive signal indicating insertion or deletion was dissolved in citrate loading buffer (Biochrom Ltd,
in the Ctns locus. These changes were analyzed via PCR Cambridge, UK) and 50 μl of this solution was analyzed
and sequencing. The following primer combinations by Biochrom 30 Plus Amino Acid Analyzer (Biochrom
were used 5 -AGGCACGATGGAGCAGTAAAG-3 and 5 - Ltd). The protein pellet was dissolved in 0.1 mol l−1 NaOH
ATGCACGAATGAGACCAGACC-3 . A Ctns rat line harbor- solution and the protein concentration was determined
ing a deletion of 12 bp and insertion of 8 bp resulting in by the Biuret method. The concentration of amino acids
a premature stop codon in the exon 3 of Ctns gene was was measured by using a lithium high-performance
selected (Fig. 1). Potential off-target sites were identified physiological column (Biochrom Ltd) followed by post-
using an in silico tool, Cas-OFFinder (31). column derivatization with ninhydrin. The amino acids
All experiments were performed on male and female were identified according to the retention time and the
animals, unless specified, and were conducted on age- ratio of the area between the two wavelengths (570 and
and gender-matched Ctns−/− and Ctns+/+ rat littermates. 440 nm) and quantified by using EZChrom Elite software
Rats were maintained under temperature- and humidity- (Agilent Technologies Inc., Pleasanton, CA, USA). Cystine
controlled conditions with 12 h light/12 h dark cycle with concentration was normalized to protein concentration
free access to appropriate standard diet in accordance and reported in nmol per mg protein (11).
with the institutional guidelines of National Institutes of
Health Guide for the Care and Use of Laboratory Animals.
Kidney sample processing
Kidney and other tissues were collected for analyses at
Rats were anesthetized in accordance with the insti-
the time of sacrifice. The experimental protocols were
tutional guidelines of National Institutes of Health
approved by the appropriate licensing committee (Kan-
Guide for the Care and Use of Laboratory Animals,
ton Zürich Gesundheitsdirektion Veterinäramt; protocol
by intraperitoneal injection with a combination of
ZH0230/2019) at the University of Zurich.
ketamine (100 mg ml−1 ; Streuli Pharma AG, Uznach,
Switzerland) and xylazine (20 mg ml−1 ; Streuli Pharma
Genotyping AG). At time of sampling, one kidney was clamped, split
Genomic DNA was isolated from ear punch biopsies of transversally and one half was flash frozen in liquid
Ctns rats by using E.Z.N.A Forensic DNA Kit (OMEGA nitrogen, homogenized by Dounce homogenizer in 1 ml
bio-tek, Norcross, UK) according to the manufacturer’s of RIPA buffer that contained phosphatase and protease
instructions. The Ctns genotyping was performed using inhibitors and processed for western blot analysis. The
the primers 5 -GGACCCATTCACTGTCCATC-3 (forward) other half was flash frozen in liquid nitrogen and used for
and 5 -GACATGTGGGACCCTTTGAT-3 (reverse). The RT-qPCR analysis. The contralateral kidney was perfused
nucleotide deletion/insertion change was confirmed by with PBS, followed by 50–60 ml 4% PFA solution in PBS
Sanger sequencing, using an Applied Biosystems 3730 (158127, Sigma-Aldrich, St.-Louis, MO, USA). The kidney
DNA Analyzer (Applied Biosystems, Foster City, CA, USA). was then fixed and processed for immunostaining.You can also read